")
Back to Journals » Diabetes, Metabolic Syndrome and Obesity » Volume 13
Standard Puerarin Prevents Diabetic Renal Damage by Inhibiting miRNA-140-5p Expression
Authors Xu Y, Xiong Y, Xu C, Xu C
Received 28 July 2020
Accepted for publication 29 August 2020
Published 23 October 2020 Volume 2020:13 Pages 3947—3958
DOI https://doi.org/10.2147/DMSO.S273952
Checked for plagiarism Yes
Review by Single anonymous peer review
Peer reviewer comments 2
Editor who approved publication: Prof. Dr. Juei-Tang Cheng
Yanmei Xu, Yan Xiong, Chen Xu, Chuanwen Xu
Department of Nephrology, Wuhan Fourth Hospital, Puai Hospital, Tongji Medical College, Huazhong University of Science and Technology, Wuhan City, Hubei Province 430033, People’s Republic of China
Correspondence: Chuanwen Xu
Department of Nephrology, Wuhan Fourth Hospital, Puai Hospital, Tongji Medical College, Huazhong University of Science and Technology, No. 473 Hanzheng Street, Qiaokou District, Wuhan City, Hubei Province 430033, People’s Republic of China
Tel +86-18607171819
Email [email protected]
Aim: This study was designed to use in vivo and in vitro approaches to evaluate puerarin in diabetes-induced renal injury.
Materials and Methods: SD rats were divided into NC (normal control), Model (diabetic induced renal injury model), SP-L (model rats treated with low-dose standard puerarin), SP-M (model rats treated with middle-dose standard puerarin), and SP-H (model rats treated with high-dose standard puerarin) groups. We evaluated fasting blood-glucose (FBG), urinary albumin/creatinine ratio (UACR), body weight, and kidney index (KI) in the different groups. TNF-α, IL-1β, and IL-6 concentrations were measured using Elisa assays. HE staining and TUNEL assays were used to evaluate pathology and apoptosis in kidney tissues, respectively. Relative gene and protein expression was measured using RT-qPCR and Western blot assays. Apoptosis was measured using flow cytometry. The correlation between miRNA-145-5p and TLR4 was assessed using dual-luciferase reporter gene assays.
Results: The pathology and apoptosis cell number were deteriorate in Model group; TNF-α, IL-1β and IL-6 concentrations, FGB, UACR and KI were increased and body weight was depressed; meanwhile, relative gene and proteins expressions (miRNA-145-5p, TLR4, MyD88 and NF-κB p65) were significantly different in Model group in vivo and vitro study compared with NC group. SP treatment significantly improved the pathology and apoptosis levels in the tissues, as well as TNF-α, IL-1β and IL-6 concentrations, FGB, UACR, body weight, and KI. In vitro cell studies revealed that SP could prevent renal injury induced by diabetes through the miRNA-145-5p/TLR4 axis.
Conclusion: SP prevents diabetes-induced renal damage via miRNA-145-5p overexpression and reduces TLR4/MyD88/NF-κB (p65) pathway activation in vitro and in vivo.
Keywords: SP, renal injury, apoptosis, miRNA-145-5p, TLR4/MyD88/NF-κB (p65)
Introduction
Diabetic nephropathy (DN) is a microvascular complication in patients with diabetes and the most common cause of end-stage renal disease (ESRD) in developed countries. DN morbidity and mortality have also sharply increased in developing countries.1,2 Pathological changes related to DN include glomerular and tubular hypertrophy, basement membrane thickening, and mesangial proliferation, which finally lead to glomerular sclerosis and renal tubule interstitial fibrosis.3 Although measures such as strict blood sugar and pressure control and the use of renin-angiotensin system blockers have yielded certain therapeutic effects on DN, they still cannot inhibit DN progress. An increasing number of studies reveal that chronic low-grade inflammation and fibrosis play a vital role in DN occurrence and progression, and are common pathways through which DN develops in ESRD.4 Macrophage infiltration, activation of cell adhesion molecules, and inflammatory cytokine levels increase significantly in kidneys of patients with DN.5,6 Therefore, studies focusing on anti-inflammatory mechanisms have provided novel therapeutic strategies for the treatment of DN.
miRNAs are non-coding microRNAs that can reduce the expression of target genes and cause abnormal cell proliferation, apoptosis, and differentiation in mammals.7 Accordingly, miRNAs are significant for disease diagnosis and treatment.8–10 As a primary active ingredient in the root of the kudzu vine, standard puerarin (SP) can inhibit inflammation and is widely used in clinical practice to treat fever, headache, and thirst.11 Recent studies indicate that SP can reduce β-cell apoptosis in a mouse model of Type II diabetes,12 and prevent cadmium-induced hepatocellular damage by inhibiting apoptosis.13 Furthermore, SP can prevent the apoptosis-inducing factor from translocating to the nucleolus to generate oxidative stress, thereby reducing apoptosis.14 The roles of SP in preventing diabetic renal damage and the mechanism of miRNA-140-5p action are not fully elucidated. This study was designed to investigate the effect of SP on diabetic renal damage and explore the mechanism of miRNA-140-5p action to provide fundamental data for clinical application of SP in DN treatment.
Materials and Methods
Materials
Healthy male specific pathogen free SD rats (n = 45; 8 weeks old; 180–220 g in weight) were purchased from Shanghai Sibyl Bike Experimental Animal Co., Ltd. SP (China) and streptozotocin (STZ) were purchased from Sigma (USA). Tumor necrosis factor-α (TNF-α), interleukin-1β (IL-1β), and IL-6 Elisa kits were purchased from Bender MedSystems GmbH (Austria). Human kidney proximal tubular epithelial cells (HK-2 cells) were purchased from the American Type Culture Center (ATCC), and DMEM F-12 medium, fetal bovine serum (FBS), and trypsin solution were purchased from Hyclone (USA). Trizol reagent, cDNA reverse transcription reagent kit, SYBR GreenPCR fluorochrome were bought from Invitrogen (USA). TLR4, miRNA-140-5p, MyD88, and NF-κB (p65) primer sequences were designed by Nanjing Keygen Biological Co., Ltd. TLR4, MyD88, and NF-κB (p65) primary antibodies were purchased from Abcam (England) and goat anti-rabbit secondary antibody was purchased from Nanjing Univ-Bio Company. The Omron glucometer HEA-230 and HEA-STP30 glucose indicator paper were purchased from Omron Healthcare (China). The FA2004 electronic scale was purchased from Shanghai Shangping Instruments Co., Ltd, and the Olympus DX45 microscope and DP72 camera were purchased from Thermo Electron Corporation (USA). The DX45 was purchased from Olympus (Japan).
Rats Group15
This study and all experiments within were approved by the Ethics Committee of Wuhan Fourth Hospital. We followed the envir onment, housing, and management, veterinary care guidelines in accordance with the Guide for the Care and Use of Laboratory Animals (Eighth Edition, published by National Research Council of the National Academies Press). Rats were raised in a barrier system with 12 h alternate natural lighting at an ambient temperature of 21–27ºC and humidity of 40–70%. Food and water were supplied without limit, and padding was always kept dry. After being allowed to acclimate for 1 week, 45 SD rats were randomly divided into 5 groups (n = 9): the normal control group (NC), diabetic renal damage group (Model), low-dose SP treatment group (SP-L), moderate-dose SP treatment group (SP-M), and high-dose SP treatment group (SP-H). Rats were fasted for 12 h and after which their FBG was tested. Rats with FBG < 8.9 mmol/L were selected to create the model. STZ was used to create a DN rat model in Model, SP-L, SP-M, and SP-H groups. More specifically, 0.1 mol/L STZ solution was injected into the rats’ abdomen at a dose of 60 mg/kg. FBG was measured 72 h after the model was prepared. Modeling was successful when FBG ≥16.65 mmol/L. Rats in Model, SP-L, SP-M, and SP-H groups all met this requirement. Rats in the NC group were abdominally administered 0.1 mol/L citric acid buffer solution once (pH 4.5). After the model was established, was intra-gastrically administered to rats every 24 h: SP low-dose (20 mg/kg) in the SP-L group; moderate-dose SP (40 mg/kg) in SP-M group; and high-dose (80 mg/kg) to those in SP-H group. Model and NC groups were infused with equal volumes of normal saline (NS). After intra-gastric administration for 8 weeks, a metabolism cage was used to collect urine for 24 h. Rats were then fasted for collection of caudal venous and orbital blood, and then sacrificed. Kidneys from both sides were quickly removed from killed rats, rinsed with precooled NS to remove residual blood, and dried with filter paper for subsequent inspection.
Detection of FBG, Urinary Albumin Creatine Ratio (UACR), Body Mass, KI
Venous blood was gathered from the tail of rats for FBG detection. Rat urine was collected for 24 h using a metabolism cage to determine 24 h urinary albumin and creatine using biuret colorimetry. The UACR was calculated. The body mass of dead rats was determined by weighing. Bilateral kidneys excised from rats were weighed for computing KI as per the formula KI = weight of rat kidney/entire body mass.
Cell Culture
Cells were cultured in DMEM-F12 medium containing 10% FBS (volume fraction), 1×10,000 U/L penicillin, 10,000 mg/L streptomycin, and 20 mg/L amphotericin B for subculture within a humid incubator at 37ºC with 5% CO2 (volume fraction). When examined under an inverted microscope, HK-2 cells grew and blended to form a monolayer after approximately 3 d and presented the typical pattern of embedded paving stones.
Cell Grouping and Stimulation
HK-2 cells were cultured adherently in low-sugar DMEM medium containing 10% FBS (D glucose 5.6 mmol/L) at 37ºC and 5% CO2, digested with 0.25% trypsin. When reached 70–80% confluence, serum-free medium was used for 12 h synchronization. Afterwards, cells were randomly divided into five groups: NC group (D-glucose 5.6 mmol/L), Model group (D-glucose 30 mmol/L), si-NC group (transfection with si-negative control), SP group (administered 80 mg/LSP), SP +si-miRNA group.
Cell Transfection with siRNA
Cells were seeded into 12-well plates at 2×10⁵ cells per well, and cultured for 24 h in DMEM-F12 medium containing 10% FBS. Cells which were growing well and had adherence of 70–80% were chosen for transfection. Liposome-mediated transfection of miRNA-140-5p siRNA was performed using Lipofectamine 2000 as instructed in the manufacturer’s guidelines. The si-NC control group was also established. Cells were placed in an incubator for 6 h, and transferred into medium containing 30 mmol/L glucose for another 24 h culture.
Detection of TNF-α, IL-1β, and IL-6 Inflammatory Cytokines
Orbital blood was collected from rats to harvest protein supernatant. Serum and medium supernatant were separated by centrifugation at 3000 × g for 5 min. Supernatant was obtained and proteins of interest were detected with Elisa test kit strictly following the manufacturer’s instructions. OD values for the different groups were determined using a microplate reader at 450 nm wavelength to form a standard profile. TNF-α, L-1β and IL-6 concentrations were determined in all groups.
Pathomorphological Examination of Rat Renal Tissues in All Groups
HE staining was employed to examine tissue morphology. Tissues from the right kidney were collected and fixed with 10% formalin, dehydrated with graded ethanol, and embedded with paraffin to prepare 4–5 μm-thick continuous slices. Slices were microscopically examined after being HE staining.
TUNEL Assay
Slides were dewaxed and hydrated in 3% H2O2 and methanol at the ambient temperature for 30 min to block peroxidase, and were then washed by PBS. After the addition of 2 μg/mL proteinase K working solution, slides were incubated at 37ºC, returned to room temperature, and washed. Afterwards, 0.1% TritonX-100 and 1% sodium citrate solution were added and cultured at 37 °C for 4 h. Slides were returned to room temperature, washed, reaction mixture added, and the slides were incubated at 37ºC for 90 min, washed, and blocked with normal goat serum for 20 min at the ambient temperature. The serum was discarded and transforming POD (peroxidase coupled anti digoxin) solution was added before slides were incubated at 37ºC for 30 min, returned to room temperature, and washed. When positive cells were observed via a tanned nucleus under light microscopy, the reaction was terminated by rinsing.
Apoptosis Detection with Flow Cytometry
Cells in all groups were administered separately by difference methods as before and then washed with PBS 48 h later. Trypsin was added for digestion and centrifugation. Cells were washed twice with PBS twice. Binding buffer (250 μL) was added to each sample. After cell counting, the cell concentration was adjusted to 1.0×10⁶ cells/mL. Cell suspension (100 μL) was added into a cytometric tube and mixed with Annexin V-FITC (150 mg/L) and propidium iodide (120 mg/L). The mixture was incubated in the dark at the ambient temperature for 15 min. PBS was added to washing the cells. Apoptosis was detected using a Fluorescence Activated Cell Sorter.
RT-qPCR Assay
Collected tissues and cells were ground, and Trizol solution was for total RNA extraction following the manufacturer’s instructions. Reverse transcription was performed to form first strand cDNA. TLR4, MyD88, miRNA-140-5p, and NF-κB (p65) expression levels of detected using qRT-PCR following the kit directions. The primer sequences were synthesized by Shanghai Sangon Bioengineering Company Limited. Reaction conditions were as follows: 30 s pre-degeneration at 95ºC; 40 cycles of 95ºC for 5s, 60ºC for 20 s; and melting curve analysis at 95ºC for 1s, 65ºC for 15 s and 95ºC for 5 s. The sequences of primers used are shown in Table 1.
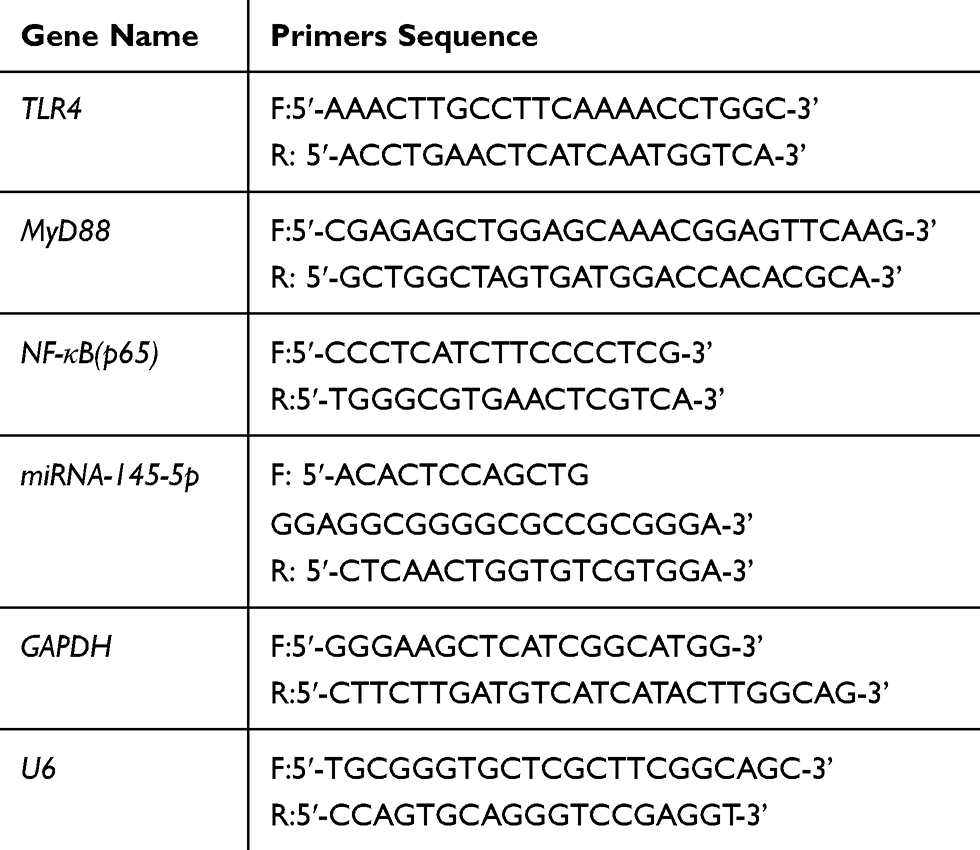 |
Table 1 The Sequences of Difference mRNA |
Western Blotting Assay
RIPA cytolysis buffer solution was added to renal tissues and cells to a form homogenate using an electrical grinder. After centrifugation, proteins were quantified using the BCA protein quantification kit. Proteins were separated by electrophoresis and transferred to a membrane overnight. Proteins were then incubated with TLR4, MyD88, and NF-κB (p65) antibodies overnight at 4ºC, and then with goat anti-rabbit antibody marked with peroxidase at the ambient temperature. After 2 h incubation at the ambient temperature, the membrane was reacted with enhanced chemiluminescence (ECL) and exposed to reveal protein bands of interest. OD values were analyzed using Image Tools with GAPDH as an internal reference.
Dual-Luciferase Reporter Gene Assay
The 3ʹUTR segment containing the TLR4 miRNA-140-5p binding site was inserted into the PGL3 luciferase reporter gene carrier to construct the 3ʹUTR luciferase reporter genes with wildtype TLR4 (TLR4-WT) and mutant TLR4 (TLR4-Mul). miRNA-140-5p mimics and miRNA-NC were transfected into HK-2 cells, and then cultured in a 5% CO2 incubator at 37ºC for 48 h. Cells were collected to determine the dual-luciferase activity. All operations were performed following the manufacturer’s instructions.
Cell Immunofluorescence
After cells in all groups were treated accordingly, target cells adhering to slides were stained with the mitochondrial dye, Mitotracker red CMXRos (25 nmol/L), for 2–3 min. Cells were washed with PBS, fixed with 4% paraformaldehyde, and their membranes were penetrated with 0.1% TritonX-100. Cells were washed with PBS, and blocked with FBS. Cells were washed again with PBS and the primary antibody, NF-κB (p65) (at 1:100 dilution), was added and incubated at the ambient temperature for 1 h. Cells were washed with PBS, and incubated with fluorescent secondary antibody marked with FITC (at 1:100 dilution) and incubated at 4°C for 1 h. Cells were washed with PBS and then incubated with DAPI solution (1:100) for 45 s. Slides were washed with PBS and blocked. Finally, NF-κB (p65) proteins in the nucleus were determined by confocal microscope.
Statistical Analysis
Data were analyzed using SPSS20.0 software. Dose data are expressed as mean ± standard deviation (Mean ± SD). One-way analysis of variance was used for intergroup comparisons and pairwise comparisons were tested using LSD (Least—SignificantDifference). Statistical significance was defined as P < 0.05.
Results
FBG, UACR, Body Mass, and KI Comparisons
Compared with the NC group, the Model group had significantly higher FBG, UACR, and KI levels (P < 0.05 for all) and lower body mass (P<0.05) (Table 2). Rats the SP-intervened groups have significantly reduced FBG, UACR, and KI levels (P < 0.05 for all) and increased body mass (P<0.05), compared with those in the Model group. Comparison of SP-intervened groups revealed a dose-effect relationship (P < 0.05, respectively).
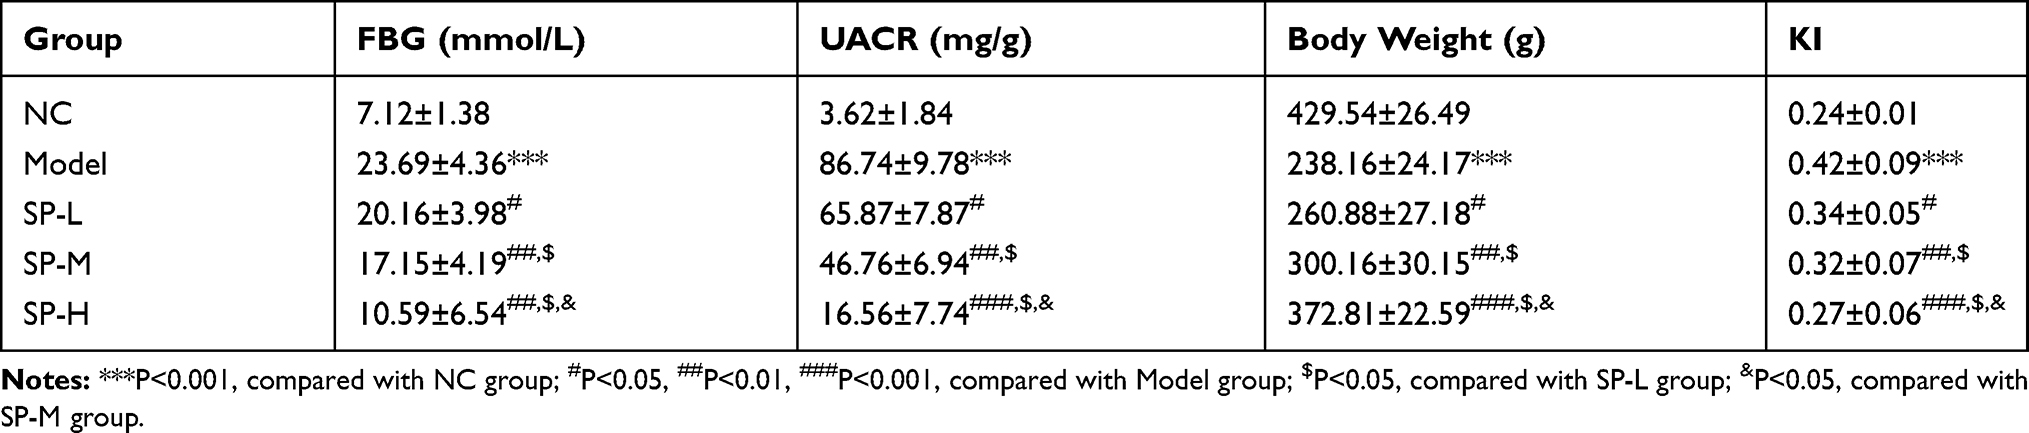 |
Table 2 FBG, UACR, Body Weight and KI in Difference Rats Groups (Mean±SD) |
Comparison of TNF-α, IL-1β, and IL-6 Concentrations in Rat Serum in Different Groups
Rats in the Model group had significantly higher TNF-α, IL-1β, and IL-6 concentrations in serum than did those in the NC group (P < 0.05 for each; Table 3). After SP administration, the concentrations of TNF-α, IL-1β, and IL-6 significantly decrease when compared with those observed in the model (P < 0.05 for each; Table 3). An obvious dose-effect relationship was observed in the SP-intervened groups (P < 0.05; Table 3).
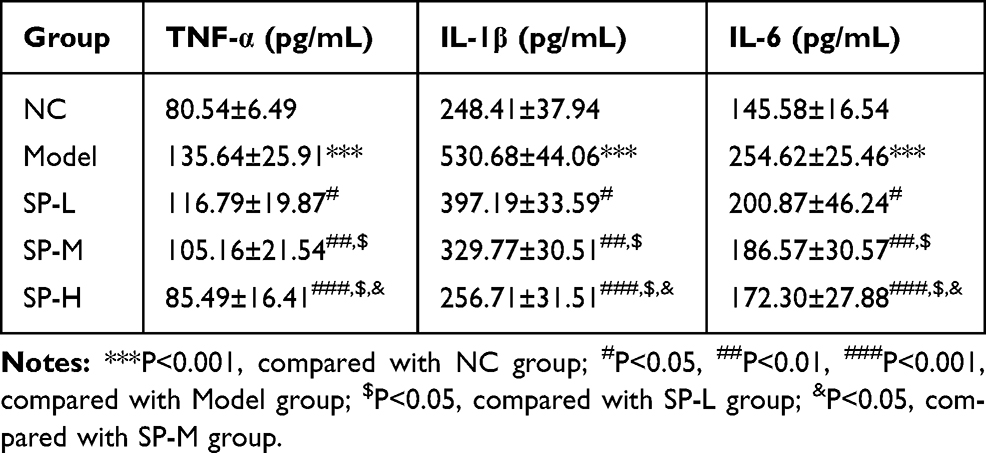 |
Table 3 TNF-α, IL-1β and IL-6 Concentrations in Serum of Difference Rats Groups (Mean±SD) |
Pathomorphological Changes in Renal Tissues
Rate in the NC group have morphologically normal glomeruli and renal tubules, largely unchanged volume and cell numbers in glomeruli, visible blood capillary lumen and saccular lumen, almost complete glomerulus mesangial matrix, no significant thickening in the basement membrane, no significant degeneration or necrosis in glomeruli epithelial cells, and no tube within the lumen. By contrast, in the Model group enlarged glomeruli, mildly or moderately enlarged lumens of some renal tubules, vacuolar degeneration of tubular epithelial cells, and visible infiltration of inflammatory cells was observed. Compared with the Model group, the pathological damage to renal tubules and glomeruli was reduced in the SP-intervened groups (see Figure 1A).
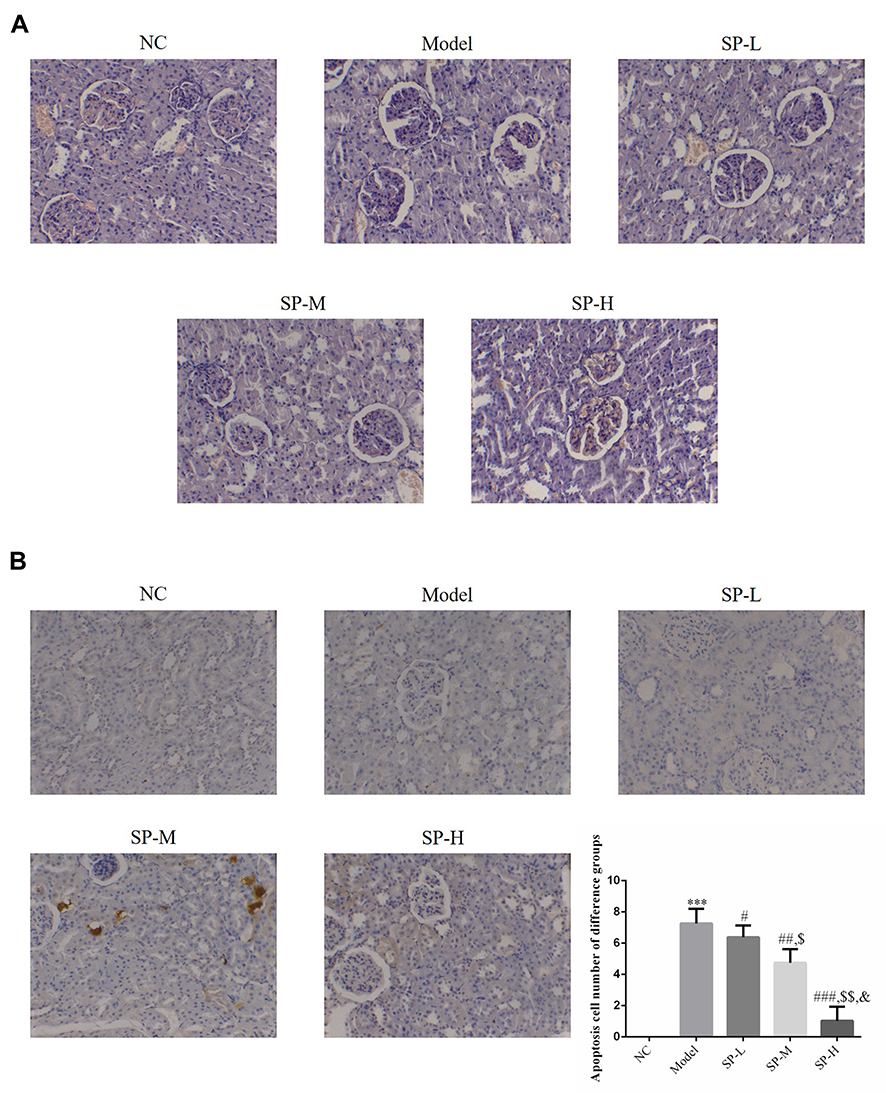 |
Figure 1 Pathology and apoptosis in kidney tissues. NC: The rats were treated with normal treatment; Model: diabetic model rats; SP-L: diabetic nephritis (DN) model rats treated with 20 mg/kg standard puerarin (SP); SP-M: DN model rats treated with 40 mg/kg SP; SP-H: DN model rats were treated with 80 mg/kg SP. (A) Pathology changes in different rat experimental groups revealed by HE staining (200 ×). (B) Apoptosis in different rat experimental groups revealed by TUNEL assay (200 ×). ***P < 0.001, compared with NC group; #P < 0.05, ##P < 0.01, ###P < 0.001, compared with Model group; $P < 0.05, $$P < 0.01, compared with SP-L group; &P < 0.05, compared with SP-M group. |
TUNEL Detection Results
No apoptosis was detected in the NC group. A significantly higher number of apoptotic cells were observed in the Model group compared with the NC group (P < 0.001; Figure 1B). The number of apoptotic cells was significantly reduced after SP was administered (P<0.0,). No significant difference was observed among the groups with SP-intervention (P < 0.05; Figure 1B).
Renal Tissue Expression of TLR4, MyD88, NF-κB (P65), and miRNA-140-5p
Rats in the Model group had significantly elevated levels of TLR4, MyD88, and NF-κB (p65) gene expression (P < 0.001, for each; Figure 2A) and reduced miRNA-140-5p expression (P < 0.001; Figure 2A) compared with those in the NC group. Administration of SP lowered the expression levels of TLR4, MyD88, and NF-κB (p65) genes (P < 0.05 for each; Figure 2A) but raised that of miRNA-140-5p (P < 0.05; Figure 2A). The differences observed between SP-intervened groups were statistically significant (P < 0.05; Figure 2A).
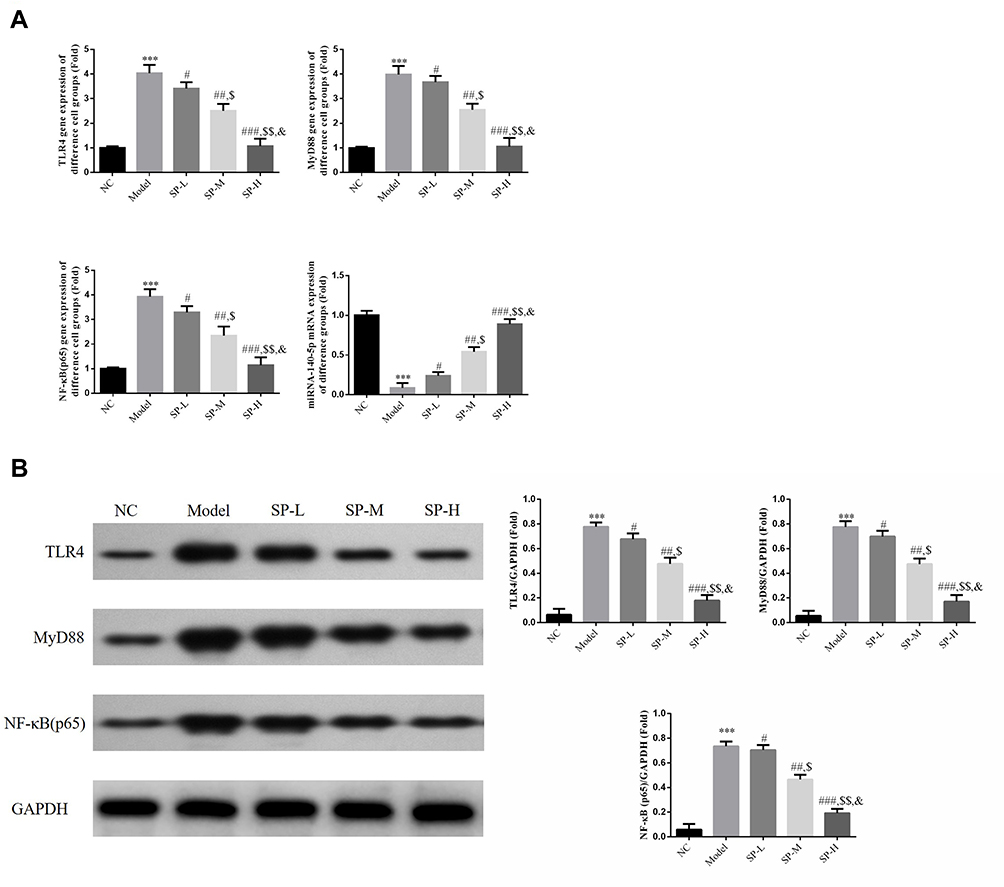 |
Figure 2 Relative gene and protein expressions in kidney tissues. (A) NC: The rats were treated with normal treatment; Model: diabetic model rats; SP-L: diabetic nephritis (DN) model rats treated with 20 mg/kg standard puerarin (SP); SP-M: DN model rats treated with 40 mg/kg SP; SP-H: DN model rats were treated with 80 mg/kg SP. ***P < 0.001, compared with NC group; #P < 0.05, ##P < 0.01, ###P < 0.001, compared with Model group; $P < 0.05, $$P < 0.01, compared with SP-L group; &P < 0.05, compared with SP-M group. (B) Relative gene expression in kidney tissues from different rat experimental groups revealed by RT-qPCR. ***: P < 0.001, compared with NC group; #P < 0.05, ##P < 0.01, ###P < 0.001, compared with Model group; $P < 0.05, $$P < 0.01, compared with SP-L group; &P < 0.05, compared with SP-M group. |
TLR4, MyD88 and NF-κB (P65) Protein Expressions in Renal Tissues
TLR4, MyD88, and NF-κB (p65) proteins were expressed at significantly higher levels in the Model group than they were in the NC group (P < 0.001 for each; Figure 2B). After SP administration, TLR4, MyD88, and NF-κB (p65) proteins expression levels dropped sharply (P < 0.05 for each; Figure 2B). The differences between SP-intervened groups were significant (P < 0.05 for each; Figure 2B).
Differential expression of related inflammatory factors in different cell groups
Compared with the NC group, the Model and si-NC groups had higher average concentrations of TNF-α, IL-1β, and IL-6 in medium supernatant (P < 0.05, for each; Table 4). After SP administration, TNF-α, IL-1β, and IL-6 concentrations decline remarkably in medium supernatant from SP group when compared with Model group. However, simultaneous SP administration and si-miRNA-140-5p transfection in HK-2 cells resulted in medium supernatant TNF-α, IL-1β, and IL-6 concentrations that were notably higher than those in the SP group (P < 0.05 for each: Table 4)
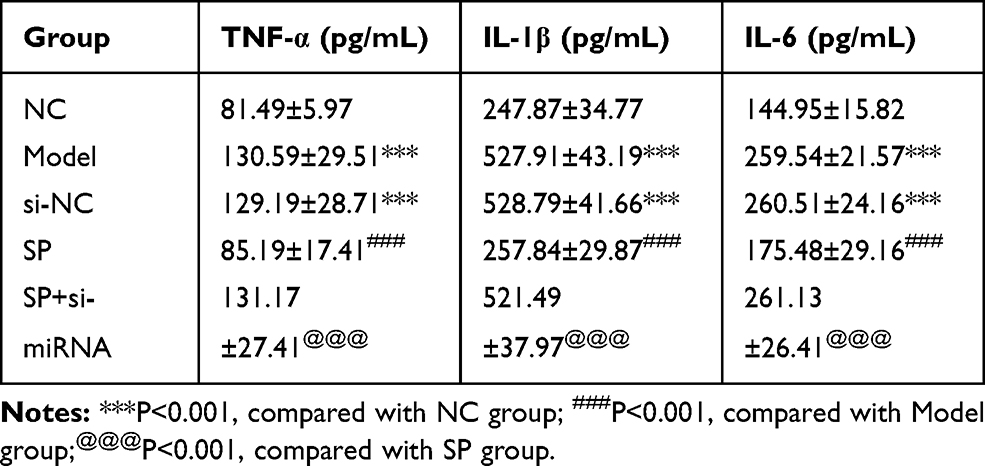 |
Table 4 TNF-α, IL-1β and IL-6 Concentrations in Difference Cell Groups (Mean±SD) |
Flow Cytometry Detection of HK-2 Cell Apoptosis
Flow cytometry detection of apoptotic cells revealed significantly high levels of apoptosis in the Model and si-NC groups (P < 0.001 for each; Figure 3). After administration of SP, apoptosis rate in the SP group was significantly lower than that observed in the Model group (P < 0.001; Figure 3). The SP+ si-miRNA group had a significantly higher apoptosis rate than did the SP group (P < 0.001; Figure 3). Taken together, these results indicate that the effect of SP on hyperglycemia-induced HK-2 cells may be associated with miRNA-140-5p upregulation.
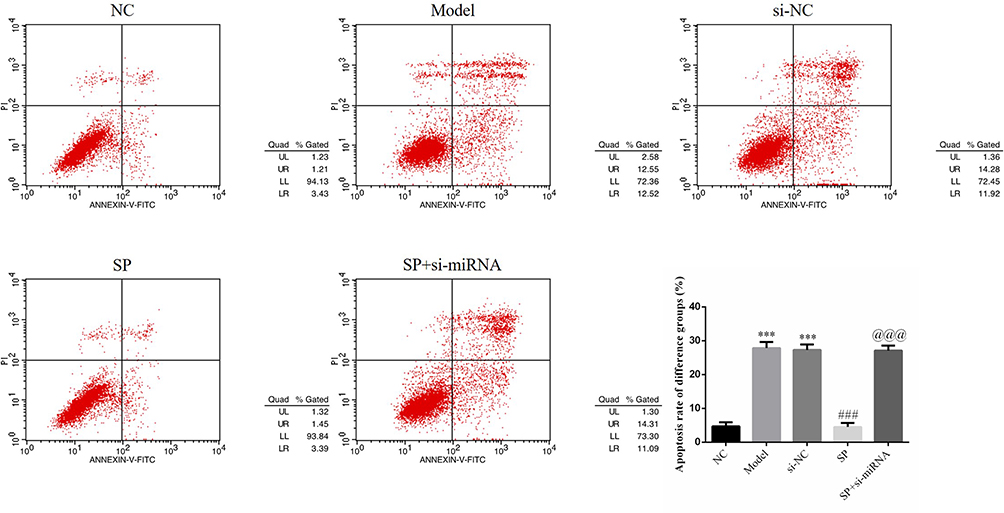 |
Figure 3 Apoptosis in different cell groups. NC: HK-2 cells were treated with normal; Model: HK-2 cells treated with high glucose; si-NC: HK-2 cells transfected with si-NC (negative control) and high glucose; standard puerarin (SP): HK-2 cells treated with high glucose and 80 mg/L SP; SP+si-miRNA: HK-2 cells transfected with si-miRNA-145-5p, high glucose, and 80 mg/L SP. ***P < 0.001, compared with NC group; ###P < 0.001, compared with Model group; @@@P < 0.001, compared with SP group. |
Related Gene Expression in Cells of Different Groups
RT-qPCR results show that TRL4, MyD88 and, NF-κB (p65) are more highly expressed and miRNA-140-5p expression is reduced in the Model and si-NC group compared with the NC group (P < 0.001 for each; Figure 4A). SP intervention resulted in a decline in TRL4, MyD88, and NF-κB (p65) expression levels and an increase in miRNA-140-5p levels when compared with that in the Model group (P < 0.001 for each; Figure 4A). However, in the SP+ si-miRNA group TRL4, MyD88, and NF-κB (p65) expression levels were elevated and miRNA-140-5p expression was reduced when compared with that in the SP group (P < 0.001 for each; Figure 4A).
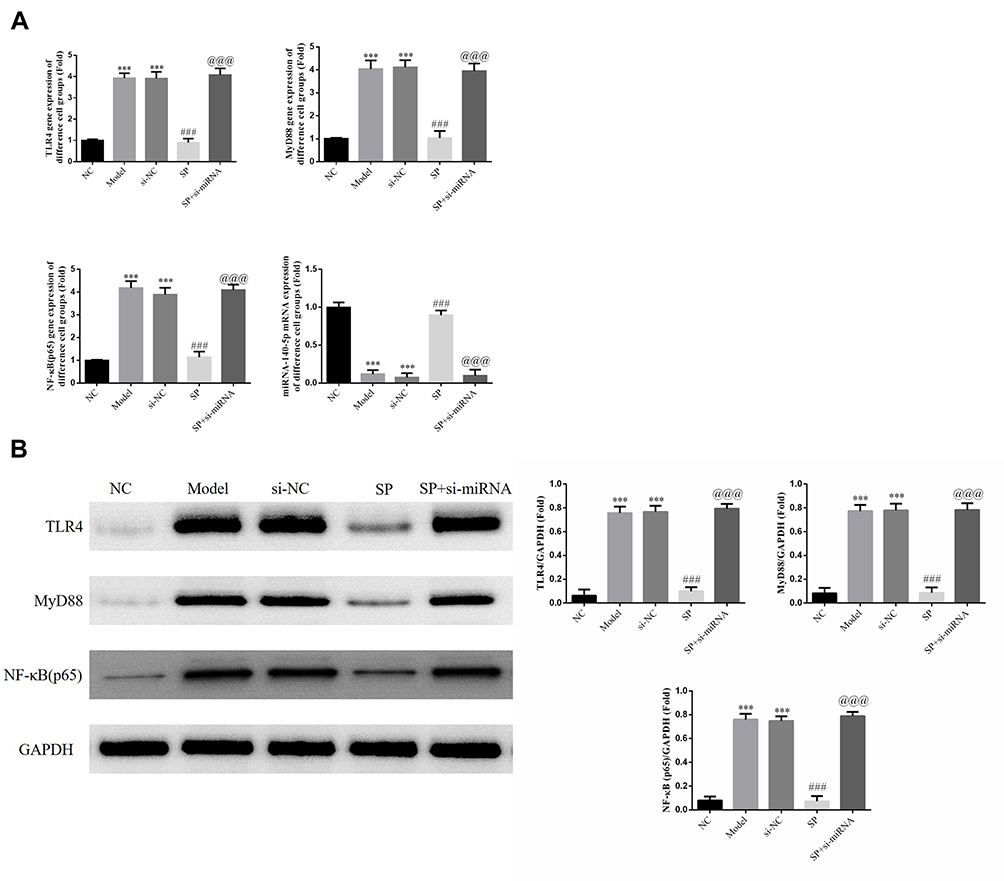 |
Figure 4 Relative gene and protein expressions in different cell groups. NC: HK-2 cells treated with normal; Model: HK-2 cells treated with high glucose; si-NC: HK-2 cells transfected with si-NC (negative control) and high glucose; standard puerarin (SP): HK-2 cells treated with high glucose and 80 mg/L SP; SP+si-miRNA: HK-2 cells transfected with si-miRNA-145-5p and treated with high glucose and 80 mg/L SP. (A) Relative gene expression measured RT-qPCR assay. ***P < 0.001, compared with NC group; ###P < 0.001, compared with Model group; @@@P < 0.001, compared with SP group. (B) Relative protein expression measured by Western blot. ***P < 0.001, compared with NC group; ###P < 0.001, compared with Model group; @@@P < 0.001, compared with SP group. |
Related Proteins Expressions in Cells of Different Groups
Western blotting was used to detect protein expression. Compared with the NC group, Model and si-NC groups had significantly higher TLR4, MyD88 and NF-κB (p65) protein expression (P < 0.001 for each; Figure 4B). After intervention with SP, TLR4, MyD88 and NF-κB (p65) expressions levels were much lower in the SP group than in Model group (P < 0.001 for each; Figure 4B). The SP+ si-miRNA group had remarkably elevated TLR4, MyD88 and NF-κB (p65) levels when compared with those in the SP group (P < 0.001 for each; Figure 4B).
NF-κB (P65) Protein Nuclear Volume in Cells of Different Groups
Notably more NF-κB (p65) protein was detected intranuclearly in Model and si-NC groups than in the NC group (P < 0.001 for each; Figure 5). When SP was administered, a dramatic decline in intranuclear NF-κB (p65) protein was observed in the SP group had when compared with Model group (P < 0.001; Figure 5). However, more intranuclear NF-κB (p65) protein was detected in the SP+si-miRNA group than in the SP group (P < 0.001; Figure 5).
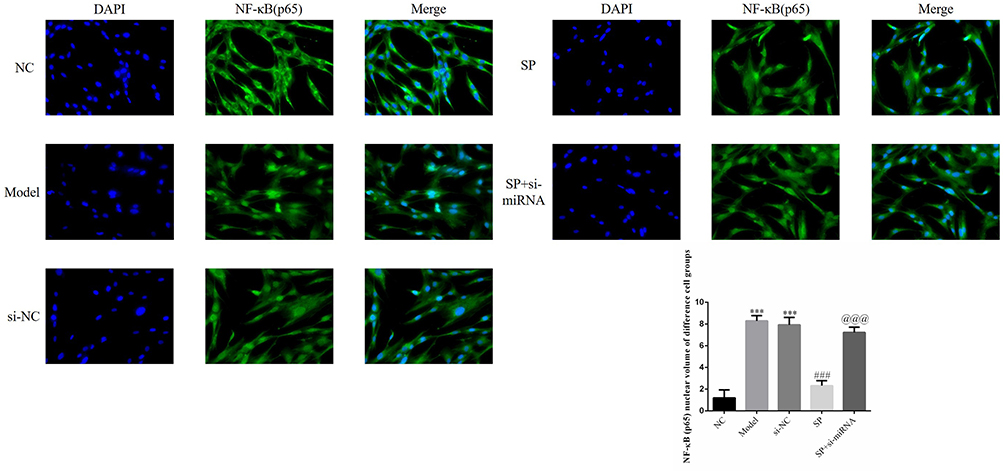 |
Figure 5 NF-κB (p65) nuclear volume. NC: HK-2 cells treated with normal; Model: HK-2 cells treated with high glucose; si-NC: HK-2 cells transfected with si-NC (negative control) and high glucose; standard puerarin (SP): HK-2 cells treated with high glucose and 80 mg/L SP; SP+si-miRNA: HK-2 cells transfected with si-miRNA-145-5p and treated with high glucose and 80 mg/L SP. ***P < 0.001, compared with NC group; ###P < 0.001, compared with Model group; @@@P < 0.001, compared with SP group. |
The Correlation Between miRNA-140-5p and TLR4 in HK-2 Cells
In HK-2 cell strains containing TLR4 mutation (TLR4-Mul), the difference in luciferase activity between miRNA-NC and miRNA-140-5p groups remained insignificant (P > 0.05). The miRNA-140-5p group had significantly lower luciferase activity than did the miRNA-NC group in TLR4 wild type (TLR4-WT) HK-2 cell strains (P < 0.001; Figure 6).
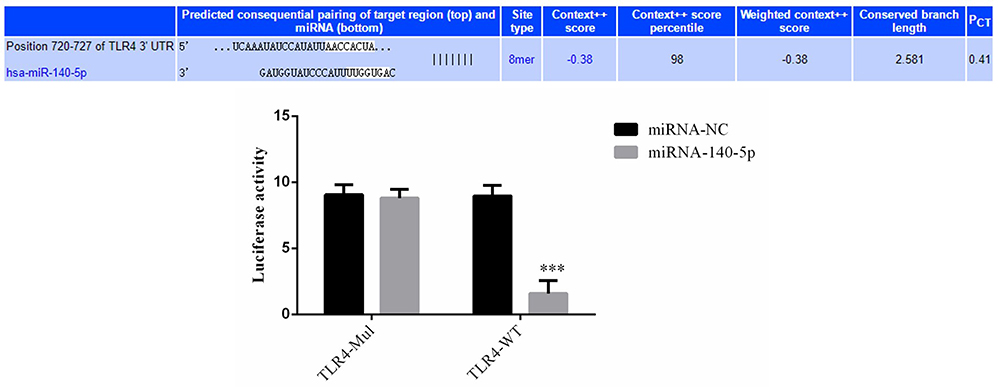 |
Figure 6 Correlation between miRNA-145-5p and TLR4 in HK-2 cells. ***P < 0.001, compared with the miRNA-NC group. |
Discussion
SP was first explored in research related to diabetes and its complications in the early 1990s. SP can affect the secretion of diabetes-influencing inflammatory factors, reduce the inflammatory reaction, and alleviate diabetes-related clinical symptoms.16 Insulin resistance can lead to significantly elevated levels of TNF-α in the human body, which can then lapse into a state of chronic inflammation.16 The administration of SP to intervene with diet-induced insulin resistance in fat rats revealed that SP can lower TNF-α levels and reduce blood glucose and lipid levels. SP can also reduce ICAM-1 and TNF-α levels at the same time to mitigate renal damage in diabetic rats.17 Additionally, SP can effectively inhibit INF-γ and TGF-β1 expression in renal tissues of diabetic rats.18 Recent research reveals that miRNAs play a vital role in the diagnosis and treatment of diabetes.19–21 In this study, rats in the Model group are have significantly higher FBG, UACR, and KI levels and lower body mass compared with NC group. SP therapy resulted in a significant reduction in FBG, UACR and KI levels and an improvement in body mass when compared with the Model group. Furthermore, pathomorphological examination of renal tissues revealed enlarged glomeruli, disorderly arranged epithelial cells, vacuolar degeneration of renal tubules, and visible inflammatory cell infiltration in SP treated group. TUNEL staining revealed that a large number of cells undergo apoptosis in the Model group and that the pathological changes and apoptotic cell numbers in renal tissues from SP-intervened groups are significantly reduced. Meanwhile, miRNA-140-5p is more highly expressed in renal tissue from SP-intervened rats than in those without SP intervention. Taken together, these results indicate that SP can relieve renal tissue damage in DN rats and the underlying mechanism may be related to miRNA-140-5p.
As revealed by some study,22 Lipopolysaccharide-binding protein binds specifically with LPS to deliver a downstream activation signal through Toll-like receptor 4 and MD2 protein. This initializes the mononuclear macrophage system and the release of several chemotactic factors and inflammatory cytokines including TNF-α, IL-6, IL-1β, transforming growth factor, matrix metalloproteinases, TGF-β, and platelet derived growth factor. Thus, NF-κB is further activated. DN is stimulated to occur and develop through these pathways and inflammatory cytokines including TNF-α, 1L-6, and 1L-1β play important roles in the pathogenesis of DN.23 Hyperglycemia can directly lead to renal damage by stimulating mesangial cell proliferation and inflammatory factor secretion. Additionally, mononuclear macrophages may be stimulated to release more inflammatory cytokines like TNF-α, 1L-6, and 1L-lβ which will promote macrophage generation and cellular inflammation kidney damage. In such cases, more CFs, adhesion molecules, and fibrosis-inducing factor TGF-β are expressed to activate the nuclear transfer of NF-κB. Inflammation-associated cytokine expression is promoted by positive feedback, resulting in the spread of the inflammatory response.24 Our results reveal rats in the Model group had significantly elevated levels of TNF-α, IL-1β and IL-6 inflammatory cytokines in the supernatant, rat serum, and cells. However, the administration of SP significantly alters the levels of inflammatory cytokines, including TNF-α, IL-1β, and IL-6. Higher miRNA-140-5p expression reduces the activity of the TLR4/MyD88/NF-κB (p65) signaling pathway. However, si-miRNA-mediated inhibition of miRNA-140-5p inhibits the effects of SP on DN. Moreover, our dual dual-luciferase reporter gene assay revealed that miRNA-140-5p can target and regulate TLR4 in HK-2 cells.
Taken together, our results show that SP can reduce or prevent DN-induced renal damage, reduce levels of inflammatory cytokines TNF-α, IL-1β, and IL-6, and inhibit the TLR4/MyD88/NF-κB (p65) pathway by up-regulating miRNA-140-5p.
Research Involving Human Participants and/or Animals
All procedures performed in studies involving human participants were performed in accordance with the ethical standards of the institutional and/or national research committee and the 1964 Declaration of Helsinki and its later amendments or comparable ethical standards. This study was approved by the ethics committee of Wuhan Fourth Hospital (No.)
Funding
There is no funding to report.
Disclosure
The authors declare that they have no conflicts of interest for this work.
References
1. Li L, Jick S, Breitenstein S, Michel A. Prevalence of diabetes and diabetic nephropathy in a large U.S. commercially insured pediatric population, 2002–2013. Diabetes Care. 2016;39(2):278–284.
2. Zhuo L, Zou G, Li W, Lu J, Ren W. Prevalence of diabetic nephropathy complicating non-diabetic renal disease among Chinese patients with type 2 diabetes mellitus. Eur J Med Res. 2013;18(1):4. doi:10.1186/2047-783X-18-4
3. Sun YM, Su Y, Li J, Wang LF. Recent advances in understanding the biochemical and molecular mechanism of diabetic nephropathy. Biochem Biophys Res Commun. 2013;433(4):359–361. doi:10.1016/j.bbrc.2013.02.120
4. Kanasaki K, Taduri G, Koya D. Diabetic nephropathy: the role of inflammation in fibroblast activation and kidney fibrosis. Front Endocrinol (Lausanne). 2013;4:7. doi:10.3389/fendo.2013.00007
5. Chow F, Ozols E, Nikolic-Paterson DJ, Atkins RC, Tesch GH. Macrophages in mouse type 2 diabetic nephropathy: correlation with diabetic state and progressive renal injury. Kidney Int. 2004;65(1):116–128. doi:10.1111/j.1523-1755.2004.00367.x
6. Duran-Salgado MB, Rubio-Guerra AF. Diabetic nephropathy and inflammation. World J Diabetes. 2014;5(3):393–398. doi:10.4239/wjd.v5.i3.393
7. He L, Hannon GJ. MicroRNAs: small RNAs with a big role in gene regulation. Nat Rev Genet. 2004;5(7):522–531. doi:10.1038/nrg1379
8. Chin LJ, Slack FJ. A truth serum for cancer–microRNAs have major potential as cancer biomarkers. Cell Res. 2008;18(10):983–984. doi:10.1038/cr.2008.290
9. Mitchell PS, Parkin RK, Kroh EM, et al. Circulating microRNAs as stable blood-based markers for cancer detection. Proc Natl Acad Sci U S A. 2008;105(30):10513–10518. doi:10.1073/pnas.0804549105
10. Gmerek L, Martyniak K, Horbacka K, et al. MicroRNA regulation in colorectal cancer tissue and serum. PLoS One. 2019;14(8):e0222013. doi:10.1371/journal.pone.0222013
11. Cong X, Zhang Q, Li H, et al. Puerarin ameliorates heat stress-induced oxidative damage and apoptosis in bovine Sertoli cells by suppressing ROS production and upregulating Hsp72 expression. Theriogenology. 2017;88:215–227. doi:10.1016/j.theriogenology.2016.09.033
12. Liang T, Xu X, Ye D, Chen W, Gao B, Huang Y. Caspase/AIF/apoptosis pathway: a new target of puerarin for diabetes mellitus therapy. Mol Biol Rep. 2019;46(5):4787–4797. doi:10.1007/s11033-019-04925-1
13. Zhou XL, Wan XM, Fu XX, Xie CG. Puerarin prevents cadmium-induced hepatic cell damage by suppressing apoptosis and restoring autophagic flux. Biomed Pharmacother. 2019;115:108929. doi:10.1016/j.biopha.2019.108929
14. Batnasan E, Wang R, Wen J, et al. 17-beta estradiol inhibits oxidative stress-induced accumulation of AIF into nucleolus and PARP1-dependent cell death via estrogen receptor alpha. Toxicol Lett. 2015;232(1):1–9. doi:10.1016/j.toxlet.2014.09.024
15. Zhang D, Li M. Puerarin prevents cataract development and progression in diabetic rats through Nrf2/HO‑1 signaling. Mol Med Rep. 2019;20(2):1017–1024.
16. Park MH, Kim DH, Lee EK, et al. Age-related inflammation and insulin resistance: a review of their intricate interdependency. Arch Pharm Res. 2014;37(12):1507–1514. doi:10.1007/s12272-014-0474-6
17. Pan X, Wang J, Pu Y, Yao J, Wang H. Effect of puerarin on expression of ICAM-1 and TNF-α in kidneys of diabetic rats. Med Sci Monit. 2015;21:2134–2140. doi:10.12659/MSM.893714
18. She S, Liu W, Li T, Hong Y. Effects of puerarin in STZ-induced diabetic rats by oxidative stress and the TGF-β1/Smad2 pathway. Food Funct. 2014;5(5):944–950. doi:10.1039/C3FO60565E
19. Liu X, Li J, Li X. miR-142-5p regulates the progression of diabetic retinopathy by targeting IGF1. Int J Immunopathol Pharmacol. 2020;34:2058738420909041. doi:10.1177/2058738420909041
20. Gao BH, Wu H, Wang X, Ji LL, Chen C. MiR-30c-5p inhibits high glucose-induced EMT and renal fibrogenesis by down-regulation of JAK1 in diabetic nephropathy. Eur Rev Med Pharmacol Sci. 2020;24(3):1338–1349.
21. Zeng Y, Cui Z, Liu J, Chen J, Tang S. MicroRNA-29b-3p promotes human retinal microvascular endothelial cell apoptosis via blocking SIRT1 in diabetic retinopathy. Front Physiol. 2020;10:1621. doi:10.3389/fphys.2019.01621
22. Xie C, Ge M, Jin J, et al. Mechanism investigation on bisphenol S-induced oxidative stress and inflammation in murine RAW264.7 cells: the role of NLRP3 inflammasome, TLR4, Nrf2 and MAPK. J Hazard Mater. 2020;394:122549. doi:10.1016/j.jhazmat.2020.122549
23. Zhang H, Zhang R, Chen J, Shi M, Li W, Zhang X. High mobility group box1 inhibitor glycyrrhizic acid attenuates kidney injury in streptozotocin-induced diabetic rats. Kidney Blood Press Res. 2017;42(5):894–904. doi:10.1159/000485045
24. García-García PM, Getino-Melián MA, Domínguez-Pimentel V, Navarro-González JF. Inflammation in diabetic kidney disease. World J Diabetes. 2014;5(4):431–443. doi:10.4239/wjd.v5.i4.431
 © 2020 The Author(s). This work is published and licensed by Dove Medical Press Limited. The full terms of this license are available at https://www.dovepress.com/terms.php and incorporate the Creative Commons Attribution - Non Commercial (unported, v3.0) License.
By accessing the work you hereby accept the Terms. Non-commercial uses of the work are permitted without any further permission from Dove Medical Press Limited, provided the work is properly attributed. For permission for commercial use of this work, please see paragraphs 4.2 and 5 of our Terms.
© 2020 The Author(s). This work is published and licensed by Dove Medical Press Limited. The full terms of this license are available at https://www.dovepress.com/terms.php and incorporate the Creative Commons Attribution - Non Commercial (unported, v3.0) License.
By accessing the work you hereby accept the Terms. Non-commercial uses of the work are permitted without any further permission from Dove Medical Press Limited, provided the work is properly attributed. For permission for commercial use of this work, please see paragraphs 4.2 and 5 of our Terms.