Back to Journals » Cancer Management and Research » Volume 13
Stage-Specific PET Radiomic Prediction Model for the Histological Subtype Classification of Non-Small-Cell Lung Cancer
Authors Ji Y, Qiu Q, Fu J, Cui K, Chen X, Xing L, Sun X
Received 21 October 2020
Accepted for publication 28 December 2020
Published 12 January 2021 Volume 2021:13 Pages 307—317
DOI https://doi.org/10.2147/CMAR.S287128
Checked for plagiarism Yes
Review by Single anonymous peer review
Peer reviewer comments 3
Editor who approved publication: Dr Antonella D'Anneo
Yanlei Ji,1,2 Qingtao Qiu,3 Jing Fu,4 Kai Cui,5 Xia Chen,6 Ligang Xing,3 Xiaorong Sun6
1Department of Ultrasound Medicine, Shandong Cancer Hospital and Institute, Cheeloo College of Medicine, Shandong University, Jinan, Shandong 250012, People’s Republic of China; 2Department of Ultrasound Medicine, Shandong Cancer Hospital and Institute, Shandong First Medical University and Shandong Academy of Medical Sciences, Jinan, Shandong 250117, People’s Republic of China; 3Department of Radiation Oncology, Shandong Cancer Hospital and Institute, Shandong First Medical University and Shandong Academy of Medical Sciences, Jinan, Shandong 250117, People’s Republic of China; 4Department of Ultrasound Medicine, The First Affiliated Hospital of Shandong First Medical University, Jinan, Shandong 250014, People’s Republic of China; 5Department of PET/CT, The Second Hospital, Cheeloo College of Medicine, Shandong University, Jinan, Shandong 250033, People’s Republic of China; 6Department of Nuclear Medicine, Shandong Cancer Hospital and Institute, Shandong First Medical University and Shandong Academy of Medical Sciences, Jinan, Shandong 250117, People’s Republic of China
Correspondence: Xiaorong Sun
Department of Nuclear Medicine, Shandong Cancer Hospital and Institute, Shandong First Medical University and Shandong Academy of Medical Sciences, 440 Jiyan Road, Jinan, Shandong 250117, People’s Republic of China
Tel/Fax + 86-531-67626287
Email [email protected]
Purpose: To investigate the impact of staging on differences in glucose metabolic heterogeneity between lung adenocarcinoma (ADC) and squamous cell carcinoma (SCC) by 18F-fluorodeoxyglucose positron emission tomography (18F-FDG PET) textural analysis and to develop a stage-specific PET radiomic prediction model to distinguish lung ADC from SCC.
Patients and Methods: Patients who were histologically diagnosed with lung ADC or SCC and underwent pretreatment 18F-FDG PET/CT scans were retrospectively identified. Radiomic features were extracted from a semiautomatically outlined tumor region in the Chang-Gung Image Texture Analysis (CGITA) software package. The differences in radiomic parameters between lung ADC and SCC were compared stage-by-stage in 253 consecutive NSCLC patients with stages I to III disease. The least absolute shrinkage and selection operator (LASSO) algorithm was used for feature selection. A radiomic signature for each stage was subsequently constructed and evaluated. Then, an individual nomogram incorporating the radiomic signature and clinical risk factors was established and evaluated. The performance of the constructed models was assessed by receiver operating characteristic (ROC) curve analysis, and the nomogram was further validated by calibration curve analysis.
Results: The performance of the radiomic signature for distinguishing lung ADC and SCC in both the training and validation cohorts was good, with AUCs of 0.883, 0.854, and 0.895 in the training cohort and 0.932, 0.944, and 0.886 in the validation cohort for stages I, II, and III NSCLC, respectively. The radiomic-clinical nomogram integrating radiomic features with independent clinical predictors exhibited more favorable discriminative performance, with AUCs of 0.982, 0.963, and 0.979 in the training cohort and 0.989, 0.984, and 0.978 in the validation cohort for stages I, II, and III, respectively.
Conclusion: Differences in PET radiomic features between lung ADC and SCC varied in different stages. Stage-specific PET radiomic prediction models provided more favorable performance for discriminating the histological subtype of NSCLC.
Keywords: non-small-cell lung cancer, positron emission tomography, PET, textural analysis, heterogeneity, staging
Introduction
Lung cancer is the leading cause of cancer-related deaths worldwide.1 Non-small-cell lung cancer (NSCLC) accounts for approximately 85% of primary lung cancers.2 Adenocarcinoma (ADC) and squamous cell carcinoma (SCC) are the two major histologic subtypes of NSCLC, accounting for approximately 60% and 35% of all cases, respectively.3 The etiology, origin, and genetic characteristics of lung ADC and SCC are different, although both are categorized as NSCLCs. There is a significant difference in the treatment approach, prognosis and recurrence rate of lung ADC and SCC at different stages. However, mixed pathological types or mixed stages may have led to various biases and inconsistent results in previous studies on the prognosis of NSCLC due to confounding tumor heterogeneity. Meanwhile, some studies have reported that tumor heterogeneity is associated with treatment response and patient prognosis.4–6 Therefore, a stage-specific prediction model should be further developed to accurately confirm the histological subtype of NSCLC prior to treatment.
Pathological diagnosis is the gold standard for distinguishing lung ADC from SCC. Clinically, computed tomography (CT)-guided biopsy is the standard for the classification of NSCLC subtypes.7 However, it is an invasive diagnostic process and is unable to explore the heterogeneity of the whole tumor. Typically, biopsy can only extract very limited portions of the target tissue and is incapable of completely characterizing tumor properties.8 It cannot provide spatial information and cannot allow for whole-body assessments. Furthermore, in some cases, CT-guided biopsy cannot be performed or is not suitable, requiring a multidisciplinary approach for decision-making.9 For example, some small lesions are difficult to target and cannot provide enough tissue for pathological diagnosis. In addition, for deep lesions or lesions close to airways or blood vessels, performing CT-guided biopsy is challenging. Hence, a noninvasive approach for the accurate identification of lung ADC and SCC that examines the whole tumor site is required.
In recent years, radiomics has become increasingly popular in medical imaging analysis.10 Radiomics uses quantitative imaging features extracted from medical images to characterize tumor pathology or heterogeneity. Radiomics has the combined advantages of being highly patient-specific and noninvasive. Additionally, unlike biopsy specimens, radiomics allows the heterogeneity to be sampled over the entire tumor. Recently, CT-based texture analysis has been shown to predict tumor stage and prognosis in esophageal cancer and NSCLC.11–16 However, CT image features cannot provide functional information on the tumor. 18F-FDG PET texture analysis, a method for the quantitative measurement of tumor glucose metabolic heterogeneity, provides functional information about tumor uptake. 18F-FDG PET texture analysis has been shown to be more powerful than traditional metabolic parameters for predicting treatment response, recurrence, and survival in NSCLC patients.6,17–24 Many studies have shown the potential of discriminating lung ADC from SCC by taking advantage of the difference in glucose metabolic heterogeneity.8,25 However, to the best of our knowledge, PET radiomics has not been used to predict the tumor subtype in each tumor stage.
Therefore, in this study, we compared 18F-FDG PET radiomic parameters of lung ADC and SCC stage-by-stage, clarified the differences in radiomic parameters between the two histological subtypes at each stage, and constructed and validated a stage-specific 18F-FDG PET radiomic prediction model to distinguish lung ADC from SCC.
Patients and Methods
Patients Population
This study was approved by the Institutional Review Board of Shandong Cancer Hospital and Institute, and the need for informed consent was waived because the study was an observational, retrospective study using a database in which identifying patient information had been removed. In addition, this study was conducted in accordance with the Declaration of Helsinki. Patients who were diagnosed with NSCLC from October 2012 to March 2016 were enrolled in this study. The inclusion criteria were as follows: (1) pretreatment 18F-FDG PET/CT staging scan; (2) lung ADC or SCC confirmed by biopsy or surgical specimens; (3) the primary tumor was 18F-FDG-avid; and (4) whole body 18F-FDG PET/CT scan and contrast-enhanced CT or MRI confirmed that there was no distant metastasis. The exclusion criteria were as follows: (1) no baseline 18F-FDG PET/CT images and (2) mixed pathological types of primary lesions. Furthermore, an independent cohort of NSCLC patients who met the criteria from April 2016 to December 2019 was included as the validation cohort. The patients were staged according to the American Joint Committee on Cancer (AJCC) 7th edition by an experienced radiologist who had more than ten years of experience, and then the results were checked by another expert with more than fifteen years of experience.
PET/CT Image Acquisition
18F-FDG PET/CT scans were obtained using a PET/CT scanner (Philips Gemini TF Big Bore, Philips Medical Systems, Cleveland, OH, USA). All patients fasted for at least 6 hours prior to PET/CT examination, and the blood glucose level had to be <7 mmol/L. Patients were injected intravenously with 3.7 MBq/kg 18F-FDG and subsequently rested for approximately 1 h in a quiet room prior to imaging. The 16-slice CT component was obtained with X-ray tube peak voltage 120 kV, tube current 90 mA, slice thickness 5 mm, and interval 4 mm for the localization of 18F-FDG uptake regions in PET images. PET scanning was performed covering the same axial range for 2 min per bed position (total of three to five bed positions). PET images were reconstructed with the default manufacturer-provided method: 3D maximum likelihood algorithm (4×4×4 mm per voxel size) and CT-based attenuation correction, normalized to the injected activity and body weight.
Tumor Segmentation and Feature Extraction
Tumor segmentation and radiomic features were analyzed in CGITA (version 1.3, http://code.google.com/p/cgita),26 which is an open-source program with a graphical user interface for the texture analysis of molecular images that runs on MATLAB (MathWorks Inc., Natick, MA, USA). The metabolically active tumor volume of the primary tumor was delineated using the built-in segmentation in CGITA, a threshold-based region-growing method that operates semiautomatically. Primary tumors adjacent to metastatic lymph nodes and the heart were manually delineated by an experienced thoracic oncologist. Then, whole-tumor heterogeneity indices were calculated. In total, 6 traditional metabolic parameters, which included standardized uptake values (SUVs) (SUVmax, SUVmin, SUVmean, and SUVpeak), the metabolic tumor volume (MTV), and total lesion glycolysis (TLG), and 54 texture parameters describing global (n=5), local (n=27), and regional (n=22) features of the primary tumor were obtained. The texture features are described in detail in Supplementary Table 1.
Radiomic Signature Construction
To make the radiomics signature more effective and robust, feature selection was performed using a least absolute shrinkage and selection operator (LASSO) binary regression model, which is often used to reduce high-dimensional feature data. As a result, the most predictive features were selected with coefficients. Then, a radiomic signature, also known as the radiomic score or Rad_Score, was established by a linear combination of selected features and corresponding coefficients. The Rad_Scores of this study were built on the training cohort for each stage and could be an independent predictor for further prediction models. Meanwhile, the performances of Rad_Scores were evaluated using the receiver operating characteristic curve (ROC) and the area under the curve (AUC).
Nomogram Construction
Further prediction models were built by incorporating the Rad_Score and predictive clinical risk factors. First, potential clinical risk factors were age, sex, smoke, site and location. Then, univariate analysis was performed to select the candidate clinical risk factor and ensure that features for model training were informative and predictive. Subsequently, a multivariable logistic regression algorithm was used to build the nomogram and the graphical representation of the prediction model and for intuitive visualization. The nomogram was constructed from the training cohort and tested in both the training cohort and validation cohort using ROC-AUC and further validated with a calibration curve in the validation cohort. The agreement between the predicted and observed tumor subtypes in each stage was assessed by the Hosmer–Lemeshow test, and a p-value >0.05 indicated good agreement.
Statistical Analysis
The Mann–Whitney U-test or Wilcoxon rank-sum test was used to analyze the difference in parameters between lung ADC and SCC at each stage, where appropriate. We also performed statistical analysis using R statistical software (version 3.6.1, http://www.r-project.org) to construct and validate the prediction model. In this study, univariate analysis and model performance assessment were implemented with the “stats” package and “pROC” package, respectively. LASSO was implemented with the “glmnet” package. Nomograms and calibration curves were implemented with the “rms” package. The reported statistical significance levels were all two-sided, and the cutoff was set to lower than 0.05.
Results
Patients Characteristics
A total of 416 consecutive patients were analyzed, which included 253 in the training cohort and 163 in the validation cohort. All enrolled patients were confirmed by biopsy, and subsets of these patients were confirmed again by surgical specimens. The demographics and clinical characteristics of all patients in the two cohorts are listed in Table 1. No significant difference was found in the composition of patients between the two cohorts.
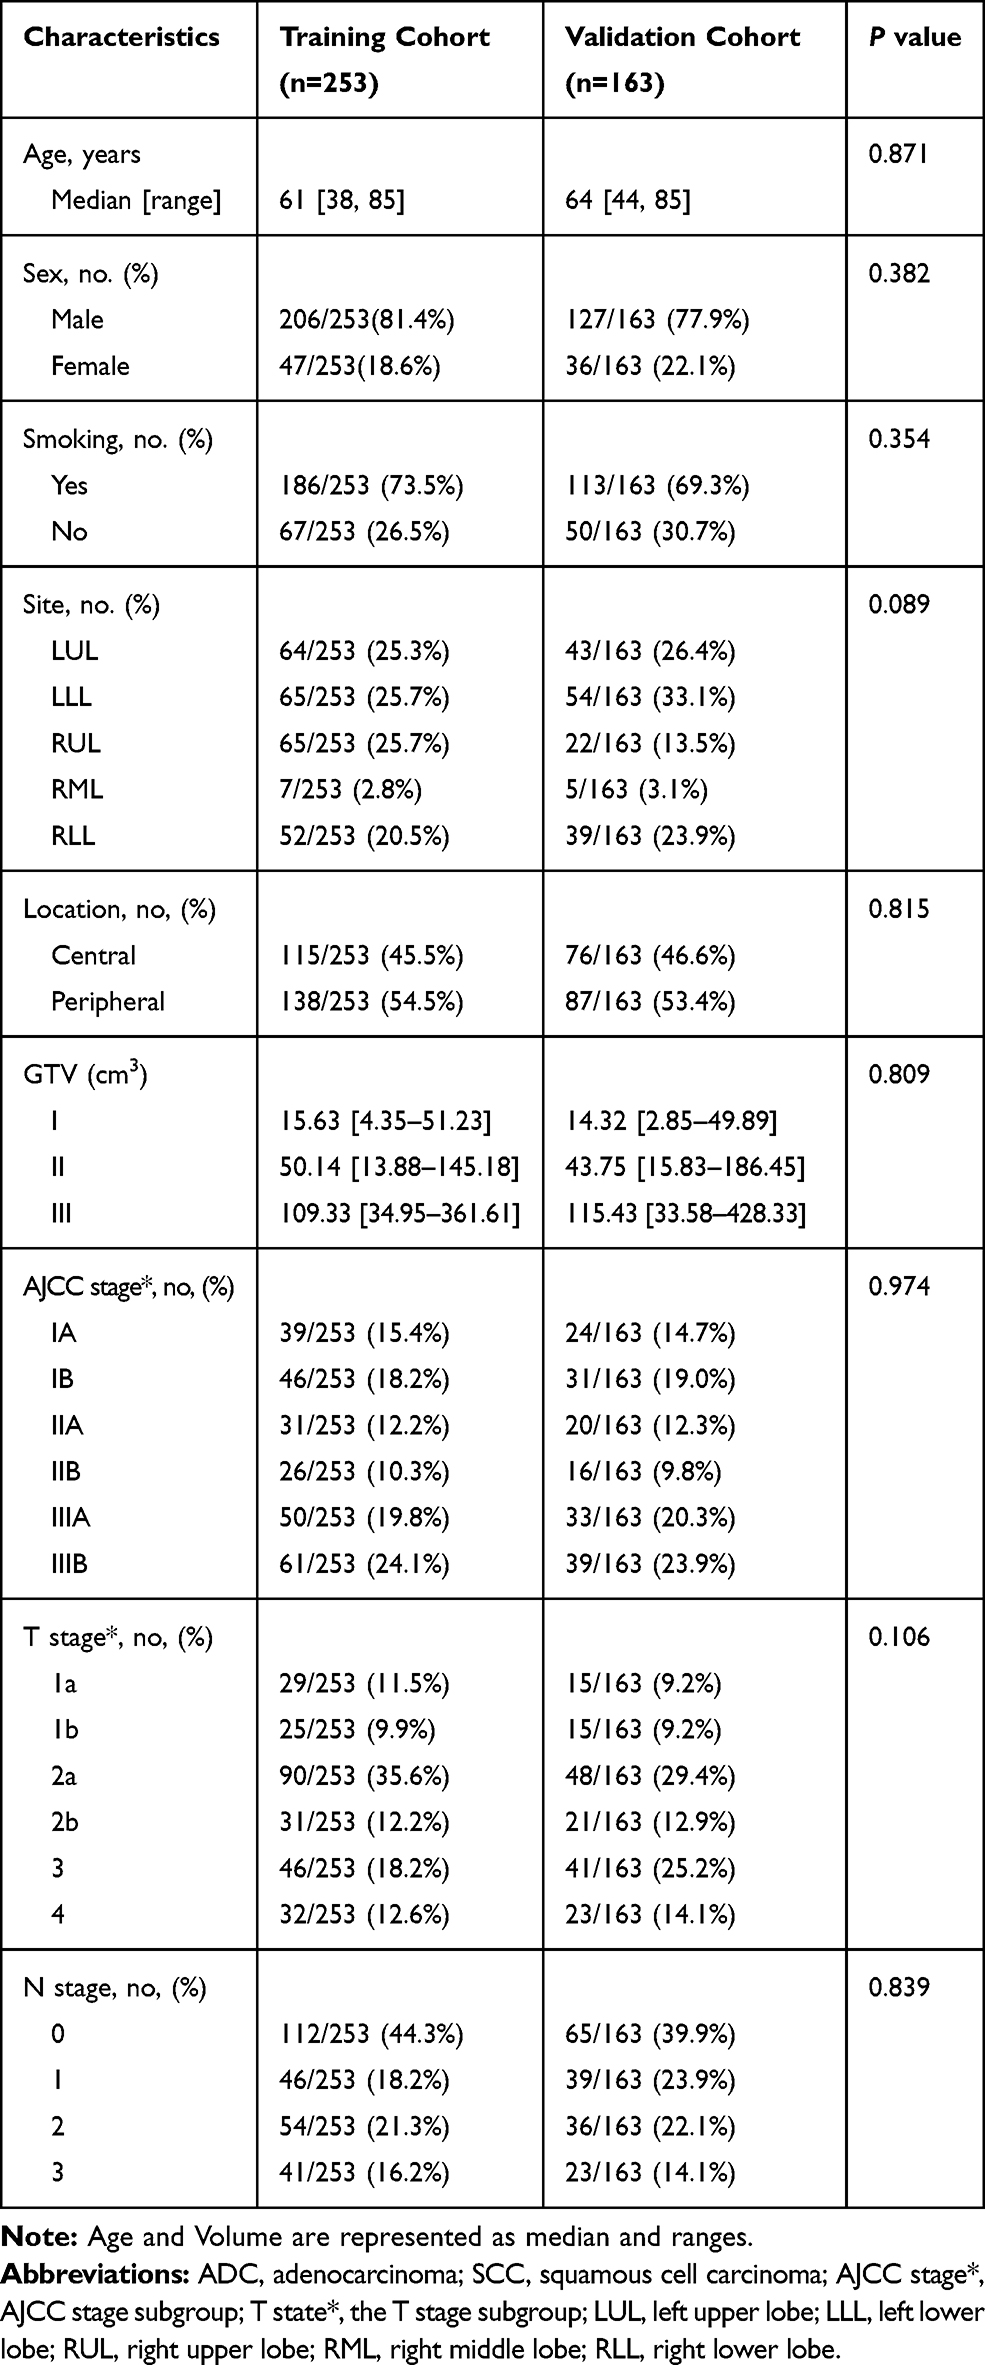 |
Table 1 The Demographic and Clinical Characteristics of Patients |
Correlation Between Radiomic Parameters and Staging
First, all indices were classified according to the correlation with AJCC staging, ie, positive, negative, or no correlation. All six metabolic parameters of the primary tumor were positively correlated with the AJCC stage (rs: 0.15–0.51, P < 0.05). Most of the radiomic features of NSCLC were either positively or negatively correlated with the AJCC stage. Twenty-four texture parameters of 18F-FDG PET/CT imaging of NSCLC (four global, 12 local, and eight regional) were positively correlated with the AJCC stage (rs: 0.21–0.49, P < 0.05). Twenty-three texture parameters (one global, 13 local, and nine regional) were negatively correlated with the AJCC stage (rs: −0.13 to −0.50, P < 0.05). Seven texture parameters were not correlated with the AJCC stage. Correlations between radiomic parameters and stages are shown in Supplementary Figure 1.
The Difference in Metabolic Parameters and Radiomic Features Between Lung ADC and SCC
All six metabolic parameters of lung SCC were significantly higher than those of ADC in the same stage. Particularly, SUVmax and SUVpeak, the two most commonly used metabolic parameters to predict prognosis in other studies,27–29 were significantly higher in stage I lung SCC than in stage I lung ADC (13.439 ± 5.690 and 8.847 ± 3.912 vs 7.553 ± 3.575 and 4.790 ± 2.464, respectively, P all < 0.001), and similar results were found for stages II and III (Supplementary Figure 2A and B). Consistently, the MTV and TLG of lung SCC were significantly higher than those of ADC in stage I (30.044 ± 17.976 and 162.724 ± 117.552 vs 14.566 ± 14.654 and 55.719 ± 78.152, respectively, P all < 0.001), and the same was true for stage II and stage III (Supplementary Figure 2C and D). The differences in metabolic parameters are shown in Supplementary Table 2.
Among the texture parameters that were positively correlated with the AJCC stage, the differences between lung ADC and SCC varied with the stage. A total of 22, 21, and 21 texture parameters of lung SCC were significantly higher than those of ADC in stages I, II, and III, respectively. For example, the entropyCM of lung SCC was significantly higher than that of ADC in both stage I and stage III (6.511 ± 0.407 and 6.862 ± 0.275 vs 6.093 ± 0.511 and 6.586 ± 0.415, respectively, P < 0.001) (Supplementary Figure 3A). The homogeneityCM of lung SCC was significantly higher than that of ADC in stage I (0.198 ± 0.027 vs 0.169 ± 0.028, respectively, P < 0.001) and stages II and III (Supplementary Figure 3B). Among the remaining parameters, no significant differences were found. The differences in radiomic parameters that were positively correlated with the AJCC stage between lung ADC and SCC are shown in Supplementary Table 2.
For texture parameters that were negatively correlated with the AJCC stage, 17, 14 and 18 texture parameters of SCC were significantly lower than those of ADC in stages I, II, and III, respectively. For example, the dissimilarityCM and coarsenessNGTDM of lung SCC were significantly lower than those of ADC in stage I (8.345 ± 1.875 and 0.017 ± 0.006 vs 10.440 ± 2.307 and 0.027 ± 0.011, respectively, P all < 0.001), and similar results were found for stages II and III (Supplementary Figure 3C and D). For the remaining parameters, no significant differences were found. The differences in radiomic parameters that were negatively correlated with the AJCC stage between lung ADC and SCC are shown in Supplementary Table 3.
For the seven texture parameters unrelated to the AJCC stage, only LGLZE in stage I and RP, LGLRE and LGLZE in stage II of lung SCC were significantly higher than those of ADC. The differences in radiomic parameters unrelated to the AJCC stage between lung ADC and SCC are shown in Supplementary Table 4.
Radiomic Features Selection
In the training phase of stage I and stage III, 13 and 12 out of 60 extracted features were selected with nonzero coefficients, indicating that it had the power to distinguish lung ADC from SCC. However, 5 out of 60 extracted features were selected for stage II. The tuning phase and coefficient profile of each stage are plotted in Figure 1A–F, respectively. The selected features and corresponding coefficients are listed in Table 2. The negative coefficients had a major contribution to the predicted risk of SCC, whereas the positive coefficient contributed to the predicted risk of ADC.
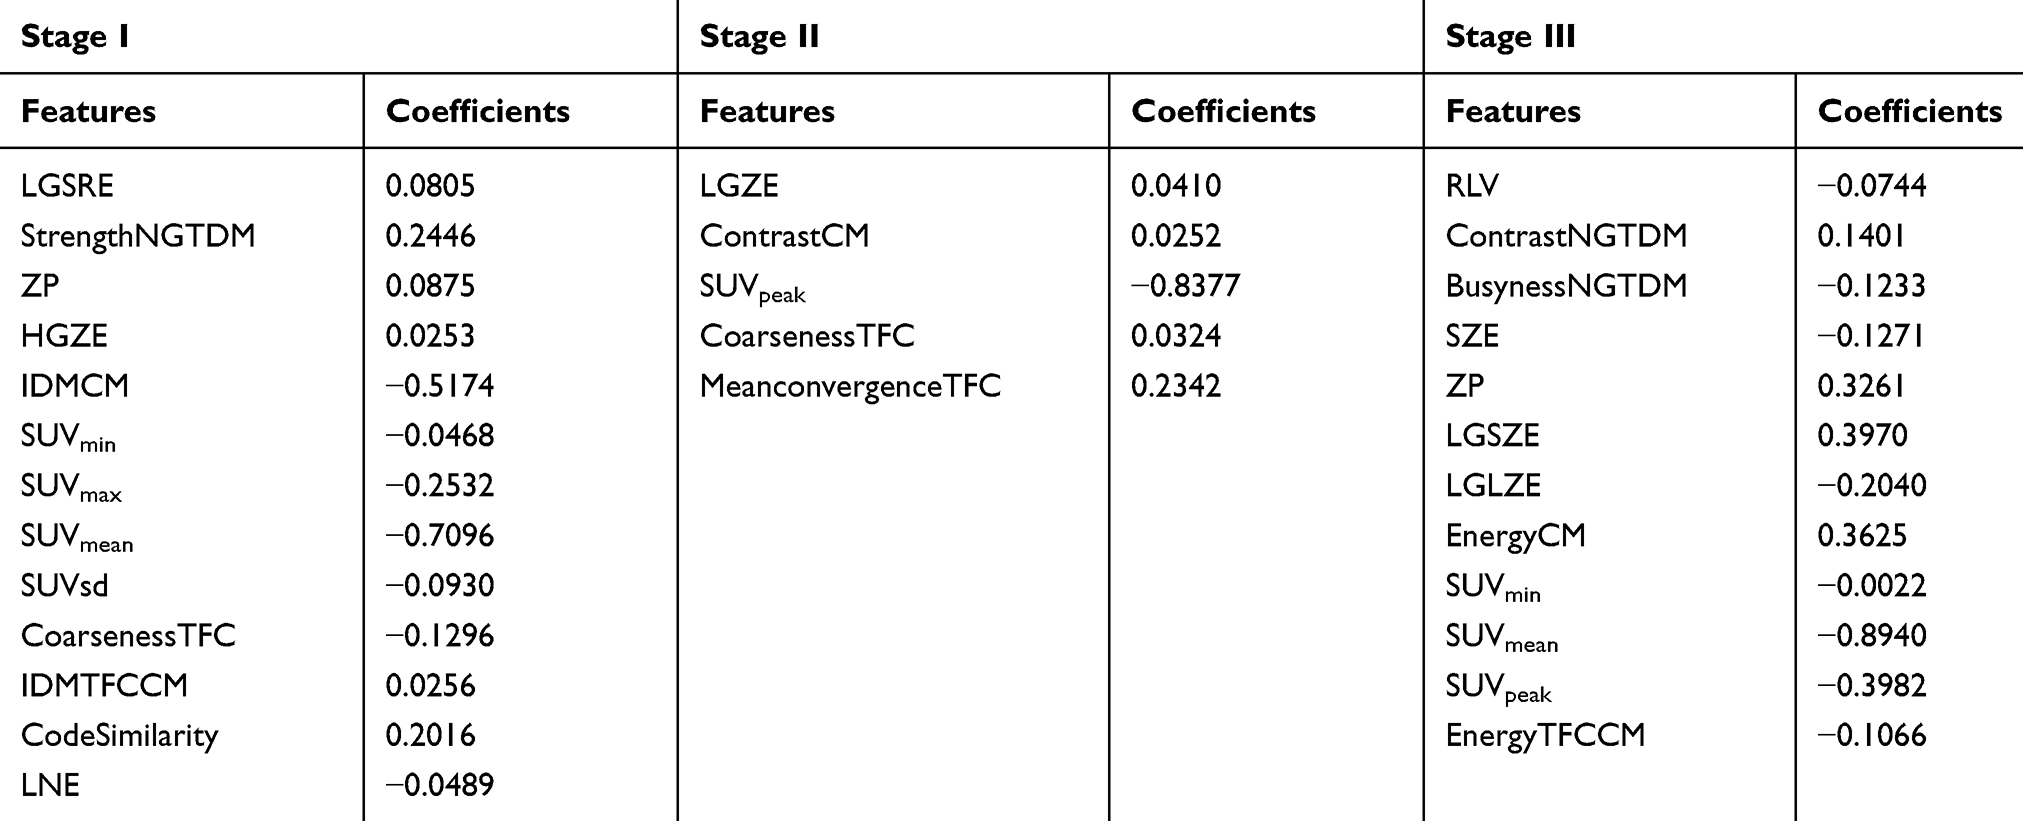 |
Table 2 Selected Features and Corresponding Coefficients for Each Stage by LASSO Algorithm |
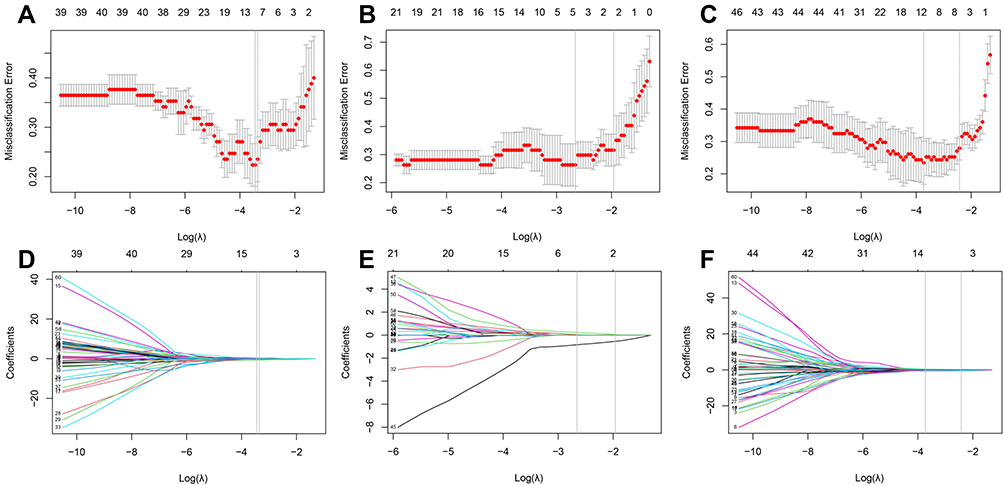 |
Figure 1 Feature selection using least absolute shrinkage and selection operator (LASSO) with a binary regression model. (A–C) show the LASSO tuning parameter λ with 10-fold cross-validation for stages I, II, and III, respectively. The misclassification error was plotted versus log(λ). (D–F) show coefficient profiles of stages I, II, and III, respectively. The minimum criteria were chosen to identify the optimal discriminative features and are plotted with a gray vertical line. |
Radiomic Signature Construction and Validation
The radiomic signature was established using a linear combination of selected features and corresponding coefficients. The signatures, also named Rad_Score in this study, of stages I, II, and III are as follows.
Rad_Score stage I = 0.0805*LGSRE + 0.2446*StrengthNGTDM + 0.0875*ZP+ 0.0253*HGZE – 0.5174*IDMCM – 0.0468*SUVmin – 0.2532* SUVmax – 0.7096*SUVmean – 0.0930*SUVsd – 0.1296* CoarsenessTFC + 0.0256* IDMTFCCM + 0.2016* CodeSimilarity – 0.0489*LNE (1).
Rad_Score stage II = 0.0410* LGZE + 0.0252* ContrastCM – 0.8377* SUVpeak + 0.0324* CoarsenessTFC + 0.2342*MeanconvergenceTFC (2).
Rad_Score stage III = –0.0744*RLV + 0.1401*ContrastNGTDM – 0.1233*BusynessNGTDM – 0.1277*SZE + 0.3261*ZP + 0.3970*LGSZE –0.2040*LGLZE + 0.3625*EnergyCM – 0.0022*SUVmin – 0.8940*SUVmean –0.3982*SUVpeak – 0.1066*EnergyTFCCM (3).
Figure 2A–C shows the sum of the absolute coefficients of these features in terms of the feature categories in each stage, from which we found that metabolic parameters had the highest weight in the Rad_Score formula. The Rad_Scores of the training and validation cohorts for each stage are plotted in Figure 3A–F, respectively. A cutoff value of 0 was used to identify ADC (Rad_Score≥0) and SCC (Rad_Score<0) in the training cohort and was then validated in the validation cohort (all P<0.0001). A patient who had a higher Rad_Score value had a risk of ADC, and a lower value indicated a risk of SCC. The ROCs of the Rad_Score are plotted in Figure 4A–C. The AUCs of stages I, II, and III were 0.883, 0.854, and 0.895 in the training cohort and 0.932, 0.944, and 0.886 in the validation cohort, respectively.
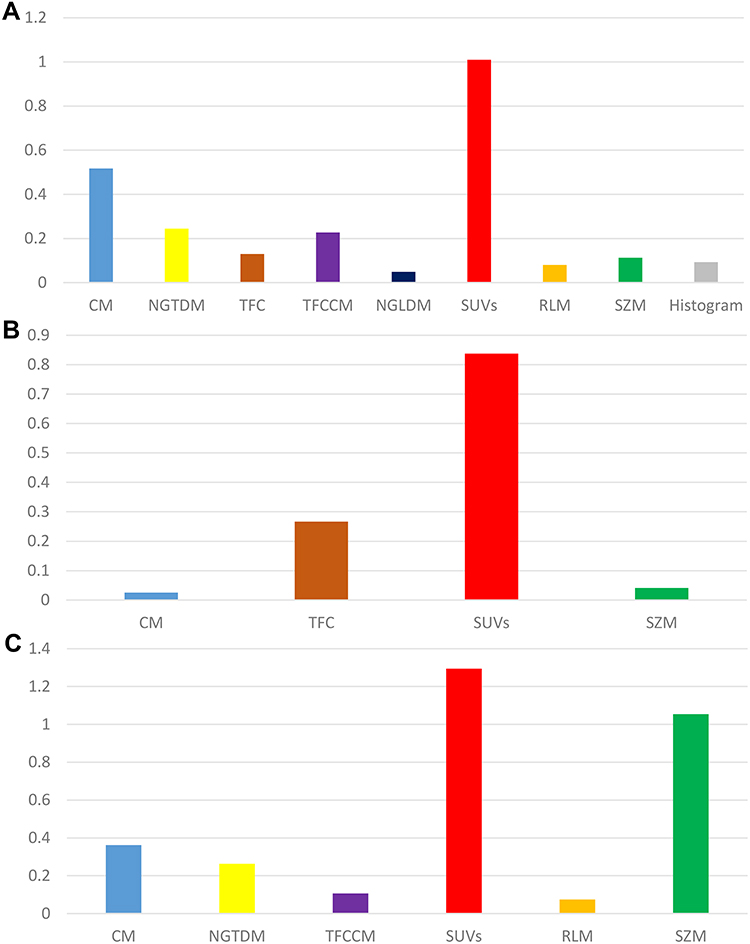 |
Figure 2 The sum of the absolute coefficients of features with different categories in each stage (A–C) show stages I, II, and III, respectively). |
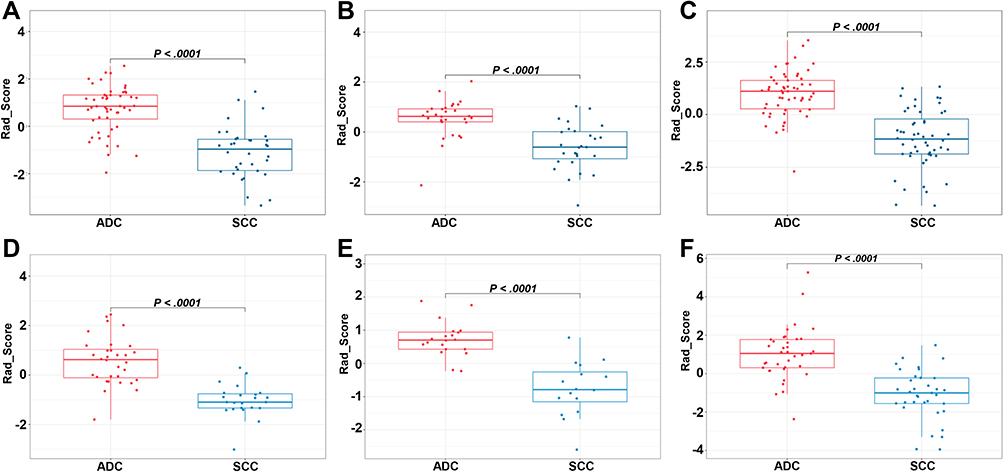 |
Figure 3 Box plots of the Rad_Score calculated from the training cohort ((A–C) show stages I, II, and III, respectively) and validation cohort ((D–F) show stages I, II, and III, respectively). Red and blue dots are Rad_Score values of each patient in the corresponding cohorts. |
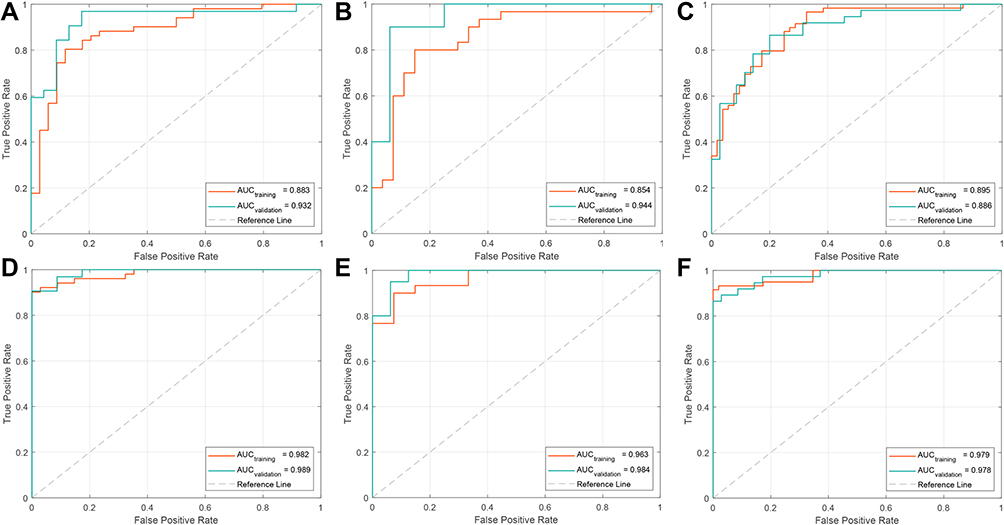 |
Figure 4 ROC curves were generated to assess the discriminative power of the Rad_Score ((A–C) show stages I, II, and III, respectively) and nomogram ((D–F) show stages I, II, and III, respectively) for predicting the subtype of lung cancer, including ADC and SCC. |
Nomogram Construction and Validation
After univariate analyses, only location (0 for central and 1 for peripheral) served as an independent clinical predictor integrated into the nomogram, and the results of univariate analysis can be found in Supplementary Table 5. Combined with clinical risk factors and Rad-Scores, nomograms were built and are presented in Figure 5A–C. The coefficients of multivariable logistic regression are presented in Supplementary Table 6. The ROCs of the nomogram are plotted in Figure 4D–F. The AUCs of stages I, II, and III were 0.982, 0.963, and 0.979 in the training cohort and 0.989, 0.984, and 0.978 in the validation cohort, respectively. Finally, the calibration curves of the validation cohort of each stage are plotted in Figure 6. The Hosmer–Lemeshow test showed that the difference between the calibration curves and the ideal curves was nonsignificant (P-values were 0.367, 0.241, and 0.556 for stages I, II, and III, respectively).
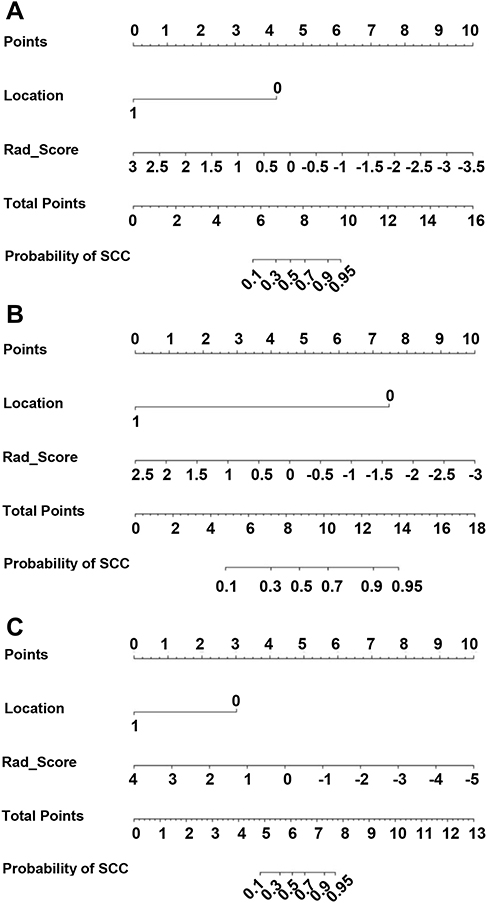 |
Figure 5 Nomograms developed using the training cohort of stage I (A), II (B), and III (C). The nomogram incorporates the Rad_Score and clinical risk factors. |
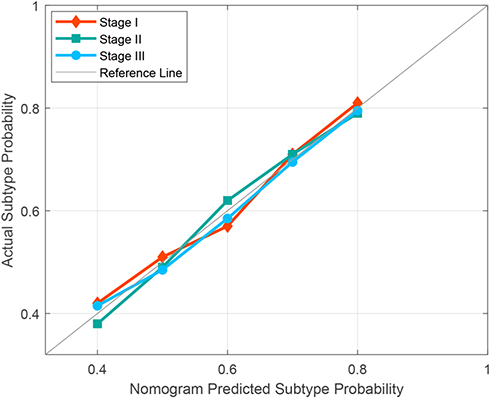 |
Figure 6 Calibration curves of nomograms were plotted to assess the agreement between the nomograms predicted subtype probability and actual observed subtype probability of the validation cohort. |
Discussion
In this study, we developed three stage-specific prediction models to identify lung ADC and SCC. The results demonstrated that there was a significant difference in glucose metabolic heterogeneity for each stage between lung ADC and SCC. Notably, the differences between lung ADC and SCC with respect to PET radiomic parameters seem to depend on the correlations between the parameters and staging. Therefore, we developed and validated a stage-specific radiomic-clinical nomogram that incorporated PET-based textural features and primary clinical features to discriminate the histological subtype of NSCLC. The performance of the nomograms in both the training and validation cohorts indicates that they had a favorable discriminative power and that the nomogram could be an effective, noninvasive alternative for the discrimination of histological subtypes of NSCLC.
Previous studies have shown that lung ADC and SCC exhibit different glucose metabolic levels, probably due to different glut-1 expression levels and different tumor microenvironments. The SUVmax and SUVmean of lung SCC were higher than those of lung ADC.30,31 Some investigations showed that the MTV and TLG were significantly higher in SCC patients than in ADC patients.31,32 Similar in this study, the results demonstrated that when FDG PET traditional metabolic parameters and texture parameters were positively correlated with the tumor stage, they were higher for lung SCC than ADC in the same stage. However, when texture parameters were negatively correlated with the tumor stage, they were lower for lung SCC than ADC in same stage. Fewer differences in parameters were unrelated to the tumor stage. In particular, the difference in texture features representing glucose metabolic heterogeneity between lung ADC and SCC varied with different tumor stages.
All these findings provide evidence that staging and histological subtypes might affect the predictive efficacy of FDG PET radiomic analysis, thereby leading to important bias. Consequently, there were conflicting results in previous studies on predicting the prognosis of NSCLC with 18F-FDG PET textural analysis.21,24,33–36 Therefore, it would be more appropriate if prediction studies based on FDG PET imaging were performed in patients with the same pathological types and the same stage unless the parameter was not affected by staging and histological subtype.
Our study showed that there was a significant difference in glucose metabolic heterogeneity for each stage between lung ADC and SCC. Therefore, we aimed to develop a PET-based radiomic model to predict the NSCLC histological subtype for each stage. Recently, radiomics has grown as a promising approach to develop quantitative imaging biomarkers and predict pathological types, supporting therapeutic decisions in personalized medicine.37–39 Hyun et al40 used a machine-learning algorithm with PET-based radiomic features to distinguish lung ADC from SCC. However, the feasibility and performance of the PET-based radiomic approach for NSCLC histological subtype discrimination need further exploration. No stage-specific PET radiomic signature for the prediction of the NSCLC histological subtype was established. Therefore, we explored a feasible way to discriminate ADC from SCC in NSCLC and verified whether integrating radiomic features with clinical features further improved the discriminative power in this study.
Selecting optimal features from a massive feature pool is the key procedure of a radiomic study. The less useful features can streamline the prediction model and prevent overfitting issues. In this study, 13, 5, and 12 features were selected from the 60 features using a LASSO regression algorithm for stages I, II, and III, respectively. The constructed radiomic signatures showed a significant difference between lung ADC and SCC (P<0.0001). Among these optimal radiomic features that were selected, the sum of the absolute coefficients of metabolic parameters was the highest, indicating that the metabolic parameters could accurately reflect the histological differences between ADC and SCC in NSCLC.
Primary clinical risk factors such as age, sex, smoke, site, and location are commonly used for the clinical diagnosis of patients with lung cancer, but it was unclear whether incorporating these factors with the Rad_Score would improve the discriminative performance. Therefore, univariate analyses were performed and showed that location can serve as an independent predictor for distinguishing ADC from SCC in NSCLC. Then, a holistic nomogram incorporating independent clinical predictors with the Rad_Score was generated. The discriminative performance of the nomogram was evidently better than that of the radiomic model, apparently demonstrating that integrating radiomic features with primary clinical features further improved the discriminative power. In addition, the Hosmer–Lemeshow test further demonstrated the good predictive precision of the nomogram.
There were several limitations in our study. First, this was a retrospective study and included a limited number of patients for each tumor stage. Especially for mixed pathological subtypes, the limited number of patients did not allow us to develop multiclass classifiers. Second, the texture features of 18F-FDG PET/CT images are susceptible to factors that may introduce interstudy or interobserver variability in texture analysis, including respiratory motility, the lesion morphology, partial volume effect, image acquisition mode, image reconstruction algorithm, tumor segmentation method, and image postprocessing method. These sources of variation must be fully addressed to transform texture analysis from a research tool to a clinical tool. Finally, the nomograms built in this study are only suited for NSCLC and not for small cell lung cancer or metastatic cancer.
Conclusion
The difference in glucose metabolic heterogeneity between lung ADC and SCC varied with different stages. Stage-specific PET radiomic prediction models provided more favorable performance for discriminating the histological subtype of NSCLC.
Funding
This work was supported by grants from the National Key Research and Development Program of China (Grant No. 2018YFC1313200), the National Natural Science Foundation of China (Grant Nos. 81572970 and 82001902), the Natural Science Foundation of Shandong Province (Grant Nos. ZR2019LZL019 and ZR2020QH198), the Taishan Scholars Program of Shandong Province (Grant No. ts20120505), the Jinan Scientific and Technology Development Project (Grant No. 201805005) and the Academic Promotion Program of Shandong First Medical University (Grant No. 2019LJ004).
Disclosure
The authors declare that they have no conflicts of interest regarding this work.
References
1. Ferlay J, Soerjomataram I, Dikshit R, et al. Cancer incidence and mortality worldwide: sources, methods and major patterns in GLOBOCAN 2012. Int J Cancer. 2015;136(5):E359–E386. doi:10.1002/ijc.29210
2. Siegel RL, Miller KD, Jemal A. Cancer statistics, 2019. CA Cancer J Clin. 2019;69(1):7–34. doi:10.3322/caac.21551
3. Bashir U, Kawa B, Siddique M, et al. Non-invasive classification of non-small cell lung cancer: a comparison between random forest models utilising radiomic and semantic features. Br J Radiol. 2019;92(1099):20190159. doi:10.1259/bjr.20190159
4. Castello A, Grizzi F, Toschi L, et al. Tumor heterogeneity, hypoxia, and immune markers in surgically resected non-small-cell lung cancer. Nucl Med Commun. 2018;39(7):636–644. doi:10.1097/MNM.0000000000000832
5. Castello A, Russo C, Grizzi F, Qehajaj D, Lopci E. Prognostic impact of intratumoral heterogeneity based on fractal geometry analysis in operated NSCLC patients. Mol Imaging Biol. 2019;21(5):965–972. doi:10.1007/s11307-018-1299-3
6. Dong X, Sun X, Sun L, et al. Early change in metabolic tumor heterogeneity during chemoradiotherapy and its prognostic value for patients with locally advanced non-small cell lung cancer. PLoS One. 2016;11(6):e0157836. doi:10.1371/journal.pone.0157836
7. Herbst RS, Heymach JV, Lippman SM. Lung cancer. N Engl J Med. 2008;359(13):1367–1380. doi:10.1056/NEJMra0802714
8. Zhu X, Dong D, Chen Z, et al. Radiomic signature as a diagnostic factor for histologic subtype classification of non-small cell lung cancer. Eur Radiol. 2018;28(7):2772–2778. doi:10.1007/s00330-017-5221-1
9. Travis WD, Brambilla E, Noguchi M, et al. Diagnosis of lung adenocarcinoma in resected specimens: implications of the 2011 international association for the study of lung cancer/American thoracic society/European respiratory society classification. Arch Pathol Lab Med. 2013;137(5):685–705. doi:10.5858/arpa.2012-0264-RA
10. Bashir U, Siddique MM, Mclean E, Goh V, Cook GJ. Imaging heterogeneity in lung cancer: techniques, applications, and challenges. AJR Am J Roentgenol. 2016;207(3):534–543. doi:10.2214/AJR.15.15864
11. Ganeshan B, Skogen K, Pressney I, Coutroubis D, Miles K. Tumour heterogeneity in oesophageal cancer assessed by CT texture analysis: preliminary evidence of an association with tumour metabolism, stage, and survival. Clin Radiol. 2012;67(2):157–164. doi:10.1016/j.crad.2011.08.012
12. Ganeshan B, Abaleke S, Young RC, Chatwin CR, Miles KA. Texture analysis of non-small cell lung cancer on unenhanced computed tomography: initial evidence for a relationship with tumour glucose metabolism and stage. Cancer Imaging. 2010;10(1):137–143. doi:10.1102/1470-7330.2010.0021
13. Gevaert O, Xu J, Hoang CD, et al. Non-small cell lung cancer: identifying prognostic imaging biomarkers by leveraging public gene expression microarray data–methods and preliminary results. Radiology. 2012;264(2):387–396. doi:10.1148/radiol.12111607
14. Fave X, Zhang L, Yang J, et al. Delta-radiomics features for the prediction of patient outcomes in non-small cell lung cancer. Sci Rep. 2017;7(1):588. doi:10.1038/s41598-017-00665-z
15. Fried DV, Tucker SL, Zhou S, et al. Prognostic value and reproducibility of pretreatment CT texture features in stage III non-small cell lung cancer. Int J Radiat Oncol Biol Phys. 2014;90(4):834–842. doi:10.1016/j.ijrobp.2014.07.020
16. Ahn SY, Park CM, Park SJ, et al. Prognostic value of computed tomography texture features in non-small cell lung cancers treated with definitive concomitant chemoradiotherapy. Invest Radiol. 2015;50(10):719–725. doi:10.1097/RLI.0000000000000174
17. Kirienko M, Cozzi L, Antunovic L, et al. Prediction of disease-free survival by the PET/CT radiomic signature in non-small cell lung cancer patients undergoing surgery. Eur J Nucl Med Mol Imaging. 2018;45(2):207–217. doi:10.1007/s00259-017-3837-7
18. Ahn HK, Lee H, Kim SG, Hyun SH. Pre-treatment 18F-FDG PET-based radiomics predict survival in resected non-small cell lung cancer. Clin Radiol. 2019;74(6):467–473. doi:10.1016/j.crad.2019.02.008
19. Harmon S, Seder CW, Chen S, Traynor A, Jeraj R, Blasberg JD. Quantitative FDG PET/CT may help risk-stratify early-stage non-small cell lung cancer patients at risk for recurrence following anatomic resection. J Thorac Dis. 2019;11(4):1106–1116. doi:10.21037/jtd.2019.04.46
20. Nakajo M, Jinguji M, Shinaji T, et al. A pilot study of texture analysis of primary tumor [18F]FDG uptake to predict recurrence in surgically treated patients with non-small cell lung cancer. Mol Imaging Biol. 2019;21(4):771–780. doi:10.1007/s11307-018-1290-z
21. Cook GJ, O’Brien ME, Siddique M, et al. Non-small cell lung cancer treated with erlotinib: heterogeneity of (18)F-FDG uptake at PET-association with treatment response and prognosis. Radiology. 2015;276(3):883–893. doi:10.1148/radiol.2015141309
22. Fried DV, Mawlawi O, Zhang L, et al. Stage III non-small cell lung cancer: prognostic value of FDG PET quantitative imaging features combined with clinical prognostic factors. Radiology. 2016;278(1):214–222. doi:10.1148/radiol.2015142920
23. Pyka T, Bundschuh RA, Andratschke N, et al. Textural features in pre-treatment [F18]-FDG-PET/CT are correlated with risk of local recurrence and disease-specific survival in early stage NSCLC patients receiving primary stereotactic radiation therapy. Radiat Oncol. 2015;10:100. doi:10.1186/s13014-015-0407-7
24. Liu W, Sun X, Qi Y, et al. Integrated texture parameter of 18F-FDG PET may be a stratification factor for the survival of nonoperative patients with locally advanced non-small-cell lung cancer. Nucl Med Commun. 2018;39(8):732–740. doi:10.1097/MNM.0000000000000860
25. Ha S, Choi H, Cheon GJ, et al. Autoclustering of non-small cell lung carcinoma subtypes on (18)F-FDG PET using texture analysis: a Preliminary result. Nucl Med Mol Imaging. 2014;48(4):278–286. doi:10.1007/s13139-014-0283-3
26. Fang YH, Lin CY, Shih MJ, et al. Development and evaluation of an open-source software package “CGITA” for quantifying tumor heterogeneity with molecular images. Biomed Res Int. 2014;2014:248505. doi:10.1155/2014/248505
27. Kohutek ZA, Wu AJ, Zhang Z, et al. FDG-PET maximum standardized uptake value is prognostic for recurrence and survival after stereotactic body radiotherapy for non-small cell lung cancer. Lung Cancer. 2015;89(2):115–120. doi:10.1016/j.lungcan.2015.05.019
28. Domachevsky L, Groshar D, Galili R, Saute M, Bernstine H. Survival prognostic value of morphological and metabolic variables in patients with stage I and II non-small cell lung cancer. Eur Radiol. 2015;25(11):3361–3367. doi:10.1007/s00330-015-3754-8
29. Hattori A, Matsunaga T, Takamochi K, Oh S, Suzuki K. Clinical significance of positron emission tomography in subcentimeter non-small cell lung cancer. Ann Thorac Surg. 2017;103(5):1614–1620. doi:10.1016/j.athoracsur.2016.09.059
30. Lopci E, Toschi L, Grizzi F, et al. Correlation of metabolic information on FDG-PET with tissue expression of immune markers in patients with non-small cell lung cancer (NSCLC) who are candidates for upfront surgery. Eur J Nucl Med Mol Imaging. 2016;43(11):1954–1961. doi:10.1007/s00259-016-3425-2
31. Kim E, Wu HG, Keam B, et al. Significance of 18F-FDG PET parameters according to histologic subtype in the treatment outcome of stage III Non-small-cell lung cancer undergoing definitive concurrent chemoradiotherapy. Clin Lung Cancer. 2019;20(1):e9–e23. doi:10.1016/j.cllc.2018.08.018
32. Koh YW, Lee SJ, Park SY. Differential expression and prognostic significance of GLUT1 according to histologic type of non-small-cell lung cancer and its association with volume-dependent parameters. Lung Cancer. 2017;104:31–37. doi:10.1016/j.lungcan.2016.12.003
33. Desseroit MC, Visvikis D, Tixier F, et al. Development of a nomogram combining clinical staging with (18)F-FDG PET/CT image features in non-small-cell lung cancer stage I-III [published correction appears in Eur J Nucl Med Mol Imaging. 2016 Sep;43(10):1933]. Eur J Nucl Med Mol Imaging. 2016;43(8):1477–1485. doi:10.1007/s00259-016-3325-5
34. Takeda K, Takanami K, Shirata Y, et al. Clinical utility of texture analysis of 18F-FDG PET/CT in patients with stage I lung cancer treated with stereotactic body radiotherapy. J Radiat Res. 2017;58(6):862–869. doi:10.1093/jrr/rrx050
35. Lovinfosse P, Janvary ZL, Coucke P, et al. FDG PET/CT texture analysis for predicting the outcome of lung cancer treated by stereotactic body radiation therapy. Eur J Nucl Med Mol Imaging. 2016;43(8):1453–1460. doi:10.1007/s00259-016-3314-8
36. Cook GJ, Yip C, Siddique M, et al. Are pretreatment 18F-FDG PET tumor textural features in non-small cell lung cancer associated with response and survival after chemoradiotherapy? J Nucl Med. 2013;54(1):19–26. doi:10.2967/jnumed.112.107375
37. Ba-Ssalamah A, Muin D, Schernthaner R, et al. Texture-based classification of different gastric tumors at contrast-enhanced CT. Eur J Radiol. 2013;82(10):e537–e543. doi:10.1016/j.ejrad.2013.06.024
38. Tang X, Xu X, Han Z, et al. Elaboration of a multimodal MRI-based radiomics signature for the preoperative prediction of the histological subtype in patients with non-small-cell lung cancer. Biomed Eng Online. 2020;19(1):5. doi:10.1186/s12938-019-0744-0
39. Ferreira-Junior JR, Koenigkam-Santos M, Magalhães Tenório AP, et al. CT-based radiomics for prediction of histologic subtype and metastatic disease in primary malignant lung neoplasms. Int J Comput Assist Radiol Surg. 2020;15(1):163–172. doi:10.1007/s11548-019-02093-y
40. Hyun SH, Ahn MS, Koh YW, Lee SJ. A machine-learning approach using PET-based radiomics to predict the histological subtypes of lung cancer. Clin Nucl Med. 2019;44(12):956–960. doi:10.1097/RLU.0000000000002810
 © 2021 The Author(s). This work is published and licensed by Dove Medical Press Limited. The
full terms of this license are available at https://www.dovepress.com/terms
and incorporate the Creative Commons Attribution
- Non Commercial (unported, 3.0) License.
By accessing the work you hereby accept the Terms. Non-commercial uses of the work are permitted
without any further permission from Dove Medical Press Limited, provided the work is properly
attributed. For permission for commercial use of this work, please see paragraphs 4.2 and 5 of our Terms.
© 2021 The Author(s). This work is published and licensed by Dove Medical Press Limited. The
full terms of this license are available at https://www.dovepress.com/terms
and incorporate the Creative Commons Attribution
- Non Commercial (unported, 3.0) License.
By accessing the work you hereby accept the Terms. Non-commercial uses of the work are permitted
without any further permission from Dove Medical Press Limited, provided the work is properly
attributed. For permission for commercial use of this work, please see paragraphs 4.2 and 5 of our Terms.