")
Back to Journals » OncoTargets and Therapy » Volume 13
SRPX2 Promotes Cell Proliferation and Invasion in Osteosarcoma Through Regulating Hippo Signaling Pathway
Authors Wu Z, Wang C, Chen Y, Sun Z, Yan W
Received 1 August 2019
Accepted for publication 15 November 2019
Published 26 February 2020 Volume 2020:13 Pages 1737—1749
DOI https://doi.org/10.2147/OTT.S225602
Checked for plagiarism Yes
Review by Single anonymous peer review
Peer reviewer comments 2
Editor who approved publication: Prof. Dr. Nicola Silvestris
Zhiqiang Wu,1,2 Chunmeng Wang,1,2 Yong Chen,1,2 Zhengwang Sun,1,2 Wangjun Yan1,2
1Department of Musculoskeletal Oncology, Fudan University Shanghai Cancer Center, Shanghai 200032, People’s Republic of China; 2Department of Oncology, Shanghai Medical College, Fudan University, Shanghai 200032, People’s Republic of China
Correspondence: Wangjun Yan
Department of Musculoskeletal Oncology, Fudan University Shanghai Cancer Center, No. 270, Dongan Road, Xuhui District, Shanghai City 200032, People’s Republic of China
Tel/Fax +8621-55666668
Email [email protected]
Background/Purpose: Osteosarcoma (OS), a primary bone malignancy, is characterized by a high rate of metastasis. It has been found that Sushi repeat containing protein X-linked 2 (SRPX2) is involved in tumor cell proliferation, adhesion, invasion and migration. The current work aimed to explore the effect of SRPX2 on OS cell invasion and proliferation.
Methods: Immunohistochemistry (IHC), Western blotting and reverse transcription-polymerase chain reaction (RT-PCR) were used to detect the expression of the associated protein in OS tissues and cell lines. Cell counting kit-8 (CCK8), transwell and colony formation assays were used to determine cell viability, invasion, and proliferation, respectively. The in vivo tumorigenic ability of SRPX2 gene was determined using nude mouse tumorigenesis test.
Results: SRPX2 knockdown suppressed the viability, while SRPX2 overexpression increased the invasion and colony formation ability of the cells in vitro. In vivo experiments demonstrated that SRPX2 knockdown inhibited tumor growth and invasion as evidenced by decreased Ki67 and N-cadherin levels, and increased E-cadherin level. Downregulation of SRPX2 increased YAP phosphorylation resulting in reduced nuclear translocation to activate Hippo signaling pathway. The promotion of cell viability, colony-forming ability, and invasion, and the inhibition of CTGF, Cyr61, and Birc5 levels promoted by SRPX2 overexpression were reversed by YAP inhibition.
Conclusion: SRPX2 increased cell proliferation and invasion in osteosarcoma by activating Hippo signaling pathway.
Keywords: osteosarcoma, SRPX2, proliferation, invasion, Hippo signaling pathway
Introduction
Osteosarcoma (OS) is the most common osteoblastic malignancy among adolescents and children. OS can be classified into osteoblastic osteosarcoma, chondroblastic osteosarcoma and fibroblastic osteosarcoma,1 and is characterized by high malignancy grade, dismal prognosis, early local recurrence, and distant metastasis. Most of these patients have developed micro metastases in the lung and have dismally low 5-years survival rate.2 Currently, the main treatment modality for OS is still the surgery combined with chemotherapy, however the side effects of systemic chemotherapy are extensive, and generally results are some damage to various organs of the human body. In addition, the surgical treatment has a serious impact on limb function, and patients often find it difficult to accept the consequences.3 Metastasis of OS seriously affects the quality of life and prognosis for patients. Therefore, gene therapy has become the focus of intense research. However, its specific mechanism and the treatment options still need further study. The identification of effective therapeutic targets is one of the key issues that needs to be addressed in gene therapy.
Sushi repeat containing protein X-linked 2 (SRPX2) is a novel chondroitin sulfate proteoglycan originally identified as a downstream target of the E2A-HLF fusion gene molecule within leukemia cells and plays a crucial part in regulating cellular migration and adhesion in gastric cancer.4 Additionally, SRPX2 was reported to exert the key role during tumorigenesis in several studies. SRPX2 expression is upregulated in cell lines and tissues of human colorectal cancer (CRC).5 Down-regulating SRPX2 markedly inhibited CRC cell adhesion, proliferation, and metastasis.5 SRPX2 was also significantly upregulated in human glioblastoma tissue, and overexpressing SRPX2 promoted glioblastoma cell invasion and migration.6 However, the effect of SRPX2 in osteosarcoma has not been reported yet. Therefore, this work aimed to explore the effect of SRPX2 in osteosarcoma and understand its mechanism.
Materials and Methods
Tumor Specimens
Tumor and adjacent tissue specimens from 60 OS patients (mean age, 16.72 ± 3.91 years; 28 males and 32 females) were obtained between January 2015 and December 2018 at the Fudan University. The patients’ clinical information pertaining to the patients are listed in Table 1. Each patient was examined by two pathologists and OS was confirmed based on the histopathologic assessment. Following retrieval, each tissue specimen was snap-frozen within liquid nitrogen immediately and preserved at −80°C until further experimentation. The study protocol was approved by the ethics committee of the Fudan University. A written informed consent was obtained for each sample, which was then analyzed anonymously. This study was performed in accordance with the Declaration of Helsinki. A parent or legal guardian provided the written informed consent for any patient under the age of 18 years.
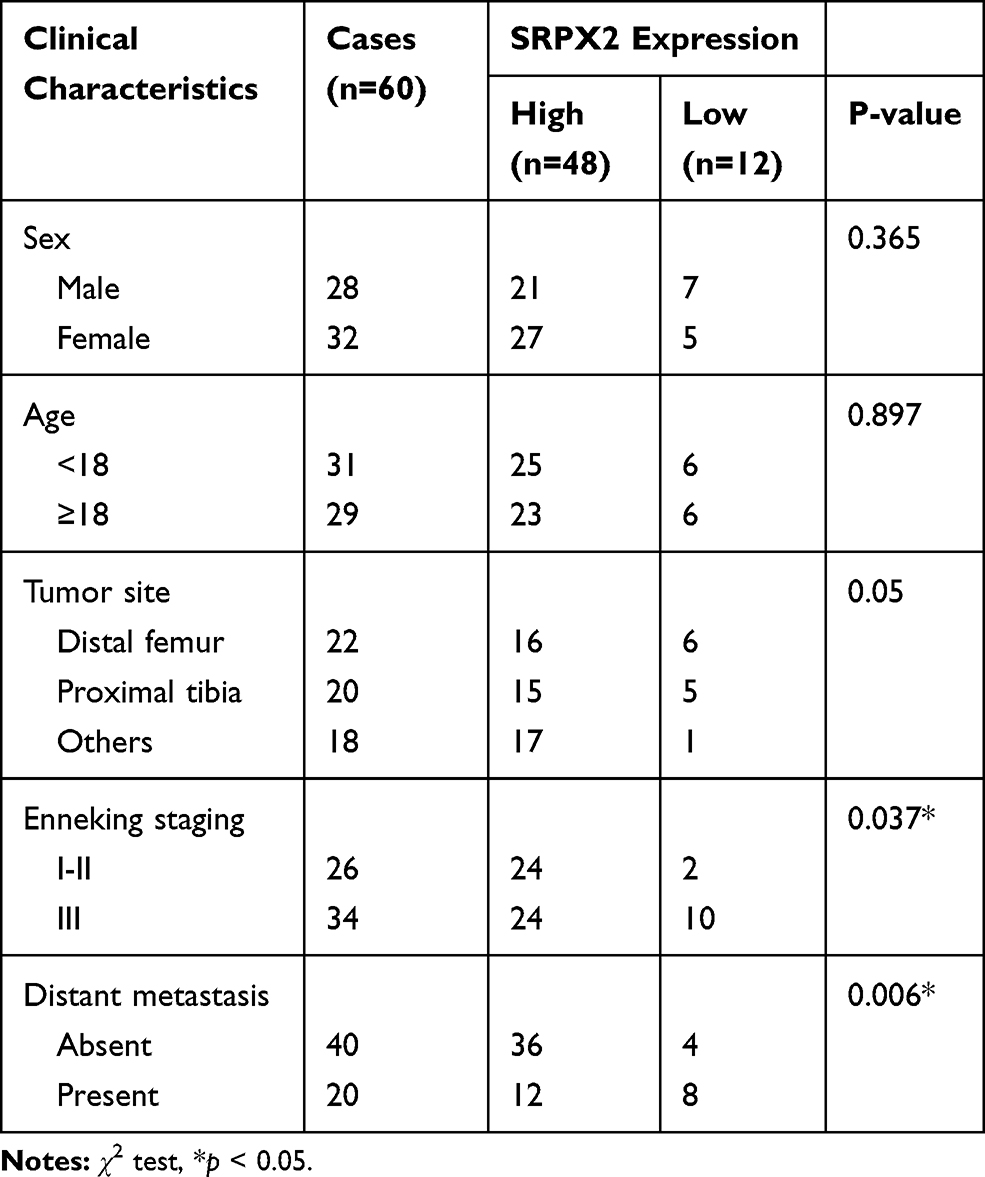 |
Table 1 Association Between SRPX2 Expression and Clinical Characteristics of Patients with Osteosarcoma |
Immunohistochemistry (IHC)
IHC staining was performed for each tumor specimen from human OS and nude mouse. Each section was subjected to overnight incubation with one of the following primary antibodies, including anti-SRPX2 (abcam; ab91584; 1:500 dilution), anti-Ki67 (abcam; ab16667; 1:500 dilution), anti-N-cadherin (abcam; ab202030; 1:500 dilution) and anti-E-cadherin (abcam; ab76055; 1:500 dilution), at 4°C. Then, each section was incubated in PBS (at pH=7.4) and washed with PBS for thrice. Subsequently, each section was incubated with the goat anti-rabbit immunoglobulin G secondary antibody (1:1,000; cat. no. BS10043; Bioworld Technology, Inc.) was added into each section incubate at ambient temperature for 60 min. The Olympus BX51 light microscope (Olympus Corporation; magnification, ×100 and ×200) was used to examine the sections following IHC staining. All specimens were then assigned with scores based on the cytoplasmic staining intensity (with, 0 indicating no staining; 1 indicating weak staining, 2 suggesting moderate staining, and 3 representing strong staining), and the extent of stained cells (0 indicating 0%, 1 suggesting 1–24%, 2 representing 25–49%, 3 was indicating of 50–74%, and 4 for 75–100%). Moreover, the intensity score was multiplied with the score of the stained cell extent to determine the eventual immunoreactive score, which ranged from 0 (minimal) to 12 (maximal). In addition, 0, 1–6, and ≥8 points were defined as negative, weak positive, and strong positive expression, separately. Each experiment was carried out in triplicate.
Cell Lines and Cell Culture
143B, U2OS, MG63, and Saos-2 cells were provided by Bena Culture Collection Biotechnology Co., Ltd., (Beijing, China). hFOB1.19 cells were obtained from Procell (Wuhan, China). Saos-2, MG63, hFOB1.19 and U2OS cells were cultivated within the Dulbecco’s Modified Eagle Medium (DMEM, BD, USA) containing fetal bovine serum (FBS, 10%, Hyclone, Logan, UT, USA). The RMPI1640 medium containing 10% FBS was used to the 143B cells. All cells were cultivated at 37°C in an incubator under CO2 atmosphere.
Cell Transfection
SRPX2 and YAP that were silenced were achieved using small interfering RNA (siRNA). The siRNAs were designed by Genepharma Inc. (Shanghai, China). SRPX2 and the negative control siRNA sequences are shown below: si-SRPX2#1 (5ʹ-GGAUGAAAGCUACAAUGAA-3ʹ (sense)), si-SRPX2#2 (5ʹ-GGAUGAAAGCUACAAUGAA-3ʹ (sense)), and si-YAP (5ʹ-CCGGGAUGUCUCAGGAAUU-3ʹ (sense)). Transient transfection was carried out with fluorescence-labeled siRNAs using Lipofectamine 2000 (Invitrogen, CA, United States) according to the manufacturer’s protocol.
The sequence of primers used for the human SRPX2 gene (NCBI_NM_014467.3) was as follows, 5ʹ-GCCAGTCAGCTAACTCAAAGAG-3ʹ (reverse) and 5ʹ-TCACTCGCATATGTCCCTTTGCTC-3ʹ-3ʹ (forward). The human SRPX2 gene was cloned into the pcDNA3.1-GFP expression vector (GenSscript Biotechnology, China). Cells were plated and grown until 70% confluence, followed by transient transfection with specific vector using the Lipofectamine 2000 according to the manufacturer’s protocol. Empty pcDNA3.1-GFP vector was used as the negative control. The transfection efficiency was observed under a fluorescence microscope after 48 h of culture.
Cell Grouping
Cells were divided into eight groups: negative control (NC) group: negative control siRNAs were transfected into U2OS and 143B cells; SRPX2-knockdown (KD)1 group: siRNA-SRPX2#1 was transfected into U2OS and 143B cell; SRPX2-KD2 group: siRNA-SRPX2#2 was transfected into 143B and U2OS cells; Control (CTRL) group: empty pcDNA3.1 vectors were transfected into Saos2 and Mg63 cells; SRPX2-overexpression (OE) group: pcDNA3.1-SRPX2 was transfected into Saos2 and Mg63 cells; YAP-KD group: siRNA-YAP was transfected into Saos2 cells; SRPX2-OE+ YAP-KD group: pcDNA3.1-SRPX2 and siRNA-YAP- were co-transfected into Saos2 cells; SRPX2-OE+Peptide 17: after Saos2 cells were pre-treated with 10 nM of Hippo inhibitor (Peptide 17; Selleck Chemicals, USA) for 4 h, pcDNA3.1-SRPX2 was transfected into Saos2 cells.
Cell Viability Assay
CCK8 was used to determine cell viability in each group. Cells (1×10⁵ cells/well) were planted into the 96-well plates and cultured for 24 hrs. Then, the cell viability was determined using the CCK8 assay (MedChemExpress, New Jersey, USA). Cells from the respective groups were cultured for an additional 24, 48, 72 and 96 hrs. Later, CCK8 solution (10 μL) was added and cells treated for 4 h at 37°C. Subsequently, the absorbance was read at a wavelength of 450 nm using an iMark microplate absorbance reader (Bio-Rad Laboratories, Inc., Hercules, CA, USA) for obtaining the growth curve. Each experiment was carried out in triplicate.
Colony Forming Assay
Following trypsin digestion, the RPMI1640 medium was added to the cells. Then, the cell suspension was plated in the culture dish at 1×10³ cells/well. The culture dishes were incubated for 2 weeks at 37°C in an incubator with 5% CO2. Incubation was terminated when the cell colonies became visible. Thereafter, the supernatant was removed, and cells were washed with PBS followed by fixation in 4% paraformaldehyde (Beyotime, Shanghai, China) for 15 min. The cells were then air-dried after staining with 0.1% crystal violet (Beyotime, Shanghai, China) for 15 min. Subsequently, the number of cell colonies formed were calculated. Each experiment was carried out in triplicate.
Transwell Assay
Cells from the different groups were suspended within the serum-free medium, followed by pancreatin digestion. The cell number of cells were counted and 200 μL of the cell suspension (including 5 × 10³ cells) was added into the upper chamber, while 500μL DMEM supplemented with 10% FBS was added into the lower chamber of the transwell chamber (Corning, New York, USA). Thereafter, the cells were incubated a humidified incubator at 37°C for 24 hrs. The cells that have penetrated the transwell chamber were rinsed, followed by 4% formaldehyde fixation and staining with 0.1% crystal violet (Beyotime). The invading cells were observed with a microscope (Olympus Corporation, Japan) and counted. Each experiment was carried out in triplicate.
Tumor Xenograft Assay
Female Balb/c nude mice (4-week-old) weighing 16–22 g were provided by Nanjing Junke Biological Engineering Co. Ltd. (Jiangsu, China). All of the in vivo experimental protocols were approved by the Animal Care and Use Committee of Fudan University. The procedures were performed according to the guidelines and regulations of the Animal Care and Use Committee of the Fudan University (Shanghai, China). All animals were raised in pathogen-free conditions and maintained with 12:12 hrs light/dark cycle at a temperature of 24–28°C and humidity of 40–60%. Mice could drink water and eat food freely. Sixteen nude mice were used in this experimental study. The Mice were randomly divided into 4 groups (4 mice/group), and 2×10⁶ siRNA-SRPX2 transfected U2OS cells or pcDNA3.1-SRPX2 transfected Mg63 cells were subcutaneously injected into the right armpit of the mice. The body weight and tumor size of the mice were measured using an electronic scale and vernier caliper, respectively, every 2 days. The mice were sacrificed after 21 days and the expression of SRPX2 (abcam; ab91584), Ki67 (abcam; ab16667), E-cadherin (abcam; ab76055) and N-cadherin (abcam; ab202030) were analyzed in tumors by IHC staining.
RNA Isolation and RT-PCR Assay
The total cellular RNA was extracted using Trizol reagent (Invitrogen, Carlsbad, CA, USA), and then transcribed into cDNA using PrimeScript® RT reagent Kit (Takara, RR047A, Dalian, China) according to the manufacturer’s instructions. The SYBR® Premix Ex Taq™ II (Takara, RR820A, Dalian, China) was used to carry out qPCR a real-time PCR machine (Light Cycler 96, Roche) using the two-stage program variables shown below: preincubation at 95°C for 60s, followed by 5 s at 95°C and 30 s at 60°C for 40 cycles. All the results are shown as target mRNA levels normalized to the housekeeping gene, β-actin. The primer sequences used in the analysis are as follows: for SRPX2, 5ʹ- GGCACTTACACCTGCACAAA-3ʹ (forward); 5ʹ- CCTCCACTCCATCTCCCATC-3ʹ (reverse); for β-actin: 5ʹ-ACTCTTCCAGCCTTCCTTCC-3ʹ (forward); and 5ʹ-CAATGCCAGGGTACATGGTG −3ʹ (reverse). Each experiment was carried out in triplicate.
Western Blotting
The treated tissues or cells were subjected to lysis with ice-cold RIPA buffer (Beyotime, China) containing 1 mmol/L phenylmethylsulfonyl fluoride (PMSF; Beyotime). Cell lysate or tissue samples containing 20 μg of protein were separated using 8–12% sodium dodecyl sulfate-polyacrylamide gels electrophoresis (SDS-PAGE) wells for 0.5 h of electrophoresis at 80 V, followed by 1 h at 120 V. The proteins were transferred onto the PVDF membranes (Millipore, Bedford, MA), that were blocked using the 5% skim milk at ambient temperature for 1.5 h, incubated with the TBST buffer for 15 min for thrice (15 min each) and then with the specific horseradish peroxidase (HRP)-conjugated secondary antibodies (1:10,000 dilution; Proteintech, Chicago, IL) for 1 h at ambient temperature. The proteins were detected using enhanced chemiluminescence reagents (NCM, China). The following primary antibodies were used in the current study, including anti-SRPX2 (ab91584; 1:800 dilution), anti-E-cadherin (ab76055; 1:500 dilution), anti-Ki67 (ab16667; 1:1000 dilution), anti-N-cadherin (ab202030; 1:800), anti-phospho-YAP (ab223126; 1:500 dilution), anti-YAP (ab56701; 1:1000 dilution), anti-lamin B (ab16048; 1:2000), and anti-β-actin (ab179467; 1:2500 dilution) (Abcam, Cambridge, UK). β-actin was used as the loading control for the cytoplasm, while lamin B was used as the loading control for the nucleus. Each experiment was carried out in triplicate.
Statistical Analysis
In this study, we defined log2(T/N) of relative SRPX2 expression > 0 as high expression. The correlations of SRPX2 expression with the clinicopathological features were examined using the χ2 test. The Kaplan-Meier method was used to plot the survival curves, while the Log-rank test was utilized for analysis. All values are presented as means ± standard deviation (SD). SPSS software was used for all statistical analyses. ANOVA followed by LSD test was carried out for multi-comparison, whereas the Students’ t test was used for comparisons between two distinct groups. The difference of p < 0.05 was deemed as statistically significant. “*” was identified as p < 0.05 and “**” was identified as p < 0.01.
Results
Upregulated Expression of SRPX2 Was Detected Within OS Cells and Tissues, and Was Strongly Associated with Poor Survival
A total of 60 sets of OS tissue and para-carcinoma tissue specimens were collected from our hospital. IHC staining revealed positive expression of SRPX2 mainly in the plasmalemma and cytolymph and the intensity of SRPX2 expression was higher in the tumor group than in the normal group (Figure 1A) by IHC staining. As expected, SRPX2 expression was upregulated in OS tissues (Figure 1B–D). We also found that SRPX2 expression correlated with distant metastasis (p = 0.006) and enneking staging (p = 0.037) (Table 1). However, there was no correlation of SRPX2 expression with patient sex (p = 0.365), age (p = 0.897), or tumor site (p = 0.05, Table 1). According to the Kaplan-Meier assay, upregulated expression of SRPX2 was associated with dismal survival in patients (Figure 1E). Furthermore, Western blotting and RT-PCR results revealed low expression of SRPX2 expression within the OS cell lines (Figure 1F–H). Our results indicated higher SRPX2 expression in 143B and U2OS cell lines compared to that in Saos2 and Mg63 cell lines.
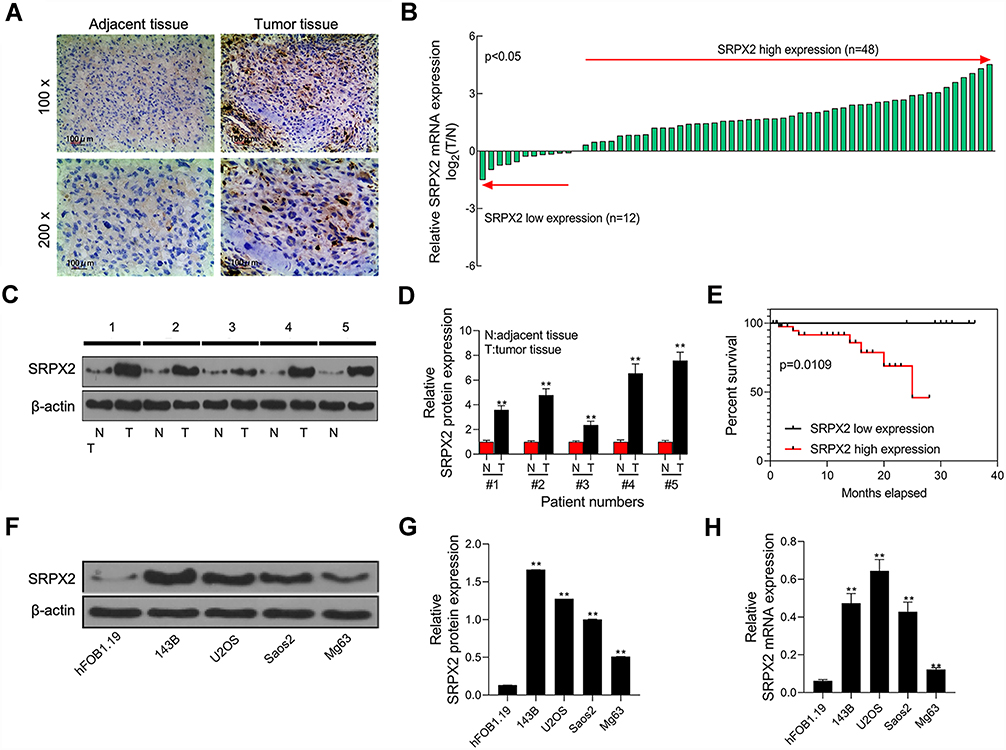 |
Figure 1 Expression level of SRPX2 was significantly increased in OS tissues and cell lines and associated with poor prognosis. (A) SRPX2 expression in OS tissues and normal tissues was examined by immunohistochemical analysis; (B) the mRNA expression level of SRPX2 gene was detected by RT-PCR in OS tissues; (C and D) the protein expression level of SRPX2 gene was detected by Western blot assay in OS tissues of 5 patients; (E) Kaplan-Meier survival analysis was performed to investigate the relationship between SRPX2 low expression and SRPX2 high expression; (F and G) the protein expression level of SRPX2 gene was detected by Western blot assay in OS cell lines; (H) the mRNA expression level of SRPX2 gene was detected by RT-PCR assay in OS cell lines. β-actin was used as a load control. Each experiment was carried out in triplicate. Data are presented as the mean ± standard deviation. **p<0.05 versus Normal group/or hFOB1.19 group. |
SRPX2 Regulated Cell Growth and Invasion in vitro
The transfection efficiency of siRNA-SRPX2 or pcDNA3.1-SRPX2 in the OS cells was determined using Western blotting and RT-PCR assays. We found that in the presence of si-SRPX2#1 or si-SRPX2#2, the protein and mRNA levels of SRPX2 were markedly decreased in the U2OS and 143B cell lines (Figure 2A). Similarly, with SRPX2 overexpression, the protein and mRNA levels of SRPX2 were markedly increased in the Saos2 and Mg63 cell lines (Figure 2B). As shown in Figure 2C and D, the transfection efficiency of si-SRPX2#1 or si-SRPX2#2 was <30% and the transfection efficiency of SRPX2 overexpression construct was > 85%. These results showed that si-SRPX2#1 or si-SRPX2#2 and pcDNA3.1-SRPX2 were successfully transfected into the OS cell lines. The results of the CCK8 analysis showed that SRPX2 knockdown (KD) decreased the viability of 143B and U2OS cells, while SRPX2 overexpression (OE) promoted the viability of Mg63 and Saos2 cells (Figure 3A and B). The colony-forming ability and invasion ability were reduced in the 143B and U2OS cells following SRPX2 KD (Figure 3C and D). Similarly, the colony-forming ability and invasion ability were further promoted in the Mg63 and Saos2 cells following SRPX2 OE, detected using colony formation and transwell assays (Figure 3E and F).
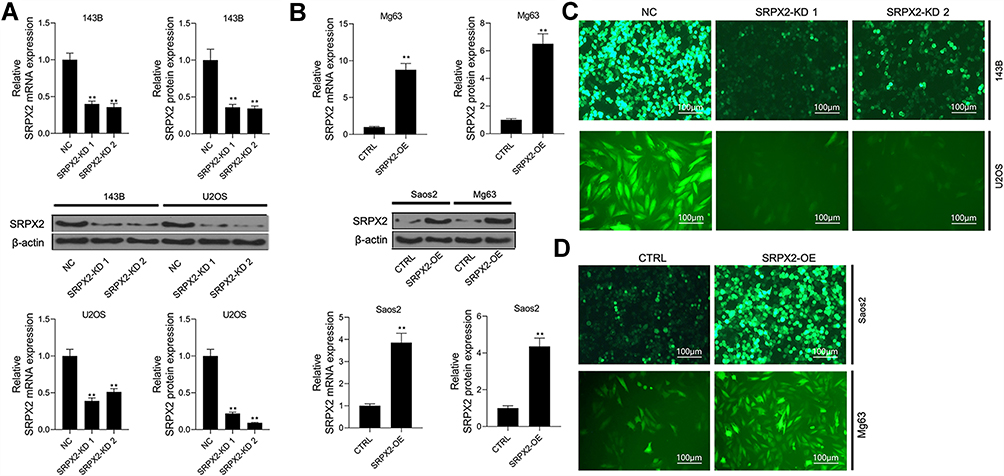 |
Figure 2 The transfection efficiency was determined in cells with SRPX2-KD or SRPX2-OE. (A) SRPX2 protein and mRNA level of SRPX2-KD1 and SRPX2-KD2 groups in 143B and U2OS cells were detected by Western blot and RT-PCR assay; (B) SRPX2 protein and mRNA level of SRPX2-OE group in Mg63 and Saos2 cells were detected by Western blot and RT-PCR assay; (C) Transfection efficiency of SRPX2 inhibition in 143B and U2OS cells; (D) Transfection efficiency of SRPX2 overexpression in Saos2 and Mg63 cells. β-actin was used as a load control. Each experiment was carried out in triplicate. Data are presented as the mean ± standard deviation. **p<0.05 versus NC group/or CTRL group. |
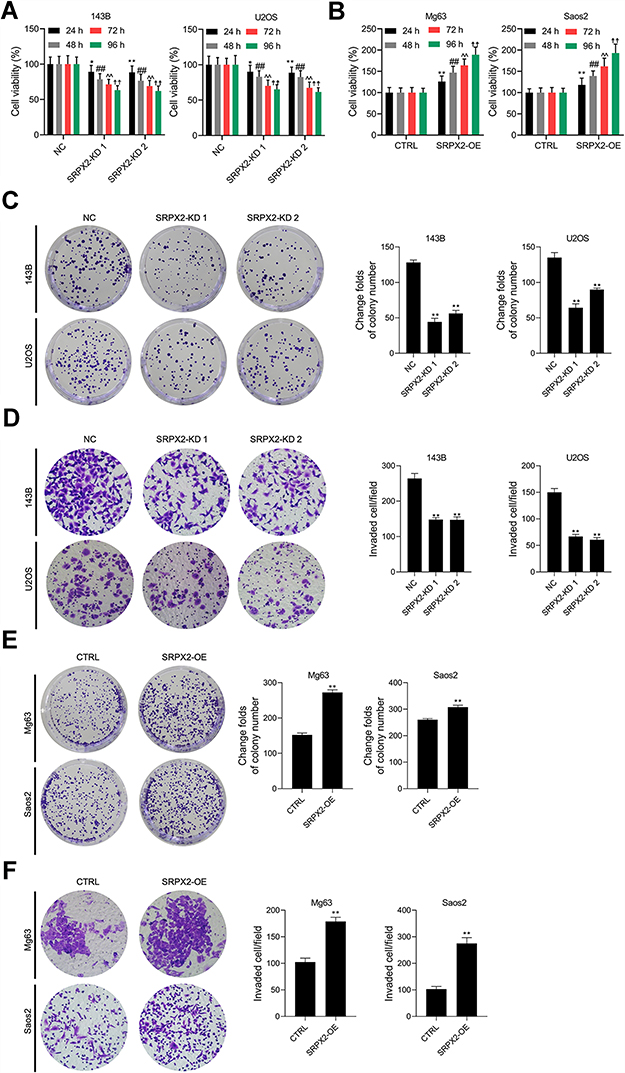 |
Figure 3 SRPX2 regulated the proliferation and invasion of OS cells. After 143B and U2OS cells were transfection with SRPX2-KD 1 or SRPX2-KD2 and Mg63 and Saos2 cells were transfection with SRPX2-OE, (A) the cell viability was detected by CCK8 assay in 143B and U2OS cells with SRPX2-KD 1 or SRPX2-KD2; (B) the cell viability was detected by CCK8 assay in Mg63 and Saos2 cells with SRPX2-OE; (C) the ability of cell proliferation of 143B and U2OS cells with SRPX2-KD 1 or SRPX2-KD2 was detected by colony formation; (D) the ability of invasion of 143B and U2OS cells with SRPX2-KD 1 or SRPX2-KD2 was detected by transwell assay; (E) the ability of cell proliferation of Mg63 and Saos2 cells with SRPX2-OE was detected by colony formation; (F) the ability of invasion of Mg63 and Saos2 cells with SRPX2-OE was detected by transwell assay. Each experiment was carried out in triplicate. Data are presented as the mean ± standard deviation. *p<0.05 versus NC group, **p<0.01 versus NC group/or CTRL group at 24 h, ##p<0.01 versus NC group/or CTRL at 48 h, ^^p<0.01 versus NC group/or CTRL at 72 h and ††p<0.01 versusNC group/or CTRL at 96 h. |
SRPX2 Knockdown Inhibited Tumorigenesis in vivo
Compared to the NC group, SRPX2 KD dramatically repressed subcutaneous tumor growth (Figure 4A). In the SRPX2 KD 1 group, the tumor volume was markedly reduced relative to that in the NC group (Figure 4B). On day 21, the nude mice were sacrificed and the tumor were removed and weighed. In the SRPX2 KD 1 group, the tumor weight was markedly reduced relative to that in NC group (Figure 4C). The expression of SRPX2, Ki67, N-cadherin, and E-cadherin expression was analyzed by IHC. The results demonstrated that the expression of SRPX2, Ki67, and N-cadherin was markedly reduced following SRPX2 KD (Figure 4D). IHC further revealed that SRPX2 KD significantly increased the expression of E-cadherin (Figure 4D).
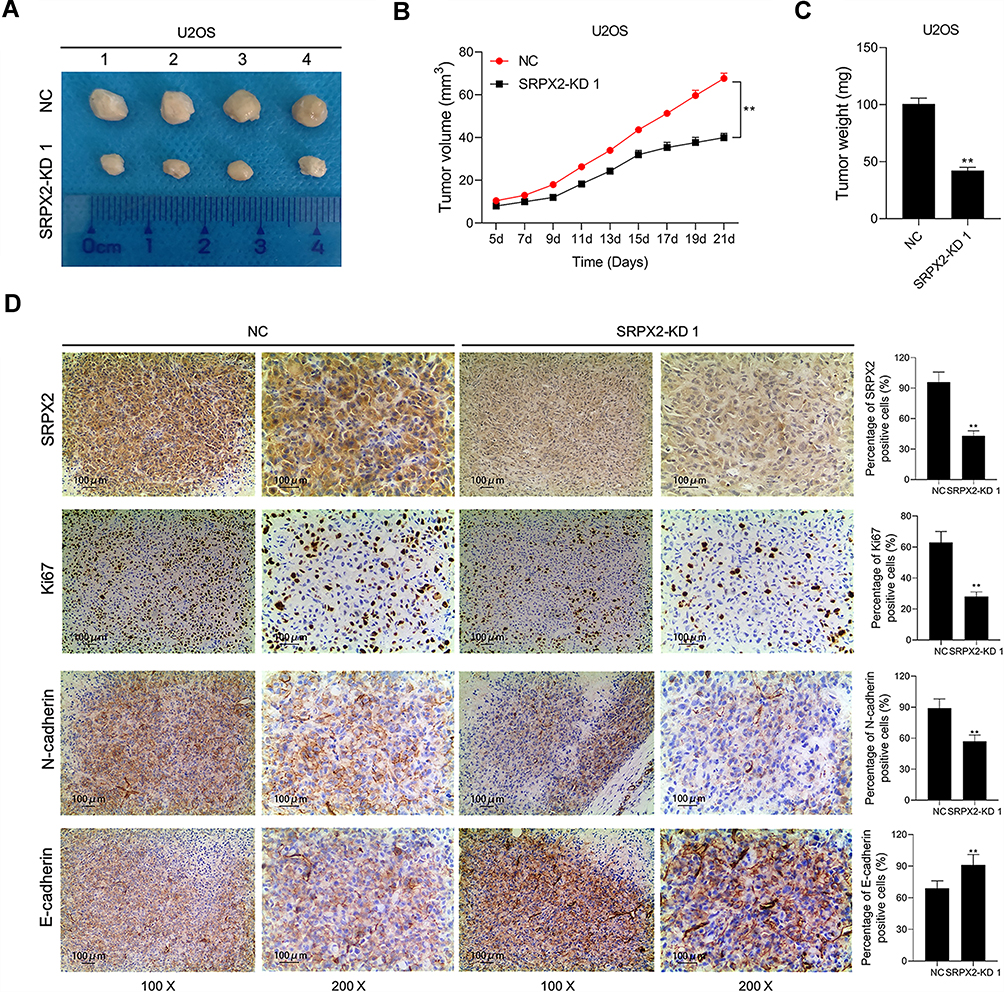 |
Figure 4 SRPX2 KD inhibited tumor growth of OS in vivo. U2OS cells treated with SRPX2 KD or siRNA-NC were subcutaneously injected into the flank of the nude mice. (A) The nude mice were sacrificed and the tumors were collected after 21 days; (B) the volume of the tumors was determined every 2 days; (C) the weight of the tumors was determined; (D) SRPX2, Ki67, N-cadherin and E-cadherin protein expression in the tumors collected from different groups were determined using immunohistochemistry assays. Each experiment was carried out in triplicate. Data are presented as the mean ± standard deviation. **p<0.05 versus NC group. |
SRPX2 Overexpression Promoted Tumorigenesis in vivo
In vivo experiments, SRPX2 OE significantly upregulated subcutaneous tumor growth in vivo (Figure 5A). In the SRPX2 OE group, the tumor volume was significantly larger compared to that in the CTRL group (Figure 5B). On day 21, the nude mice were sacrificed and the tumors were removed and weighed. In the SRPX2 OE group, the tumor weight was markedly higher compared with that in the CTRL group (Figure 5C). The expressions of SRPX2, Ki67, N-cadherin, and E-cadherin were analyzed by IHC. The results demonstrated that the expression of SRPX2, Ki67, and N-cadherin was notably increased following SRPX2 OE (Figure 5D). IHC also revealed that SRPX2 OE significantly decreased the expression of E-cadherin (Figure 5D).
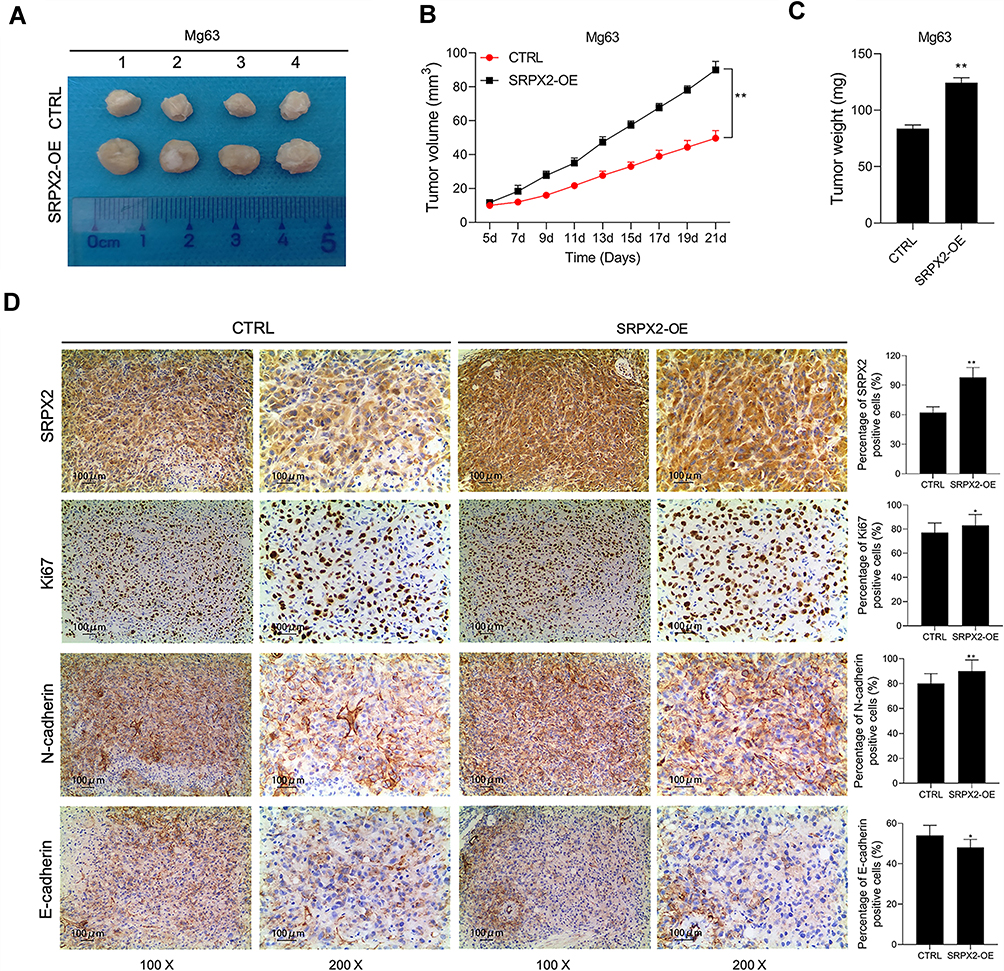 |
Figure 5 SRPX2 OE promoted tumor growth of OS in vivo. Mg63 cells treated with SRPX2 OE or vector were subcutaneously injected into the flank of the nude mice. (A) The nude mice were sacrificed and the tumors were collected after 21 days; (B) the volume of the tumors was determined every 2 days; (C) the weight of the tumors was determined; (D) SRPX2, Ki67, N-cadherin and E-cadherin protein expression in the tumors collected from different groups were determined using immunohistochemistry assays. Each experiment was carried out in triplicate. Data are presented as the mean ± standard deviation. **p<0.01 versus CTRL group and *p<0.05 versus CTRL group. |
Downregulation of SRPX2 Reduced Nuclear Translocation of YAP by Enhancing the Phosphorylation of YAP to Activate the Hippo Signaling Pathway in vitro
SRPX2 KD increased the phosphorylation of YAP and decreased the protein level of YAP in 143B and U2OS cells (Figure 6A). In addition, both SRPX2 KD 1 and SRPX2 KD 2 down-regulated SRPX2 levels in cytoplasm and nucleus within 143B and U2OS cell lines (Figure 6B).
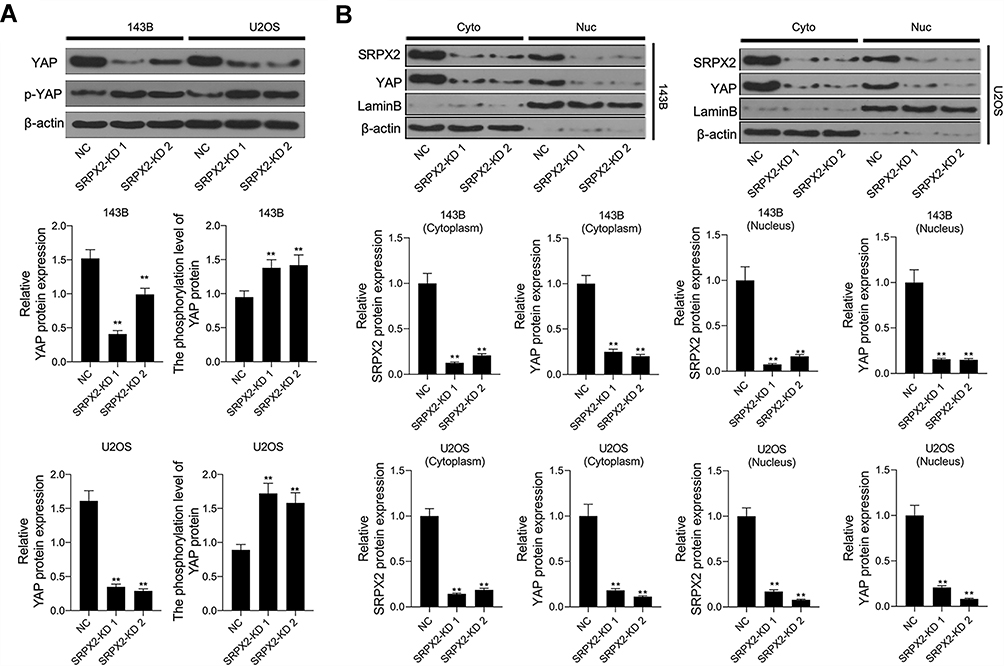 |
Figure 6 SRPX2 regulated the nuclear translocation of YAP. After 143B and U2OS cells were transfection with SRPX2-KD 1 or SRPX2-KD2, (A) the protein level of YAP and the phosphorylation level of YAP in 143B and U2OS cells with SRPX2-KD 1 or SRPX2-KD2 were detected by Western blot assay; (B) the protein level of YAP and SRPX2 in cytoplasm and nucleus of 143B and U2OS cells with SRPX2-KD 1 or SRPX2-KD2 were detected by Western blot assay. β-actin and lamin B were used as load control. Each experiment was carried out in triplicate. Data are presented as the mean ± standard deviation. **p<0.01 versus CTRL group/or NC group. |
Hippo Signaling Pathway Inhibitor Abolished SRPX2-Mediated Proliferation and Invasion in vitro
Western blotting and RT-PCR assays revealed that the protein and mRNA levels of YAP were decreased following the transfection of Saos2 cells with si-YAP (Figure 7A). The cell viability of SRPX2-OE and YAP-KD co-transfected cells was lower than that of SRPX2-OE-transfected cells (Figure 7B). Colony formation and transwell assays revealed that the effect of SRPX2 OE in promoting cell proliferation and invasion were reversed by YAP KD or a Hippo inhibitor (peptide 17) (Figure 7C and D). In addition, SRPX2 OE inhibited the expressions of CTGF, Cyr61, and Birc5. The effect of SRPX2 OE in mediating the inhibition of CTGF, Cyr61, and Birc5 proteins was reversed by YAP KD or peptide 17 (Figure 7E).
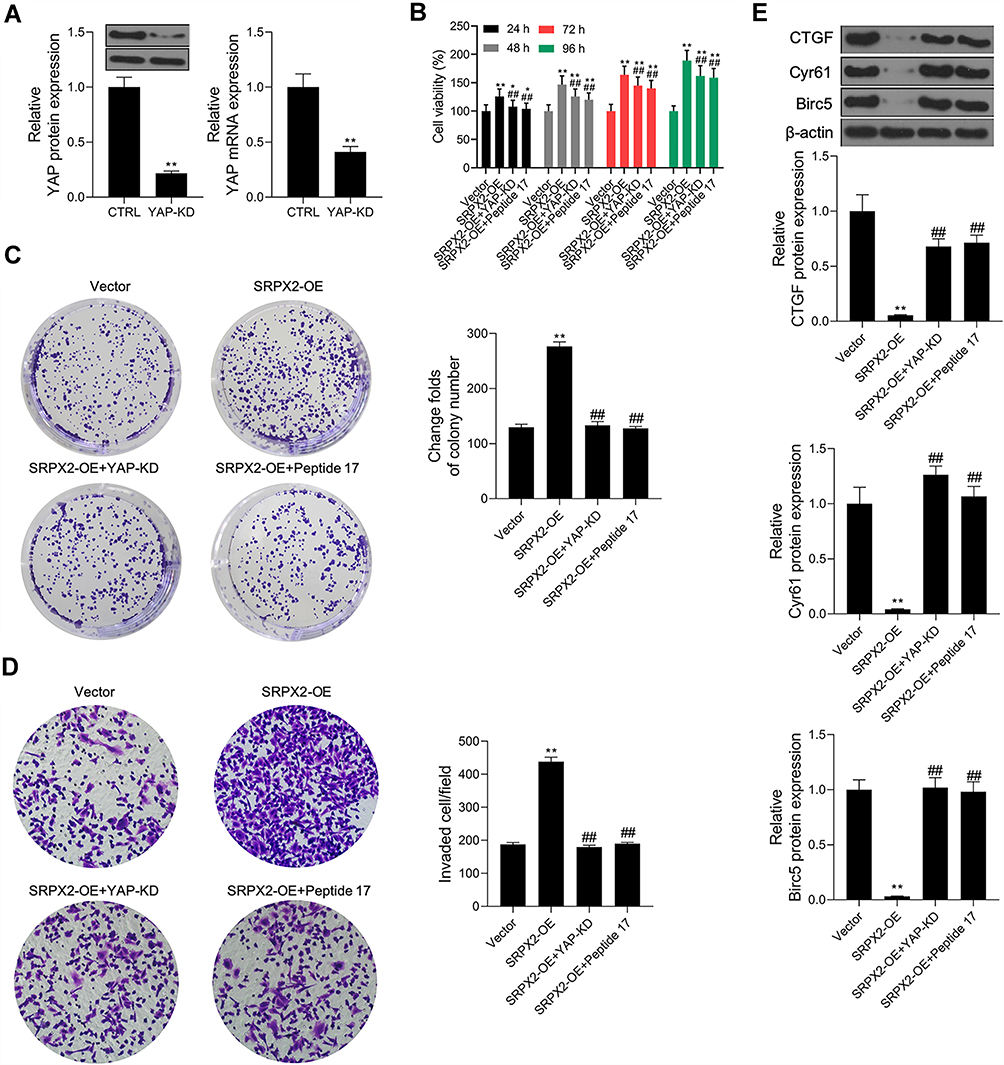 |
Figure 7 Hippo signaling pathway inhibitor abolished SRPX2-mediated proliferation and invasion in vitro. After Saos2 cells were pre-treated with 10 nM of Peptide 17 for 4 h, pcDNA3.1-SRPX2 was transfected into Saos2 cells, (A) YAP protein level was detected by Western blot assay; (B) cell viability was detected by CCK8 assay; (C) cell proliferation was detected by colony formation assay; (D) cell invasion was detected by transwell assay; (E) the protein levels of CTGF, Cyr61 and Birc5 were detected by Western blot assay. β-actin was used as a load control. Each experiment was carried out in triplicate. Data are presented as the mean ± standard deviation. **p<0.01 versus vector group, ##p<0.01 versus SRPX2-OE group, and *p<0.05 versus vector group. |
Discussion
Tumor proliferation and invasion, that are regulated by multiple genes, are essential for tumor metastasis to occur.7 SRPX2 is overexpressed in OS tissues and cells and is implicated in patient survival rate (Figure 1). SRPX2 has been reported to be involved in the migration of cells.8 Therefore, we further investigated the role and mechanism of SRPX2 in the proliferation and invasion of OS cells. In vitro experiments indicated that SRPX2 knockdown inhibited the viability, invasion and colony formation ability in 143B and U2OS cell lines, while SRPX2 overexpression promoted the viability, invasion and colony formation ability in Mg63 and Saos2 cell lines (Figures 2 and 3). These results suggested that SRPX2 regulates OS cell proliferation and invasion. The results of in vivo experiments indicated that SRPX2 knockdown inhibited the growth of tumors, while SRPX2 overexpression promoted tumor growth (Figures 4 and 5). The above results demonstrate that SRPX2 regulates the development and progression of OS.
Ki67 is a nuclear antigen with a molecular weight of 345 kDa and is closely associated with cell proliferation. Ki67 is expressed only in the nucleus of proliferating cells and reflects the proliferative activity of tumor cells.9 Ki67 has been reported to be significantly upregulated in a variety of tumor tissues and cells, such as lung,10 gastric,11 colon,12 ovarian,13 and OS.14 Our results are consistent with these reports. Ki67 expression was significantly suppressed by SRPX2 knockdown. The invasion of tumor cells into surrounding tissues is an intrinsic factor in tumor development and metastasis.15 N-cadherin and E-cadherin belong to the classical cadherin family.16 E-cadherin is an important adhesion molecule in cells that maintains the epithelial phenotype in cells. When E-cadherin expression is downregulated, it causes cytoskeletal changes and degradation of the basement membrane, which leads to loosening of cell junctions, which in turn promotes migration of tumor cell into the extracellular matrix. In contrast, N-cadherin is upregulated in epithelial tissues, further affecting epithelial cell morphology and behavior. Dynamic changes in N-cadherin and E-cadherin could reflect tumor invasion. It has been reported that the positive expression of N-cadherin in tumor tissues is upregulated in tumor tissues compared to that in the para-carcinoma tissues, while positive E-cadherin expression within tumor tissues is down-regulated in tumor tissues compared to that in the para-carcinoma tissues.17 According to our findings, SRPX2 knockdown significantly reduced the positive expression of N-cadherin and elevated the positive expression of E-cadherin in OS tissues. SRPX2 overexpression exerted the opposite effects of SRPX2 knockdown in OS. The above results demonstrated that SRPX2 knockdown could regulate the expression of the associated proteins and then inhibit tumor growth in OS.
Regulation of organ volume, maintenance of cell proliferation and apoptotic balance, maintenance of an undetermined internal environment, regulation of migration and invasion, and maintenance of stem cell self-renewal and pluripotency are the basic biological effects of Hippo signaling.18 Hippo signaling has been reported to be suppressed in a variety of tumors. Inactivation of the Hippo core kinase and overexpression of downstream transcriptional co-activators can promote cell proliferation and invasion, which can in turn cause malignant transformation of cells.19 The Hippo signal transduction pathway has been recognized as the novel signal transduction pathway to suppress tumorigenesis, and the Yes-associated protein 1 (YAP) is a core protein in this pathway.18 In mammals, the Hippo signal transduction is regulated by the main kinases that regulate YAP activity.20 When macrophage stimulating (Mst) 1/2 is activated by activation of Hippo signaling, Mstl/2 kinase and the scaffolding protein Savl form the complex that phosphorylates and activates Lats1/2 (Large tumor suppressor; LATS) kinase.21 Further, phosphorylated Lats1/2 is in combination with the scaffolding protein Mobl forms complex that phosphorylate YAP. Phosphorylation of S127 of YAP produces a 14-3-3 binding motif, leading to its retention cytoplasm through binding with the intracytoplasmic 14-3-3 proteins, resulting in decreased nuclear entry of YAP or further was phosphorylation by the proteasome pathway.
Activation of the Hippo signal transduction pathway can inhibit OS occurrence and progression. YAP, as the key protein downstream of the Hippo signal transduction pathway, is overexpressed in various tumors.20 YAP lacks DNA binding activity. Thus, YAP enters the non-phosphorylated state of the nucleus in an unphosphorylated state to bind to other transcription factors and exerts its biological effects.21 Intranuclear YAP binds to the transcription factor TEAD (TEA-domain) and promotes or represses the expression of TEAD target gene expression, including Cyr61, CTGF, and Birc5, thereby regulating various biological functions, such as cell growth, cell contact inhibition, control of tissue and organ size, and self-renewal of stem cells.22 Overexpressed YAP binds to TEAD thereby inhibiting activating the activation through the Hippo signaling pathway. Based on our findings, SRPX2 knockdown promotes YAP phosphorylation before inhibiting its nuclear translocation (Figure 6).
The above findings suggested that SRPX2 knockdown reduced the invasion and proliferation of OS cells by reducing the nuclear translocation of YAP and subsequent activation of the Hippo signaling pathway. Further, we found that YAP inhibition reversed the SRPX2 overexpression-mediated OS cell invasion and proliferation (Figure 7). Cysteine-rich 61 (Cyr61), connective tissue growth factor (CTGF), and baculoviral IAP repeat containing 5 (Birc5), are target genes of TEAD.23 Binding of YAP TEAD can upregulate the expression of growth factors, including CTGF, Cyr61, Birc5 and Ki67, which in turn cause cell proliferation.24 Our results indicate that SRPX2 overexpression inhibits the expression of CTGF, CYR61 and Birc5. SRPX2 overexpression suppressed CTGF, and the effects of Cyr61 and Birc5 expression were counteracted by YAP inhibition. The above results confirmed that SRPX2 overexpression promotes osteosarcoma growth and metastasis by inhibiting the activation of the Hippo signaling pathway activation.
In conclusion, SRPX2 was upregulated in osteosarcoma tissues and cells. SRPX2 is the upstream modulating factor of the Hippo signal transduction pathway transcription factors, which activates the transcriptional activity of YAP, thereby promoting osteosarcoma cell proliferation and invasion. SRPX2 may be a potential new target for osteosarcoma prevention and treatment.
Data Sharing Statement
The datasets used and/or analyzed during the present study are available from the corresponding author on reasonable request.
Ethics Approval and Consent to Participate
The Ethics Committee of Fudan University has approved our study protocol. All of the samples were obtained with Written informed consent was obtained for each sample, which was then anonymously analyzed. This work has been performed following the Declaration of Helsinki.
Disclosure
The authors declare that they have no conflicts of interest in this work.
References
1. Chaudhary M, Chaudhary SD. Osteosarcoma of jaws. J Oral Maxillofac Pathol. 2012;16(2):233–238. doi:10.4103/0973-029X.99075
2. Friebele JC, Peck J, Pan X, et al. Osteosarcoma: a meta-analysis and review of the literature. Am J Orthop. 2015;44(12):547–553.
3. Ottaviani G, Robert RS, Huh WW, et al. Functional, psychosocial and professional outcomes in long-term survivors of lower-extremity osteosarcomas: amputation versus limb salvage. Cancer Treat Res. 2009;152:421–436.
4. Tanaka K, Arao T, Maegawa M, et al. SRPX2 is overexpressed in gastric cancer and promotes cellular migration and adhesion. Int J Cancer. 2009;124(5):1072–1080. doi:10.1002/ijc.v124:5
5. Liu KL, Wu J, Zhou Y, et al. Increased Sushi repeat-containing protein X-linked 2 is associated with progression of colorectal cancer. Med Oncol. 2015;32(4):99. doi:10.1007/s12032-015-0548-4
6. Tang H, Zhao J, Zhang L, et al. SRPX2 enhances the epithelial-mesenchymal transition and temozolomide resistance in glioblastoma cells. Cell Mol Neurobiol. 2016;36(7):1067–1076. doi:10.1007/s10571-015-0300-9
7. Wang H, Wang G, Tian WL. MiR-126 inhibits the proliferation and invasion of gastric cancer by downregulation of IGF-1R. Chin J Oncol. 2019;41(7):508–515. doi:10.3760/cma.j.issn.0253-3766.2019.07.005
8. Lin X, Chang W, Wang Y, et al. SRPX2, an independent prognostic marker, promotes cell migration and invasion in hepatocellular carcinoma. Biomed Pharmacother. 2017;93:398–405.
9. Himuro T, Horimoto Y, Arakawa A, et al. Ki67 heterogeneity in estrogen receptor-positive breast cancers: which tumor type has the most heterogeneity? Int J Surg Pathol. 2016;24(2):103–107. doi:10.1177/1066896915605179
10. Grant L, Banerji S, Murphy L, et al. Androgen receptor and Ki67 expression and survival outcomes in non-small cell lung cancer. Horm Cancer. 2018;9(4):288–294. doi:10.1007/s12672-018-0336-7
11. Min KW, Kim DH, Son BK, et al. A high Ki67/BCL2 index could predict lower disease-free and overall survival in intestinal-type gastric cancer. Eur Surg Res. 2017;58(3–4):158–168. doi:10.1159/000448945
12. Li D, Xu X, Miao J, et al. MicroRNA-125a inhibits tumorigenesis by targeting Smurf1 in colorectal carcinoma. FEBS Open Bio. 2019;9(7):1305–1314. doi:10.1002/feb4.2019.9.issue-7
13. Shao Y, Liu X, Meng J, et al. MicroRNA-1251-5p promotes carcinogenesis and autophagy via targeting the tumor suppressor TBCC in ovarian cancer cells. Mol Ther. 2019;27:1653–1664. doi:10.1016/j.ymthe.2019.06.005
14. Mardanpour K, Rahbar M, Mardanpour S. Coexistence of HER2, Ki67, and p53 in osteosarcoma: a strong prognostic factor. N Am J Med Sci. 2016;8(5):210–214. doi:10.4103/1947-2714.183013
15. Diepenbruck M, Christofori G. Epithelial-mesenchymal transition (EMT) and metastasis: yes, no, maybe? Curr Opin Cell Biol. 2016;43:7–13.
16. Casal JI, Bartolome RA. Beyond N-Cadherin, Relevance of Cadherins 5, 6 and 17 in Cancer Progression and Metastasis. Int J Mol Sci. 2019;20(13):3373. doi:10.3390/ijms20133373
17. Wang L, Li K, Wang C, et al. miR-107 regulates growth and metastasis of gastric cancer cells via activation of the PI3K-AKT signaling pathway by down-regulating FAT4. Cancer Med. 2019;11:5264–5273.
18. Ansari D, Ohlsson H, Althini C, et al. The Hippo signaling pathway in pancreatic cancer. Anticancer Res. 2019;39(7):3317–3321. doi:10.21873/anticanres.13474
19. Varzavand A, Hacker W, Ma D, et al. alpha3beta1 integrin suppresses prostate cancer metastasis via regulation of the Hippo pathway. Cancer Res. 2016;76(22):6577–6587. doi:10.1158/0008-5472.CAN-16-1483
20. Boopathy GTK, Hong W. Role of Hippo pathway-YAP/TAZ signaling in angiogenesis. Front Cell Dev Biol. 2019;749.
21. Azad T, Ghahremani M, Yang X. The role of YAP and TAZ in angiogenesis and vascular mimicry. Cells. 2019;8(5):407. doi:10.3390/cells8050407
22. Zanconato F, Forcato M, Battilana G, et al. Genome-wide association between YAP/TAZ/TEAD and AP-1 at enhancers drives oncogenic growth. Nat Cell Biol. 2015;17(9):1218–1227. doi:10.1038/ncb3216
23. Hao F, Xu Q, Wang J, et al. Lipophilic statins inhibit YAP nuclear localization, co-activator activity and colony formation in pancreatic cancer cells and prevent the initial stages of pancreatic ductal adenocarcinoma in KrasG12D mice. PLoS One. 2019;14(5):e0216603. doi:10.1371/journal.pone.0216603
24. Al-Moujahed A, Brodowska K, Stryjewski TP, et al. Verteporfin inhibits growth of human glioma in vitro without light activation. Sci Rep. 2017;7(1):7602. doi:10.1038/s41598-017-07632-8
 © 2020 The Author(s). This work is published and licensed by Dove Medical Press Limited. The full terms of this license are available at https://www.dovepress.com/terms.php and incorporate the Creative Commons Attribution - Non Commercial (unported, v3.0) License.
By accessing the work you hereby accept the Terms. Non-commercial uses of the work are permitted without any further permission from Dove Medical Press Limited, provided the work is properly attributed. For permission for commercial use of this work, please see paragraphs 4.2 and 5 of our Terms.
© 2020 The Author(s). This work is published and licensed by Dove Medical Press Limited. The full terms of this license are available at https://www.dovepress.com/terms.php and incorporate the Creative Commons Attribution - Non Commercial (unported, v3.0) License.
By accessing the work you hereby accept the Terms. Non-commercial uses of the work are permitted without any further permission from Dove Medical Press Limited, provided the work is properly attributed. For permission for commercial use of this work, please see paragraphs 4.2 and 5 of our Terms.