Back to Journals » International Journal of Chronic Obstructive Pulmonary Disease » Volume 16
Sputum Protein Biomarkers in Airway Diseases: A Pilot Study
Authors Dasgupta A, Chakraborty R, Saha B, Suri H, Singh P, Raj A, Taneja B, Dash D, Sengupta S, Agrawal A
Received 17 February 2021
Accepted for publication 4 May 2021
Published 28 July 2021 Volume 2021:16 Pages 2203—2215
DOI https://doi.org/10.2147/COPD.S306035
Checked for plagiarism Yes
Review by Single anonymous peer review
Peer reviewer comments 3
Editor who approved publication: Prof. Dr. Richard Russell
Angira Dasgupta,1– 3 Rahul Chakraborty,1,2 Bodhisattwa Saha,1 Himanshi Suri,1 Praveen Singh,1,2 Anurag Raj,1,2 Bhupesh Taneja,1,2 Debasis Dash,1,2 Shantanu Sengupta,1,2 Anurag Agrawal1,2
1Institute of Genomics and Integrative Biology, New Delhi, India; 2Academy of Scientific and Innovative Research, CSIR-HRDG, Ghaziabad, Uttar Pradesh, 201002, India; 3B R Singh Hospital and Centre for Medical Education and Research, Kolkata, West Bengal, India
Correspondence: Angira Dasgupta
B R Singh Hospital and Centre for Medical Education and Research, Sealdah, Kolkata, West Bengal, India
Tel +91 9831517266
Email [email protected]
Background: Chronic mucous hypersecretion (CMH or chronic bronchitis) per se or when associated with chronic inflammatory airway diseases such as asthma or chronic obstructive pulmonary disease (COPD) has several adverse clinical consequences. The sputum fluid phase has several candidate proteins including mucins which have the potential of being therapeutic targets, but has not yet been explored in-depth. This study aimed at exploring the profile of sputum proteins in various airway diseases.
Methods: Sputum from thirty-one patients with various airway diseases was collected and the fluid phase analyzed by LC-MS/MS and subsequently by sequential window acquisition of all theoretical fragments ion spectra (SWATH) (n = 15) for protein quantitation. Hierarchical clustering and functional grouping were performed.
Results: A total of 185 proteins were quantitated by SWATH of which 21 proteins were identified which could distinguish between the clinical phenotypes by hierarchical clustering. Functional protein clustering revealed 4 groups: those that are inflammation related, oxidative stress related, mucin related and a cytoskeletal and calcium related group. The levels of eight proteins (Azurocidin1, Neutrophil defensin 3, Lactotransferrin, Calmodulin 3, Coronin1A, Mucin 5B, Mucin 5AC and BPI fold containing family B1) were significantly altered (relative to mean) in exacerbator prone subjects compared to nonexacerbators. Another simple but useful metric which emerged from this study was total protein concentration in sputum which was significantly higher in frequent exacerbators.
Conclusion: Sputum proteins can detect the various airway disease clinical phenotypes. Total protein concentration and eight other proteins are biomarkers for frequent exacerbators. The clinical and therapeutic implications of the functional groups of proteins need further evaluation.
Keywords: proteomics, chronic bronchitis, asthma, COPD, mucin, phenotyping
Introduction
Chronic airway diseases are diagnosed by spirometry to detect airflow limitation which may be reversible or irreversible to bronchodilators as in asthma and chronic obstructive pulmonary disease (COPD) respectively.1 The challenge is to diagnose the airway diseases such as chronic bronchitis (CB) or chronic mucus hypersecretion (CMH) which do not have airflow limitations and hence cannot be diagnosed by spirometry. Yet it is extremely crucial that CMH or CB is not under-diagnosed or under-treated. This is because CMH per se or when associated with other airway diseases has deleterious effects on the rate of decline of FEV1,2–4 number of exacerbations,3,5–8 rates of hospitalization,6–8 quality of life5–7 and mortality.9,10 Traditionally, the diagnosis of chronic bronchitis is based on somewhat arbitrary symptom (mucus hypersecretion) durations that are clearly amenable to bias and can even fail to differentiate CB from healthy subjects when symptoms are mild or absent.11 Intuitively, it can easily be realized that, being airway inflammatory diseases, measurements involving airway secretions (sputum) should be considered here. Unfortunately, it is not so.
Sputum or airway secretion consists of a cellular portion and a less explored fluid phase. Sputum quantitative assay or cellular counts is an established measure of airway inflammation which forms the central component of all chronic airway diseases and is associated with acute exacerbations.12 The fluid phase consists mainly of mucus which is a viscous, gel-like material consisting of various macromolecules, desquamated cells, inorganic salts, glycoproteins, and water.13 There are several proteins in sputum which have the potential to predict disease severity or phenotypes such as frequent exacerbators.14–21 Fundamentally, the majority of exacerbations are the result of uncontrolled airway inflammation and are associated with elevated protein levels in sputum. Amongst these proteins, mucins seem to be the closest to clinical translation. These are high molecular weight polydisperse glycoproteins produced by goblet cells of the airway epithelia and mucous cells of the submucosal glands, and are the major determinants of the characteristic gel-like property of mucus. Both the quality and quantity affects the rheological properties of sputum, which are crucial in achieving efficient mucociliary clearance.19 Improper mucociliary function predisposes to recurrent bacterial infections, acute exacerbations, loss of lung function, and increased morbidity in the long run.19,21 Despite these, clinical data on sputum proteins (including mucins) such as the measurement specifics and use as a biomarker in clinic patients are scanty and do not feature in any of the existing international guidelines.22–24 The potential of sputum proteins in general or a specific protein or combination of proteins as novel biomarkers has not been explored adequately in clinical trials.
In an attempt to explore sputum proteins in-depth, we chose to use SWATH-MS (sequential window acquisition of all theoretical fragment ion spectra).20–22 This technology has recently gained popularity in the respiratory space being a data-independent label-free method and ideally suited for complex samples such as sputum. An additional advantage is that unlike other methods, a single sample can be tested at any point of time making this technology clinic-friendly. There are only a few studies that have used this technology in sputum so far.19,20,22,25 Unfortunately, these studies have different methodologies making the results difficult to interpret in the clinical context.
This study is an effort to characterize chronic phlegm producers with (COPD, asthma) or without (chronic bronchitis) spirometry evidence of airflow obstruction according to their sputum protein profile. The usefulness of total protein concentration and specific protein panels as biomarkers for exacerbations were also tested.
Materials and Methods
Study Population
Subjects with various airway diseases diagnosed clinically and by spirometry were recruited from the respiratory (adult) Out Patient Department of BR Singh Hospital and Centre for Medical Education and Research, Eastern Railways, India.
This study has a cross-sectional design and was conducted in accordance to the Declaration of Helsinki. The protocol was approved by the Institutional Ethics Committee of BR Singh Hospital, Eastern Railways, Kolkata and the Institute of Genomics and Integrative Biology, New Delhi. All participants provided informed consent duly signed by them.
The inclusion criteria were as follows: (a) patients with phlegm producing airway diseases (chronic bronchitis, COPD, and asthma); (b) both non-smokers and smokers (current or former) were included; (c) aged more than 12 years. Patients were not included if they had any of these exclusion criteria: (a) non-phlegm producers even after sputum induction; (b) patients with active tuberculosis or other ongoing infective or non-infective respiratory diseases other than airway diseases (eg interstitial pneumonias); (c) participants where sputum induction cannot be done due to very poor lung function (FEV1 < 0.8 litres); (d) participants with significant co-morbidities where induction of sputum cannot be done eg recent myocardial infarction, severe neurologic disability.
Study Definitions
Participants were diagnosed as having chronic bronchitis/chronic mucus hypersecretion by means of questionnaires administered to the participants. The questionnaire was in accordance to the classic definition of chronic bronchitis ie “cough on most days or nights, for 3 consecutive months of the year for 2 consecutive years, and results in phlegm production”.11
The diagnosis of COPD was based on the symptoms and demonstration of irreversible airflow obstruction by spirometry ie FEV1/FVC < 0.70 and bronchodilator (200 mcg of inhaled salbutamol) reversibility of FEV1 less than 200 mL and 12%.23 Asthma diagnosis was based on self-reports of “physician diagnosed asthma” by the participants, either as a child (<18 years old) or in adulthood (>18 years old) and who also reports continuing symptoms. The diagnosis was also confirmed by spirometry (GINA guidelines) by the presence of a reversible (200 mL and 12% reversibility of FEV1 after 200 mcg of inhaled salbutamol) obstructive airway disease.24 In subjects with normal spirometry, asthma was diagnosed by bronchoprovocation test (methacholine) to demonstrate bronchial hyperresponsiveness.26
Current or former smokers were defined as having a smoking history of more than 20 pack years [number of pack years = (number of cigarettes per day/20) x number of years smoked (eg, 20 cigarettes per day for 10 years, or 10 cigarettes per day for 20 years). Former smokers were defined as those who have stopped smoking for at least 6 months prior to enrollment in the study.
Respiratory exacerbations were defined, according to the “2000 Aspen Lung Conference Consensus definition” as a sustained worsening of the patient’s respiratory condition, from the stable state and beyond normal day-to-day variations, necessitating a change in regular medication in a patient with underlying COPD.26 Any exacerbation that resulted in a contact with a health care provider, including ED and hospitalization were counted. An “exacerbation-prone” subject r’ was defined as anyone who had at least one exacerbation in the past 3 months. The others were termed “non-exacerbators”.
Sputum Collection, Shipment and Storage
Participants were recruited from the respiratory Out Patient Department of BR Singh Hospital and Centre for Medical Education and Research, Sealdah, Kolkata. They were requested to clean nasal secretions before they coughed up phlegm into a sterile container. If unable to produce sputum spontaneously, they were nebulized with normal or hypertonic saline following a standardized procedure for sputum induction.12
The sputum samples were placed in phosphate buffer (diluted 1:5) and stored at -80 °C within 30 minutes. The samples were later shipped for storage at -80 °C and further processing at IGIB, New Delhi. Cold chain was strictly maintained during transport.
Sample Processing for LC-MS/MS
We used 50 ul of raw sputum sample diluted five times in phosphate buffered saline (PBS) at pH 7.4 to identify the proteins by mass spectrometry. 250 µL of diluted sputum sample was taken in a 2.0 mL microcentrifuge tube and 1.75 mL of guanidine hydrochloride was added to make it 2.0 mL. Total protein concentration was measured at this stage using a BCA (bicinchoninic acid) assay. 20 ug equivalent of total proteins were reduced with 20 mM dithiothreitol (DTT) at 65 °C for 1 hour followed by alkylation using 50 mM iodoacetamide for 45 minutes. All the samples underwent buffer exchange with 50 mM ammonium bicarbonate using a 5 mL HiTrap desalting column (Cytiva). Desalted samples were then treated with trypsin at (0.5 ug of trypsin in 2 mL of buffer exchanged sputum) overnight at 37 °C for 18 hours. Tryptic peptides were then passed through 24 mL Superdex 200 (Cytiva) and the peptides eluting between 18–21 mL were collected. The eluents were then acidified with 1% formic acid and dried in a Speedvac (Eppendorf). Dried peptides were reconstituted in 0.1% formic acid and processed for LC-MS.
Identification of Proteins in Sputum
The peptides were analysed on a Triple Tof 6600 (AB Sciex, USA) MS coupled to an Eksigent NanoLC-425. 4 µg of protein samples were loaded onto a precolumn (ChromoLC trap, 200 µm × 0.5 mm) and desalting performed at a flowrate of 3 µL/min for 15 minutes. Mobile phase A was 99.9% water and 0.1% formic acid and mobile phase B was 99.9% acetonitrile and 0.1% formic acid. All the reagents were MS grade. After desalting the peptides were separated using Eksigent C18 column (75 µm × 15 cm). The liquid chromatography and mass parameters used are detailed in the Supplementary Table S-1
Database Searching and Protein Identification
We performed protein identification with the Protein Pilot software v5.0.1 (Sciex, USA) using the paragon algorithm. The parameters were set as: cysteine alkylation—Iodoacetamide, digestion—trypsin. The “search effort” was set to “thorough ID” and “false discovery rate” (FDR) analysis was enabled. Proteins identified with 1% FDR were considered for further analysis. The search was carried out against the UniProt database containing 20,394 human proteins.
Generation of Spectral Ion Library for SWATH-MS
Spectral library was generated in a data dependent acquisition mode. Briefly, 80 µg of protein were digested and analysed on a hybrid quadrupole-TOF mass spectrometer (Triple TOF 6600, Sciex, USA) coupled to a nano-LC system (Eksigent NanoLC-425) in a data dependent acquisition mode. 4 µg of protein was loaded onto a precolumn (chromoLC Trap, 5 µm 120 Å) and desalting performed at a flow rate of 10 µL per minute for 6 minutes. The gradient and mass parameters are given in supplementary Table S-2.
SWATH-MS for Quantification of Proteins in Sputum
For data-independent acquisition or DIA-SWATH runs, 100 precursor isolation windows were defined using the SWATH Variable Window Calculator (Sciex) based on precursor m/z frequencies in the DDA runs, with a minimum window width of 5 m/z. Sample preparation and desalting were performed as described earlier and analyzed on the same instrument.
SWATH data was processed using the SWATH Acquisition MicroApp 2.0.1 in PeakView 2.1 Software. Protein Pilot search result file (.group) was imported with 268 specified maximum numbers of proteins, and shared peptides were excluded. Retention time alignment was performed based on peptides from abundant proteins. The processing settings for peak extraction were: 10 peptides per protein, 5 transitions per peptide, >95% peptide confidence threshold, 5%FDR and excluding modified peptides. XIC extraction window was set to 55 min with 50 ppm XIC width. All information was exported in the form of MarkerView (.mrkw) files.27
Data Processing: LC-MS/MS
In the LC-MS/MS runs, redundant accession numbers or coding numbers and duplicate entries were removed by mapping in UniprotKB. All proteins were uniformly coded using the primary accession numbers, protein names and gene names from the UniprotkB database. Protein fragments, keratins and reversed (decoy) proteins were excluded from the initial analysis. Data complexity was reduced by including only those proteins which were detected in 2 or more samples.
Data Processing: SWATH Data
Prior to analysing the SWATH-MS outputs, the raw data was log transformed to base 2 after normality was verified using Shapiro–Wilk and Kolmogorov-Smirnov tests. The R-package,“Normalyser”, was used to normalize the data. Of the various methods, we used the norm-finder (NF G) method in this study. The missing data were replaced by the respective mean value of each protein. Outliers were identified as those that were more than 3 standard deviations (SD) away from the mean. These were capped at the 3 SD value.
Statistical Analysis
Data analyses were done using Microsoft excel and R (version 3.4.0). Descriptive statistics were used to summarize and analyze baseline data. Standard statistical methods were used to compare groups and find out associations with or differences between groups in various parameters. Analysis of variance (ANOVA) with correction for multiple comparisons (Tukey’s correction) was used to test the effects of more than one continuous variable on the total protein content. Effects of continuous variables on total protein concentration were analyzed with scatter plot and Spearman correlation. All tests were two-sided with a level of alpha less than 0.05 being considered as statistically significant.
Sputum Protein Informatics Analysis
The gene name or primary accession number of each of the identified and dysregulated proteins were used as input parameters in STRING 10.0 (http://string-db.org/) to create a protein-protein interaction map. In STRING, proteins are represented as nodes and edges as interaction with predicted partners. Cluster (using MCL with inflation parameter 3) analysis was done to find groups of functionally similar proteins.
Results
Subject Particulars
A total of 31 subjects were recruited in this study. Of them, nine patients had asthma, thirteen had COPD, five had chronic bronchitis and four were controls, ie without any clinically detectable airway disease (Tables 1 and 2). Sputum induction was necessary in 10 patients as they were unable to produce adequate sputum spontaneously. Eighteen samples were used for the LC-MS/MS experiments and fifteen for the SWATH quantitation experiment.
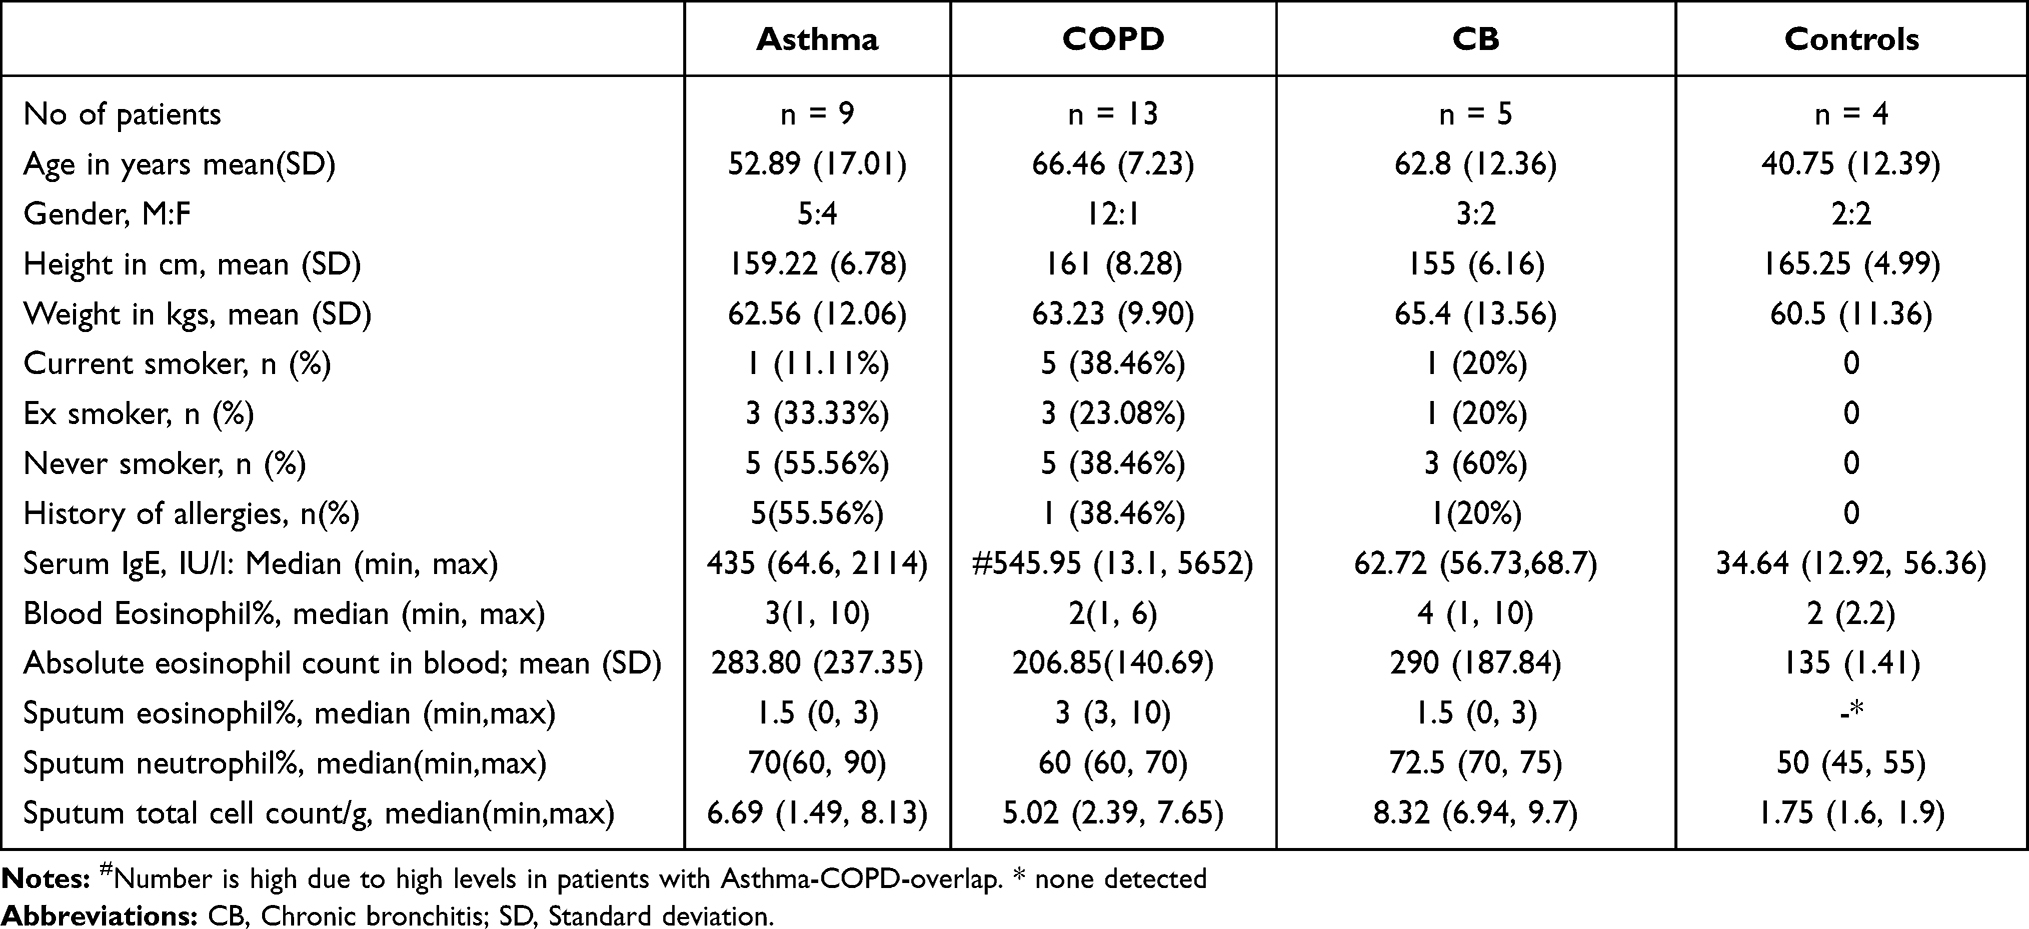 |
Table 1 Subject Particulars (n = 31) |
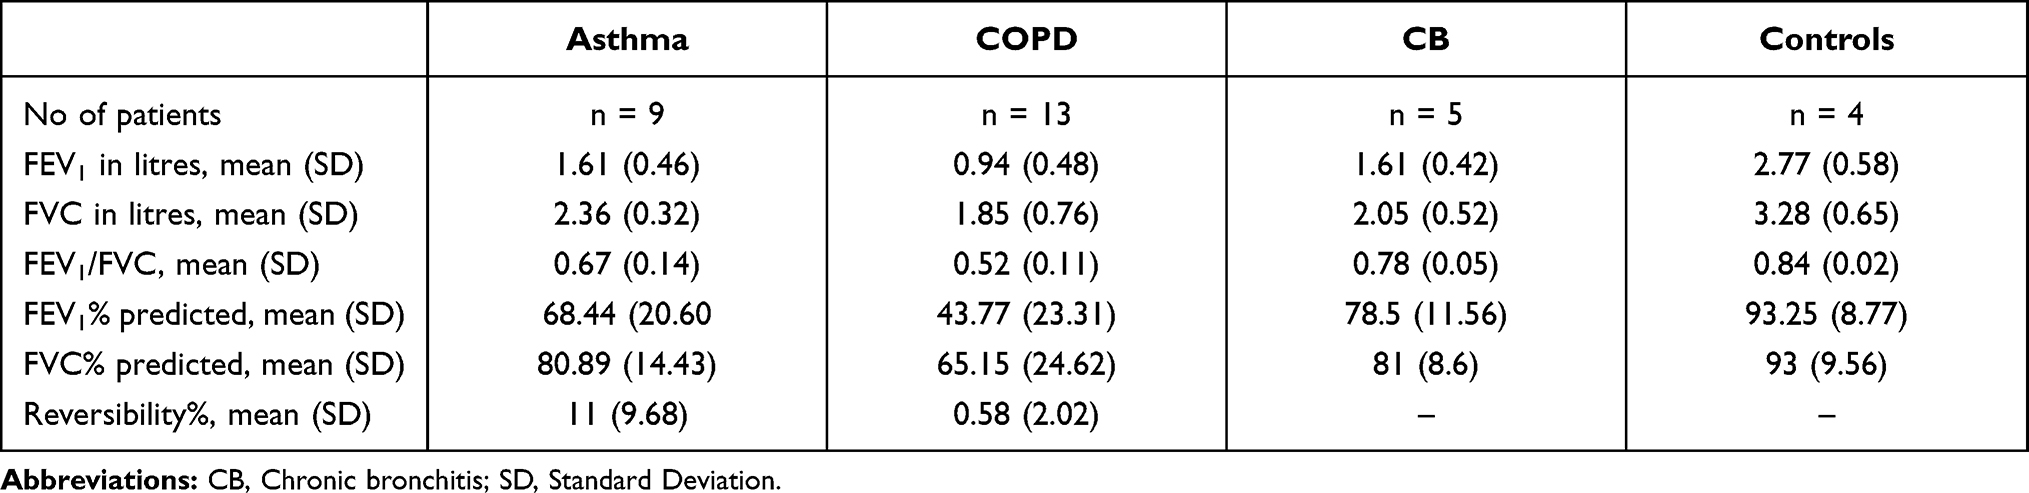 |
Table 2 Baseline Lung Functions (n=31) |
Protein Identification by LC-MS/MS
A total of 855 proteins were detected across all samples irrespective of the patient’s clinical phenotype (control, chronic bronchitis, asthma or COPD). After data cleaning and pre-processing 642 proteins remained for the spectral ion library generation.
Protein Quantification by SWATH
We quantified 185 proteins in 15 subjects (5 asthmatics, 4 COPD, 3 chronic bronchitis and 3 controls) by SWATH. Amongst these, thirty-one proteins were up or downregulated by at least 2 fold (log 2 transformed and relative to the overall protein mean) in any of the clinical samples. In a second step, only those proteins (21 proteins) which were either consistently upregulated or down regulated (same direction of change) in all samples of a particular phenotype were marked as the signature of that particular phenotype (Table 3).
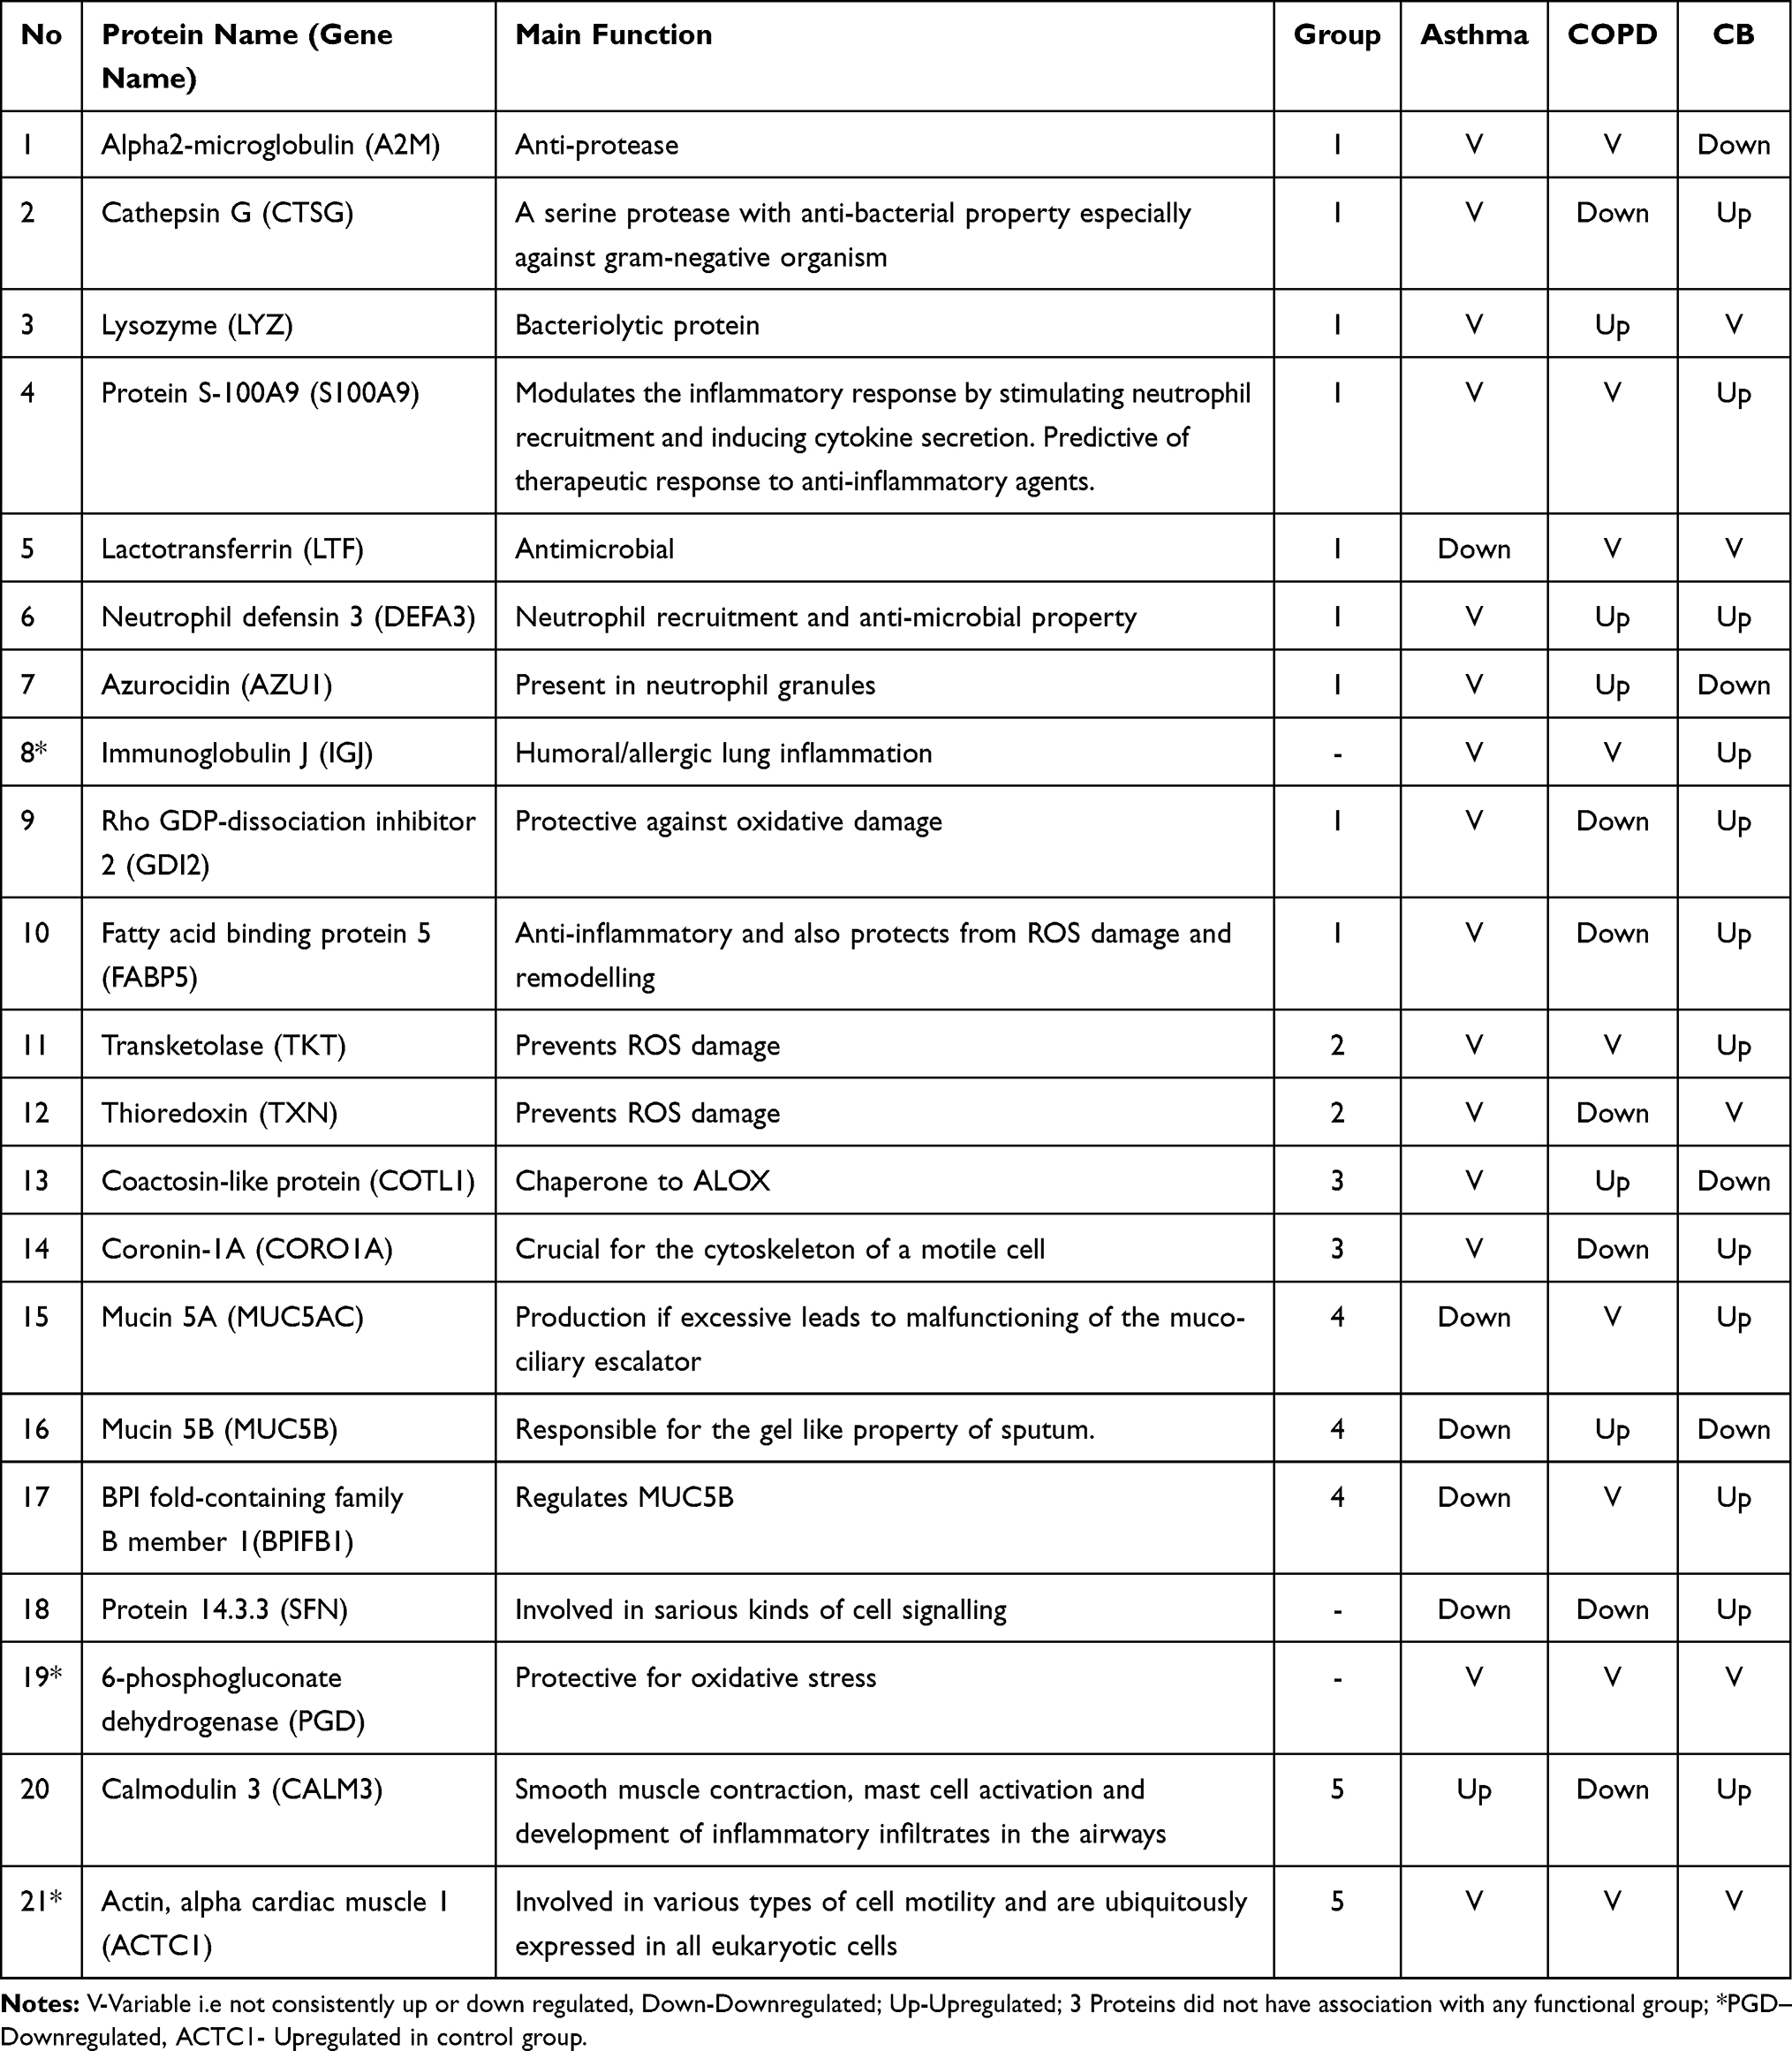 |
Table 3 Shows the Functional Groups/Clusters and Change (Up or Downregulated) in Proteins According to Clinical Phenotypes |
Hierarchical clustering (using Ward D method) was performed on the 15 samples with the 21 selected proteins and the samples separated out into 4 groups or proteotypes (Figure 1). On further analysis it was noted that the first proteotype comprised of subjects with “irreversible airflow obstruction” or the clinically COPD patients, the second proteotype consisted of “non-eosinophilic and non-atopic” subjects with no demonstrable airflow obstruction in spirometry, whereas the third proteotype consisted of the “highly eosinophilic and atopic” subjects. The last group consisted of “eosinophilic and atopic” subjects (Table S-3).
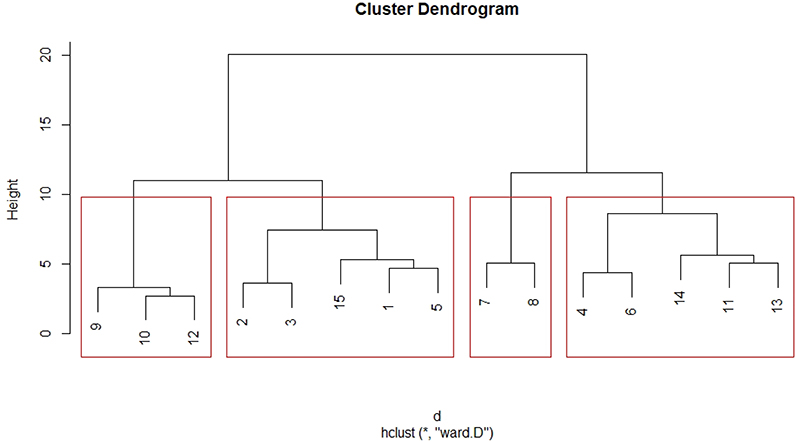 |
Figure 1 Hierarchical clustering of subjects (n = 15) into four proteotypes. Proteotype 1 (extreme left): Irreversible obstructive disease. Proteotype 2 (second from left): No airflow obstruction, non-atopic; Proteotype 3 (second from right): “high eosinophilic and atopic” with reversible airflow obstruction; Proteotype 4 (extreme right): “eosinophilic and atopic” without airflow obstruction. Highly eosinophilic-count more than 600 cells/cumm, eosinophilic-count >300 cells/cumm, Atopic-S Immunoglobulin E >120IU/l. *Is a symbol used in R programming which denotes” repetition”. The algorithm used here for hierarchical clustering was Ward D and the distance calculation method was by the Euclidean method. |
Interestingly, there were patients, whose clinical phenotype differed from its proteotype. One participant with a clinical diagnosis of “asthma” and another from the “control” group clustered in proteotype 2 with the “chronic bronchitis” subjects. Similarly, three other patients with the clinical phenotype of “COPD” (one subject) and “control” (two subjects) were in the proteotype 4 along with the eosinophilic and atopic asthma subjects. These patients were the asthma-COPD overlap or the ACO phenotype.
Functional Clustering by STRING Functional Association Network
We found four clear clusters of proteins using the MCL algorithm (inflation parameter of 3) in STRING (Figure 2). Cluster 1 (n = 9) comprised of inflammatory proteins. Cluster 2 (n = 2) proteins were mainly involved in airway oxidative stress, cluster 3 (n = 3) proteins were related to the airway mucins whereas cluster 4 (n = 2) and cluster 5 (n = 2) proteins were related to calcium signaling and cytoskeleton respectively.
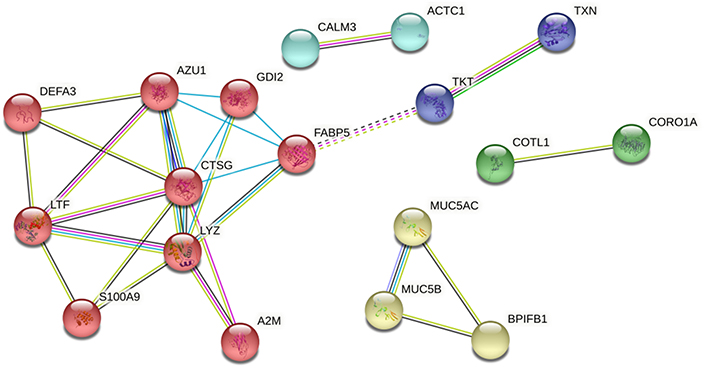 |
Figure 2 STRING functional protein association network analysis of 21 proteins which were consistently up and down regulated in particular phenotypes (3 proteins which did not have direct association with the other proteins have been excluded); MCL (with inflation parameter 3) clusters shows 5 clusters. Abbreviations: Red cluster, Inflammatory proteins; dark blue cluster, oxidative stress related; green and cyan clusters, calcium related processes and cytoskeleton related; yellow cluster, mucin related. |
The inflammatory proteins in the first cluster were a reflection of the underlying airway inflammation. Functionally, these proteins could be grouped further into (i) proteins with anti-protease property: Alpha2-macroglobulin, and Cathepsin G and (ii) proteins with anti-microbial property: Cathepsin G, Azurocidin, Lactotransferrin, Lysozyme, Neutrophil defensin 3, Immunoglobulin J and the Proteins S100A9. Fatty acid binding protein is known to have anti-inflammatory properties and also protects from injury caused by reactive oxidative species and consequent remodeling. The third group, which comprised of mucin related proteins, consisted of Mucin5AC and Mucin5B as the two main mucins identified. Both are gel forming mucins. The protein BPI Fold-containing family B1 has been described as a regulator of Mucin5B.
We analysed the proteins according to the four proteotypes identified in the cluster analysis (Figure 3). It revealed statistically significant differences in change from mean in Azurocidin 1 (p = 0.0054), Neutrophil defensin 3 (p = 0.0111), Calmodulin 3 (p = 0.0211), CoroninA1 (p = 0.0162), Mucin 5AC (p = 0.0294) and BPI Fold containing Family B1 (p = 0.0043). Mucin 5B showed a definite trend in being different between the groups although it did not reach statistical significance. Noteworthy, in proteotype 1 (P1, green) inflammatory (Azurocidin 1, Neutrophil defensin 3, Lactotransferrin) and mucin related proteins (Mucin 5B, Mucin 5AC and BPI Fold containing family B1) were increased while the calcium related proteins were decreased. In proteotype 3 (P3, gray), all mucin related proteins along with Neutrophil defensin 3 (DEFA3) and Lactotransferrin (LTF) were decreased. In proteotype 2 (P2, orange), mucin related proteins were elevated while in proteotype 4 (P4, blue) the calcium related proteins were elevated. This is probably related to high eosinophil counts in proteotype 3 and neutrophil driven disease in proteotype 1.
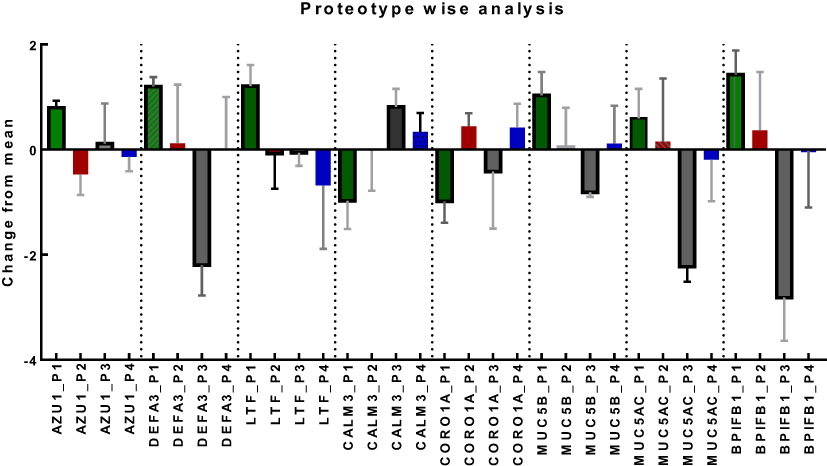 |
Figure 3 Proteotype wise analysis (Plot of Mean and SD) shows eight proteins to be statistically different among the proteotypes. The other proteins did not have significant differences between the prototypes. Noteworthy, in Proteotype1 (P1, green) inflammatory (Azurocidin1, Neutrophil defensin 3, Lactotransferrin) and mucin related proteins (Mucin 5B, Mucin 5 AC and BPIFB1) were increased while the calcium related proteins were decreased. In Proteotype 3, all mucin related proteins along with neutrophil defensin 3 (DEFA3) and Lactotransferrin (LTF) were decreased. In proteotype 2, mucin related proteins were elevated while in proteotype 4 the calcium related proteins were elevated. Abbreviations: AZU1, Azurocidin1; DEFA3, Neutrophil Defensin 3; LTF, Lactotransferrin; CALM 3, Calmodulin 3; CORO1A, Coronin 1A; MUC5B, Mucin 5B; MUC5AC, Mucin5AC; BPIFB1, BPI fold-containing family B member 1(BPIFB1); P1, proteotype 1; P2, proteotype 2; P3, proteotype 3; P4, proteotype 4; Underscore(_) P(any of 1,2,3,4), The particular protein in that particular proteotype. |
Proteins as Biomarkers for Exacerbations
In our search for biomarkers for exacerbations we used the above 21 proteins and identified 8 proteins to have statistically significant alterations in the exacerbation-prone subjects compared to nonexacerbators. These proteins included Azurocidin1 (p = 0.0126), Neutrophil defensin 3 (p = 0.0342) and Lactotransferrin (p = 0.0128) among the inflammatory proteins, Calmodulin 3 (p = 0.0361) and Coronin1A (p=0.0112) among calcium related proteins, and Mucin 5B (p=0.045), Mucin 5AC (p=0.0273) and BPI Fold containing family B1 (p = 0.0246) (Figure 4A–D) to be able to differentiate exacerbation prone subjects from non exacerbators. The analyses were adjusted for smoking status.
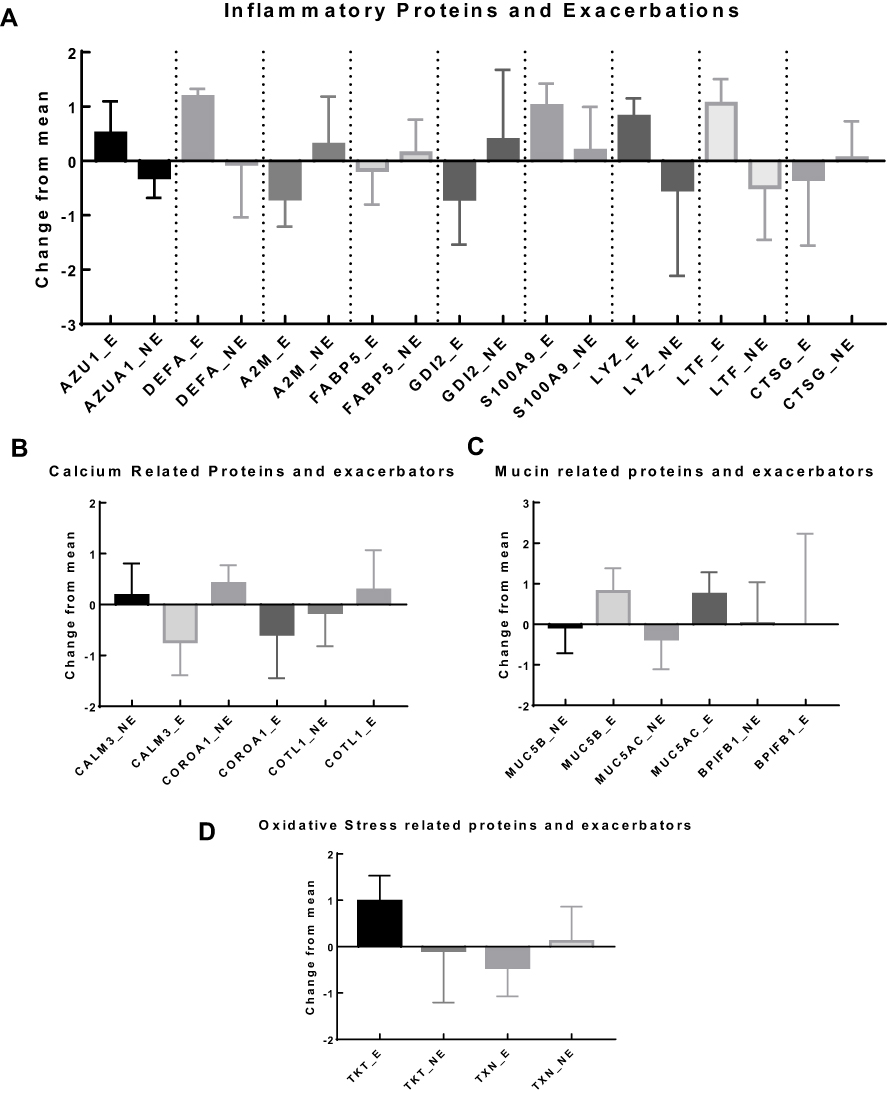 |
Figure 4 (A) Proteins related with inflammation and its association with exacerbations include: Azurocidin 1 (p = 0.0126), Neutrophil defensin (p=0.0342) and Lactotransferrin (p = 0.0128); (Plot of mean and SD); p values are from independent sample t-test; (B) Calcium related proteins and exacerbators show that significant difference in change from mean in two proteins Calmodulin 3 (p = 0.0361) and Coronin 1A (p = 0.0112); (plot of Mean and SD). p values are from independent sample t-tests. (C) Mucin related proteins and exacerbator analysis show that significant difference in change from mean in the proteins (plot of Mean and SD). Mucin 5B (p = 0.048), Mucin 5AC (p = 0.0273) and BPI Fold containing family B1 (p = 0.0246); p values are from independent sample t-test for each protein. (D) Oxidative stress related proteins and exacerbator analysis shows no association with exacerbators. (plot of Mean and SD). Notes: Underscore(_) E, protein in exacerbation prone subjects; Underscore(_)NE, protein in nonexacerbator group; AZU1, Azurocidin 1; DEFA3, Neutrophil Defensin 3; A2M, Alpha2-macroglobulin; FABP5, Fatty Acid binding protein5; GDI2, Rho GDP-dissociation inhibitor 2; S100A9, Protein S100A9; LYZ, Lysozyme; LTF, Lactotransferrin; CTSG, Cathepsin G; TKT, Transketolase; TXN, Thioredoxin; MUC5B, Mucin 5B; MUC5AC, Mucin 5AC; BPIFB1, BPI Fold containing Family B; CALM3, Calmodulin 3; CORO1A, Coronin 1A; COTL1, Coactosin-like protein. |
Total Protein Concentration as a Biomarker
We compared the total protein concentration between the four clinical phenotypes. There was significant increase of protein concentration in asthma (0.99±0.42 µg/µL), COPD (1.32±0.85 µg/µL) and chronic bronchitis (0.99±0.82 µg/µL) compared to controls (0.54±0.18 µg/µL) (p < 0.05) (Figure 5A).
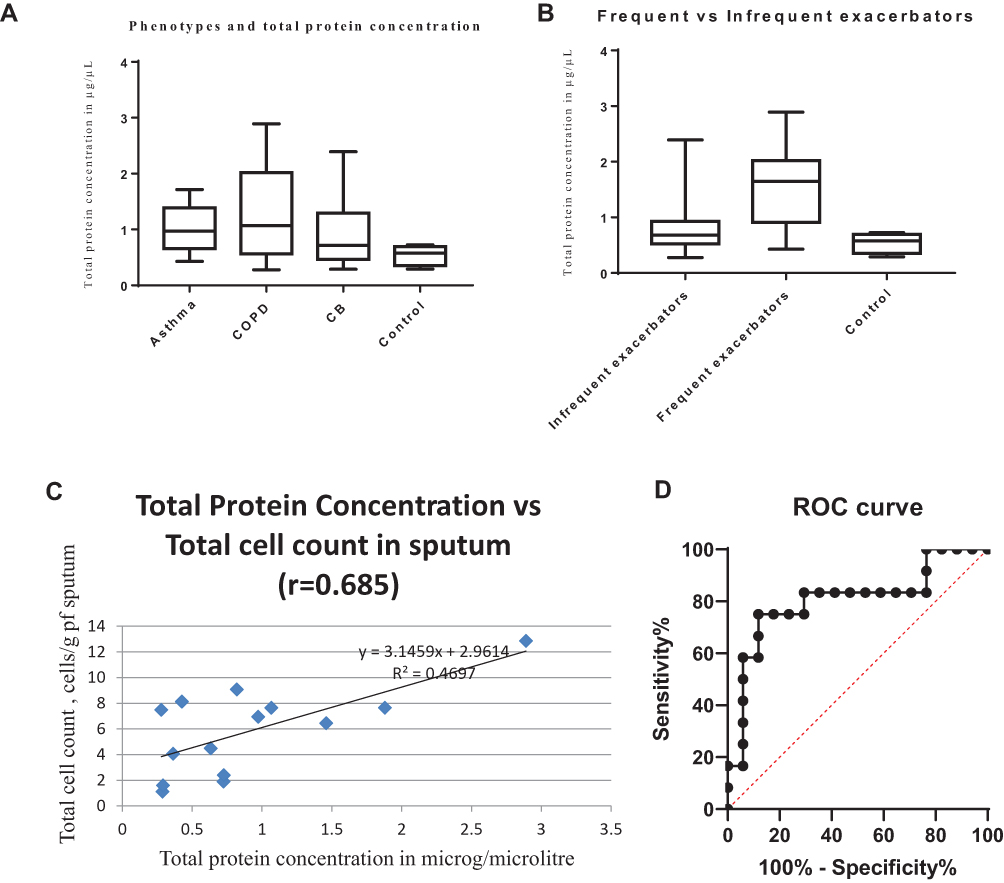 |
Figure 5 (A) Total protein concentration in the different phenotypes of airway disease was significantly different (p = 0.0344, Bartlett’s test); (B) Significant difference in total protein concentration in “ exacerbation prone” compared to “infrequent exacerbators” or non-exacerbators (p = 0.0184). (C) Correlation between total protein concentration vs total cell count in sputum quantitative assay. (D) Receiver operator characteristic curve for total protein concentration and exacerbators; Area under curve = 0.8039 (95% confidence interval 0.6260 to 0.9818). Abbreviation: CB, Chronic bronchitis. |
The total protein concentration was significantly different (p = 0.0184) between “exacerbation prone” (n = 12, 1.4957±0.7703) vs “non-exacerbators” (n = 13, 0.8180 ± 0.5558) (Figure 5B). Amongst COPD patients who exacerbated at least once in the past 3 months the total protein concentration was significantly (p = 0.097) more than subjects who did not [(1.79 ± 0.82) vs (0.76 ± 0.51) µg/µL]. The numbers, however, did not reach statistical significance when asthma was considered separately [(0.81 ± 0.15) vs (1.09 ± 0.49) µg/µL] (Figure 5B). There were no exacerbators in the chronic bronchitis group.
The relationship between total protein concentration and total cell count in sputum quantitative assay was modest with an r of 0.6135 (95% confidence interval 0.1476 to 0.8566; p = 0.015) in the scatter plot (Figure 5C).
A receiver operator curve (ROC) characteristic was constructed to find the cut-off value of the total protein concentration that would have a high sensitivity without losing much of specificity (Figure 5D) for detecting the frequent exacerbators. A total protein concentration cut-off of 1 microgram/microliter had a specificity of 88.24% and a sensitivity of 75% to detect “frequent exacerbators”. The area under the ROC curve for total protein as predictor of frequent exacerbators was 0.8039 (95% confidence interval 0.6260 to 0.9818) (Figure 5D).
Discussion
This pilot study was conducted to explore the sputum proteomic signatures among patients with various airway diseases such as asthma, COPD, and chronic bronchitis. The long-term objective was to be able to diagnose disease at a stage when traditional tests fail to indicate a diagnosis. Using SWATH, which is a data-independent label-free approach for protein quantification, we identified a set of 21 proteins that could accurately group patients into their phenotypes (chronic bronchitis, asthma, COPD, and asthma-COPD overlap) independent of their clinical presentation and spirometry results. Eight proteins which could differentiate between exacerbation prone and nonexacerbators were identified. A simple tool like total protein concentration emerged as a biomarker for “frequent exacerbators”.
Recently, quantification in proteomics has generated a lot of interest amongst researchers. Several methods and analysis algorithms have been used. Previously, investigators have tried to find a single protein as the signature protein of a particular phenotype. Unfortunately, this approach has only been successful variably. One of the possible reasons of failure is the heterogeneity of airway diseases in general. Hence we reasoned that a panel of proteins would be superior to a single protein in differentiating the various diseases In fact, in an earlier study involving 5 healthy and 10 asthmatic subjects, Gharib et al, applied shotgun mass spectrometry and identified 17 proteins with significant differences in concentrations between asthmatic and healthy individuals.16 In a more recent and the largest study so far Schofield et al from the Unbiased Biomarkers for the Prediction of Respiratory Disease Outcomes (U-BIOPRED) group described as many as ten clusters or proteotypes based on similarity in proteomic features.20 When granulocyte counts were included in the analysis, the authors further described three clusters as highly eosinophilic, three as highly neutrophilic, and two as highly atopic. In our study, we identified 21 proteins which could identify the different clinical phenotypes of obstructive (reversible or irreversible) and non-obstructive airway diseases (chronic bronchitis) (Figure 1 and Table 3). The internal strength of the clusters was confirmed by the similarity in inflammatory phenotypes and atopy status within the clusters (Figure 1). Additionally, the Dunn index was 0.6932 while the average silhouette width was positive 0.21 indicating a good internal validity. The fact that levels of most of the proteins quantified were similar between the groups, also suggests a good quality control.
A unique and interesting finding in this study relates to the controls of the study. Their selection was made according to protocols followed in respiratory clinics worldwide. Subjects were considered free of lung diseases based on the absence of respiratory symptoms currently or in the past, normal lung function parameters, and normal baseline blood tests. Interestingly, sputum proteomic analysis revealed that the controls, despite stringently fulfilling the selection criteria, had proteomic signatures similar to chronic bronchitis or asthma. This has important treatment and long-term prognostic implications and has not been reported before. We, thus, demonstrate here the ability of sputum proteomics to detect the presence of airway diseases even when symptoms are absent, such as in the subclinical stage of diseases. Additionally, this panel of 21 proteins could accurately detect asthma-COPD overlap which is often difficult to characterize clinically. Thus, sputum proteomics has the potential to open up a completely new era in the management of airway diseases.
Functional clustering of the proteins using the online STRING software revealed five clear endotypes (inflammation-related, oxidative stress-related, mucin-related, calcium-signaling related and cytoskeleton-related). The inflammatory proteins consisted mostly of neutrophil function related proteins and as expected were elevated in the proteotype 1 and 2 which consisted of the COPD and the noneosinophilic and non atopic patients respectively. On the contrary, these proteins were decreased in proteotype 3 and 4 which were the eosinophilic groups. Similar differences between the proteotypes were found with the mucin-related proteins. The treatment implication of these novel endotypes has not been described earlier and needs further research. Calcium is involved in a whole lot of cellular processes and whether downregulation of the proteins of this cluster relates to significant dysfunction of these cellular processes is work in progress. Similarly, the role of anti-oxidants when proteins involved in oxidative stress are dysregulated remains unexplored.
Among the proteins which showed significant differences between the exacerbation-prone subjects and non-exacerbators were, as would be anticipated, mainly the proteins involved in neutrophil functions, namely Azurocidin 1, Neutrophil defensin, Lactotransferrin, Mucin 5B, Mucin 5AC and BPI fold containing family B1 (Figure 4). Of these, mucins are the only proteins which already have approved therapeutic (mucoactive) agents directed towards them. It would be intriguing to see whether these agents could alter the course of the diseases in blinded clinical trials. The analyses were adjusted for smoking although it did not affect our results as much as one would have expected. This was because of our extremely vigilant smoking cessation programme that kept the number of smokers in our population in check.
This study, for the first time ever, looked into the potential of using total protein concentration as a simple but useful biomarker for the presence of ongoing airway inflammation. This metric correlated modestly with the total cell count obtained from sputum quantitative assay which proves its validity (Figure 5C). Sputum quantitative assay has a well characterized methodology and has been in clinical practice for at least two decades in certain centers across the globe.12. In addition to the above, total protein concentration was elevated in “exacerbation prone” as compared to “nonexacerbators” which makes it a clinically relevant tool in airway disease management.
The main limitation of our study is its cross-sectional design and small sample size. However, this is mainly a “discovery proteomics” study in design and thus sample size or power estimates are not important considerations. Further, we did not have adequate healthy subjects as controls as many were unable to cough up sputum even when induction was attempted. As in most severe airway disease studies, treatments varied between participants and intuitively these variations would have affected the biomarker profiles.
The novelty of this study is in its ability to describe findings which are clinically relevant. The method used can easily be replicated. The SWATH-MS technology allows single sample runs making this a clinic friendly tool. Additionally, this is the first study to describe a sputum supernatant protein panel (21 proteins) with the potential to detect the clinical phenotypes and endotypes. We further demonstrated that the relative changes in mucin A and B was not associated with exacerbations in the eosinophilic endotypes. This is also the first study to illustrate that total protein concentration was elevated in the exacerbation-prone subjects compared to the non-exacerbators.
We realize that larger studies are required to validate our results. However, despite the small sample size, our results matched modestly with those of the much-acclaimed U-BIOPRED studies.16,20. Once it is ready, sputum proteomics is likely to cause a paradigm change in the way airway diseases will be diagnosed and managed in the future.
Conclusion
The current study describes the sputum proteomic profiles of patients with airway diseases. We have illustrated that a panel of 21 proteins could segregate patients into their clinical phenotypes irrespective of spirometry and their clinical history. Importantly, this approach seems to be able to suspect disease even before symptoms occur and detect phenotypes such as asthma-COPD overlap which are difficult to diagnose clinically. This has great potential in bringing about a major change in the diagnostic modalities of airway diseases.
We demonstrate for the first time that the total protein concentration of sputum is a simple and useful clinic tool that has a good correlation with total cell count of sputum and can be used to recognize exacerbation-prone subjects. However, this measure and the proteins included in our panel deserve validation and warrant further study before their use in clinics.
Acknowledgments
We thank the CSIR for funding. Angira Dasgupta received support from the Eastern Railways. Rahul Chakraborty received a fellowship from the University Grants Commission. Praveen Singh received fellowship support from CSIR. Anurag Raj and Bodhisattwa Saha received fellowships from DST. Himanshi Suri received support from CSIR-Institute of Genomics and Integrative Biology, New Delhi, India. We thank Mr. Monu Kumar for help with the proteomics experiments.
Disclosure
All authors reported no conflicts of interest for this work.
References
1. American Thoracic Society. What constitutes an adverse health effect of air pollution? Official statement of the American Thoracic Society. Am J Respir Crit Care Med. 2000;161:665–673.
2. Jinnai M, Niimi A, Ueda T, et al. Induced sputum concentrations of mucin in patients with asthma and chronic cough. Chest. 2010;137(5):1122–1129.
3. Vestbo J, Prescott E, Lange P. Association of chronic mucus hypersecretion with FEV1 decline and chronic obstructive pulmonary disease morbidity. Am J RespirCrit Care Med. 1996;153:1530–1535.
4. Sherman CB, Xu X, Speizer FE, Ferris BG
5. Kim V, Han MK; COPDGene Investigators, et al. The chronic bronchitic phenotype of COPD: an analysis of the COPDGene Study. Chest. 2011;140(3):626–633.
6. Agusti A, Calverley PM, Celli B, et al. Characterisation of COPD heterogeneity in the ECLIPSE cohort. Respir Res. 2010;11:122.
7. de Oca MM, Halbert RJ, Lopez MV, et al. The chronic bronchitis phenotype in subjects with and withoutCOPD: the PLATINO study. EurRespir J. 2012;40:28–36.
8. Burgel PR, Nesme-Meyer P, Chanez P, et al. Cough and sputum production are associated with frequent exacerbations and hospitalizations in COPD subjects. Chest. 2009;135:975–982.
9. Prescott E, Lange P, Vestbo J. Chronic mucus hypersecretion in COPD and death from pulmonary infection. EurRespir J. 1995;8:1333–1338.
10. Allinson JP, Hardy R, Donaldson GC, Shaheen SO, Kuh D, Wedzicha JA. The presence of chronic mucus hypersecretion across adult life in relation to chronic obstructive pulmonary disease development. Am J Respir Crit Care Med. 2016;193(6):662–672. doi:10.1164/rccm.201511-2210OC
11. Ferris BG. Epidemiology standardization project (American Thoracic Society). Am Rev Respir Dis. 1978;118(6 Pt 2):1–120.
12. Pizzichini E, Pizzichini MM, Efthimiadis A, et al. Indices of airway inflammation in induced sputum: reproducibility and validity of cell and fluid-phase measurements. Am J Respir Crit Care Med. 1996;154(2 Pt 1):308–317.
13. Fahy JV, Dickey BF. Airway mucus function and dysfunction. N Engl J Med. 2010;363(23):2233–2247.
14. Nicholas B, Skipp P, Mould R, et al. Shotgun proteomic analysis of human-induced sputum. Proteomics. 2006;6(15):4390–4401.
15. Gray RD, MacGregor G, Noble D, et al. Sputum proteomics in inflammatory and suppurative respiratory diseases. Am J Respir Crit Care Med. 2008;178(5):444–452.
16. Gharib SA, Nguyen EV, Lai Y, Plampin JD, Goodlett DR, Hallstrand TS. Induced sputum proteome in healthy subjects and asthmatic patients. J Allergy Clin Immunol. 2011;128(6):1176–1184.e6.
17. Ohlmeier S, Mazur W, Linja-Aho A, et al. Sputum proteomics identifies elevated PIGR levels in smokers and mild-to-moderate COPD. J Proteome Res. 2012;11(2):599–608.
18. Takahashi K, Pavlidis S, Ng Kee Kwong F; on behalf of the U-BIOPRED study group, et al. Sputum proteomics and airway cell transcripts of current and ex-smokers with severe asthma in U-BIOPRED: an exploratory analysis. Eur Respir J. 2018;51(5):1702173.
19. Reidel B, Radicioni G, Clapp PW, et al. E-Cigarette use causes a unique innate immune response in the lung, involving increased neutrophilic activation and altered mucin secretion. Am J Respir Crit Care Med. 2018;197(4):492–501.
20. Schofield JPR, Burg D, Nicholas B; U-BIOPRED Study Group, et al. Stratification of asthma phenotypes by airway proteomic signatures. J Allergy Clin Immunol. 2019;144(1):70–82.
21. Welsh KG, Rousseau K, Fisher G, et al. MUC5AC and a glycosylated variant of MUC5B alter mucin composition in children with acute asthma. Chest. 2017;152(4):771–779.
22. Kesimer M, Ford AA, Ceppe A, et al. Airway mucin concentration as a marker of chronic bronchitis. N Engl J Med. 2017;377(10):911–922.
23. Singh D, Agusti A, Anzueto A, et al. Global strategy for the diagnosis, management, and prevention of chronic obstructive lung disease: the GOLD science committee report 2019. Eur Respir J. 2019;53;5:1900164.
24. Boulet LP, Reddel HK, Bateman E, Pedersen S, FitzGerald JM, O’Byrne PM. The Global Initiative for Asthma (GINA): 25 years later. Eur Respir J. 2019;54(2):1900598.
25. Lefaudeux D, De Meulder B; U-BIOPRED Study Group, et al. U-BIOPRED clinical adult asthma clusters linked to a subset of sputum omics. J Allergy Clin Immunol. 2017;139(6):1797–1807.
26. Rodriguez-Roisin R. Toward a consensus definition for COPD exacerbations. Chest. 2000;117(5 Suppl 2):398S–401S.
27. Ray Y, Paul SR, Bandopadhyay P, et al. Clinical and immunological benefits of convalescent plasma therapy in severe COVID-19: insights from a single center open label randomised control trial. medRxiv. 2020. doi:10.1101/2020.11.25.20237883
 © 2021 The Author(s). This work is published and licensed by Dove Medical Press Limited. The
full terms of this license are available at https://www.dovepress.com/terms
and incorporate the Creative Commons Attribution
- Non Commercial (unported, 3.0) License.
By accessing the work you hereby accept the Terms. Non-commercial uses of the work are permitted
without any further permission from Dove Medical Press Limited, provided the work is properly
attributed. For permission for commercial use of this work, please see paragraphs 4.2 and 5 of our Terms.
© 2021 The Author(s). This work is published and licensed by Dove Medical Press Limited. The
full terms of this license are available at https://www.dovepress.com/terms
and incorporate the Creative Commons Attribution
- Non Commercial (unported, 3.0) License.
By accessing the work you hereby accept the Terms. Non-commercial uses of the work are permitted
without any further permission from Dove Medical Press Limited, provided the work is properly
attributed. For permission for commercial use of this work, please see paragraphs 4.2 and 5 of our Terms.