Back to Journals » International Journal of Chronic Obstructive Pulmonary Disease » Volume 17
Sputum Cytokine Profiling in COPD: Comparison Between Stable Disease and Exacerbation
Authors Barta I, Paska C, Antus B ![]()
Received 8 March 2022
Accepted for publication 21 July 2022
Published 19 August 2022 Volume 2022:17 Pages 1897—1908
DOI https://doi.org/10.2147/COPD.S364982
Checked for plagiarism Yes
Review by Single anonymous peer review
Peer reviewer comments 4
Editor who approved publication: Prof. Dr. Richard Russell
Imre Barta,1,* Csilla Paska,1,* Balazs Antus1,2
1Department of Pathophysiology, National Koranyi Institute of Pulmonology, Budapest, Hungary; 2Department of Pulmonology, National Koranyi Institute of Pulmonology, Budapest, Hungary
*These authors contributed equally to this work
Correspondence: Balazs Antus, Department of Pathophysiology, National Koranyi Institute of Pulmonology, Koranyi Frigyes ut 1, Tel +36 1 391 3309, Fax +36 1 200 7060, Email [email protected]
Purpose: Cytokines are extracellular signaling proteins that have been widely implicated in the pathogenesis of chronic obstructive pulmonary disease (COPD). Here, we investigated cytokine expression both at the mRNA and protein level in the sputum of healthy individuals, stable COPD patients, and those experiencing a severe acute exacerbation (AECOPD) requiring hospitalization.
Patients and Methods: Sputum was collected in 19 healthy controls, 25 clinically stable COPD patients, and 31 patients with AECOPD. In AECOPD patients sample collection was performed both at the time of hospital admission and at discharge following treatment. Sputum supernatant was analyzed by an antibody microarray detecting 120 cytokines simultaneously, while the mRNA expression of 14 selected cytokines in sputum cells was investigated by real-time PCR (qPCR).
Results: Proteomic analysis identified interleukin (IL)-6 and growth-regulated oncogene (GRO)α as the only sputum cytokines that were differentially expressed between stable COPD patients and healthy controls. At the onset of AECOPD, several cytokines exhibited altered sputum expression compared to stable COPD. Recovery from AECOPD induced significant changes in the sputum cytokine protein profile; however, the length of hospitalization was insufficient for most cytokines to return to stable levels. With regard to gene expression analysis by qPCR, we found that bone morphogenetic protein (BMP)-4 was up-regulated, while IL-1α, monokine-induced by interferon-γ (MIG), and BMP-6 were down-regulated at the mRNA level in patients with AECOPD compared to stable disease.
Conclusion: The sputum cytokine signature of AECOPD differs from that of stable COPD. Protein level changes are asynchronous with changes in gene expression at the mRNA level in AECOPD. The observation that the levels of most cytokines do not stabilize with acute treatment of AECOPD suggests a prolonged effect of exacerbation on the status of COPD patients.
Keywords: airway, biomarker, gene, inflammation, microarray, PCR
Introduction
Chronic obstructive pulmonary disease (COPD) is an inflammatory lung disease characterized by increased numbers of macrophages, neutrophils and T cells, and enhanced release of various inflammatory mediators.1 Nonetheless, the airway inflammation in COPD is heterogeneous: the most common inflammatory phenotype is the neutrophil-associated COPD with inflammasome, Th1 and Th17 activation, while in a minority of patients increased eosinophilic airway inflammation with increased Th2-transcriptome signature can be observed.2
It is well established that cytokines and chemokines play a key role in the control of these inflammatory processes.3,4 Cytokines secreted from T cells primarily regulate the pattern of inflammation, whereas pro-inflammatory cytokines, such as tumor necrosis factor (TNF)-α, interleukin (IL)-1β or IL-6 amplify inflammation, in part through the activation of the transcription factor (NF)-κB, thereby resulting in increased expression of several inflammatory genes. Chemokines, in turn, recruit inflammatory cells from the circulation to the lungs, while growth factors maintain this inflammation and are mainly involved in the development of the characteristic structural changes of the airways, in particular small airway disease and empyhsema.5
In recent years tremendous efforts have been put forward to profile these inflammatory processes in order to better understand the molecular mechanisms underlying the disease and provide a rationale for biological agents targeting specific inflammatory pathways.6,7 However, it has proved difficult to identify distinct inflammatory endotypes among COPD patients, and associations between inflammatory mechanisms and clinical manifestations of the disease remained uncertain in most cases.8
Protein microarray is an established technology to assess the proteome of biological samples.9 The major advantage of using this method is that it allows the detection of a large number of factors simultaneously in a single experiment.
Sputum is a valuable source of cytokines, chemokines, and inflammatory proteins,10 and there is evidence that proteomic screening of sputum yields potential biomarkers in various pulmonary diseases including asthma, COPD, cystic fibrosis (CF) and bronchiectasis.11 Moreover, it appears that the sputum cytokine profiles of different pulmonary diseases are variable and can be related to the clinical status of the patients, as demonstrated recently by Eickmeier et al in the comparison between CF and COPD patients.12 Nonetheless, only a few studies have applied protein microarray to sputum to compare cytokine patterns between stable and exacerbated COPD patients.
Another approach to studying airway inflammation is gene expression profiling of sputum cells which has enabled the discovery of different transcriptional phenotypes.13 Using the method in patients from the ECLIPSE cohort, a large and well-characterized cohort of COPD patients, Singh et al have recently found altered gene expression profiles in frequent exacerbators14 and those with more severe airflow limitation or emphysema.15 Nonetheless, in these experiments, sputum proteomic analyses were not performed simultaneously. Similarly, although there are several studies investigating cytokine mRNA profiles in sputum cells,16,17 none of them have attempted to compare that with sputum proteomic data, particularly in patients with acute exacerbation of COPD (AECOPD) and convalescence.
Thus, in this study, we first analyzed the expression of 120 cytokines in the sputum supernatant of healthy individuals, stable COPD patients, and those experiencing a severe AECOPD using protein microarray. We also investigated whether treatment of AECOPD modifies the cytokine profile during the period of hospital care. Second, a subset of cytokines was selected for mRNA expression analysis by quantitative polymerase chain reaction (qPCR) and the results were compared with corresponding proteomic data.
Materials and Methods
Study Subjects
A total of 25 clinically stable, ex-smoker COPD patients and 31 ex-smoker AECOPD patients hospitalized for severe acute exacerbation were recruited for the study. Inclusion and exclusion criteria are summarized in Figure 1. Diagnosis of COPD was established by chest physicians, and all patients had documented airway obstruction (post-bronchodilator forced expiratory volume in one second [FEV1]/forced vital capacity [FVC] <0.7). AECOPD was defined as increased dyspnea, cough, or sputum expectoration (quality or quantity) that led the subject to seek medical attention, as specified in international guidelines.18
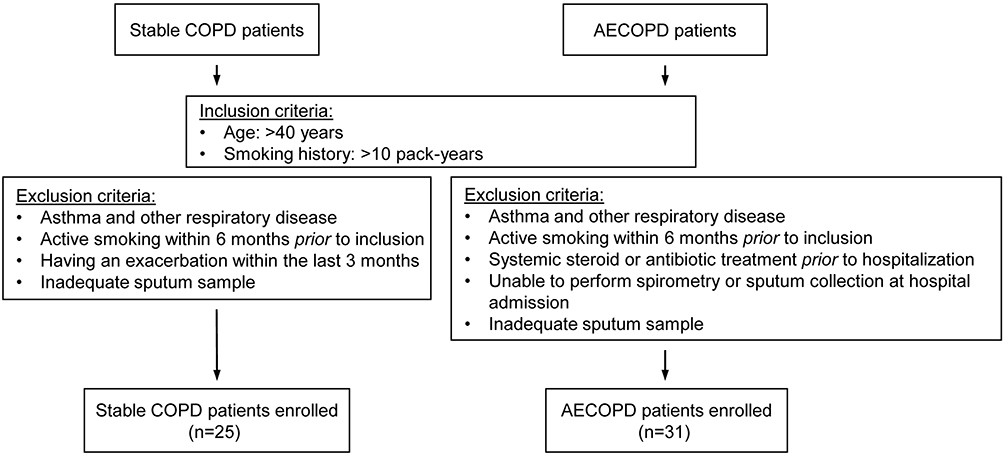 |
Figure 1 Flow chart showing the study profile. COPD, chronic obstructive pulmonary disease; AECOPD, acute exacerbation of chronic obstructive pulmonary disease. |
Additionally, 19 never smoker or ex-smoker healthy controls were enrolled in the study. Control subjects had normal lung function values and no history of acute or chronic respiratory diseases in the previous 4 weeks. Table 1 shows the characteristics of the study subjects. The research protocol was approved by the Ethics Committee of the National Koranyi Institute of Pulmonology (No: 6/2017), and all subjects gave written informed consent to participate in the study. All procedures performed in the study involving human participants were in accordance with the 1964 Helsinki declaration and its later amendments.
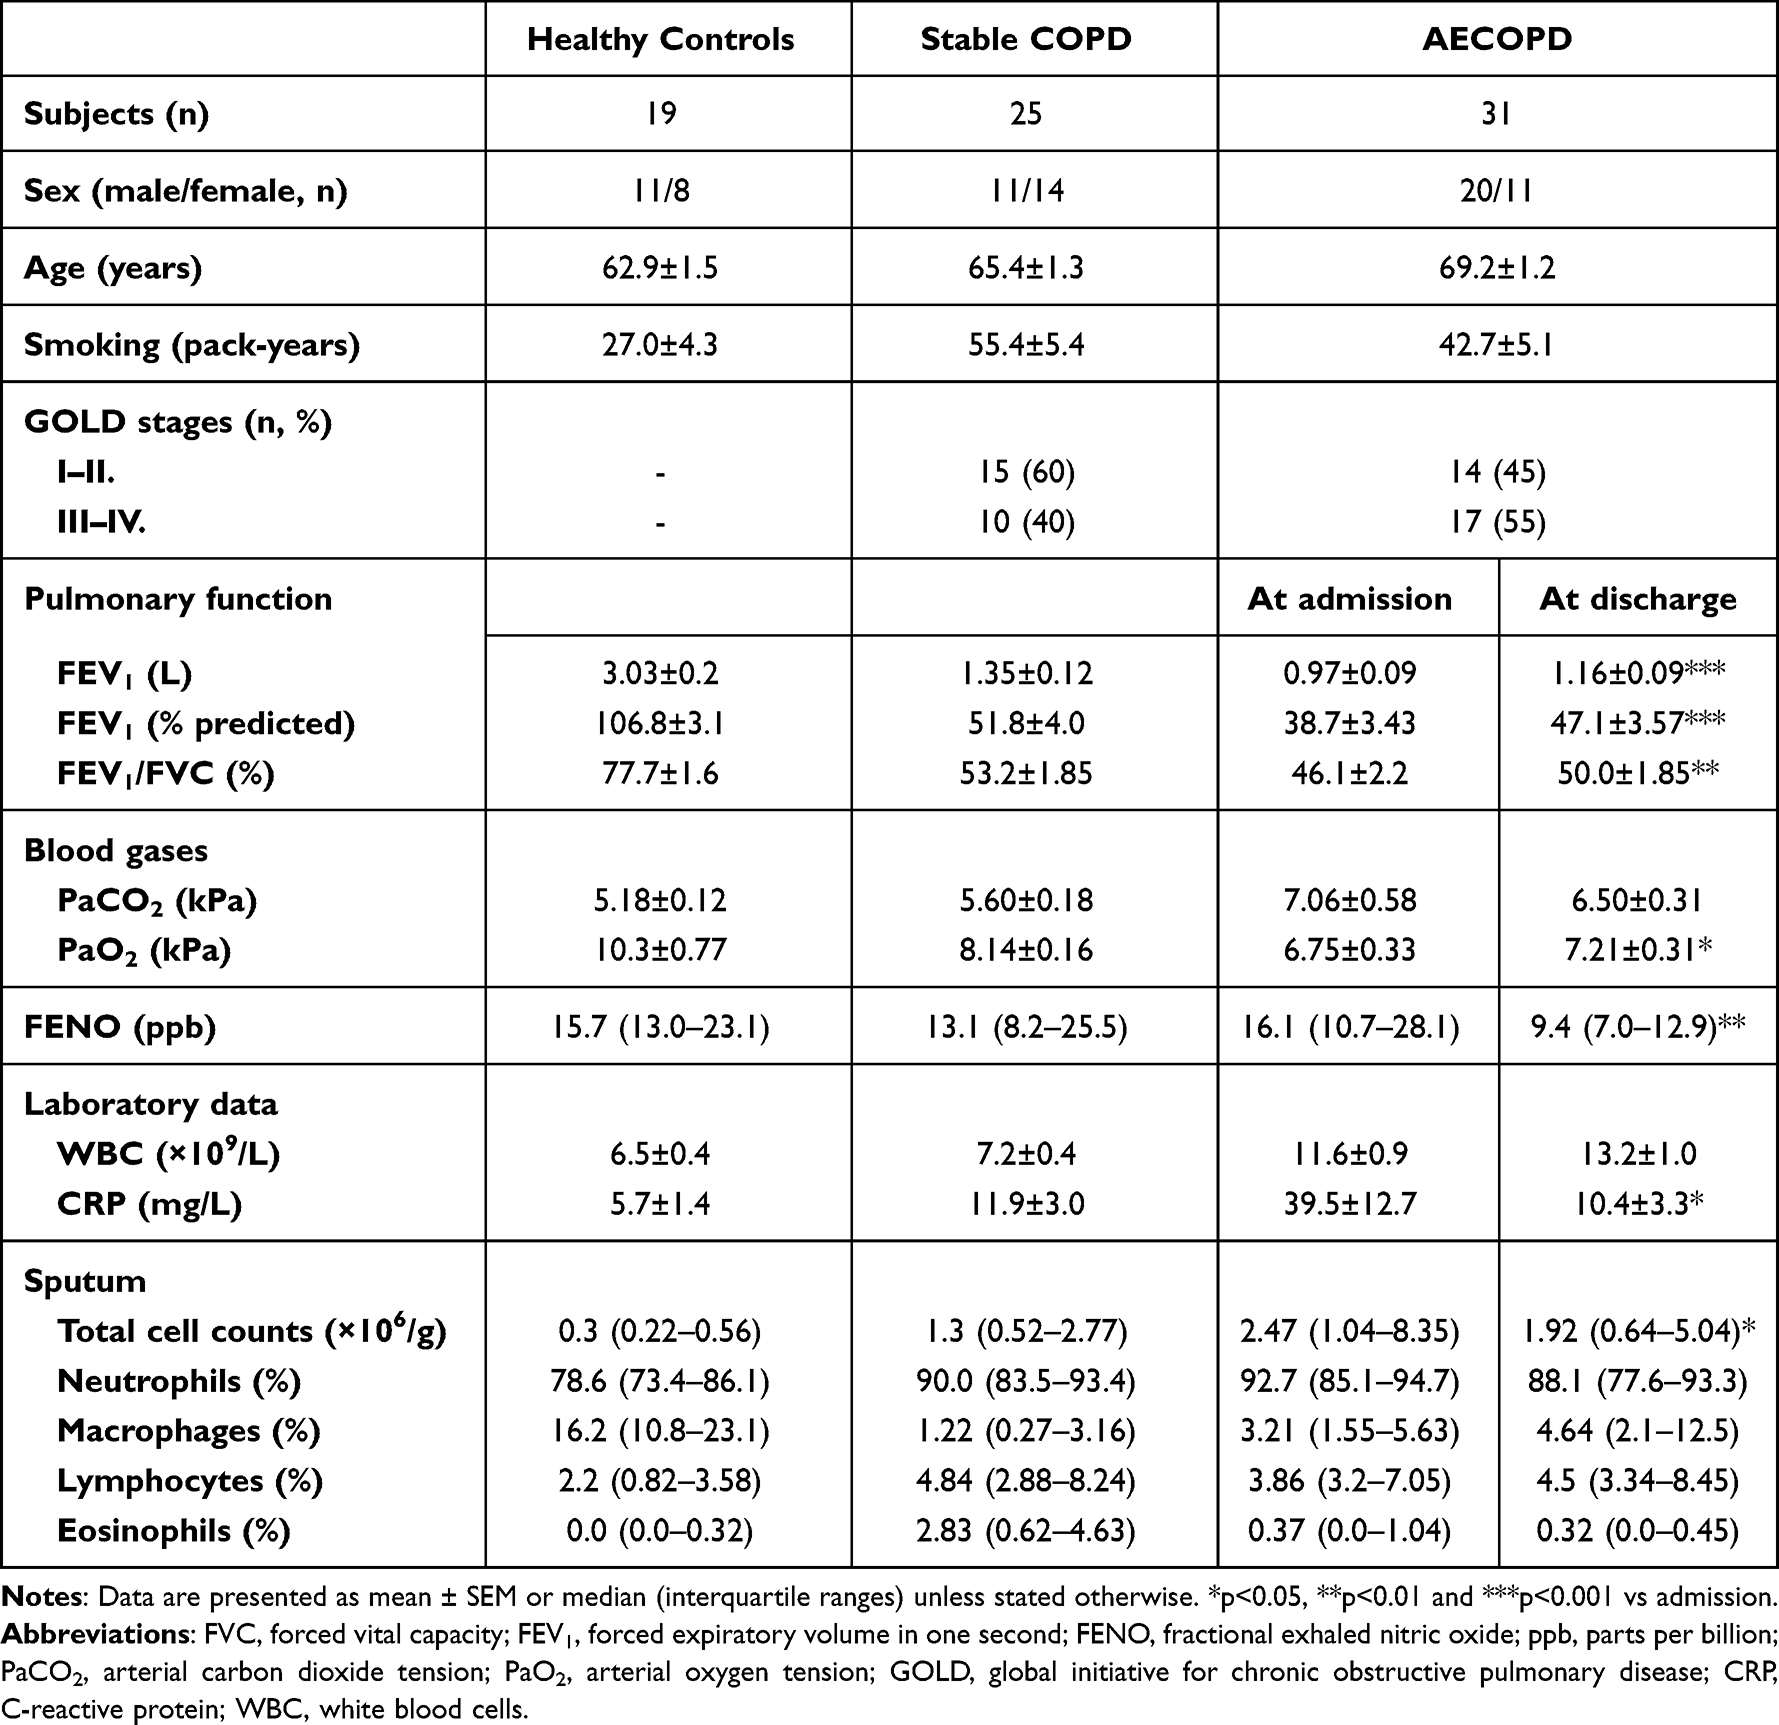 |
Table 1 Demographic and Clinical Characteristics of Study Subjects |
Study Design
In patients with AECOPD, spontaneously expectorated sputum was collected and fractional exhaled nitric oxide (FENO), blood gases, and lung function parameters were measured at hospital admission and on the day of hospital discharge. In stable COPD patients and healthy controls, induced sputum was collected during routine clinical visits. The smoking status of all participants was confirmed by measuring exhaled carbon monoxide (eCO) levels using a portable CO monitor (Smokerlyzer Micro, Bedfont Scientific, Kent, UK). All subjects had eCO levels <4 ppm indicating a lack of recent smoke exposure. Sputum induction, FENO measurement, lung function, and all other laboratory measurements were performed, as previously described.19
Sputum Processing
Sputum samples were processed as previously described.20 Briefly, sputum samples were homogenized in phosphate-buffered saline (PBS) containing 0.1% dithiothreitol (DTT, Sigma-Aldrich, St. Louis, MO, USA), filtered through a 40 μm mesh, and centrifuged to separate the supernatant from cells. Cytospins were then prepared and stained with May-Grunwald-Giemsa for differential cell counting. At least 400 inflammatory cells were counted for each cytospin slide. The number of inflammatory cells was recorded as a percentage of total non-squamous cells. Finally, cells were re-suspended in 1 mL PBS and aliquoted to 106 cells per cryotube. Aliquots were centrifuged; the pellet was re-suspended in 150 µL RNAlater solution (Sigma-Aldrich) and stored at −80°C. Sputum supernatants were also stored at −80°C.
Antibody Microarray
Sputum supernatant samples from all healthy control subjects and subgroups of patients with stable COPD and AECOPD (n=19 for each) were subjected to antibody microarray analysis. Both stable and exacerbated patients were randomly allocated into these subgroups. In the assay, 1 mL sputum supernatant was used to simultaneously detect 120 cytokines using Human Cytokine Antibody Array VI+VII (Raybiotech, Norcross, GA, USA), as previously described.21,22 Briefly, nitrocellulose membranes coated with specific primary antibodies against human cytokines were incubated with sputum supernatant samples at room temperature (RT) for 2 hrs. The membranes were washed, and 1 mL of specific secondary, biotin-conjugated antibodies were added and incubated at RT for 2 hrs. After a wash, membranes were incubated with 2 mL of horseradish peroxidase-conjugated streptavidin at RT for 1 hr. Signal intensities were recorded using a chemiluminescence imaging system and analyzed with GeneTools software (Syngene, Cambridge, UK). The exposure time was 15 min. The raw intensity level detected at each spot was background corrected and then normalized using the average intensity of the positive control spots. Relative intensities were calculated by dividing the background-corrected and normalized intensity of each sample spot by that of the corresponding control spot.
RNA Isolation
Sputum samples collected from stable COPD patients and AECOPD patients were subjected to RNA isolation and subsequent gene expression analysis. Total RNA extraction was performed from 106 sputum cells using RNeasy Plus Mini Kit (Qiagen, Düsseldorf, Germany), according to the method established previously in our laboratory.20 Nonetheless, even using this optimized protocol for RNA isolation from sputum, only a limited number of cytokines could be examined at mRNA level in our study (see below). The integrity of the isolated RNA was determined using the cycle threshold (Ct) of different base-pair (bp)-length amplicons of glyceraldehyde 3-phosphate dehydrogenase (GAPDH) in qPCR assays, as previously described.23
An attempt was made to isolate RNA from induced sputum of healthy controls as well. However, apart from four subjects, the amount of extracted RNA was insufficient for gene expression profiling. Therefore, samples of healthy controls were omitted from qPCR assays.
PCR
RNA isolates were quality checked for the presence of contaminating bacterial DNA by PCR using universal bacterial primers producing a 466 bp long amplicon, as described before.24 PCR was performed with Phire DNA Polymerase kit (Thermo Fisher Scientific, Waltham, MA, USA). Amplicons were identified by electrophoresis (100 V, 60 min) on 2% agarose gel (Serva, Heidelberg, Germany) cast in TBE buffer (Duchefa Biochemie, Haarlem, Netherlands). For visualization 7 µL GR Safe nucleic acid stain (Lab Supply Mall, Gaithersburg, MD, USA) was used.
RT
2.0 µg of total RNA (in 80 µL reaction volume) was reverse transcribed using the High Capacity cDNA Reverse Transcription kit (Life Technologies, Foster City, CA, USA) with the following profile: 10 min at 25°C, 120 min at 37°C, and 5 min at 85°C.24 Random hexamers (500 nmol) were used as primers.
Real-Time PCR
Real-Time PCR (qPCR) reactions were carried out with 2 µL cDNA sample in a total reaction mixture of 20 µL containing 10 µL 2× iTaq Universal Probes Supermix (Bio-Rad, Hercules, CA, USA) and 1 µL Taqman probe (Life Technologies) for the following 14 cytokines/chemokines: IL-1α, IL-1 receptor antagonist (IL-1Ra), IL-6, IL-8, growth-regulated oncogene (GRO)α, regulated upon activation, normal T cell expressed and secreted (RANTES), monokine-induced by interferon-γ (MIG), macrophage colony-stimulating factor (M-CSF), CK beta 8–1, osteoprotegerin (OPG), bone morphogenetic protein (BMP)-4, BMP-6, glial cell line-derived neurotrophic factor (GDNF) and Acrp30 (ADP). Cytokines selected for qPCR assay were chosen based on the results of the protein microarray: ie cytokines that were either differentially expressed between stable COPD and AECOPD or showed altered expression upon treatment of exacerbation. GNB2L1 and PPIA were selected as housekeeping genes that are stably expressed in lung tissue. Amplification in qPCR assays was performed with the following protocol: initial denaturation at 95°C for 30 sec, followed by 40 cycles (95°C for 15 sec, 55°C for 30 sec, and 72°C for 60 sec) as previously described.24
Statistical Analysis
Data are presented as mean±SEM or median with interquartile range, as appropriate. Data distribution was analyzed by the Kolmogorov–Smirnov test. Relative cytokine expressions were compared using either the Kruskal–Wallis test followed by the Dunns-test for multiple comparisons or the Wilcoxon signed-rank test. Ct values were analyzed by the Mann–Whitney test or the Kruskal–Wallis test followed by the Dunn’s test. Fold changes in gene expression levels between the groups were calculated by the pairwise fixed reallocation randomization test.25 Paired Student’s t-test (parametric data) and the Wilcoxon signed-rank test (non-parametric data) were used to compare variables measured at the time of hospital admission and discharge. Correlation coefficients were calculated by Spearman’s method. Calculations were performed by GraphPad Prism 4.0 (GraphPad Software Inc., San Diego, CA, USA). A p-value <0.05 was considered significant.
Results
Clinical Variables During Treatment of AECOPD
Exacerbations were treated with systemic glucocorticoids, bronchodilators (short- or long-acting anticholinergics and/or β2-agonists), and oxygen in all cases. Antibiotics were given to 24 patients. As expected, during the course of recovery, lung function variables and arterial oxygen tension increased, while C-reactive protein (CRP), FENO levels, and sputum total cell counts decreased (Table 1).
Antibody Microarray
Analyzing the sputum cytokine profile of stable COPD patients, only two cytokines, IL-6 and GROα exhibited significantly altered expression level (2.63- and 2.24-fold increase, respectively; p<0.05 for each) compared with controls.
In contrast, signal intensities for several cytokines were significantly increased or decreased at the onset of AECOPD. Treatment of AECOPD resulted again in markedly different cytokine profiles in patients as evidenced by microarray analysis of sputum samples collected at the time of hospital discharge. Cytokines with significantly different expression levels are presented in Table 2, while signal intensities for the 14 cytokines selected for qPCR analysis are presented in Figure 2.
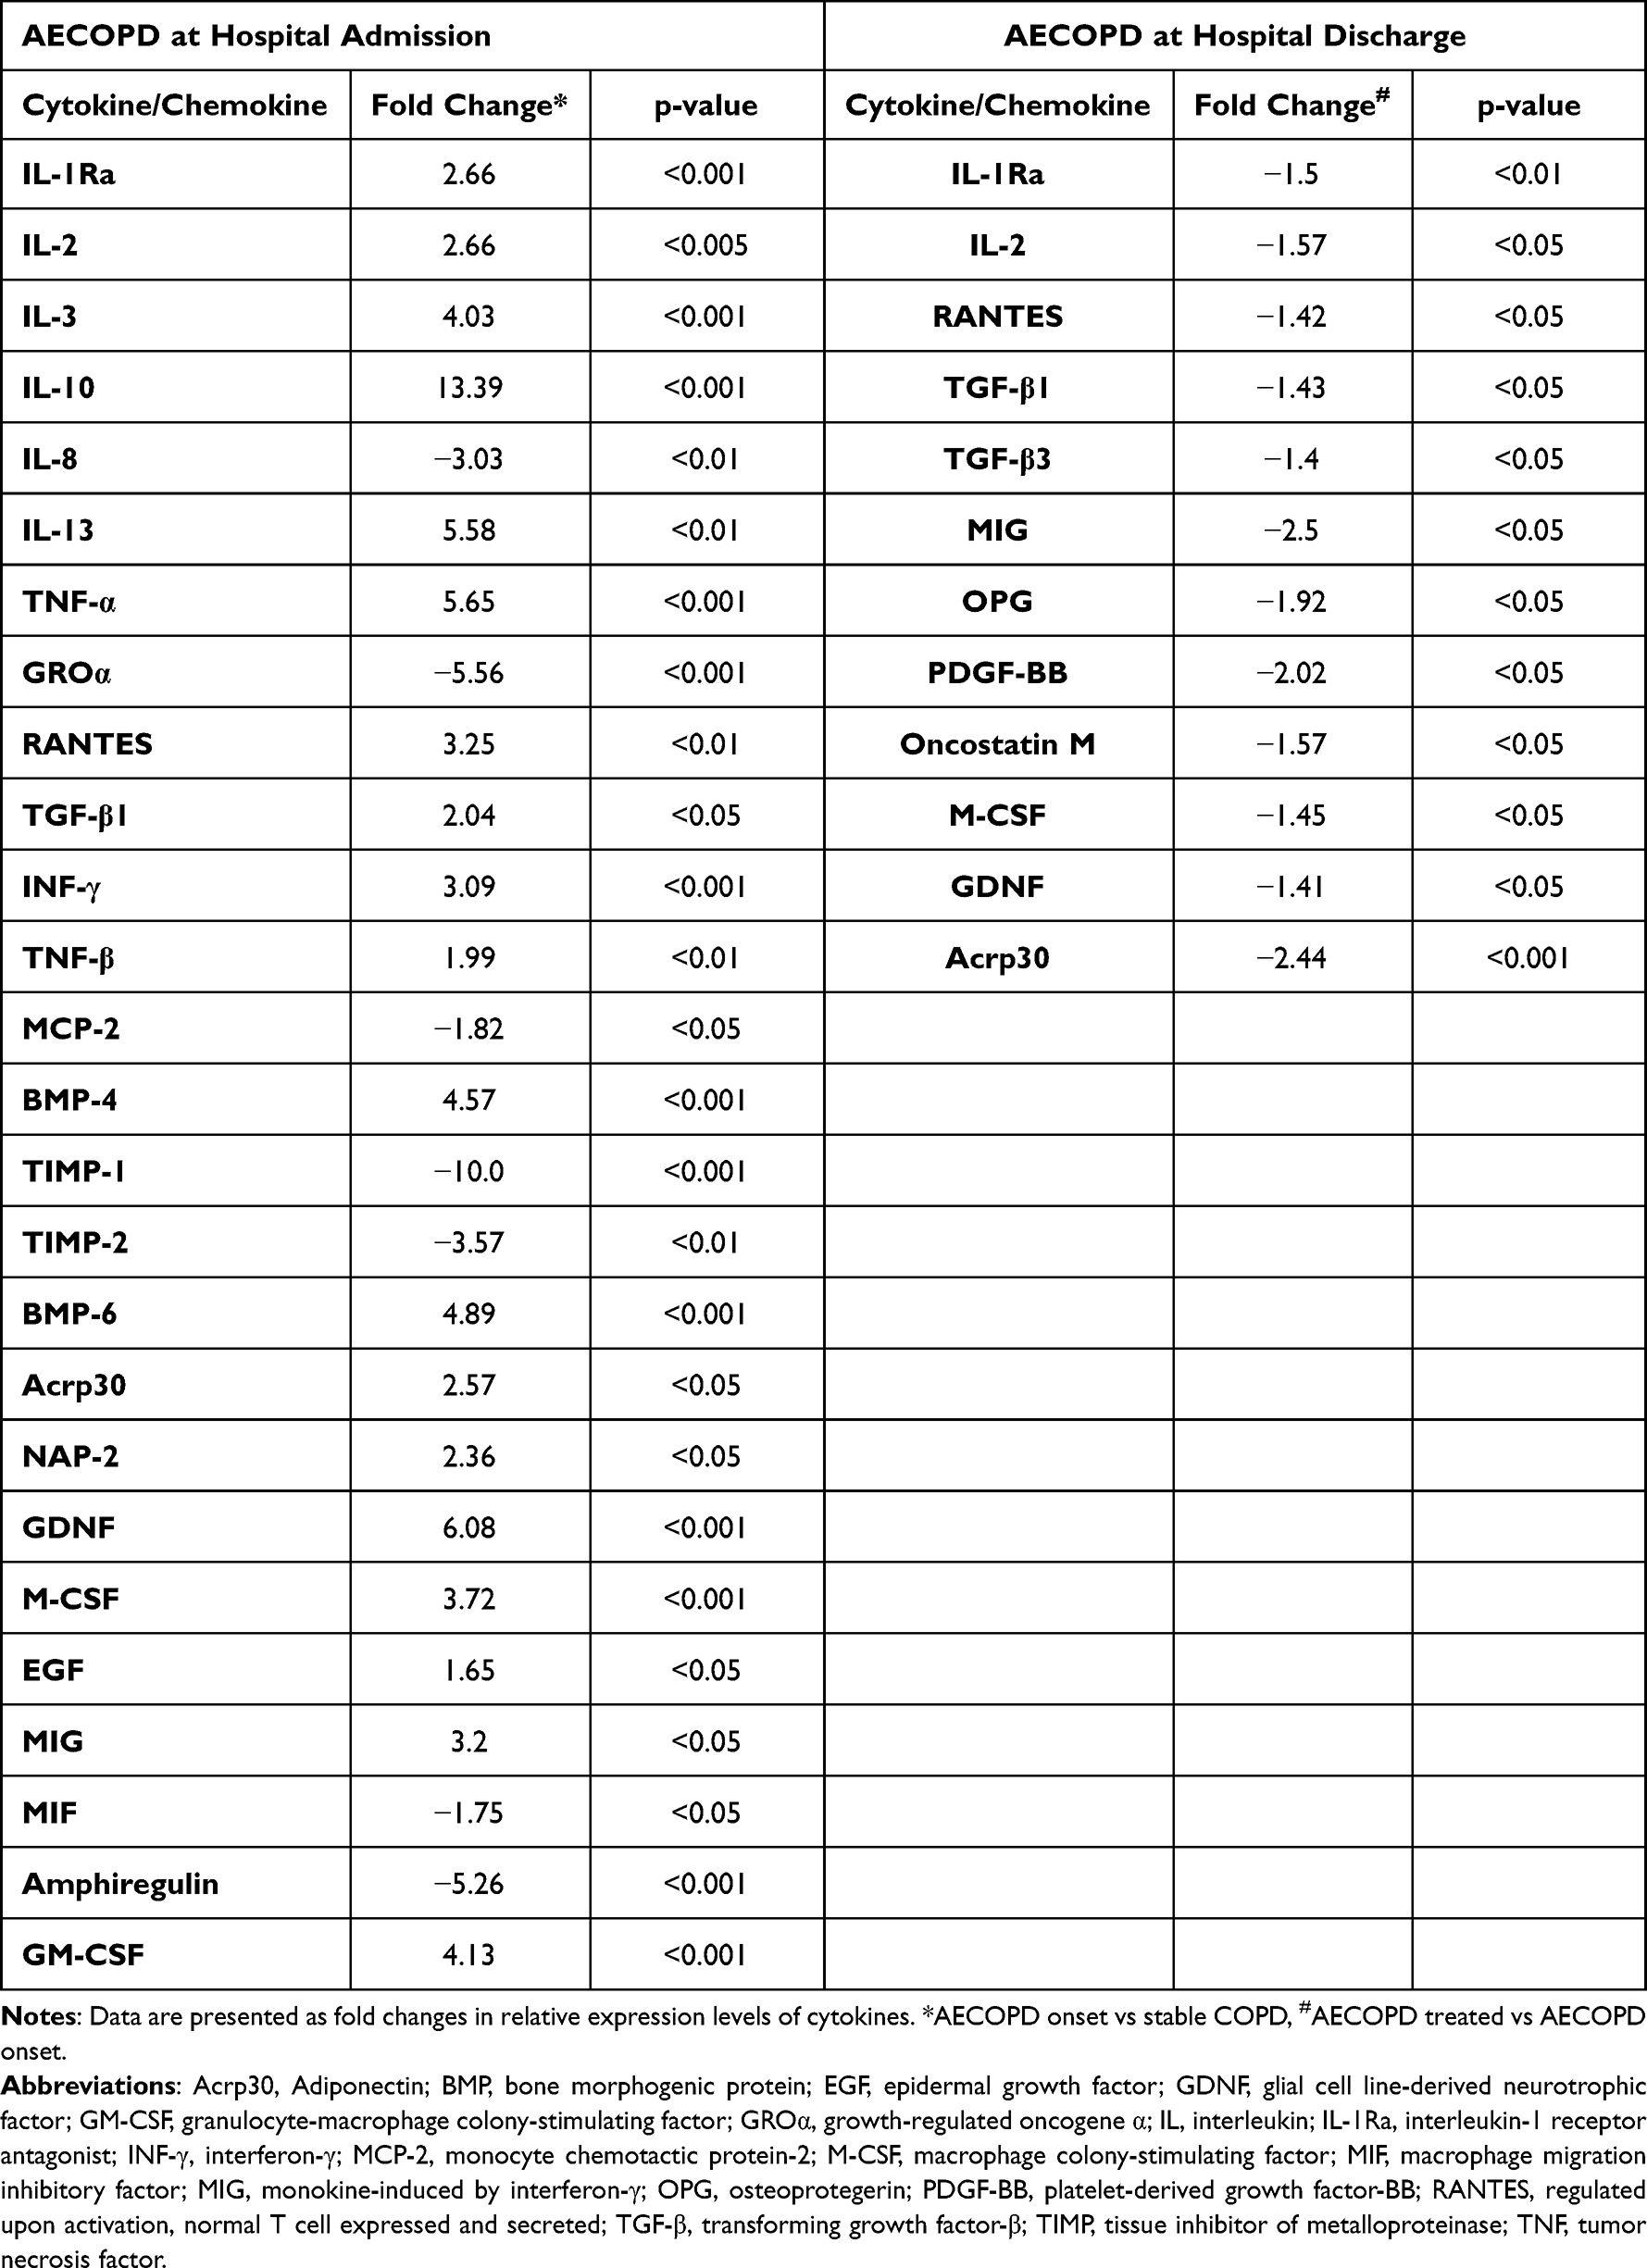 |
Table 2 Sputum Cytokines/Chemokines with Significant Changes at the Protein Level at the Onset of AECOPD and Upon Treatment |
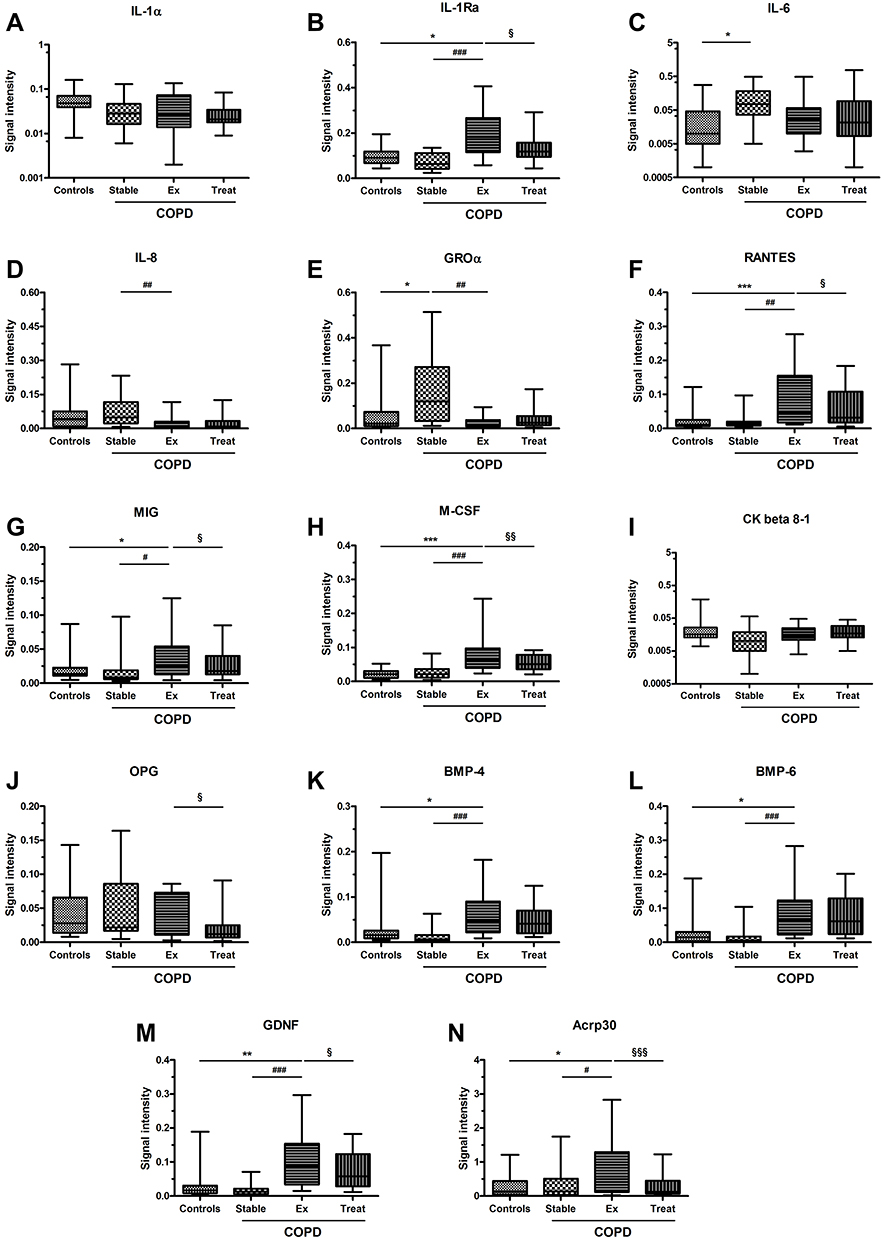 |
Figure 2 Signal intensities of cytokines (panel A-D) and chemokines (panel E-N) determined by antibody microarray in sputum supernatant of healthy controls (Controls), stable COPD patients (Stable) and AECOPD patients at the time of acute exacerbation (Ex) and after hospital treatment (Treat). Standard box plots with median (25th and 75th percentiles) and whiskers (at minimum and maximum values) are shown. *p<0.05, **p<0.01 and ***p<0.001 vs controls; #p<0.05, ##p<0.01 and ###p<0.001 vs stable COPD; §p<0.05, §§p<0.01 and §§§p<0.001 vs after treatment. |
Gene Expression Analysis
From the 14 cytokines selected for qPCR analysis, BMP-4 mRNA was up-regulated (p<0.05), while IL-1α, MIG and BMP-6 mRNAs were down-regulated at the onset of AECOPD compared to stable COPD (p<0.001, p<0.001 and p<0.01, respectively; Table 3). The initial phase of recovery from exacerbation did not result in significant changes in cytokine gene expressions (p>0.05 for each) at the time of hospital discharge. Consequently, IL-1α, and MIG were still expressed at a lower level compared to the stable state (p<0.05 for each). Finally, IL-1Ra was down-regulated in patients with AECOPD, reaching statistical significance by the time of discharge (p<0.01). GDNF and ADP genes were not detectable at the mRNA level.
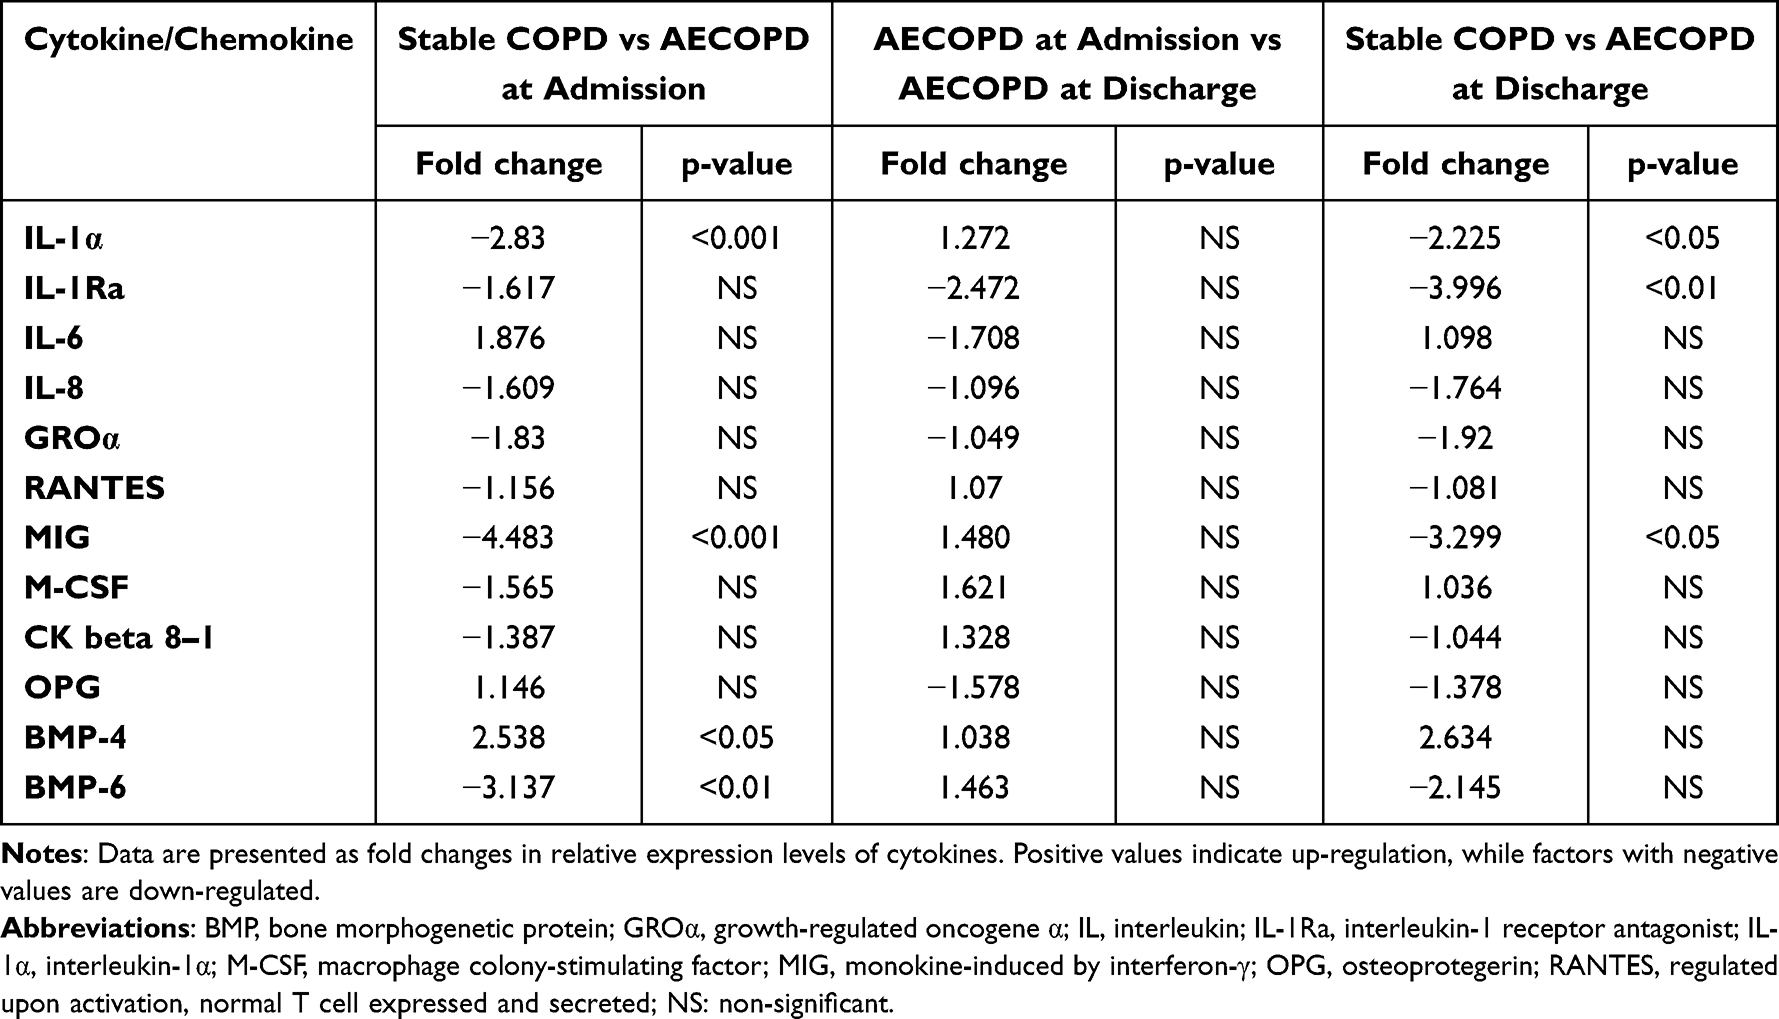 |
Table 3 Comparison of Cytokine mRNA Levels Between Different Study Groups |
Correlations Between Gene Expression Levels and Clinical Variables
In stable COPD patients, BMP-4 gene expression showed significant correlations with sputum total cell counts (r=0.528, p<0.05) and CRP level (r=0.452, p<0.05), while CK beta 8–1 was associated with sputum neutrophil cell ratio (r=0.546, p<0.01). M-CSF gene expression also correlated with CRP level (r=0.437, p<0.05).
At the onset of AECOPD, a positive correlation was found between sputum lymphocyte cell ratio and IL-8, GROα and BMP-6 gene expression levels (r=0.445, p<0.05, r=0.369, p<0.05, r=0.491, p<0.05, respectively). In contrast, CRP level was negatively associated with RANTES, MIG and GROα expression (r=−0.444, p<0.05; r=−0.444, p<0.05 and r=−0.397, p<0.05, respectively) at this time point. Treatment of AECOPD resulted in the loss of all these correlations (data not shown). No other clinically important correlations were detected.
Discussion
The most striking finding of our study is that the cytokine profile of clinically stable COPD patients and those experiencing a severe acute exacerbation share little in common. In addition, our study demonstrates that changes in cytokine gene expression at the protein level are often asynchronous with mRNA level changes in AECOPD.
Previous COPD microarray studies used blood as the sample of choice.26–28 However, a respiratory sample, such as sputum is preferable as it is lung-specific, while blood contains a mixture of signature markers of several pathophysiological processes unfolding simultaneously in a patient.29 There were attempts to use exhaled breath condensate (EBC) to profile cytokines locally in the airways.30 Nonetheless, measurement of biomarkers in EBC has often poor reproducibility rendering this approach less suitable for assessing inflammatory processes in the airways.
Our findings that IL-6 and GROα expression levels were elevated in stable COPD patients are consistent with the important roles they play in the pathogenesis of COPD. GROα is a CXC chemokine with strong activating and chemotactic abilities for neutrophils, while IL-6 is an established pro-inflammatory cytokine that is involved in many of the systemic features of the disease.31
In AECOPD several cytokines displayed altered signal intensities. For example, the expression level of IL-1Ra, RANTES, MIG, M-CSF, BMP-4, BMP-6, GDNF, and Acrp30 was increased at the onset of AECOPD, while recovery from exacerbation lead to a decrease in signal intensities for Acrp30, IL-1Ra, MIG, RANTES, and M-CSF. Among these factors, RANTES is a potent chemoattractant that has been implicated in recruiting neutrophils and/or eosinophils into the airways during exacerbations.32 It may also be an important mediator of rhinovirus-induced inflammatory responses.33,34 Similarly, M-CSF has recently been implicated in COPD, particularly in exacerbations, as an important regulator of the differentiation and survival of inflammatory cells.31
Additionally, the expression of TNF-α, a key upstream inflammatory cytokine with a wide range of effects, was elevated in AECOPD.35 TNF-α has an important role in Th1-mediated immune responses, augmenting both IP-10 and MIG signaling downstream.36 These chemokines are induced by interferon (INF)-γ, likely, as part of a Th1-mediated immune response. Moreover, there is evidence from animal studies that respiratory syncytial virus infections, as frequent causes of exacerbations, enhance inflammation, apoptosis, and lung tissue destruction through the up-regulation of cytokines including INF-γ, RANTES, IL-13, MIG, and GM-CSF.37 Of importance, all these factors showed increased expression in AECOPD in our study. These cytokines are not only involved in local tissue injury but may promote anti-inflammatory responses that eradicate infectious agents.38,39 Overall, we presume that cytokines identified in AECOPD are primarily involved in the inflammatory responses initiated by bacterial or viral pathogens, as major causes of exacerbations, explaining the markedly different cytokine profile between exacerbated and stable patients.
It appears that the kinetics of the cytokines investigated in our study display a considerable difference during the course of AECOPD and the 7–14 day long hospitalization was insufficient for a number of cytokines to return to levels observed in stable COPD. This is perhaps not so surprising, as some cytokines may be involved in the recovery from exacerbation, while others may be responsible for the long-term effects of exacerbation on the patients’ condition. To investigate these issues, the recovery from exacerbation should be examined on a longer time scale.
Another salient finding of this study was that changes in gene expression observed at the protein level did not mirror those at the mRNA level for most cytokines investigated in our study. For example, while IL-1α, BMP-6, and MIG mRNA expressions were significantly down-regulated in AECOPD compared to stable disease, protein levels of these factors were either unchanged (IL-1α) or elevated (BMP-6, MIG). Similarly, changes in mRNA levels for IL-1Ra, M-CSF, and RANTES did not correlate with protein level changes during the course of AECOPD.
In contrast, changes in BMP-4 mRNA levels were closely mirrored at the protein level, both at the onset of AECOPD and after treatment. Similarly, GROα and IL-8 protein and mRNA levels moved in the same direction, although these changes only reached significance at the protein level. With regard to OPG, a down-regulation upon treatment was observed both at the mRNA and protein levels.
Although biological processes are typically driven by proteins, mRNA signatures are often used as a proxy to describe changes in functional pathways. However, our data is another case in point that changes in mRNA levels are not necessarily paralleled by similar changes in the corresponding protein levels. Post-transcriptional and post-translational modifications can profoundly affect the kinetics of mRNAs and proteins, which may partly explain the mismatch observed in our study between some mRNAs and their corresponding protein levels, in line with previous reports.40,41
Recently, BMP-4 was found to promote airway basal progenitor cell differentiation to smoking-related phenotypes that may be important in the development of airway remodeling in COPD.42 Therefore, it is of note that we found a correlation between BMP-4 gene expression and sputum cell count and systemic inflammation marker level. Moreover, we can speculate that the sustained up-regulation of BMP-4 gene expression could be one of the factors supporting tissue remodeling in AECOPD.
Several lines of evidence indicate that cigarette smoking is a confounding factor in the measurements of cytokines in the airways.1 Since our patient recruitment strategy called for ex-smokers only, acute smoke exposure did not influence our results.
Again, it is generally assumed that besides their barrier function epithelial cells are capable of influencing inflammatory responses in the airways, at least in asthma.43 Therefore, it is tempting to speculate that airway epithelial cells could also be involved in the production of the various cytokines/chemokines detected by the microarray in our study. On the other hand, it is also possible that the increased INF-γ expression in patients with AECOPD exerted an antagonistic regulatory effect on the gene expression profile of epithelial cells compared to IL-4, as previously suggested in some cell culture studies.44
Note that 60% of our stable COPD patients had GOLD stage I or stage II disease. We might have been able to detect more significant differences between the cytokine profiles of healthy controls and the stable COPD group if we had included patients with more advanced disease.
Finally, we believe that our findings have implications for further research. First, our proteomic study has revealed several novel cytokines potentially involved in the development and the long-term effects of AECOPD. However, the exact pathogenic role of these factors remains unclear and should be investigated in the future. Research should also address whether these cytokines could be used as therapeutic targets in the management of patients with AECOPD. Moreover, it would be worthy evaluating the relationship between cytokine patterns and long-term patients’ outcomes in terms of lung function decline, exacerbation frequency or treatment responsiveness. If such associations can be demonstrated, this would warrant applying our findings to phenotype COPD patients based on cytokine patterns, both in stable state and AECOPD. Finally, further studies are needed to compare the cytokine profile of the upper airways with the proteomic data obtained in this experiment in the sputum as a special biomatrix. Indeed, a recent study investigating the relationship of protein biomarkers in the upper versus the lower airways could identify several potential nasal proxy candidates for the lower airways in patients with asthma.45
Conclusion
In conclusion, using the highly sensitive antibody microarray technology, we demonstrated that the airway cytokine profile of stable COPD patients and those with AECOPD is markedly different. Moreover, changes in mRNA levels are not necessarily accompanied by similar changes in the corresponding protein levels in AECOPD, and it appears that the level of most cytokines is not stabilized during the time frame of a standard hospitalization indicating a long-lasting effect of exacerbation on the status of COPD patients. Overall, our data suggest that antibody microarray analysis is a suitable tool to characterize changes in the lung proteome. It is tempting to speculate that COPD patients can be phenotyped based on sputum cytokine patterns; however, this should be investigated in further studies involving a larger cohort.
Acknowledgments
We are grateful to Maria Mikoss (Department of Pathophysiology, National Koranyi Institute of Pulmonology) for technical assistance in laboratory measurements. The study was supported by the National Research, Development and Innovation Office (OTKA K124343 and 2020-1.1.6-JÖVÖ-2021-00003).
Disclosure
The authors report no conflicts of interest in this work.
References
1. Barnes PJ. Inflammatory mechanisms in patients with chronic obstructive pulmonary disease. J Allergy Clin Immunol. 2016;138:16–27.
2. Brightling C, Greening N. Airway inflammation in COPD: progress to precision medicine. Eur Respir J. 2019;54:1900651.
3. Caramori G, Casolari P, Barczyk A, Durham AL, Di Stefano A, Adcock I. COPD immunopathology. Semin Immunopathol. 2016;38:497–515.
4. Brandsma CA, Van den Berge M, Hackett TL, Brusselle G, Timens W. Recent advances in chronic obstructive pulmonary disease pathogenesis: from disease mechanisms to precision medicine. J Pathol. 2020;250:624–635.
5. Higham A, Quinn AM, Cançado JED, Singh D. The pathology of small airways disease in COPD: historical aspects and future directions. Respir Res. 2019;20:49.
6. Pavord ID. Biologics and chronic obstructive pulmonary disease. J Allergy Clin Immunol. 2018;141:1983–1991.
7. Brightling CE. Chronic obstructive pulmonary disease phenotypes, biomarkers, and prognostic indicators. Allergy Asthma Proc. 2016;37:432–438.
8. Barnes PJ. Inflammatory endotypes in COPD. Allergy. 2019;74:1249–1256.
9. Hultschig C, Kreutzberger J, Seitz H, Konthur Z, Büssow K, Lehrach H. Recent advances of protein microarrays. Curr Opin Chem Biol. 2006;10:4–10.
10. Dragonieri S, Tongoussouva O, Zanini A, Imperatori A, Spanevello A. Markers of airway inflammation in pulmonary diseases assessed by induced sputum. Monaldi Arch Chest Dis. 2009;71:119–126.
11. Gray RD, MacGregor G, Noble D, et al. Sputum proteomics in inflammatory and suppurative respiratory diseases. Am J Respir Crit Care Med. 2008;178:444–452.
12. Eickmeier O, Huebner M, Herrmann E, et al. Sputum biomarker profiles in cystic fibrosis (CF) and chronic obstructive pulmonary disease (COPD) and association between pulmonary function. Cytokine. 2010;50:152–157.
13. Hastie AT, Moore WC, Meyers DA, et al. National Heart, Lung, and Blood Institute Severe Asthma Research Program. Analyses of asthma severity phenotypes and inflammatory proteins in subjects stratified by sputum granulocytes. J Allergy Clin Immunol. 2010;125:1028–1036.
14. Singh D, Fox SM, Tal-Singer R, Bates S, Riley JH, Celli B. Altered gene expression in blood and sputum in COPD frequent exacerbators in the ECLIPSE cohort. PLoS One. 2014;9:e107381.
15. Singh D, Fox SM, Tal-Singer R, et al. ECLIPSE Investigators. Induced sputum genes associated with spirometric and radiological disease severity in COPD ex-smokers. Thorax. 2011;66:489–495.
16. Peters MC, Mekonnen ZK, Yuan S, Bhakta NR, Woodruff PG, Fahy JV. Measures of gene expression in sputum cells can identify TH2-high and TH2-low subtypes of asthma. J Allergy Clin Immunol. 2014;133:388–394.
17. Mamessier E, Boniface S, Dupuy P, Reynaud-Gaubert M, Vervloet D, Magnan A. Study of cytokine gene expression in small cell samples: use in induced sputum. J Immunol Methods. 2003;280:37–47.
18. Rabe KF, Hurd S, Anzueto A, et al. Global Initiative for Chronic Obstructive Lung Disease. Global strategy for the diagnosis, management, and prevention of chronic obstructive pulmonary disease: GOLD executive summary. Am J Respir Crit Care Med. 2007;176:532–555.
19. Drozdovszky O, Barta I, Antus B. Sputum eicosanoid profiling in exacerbations of chronic obstructive pulmonary disease. Respiration. 2014;87:408–415.
20. Paska C, Barta I, Drozdovszky O, Antus B. Elimination of bacterial DNA during RNA isolation from sputum: bashing bead vortexing is preferable over prolonged DNase treatment. PLoS One. 2019;14:e0214609.
21. Antus B, Barta I, Czebe K, Horvath I, Csiszer E. Analysis of cytokine pattern in exhaled breath condensate of lung transplant recipients with bronchiolitis obliterans syndrome. Inflamm Res. 2010;59:83–86.
22. Barta I, Kullmann T, Csiszer E, Antus B. Analysis of cytokine pattern in exhaled breath condensate of patients with squamous cell lung carcinoma. Int J Biol Markers. 2010;25:52–56.
23. Páska C, Bögi K, Szilák L, et al. Effect of formalin, acetone, and RNAlater fixatives on tissue preservation and different size amplicons by real-time PCR from paraffin-embedded tissue. Diagn Mol Pathol. 2004;13:234–240.
24. Paska C, Barta I, Drozdovszky O, Antus B. Improving gene-expression studies from sputum: a multistep optimization of RNA isolation and qPCR protocols. Am J Respir Cell Mol Biol. 2017;57:626–628.
25. Pfaffl MW, Horgan GW, Dempfle L. Relative expression software tool (REST) for group-wise comparison and statistical analysis of relative expression results in real-time PCR. Nucleic Acids Res. 2002;30:e36.
26. Zhang Y, Lin P, Hong C, et al. Serum cytokine profiles in patients with chronic obstructive pulmonary disease associated pulmonary hypertension identified using protein array. Cytokine. 2018;111:342–349.
27. Pinto-Plata V, Toso J, Lee K, et al. Profiling serum biomarkers in patients with COPD: associations with clinical parameters. Thorax. 2007;62:595–601.
28. Chen H, Wang Y, Bai C, Wang X. Alterations of plasma inflammatory biomarkers in the healthy and chronic obstructive pulmonary disease patients with or without acute exacerbation. J Proteomics. 2012;75:2835–2843.
29. Wagener AH, Yick CY, Brinkman P, van der Schee MP, Fens N, Sterk PJ. Toward composite molecular signatures in the phenotyping of asthma. Ann Am Thorac Soc. 2013;10(Suppl):S197–205.
30. Gessner C, Scheibe R, Wötzel M, et al. Exhaled breath condensate cytokine patterns in chronic obstructive pulmonary disease. Respir Med. 2005;99:1229–1240.
31. Barnes PJ. The cytokine network in chronic obstructive pulmonary disease. Am J Respir Cell Mol Biol. 2009;41:631–638.
32. Fujimoto K, Yasuo M, Urushibata K, Hanaoka M, Koizumi T, Kubo K. Airway inflammation during stable and acutely exacerbated chronic obstructive pulmonary disease. Eur Respir J. 2005;25:640–646.
33. Singanayagam A, Glanville N, Walton RP, et al. A short-term mouse model that reproduces the immunopathological features of rhinovirus-induced exacerbation of COPD. Clin Sci (Lond). 2015;129:245–258.
34. Edwards MR, Facchinetti F, Civelli M, Villetti G, Johnston SL. Anti-inflammatory effects of the novel inhaled phosphodiesterase type 4 inhibitor CHF6001 on virus-inducible cytokines. Pharmacol Res Perspect. 2016;4:e00202.
35. Yao Y, Zhou J, Diao X, Wang S. Association between tumor necrosis factor-α and chronic obstructive pulmonary disease: a systematic review and meta-analysis. Ther Adv Respir Dis. 2019;13:1753466619866096.
36. Fenwick PS, Macedo P, Kilty IC, Barnes PJ, Donnelly LE. Effect of JAK inhibitors on release of CXCL9, CXCL10 and CXCL11 from human airway epithelial cells. PLoS One. 2015;10:e0128757.
37. Foronjy RF, Dabo AJ, Taggart CC, Weldon S, Geraghty P. Respiratory syncytial virus infections enhance cigarette smoke induced COPD in mice. PLoS One. 2014;9:e90567.
38. Egesten A, Eliasson M, Johansson HM, et al. The CXC chemokine MIG/CXCL9 is important in innate immunity against Streptococcus pyogenes. J Infect Dis. 2007;195:684–693.
39. Waters JP, Pober JS, Bradley JR. Tumour necrosis factor in infectious disease. J Pathol. 2013;230:132–147.
40. Shebl FM, Pinto LA, García-Piñeres A, et al. Comparison of mRNA and protein measures of cytokines following vaccination with HPV-16 L1 virus like particles. Cancer Epidemiol Biomarkers Prev. 2010;19:978–981.
41. Chen G, Gharib TG, Huang CC, et al. Discordant protein and mRNA expression in lung adenocarcinomas. Mol Cell Proteomics. 2002;1:304–313.
42. Zuo WL, Yang J, Strulovici-Barel Y, et al. Exaggerated BMP4 signalling alters human airway basal progenitor cell differentiation to cigarette smoking-related phenotypes. Eur Respir J. 2019;53:1702553.
43. Frey A, Lunding LP, Ehlers JC, Weckmann M, Zissler UM, Wegmann M. More than just a barrier: the immune functions of the airway epithelium in asthma pathogenesis. Front Immunol. 2020;11:761.
44. Zissler UM, Chaker AM, Effner R, et al. Interleukin-4 and interferon-γ orchestrate an epithelial polarization in the airways. Mucosal Immunol. 2016;9:917–926.
45. Zissler UM, Ulrich M, Jakwerth CA, et al. Biomatrix for upper and lower airway biomarkers in patients with allergic asthma. J Allergy Clin Immunol. 2018;142:1980–1983.
 © 2022 The Author(s). This work is published and licensed by Dove Medical Press Limited. The
full terms of this license are available at https://www.dovepress.com/terms
and incorporate the Creative Commons Attribution
- Non Commercial (unported, 3.0) License.
By accessing the work you hereby accept the Terms. Non-commercial uses of the work are permitted
without any further permission from Dove Medical Press Limited, provided the work is properly
attributed. For permission for commercial use of this work, please see paragraphs 4.2 and 5 of our Terms.
© 2022 The Author(s). This work is published and licensed by Dove Medical Press Limited. The
full terms of this license are available at https://www.dovepress.com/terms
and incorporate the Creative Commons Attribution
- Non Commercial (unported, 3.0) License.
By accessing the work you hereby accept the Terms. Non-commercial uses of the work are permitted
without any further permission from Dove Medical Press Limited, provided the work is properly
attributed. For permission for commercial use of this work, please see paragraphs 4.2 and 5 of our Terms.