")
Back to Journals » Infection and Drug Resistance » Volume 16
Spatiotemporally Comparative Analysis of HIV, Pulmonary Tuberculosis, HIV-Pulmonary Tuberculosis Coinfection in Jiangsu Province, China
Authors Wu Z , Fu G, Wen Q, Wang Z, Shi LE, Qiu B , Wang J
Received 20 April 2023
Accepted for publication 15 June 2023
Published 23 June 2023 Volume 2023:16 Pages 4039—4052
DOI https://doi.org/10.2147/IDR.S412870
Checked for plagiarism Yes
Review by Single anonymous peer review
Peer reviewer comments 2
Editor who approved publication: Professor Suresh Antony
Zhuchao Wu,1,* Gengfeng Fu,2,* Qin Wen,1,* Zheyue Wang,1 Lin-en Shi,2 Beibei Qiu,1 Jianming Wang1,3,4
1Department of Epidemiology, Center for Global Health, School of Public Health, Nanjing Medical University, Nanjing, 211166, People’s Republic of China; 2Department of STI and HIV Control and Prevention, Center for Disease Control and Prevention of Jiangsu Province, Nanjing, 210009, People’s Republic of China; 3Department of Epidemiology, Gusu School, Nanjing Medical University, Nanjing, 211166, People’s Republic of China; 4Changzhou Medical Center, Nanjing Medical University, Nanjing, 211166, People’s Republic of China
*These authors contributed equally to this work
Correspondence: Jianming Wang, Department of Epidemiology, Center for Global Health, School of Public Health, Nanjing Medical University, Nanjing, 211166, People’s Republic of China, Tel +86-25-86868414, Email [email protected]
Purpose: Pulmonary tuberculosis (PTB) is a severe chronic communicable disease that causes a heavy disease burden in China. Human Immunodeficiency Virus (HIV) and PTB coinfection dramatically increases the risk of death. This study analyzes the spatiotemporal dynamics of HIV, PTB and HIV-PTB coinfection in Jiangsu Province, China, and explores the impact of socioeconomic determinants.
Patients and Methods: The data on all notified HIV, PTB and HIV-PTB coinfection cases were extracted from Jiangsu Provincial Center for Disease Control and Prevention. We applied the seasonal index to identify high-risk periods of the disease. Time trend, spatial autocorrelation and SaTScan were used to analyze temporal trends, hotspots and spatiotemporal clusters of diseases. The Bayesian space-time model was conducted to examine the socioeconomic determinants.
Results: The case notification rate (CNR) of PTB decreased from 2011 to 2019 in Jiangsu Province, but the CNR of HIV and HIV-PTB coinfection had an upward trend. The seasonal index of PTB was the highest in March, and its hotspots were mainly distributed in the central and northern parts, such as Xuzhou, Suqian, Lianyungang and Taizhou. HIV had the highest seasonal index in July and HIV-PTB coinfection had the highest seasonal index in June, with their hotspots mainly distributed in southern Jiangsu, involving Nanjing, Suzhou, Wuxi and Changzhou. The Bayesian space-time interaction model showed that socioeconomic factor and population density were negatively correlated with the CNR of PTB, and positively associated with the CNR of HIV and HIV-PTB coinfection.
Conclusion: The spatial heterogeneity and spatiotemporal clusters of PTB, HIV and HIV-PTB coinfection are exhibited obviously in Jiangsu. More comprehensive interventions should be applied to target TB in the northern part. While in southern Jiangsu, where the economic level is well-developed and the population density is high, we should strengthen the prevention and control of HIV and HIV-PTB coinfection.
Keywords: pulmonary tuberculosis, HIV, spatial autocorrelation analysis, socioeconomic determinants, Bayesian space-time interaction model
Introduction
Infectious disease is an important contributor to the global burden of death and disability. Tuberculosis (TB), a chronic contagious disease mainly caused by Mycobacterium tuberculosis (M.tb) infection, is getting ahead of infectious diseases worldwide, leading to high morbidity and mortality in low and middle-income countries.1,2 The World Health Organization (WHO) reported that the estimated incidence of TB in China was 59/100,000, accounting for 8.5% of global cases, ranking second among the 30 countries with a high TB burden.3 Specifically, China faces many challenges in the prevention of TB, including a high TB resistance rate, TB infection rate, and coinfection with HIV is also prevalent.4 The target of reducing TB incidence by 90% and mortality by 95% by 2035 will remain elusive.5
Due to its strong infectivity, pulmonary tuberculosis (PTB) endangers the health of others and social stability.2 Previous studies have demonstrated some factors associated with PTB,6,7 including economic levels, access to health care, air pollutants, overcrowding, and PTB existed heterogeneity in the spatial and temporal distribution.8–10 A study conducted in mainland China showed that the risk of PTB was significantly higher in western areas than in eastern and central regions. It may be attributed to the different economic levels, health service systems, and facilities in different areas.11 Chen et al reported that the high-risk areas of TB were distributed in the southeast and northeast of Chongqing, China, which might be related to the more aging and empty-nesting population and lower economic levels.12 The Human Immunodeficiency Virus/Acquired Immunodeficiency Syndrome (HIV/AIDS) epidemic affects the transmission dynamic of TB.13 There is a strong synergy between HIV and TB infection. TB is a common opportunistic infection and a significant cause of death among people living with HIV (PLHIV). HIV/AIDS may further worsen the situation by enhancing the risk of latent TB activation and recurrence after TB infection.14–16 The WHO estimated there would be 1.5 million new HIV infections globally in 2021.17 The prevalence rate of HIV infection in China is relatively low compared with those in other countries, but the distribution of HIV is unbalanced.18 The factors affecting the spatial and temporal distribution of HIV are also diverse. Frequent cross-border exchanges, drug abuse, and low educational and economic levels contributed to the HIV/AIDS epidemic in western and southwestern China.19 However, sociodemographic indicators such as per capita gross domestic product (PGDP), population density, and health facilities were positively correlated with HIV/AIDS among men who have sex with men (MSM) in China.20 Spatial analysis in Sichuan Province showed that hot spots were mainly clustered in central Sichuan in 2018 but gradually spread to southwest and northwest in 2019–2020; the high population density and convenient transportation promoted the HIV transmission.20 It can be seen that the influencing factors of HIV and TB are different, and their spatial and temporal distribution characteristics may be diverse.
Regarding PTB control operations, spatial distribution is critical in determining the efficacy of national TB control programs, particularly in economically less-developed regions.21 Thus, a better understanding of the spatiotemporal epidemiology of diseases and the implementation of specific interventions in areas with a high disease burden can effectively prevent and control the infection. Geographical information systems (GIS) can identify spatiotemporal disease patterns.22,23 GIS enables the visualization of infectious diseases and explores disease hotspots through spatiotemporal analyses. Scholars revealed that active TB cases in hotspots cause 2.6 times as many secondary infections as similar cases in the general community.21 Therefore, it is of significance to prioritize resource allocation by identifying hotspots with a high disease burden in China.
Most previous studies have focused on the single infection of PTB or HIV/AIDS,8,9,19,24 but a survey in 10 provinces and cities in China showed that nearly a third of newly diagnosed HIV/AIDS patients suffered from TB.25 Virological failure tends to occur in PLHIV infected with TB, leading to high TB-related mortality in PLHIV.26–28 A survey conducted in Kenya showed that the proportion of HIV-TB coinfection ranged from 26.3% to 36.3% among new TB cases.29 Alene et al reported that the overall prevalence of HIV infection among TB patients was 7.4% in Ethiopia, and they found that the spatial heterogeneity in TB prevalence among HIV patients was significantly associated with socioeconomic factors such as low adult literacy, low wealth index, and proximity to international borders.30 More than 60% of HIV-TB coinfection cases have PTB and the other 25% are diagnosed with concomitant pulmonary and extrapulmonary TB.31 There were few studies on the characteristics of spatiotemporal change and influencing factors of HIV-PTB coinfection in China. Thus, with the help of ecological research and the Bayesian space-time model, our study aimed to explore the spatiotemporal distribution characteristics of PTB, HIV and HIV-PTB coinfection and examine the role of socioeconomic factors on case notification rate (CNR) in Jiangsu.
Materials and Methods
Study Site
The study was conducted in Jiangsu Province, China, with a total area of 107,200 km2. It locates on the coast of mainland China between latitudes 30°45’ to 35° 08’N and longitudes 116°21’ to 121°56’E (Figure S1). The province is comprised of 13 prefecture-level cities and 95 counties, which can be grouped into three macroregions (South, Central and North).
Data Sources
We collected data on notified cases of PTB, HIV and HIV-PTB coinfection in 95 counties of Jiangsu Province from 2011 to 2019 from the Jiangsu Provincial Center for Disease Control and Prevention. Data was downloaded according to the conditions of the onset date, current address, and audited status. Population density, PGDP, per capita disposable income (PCDI), the number of health technicians (per 1000 people), and the number of beds in health institutions (per 1000 people) were extracted online from the Jiangsu Provincial Statistics Bureau (http://stats.jiangsu.gov.cn/). The vector map files were obtained from the Resource and Environment Science and Data Center.
Case Definition
PTB was diagnosed following the national standard of WS 288–2017, where it was described as bacteriologically verified or clinically diagnosed TB derived from lung parenchyma or the tracheobronchial tree.5 The diagnosis of HIV infection referred to the national standard of WS 293–2019, a positive HIV-1/2 antibody test, or a positive etiological test. HIV-PTB coinfection was defined as a person who has both HIV infection and PTB disease.
Statistical Methods
A Joinpoint Regression Model
We used the joinpoint regression analysis to examine annual trends of the HIV, PTB and HIV-PTB coinfection case notification rate by calculating the average annual percentage change.
Seasonal Trend Analysis
The seasonal index is calculated as the ratio of the average number of cases in a given month to the average monthly number of cases in a 9 * 12-month period (2011–2019). An index value close to 1.0 indicates no seasonal trend.
Spatiotemporal Cluster Analysis
According to the patient’s address, we defined the national standard area code and associated it with vectorized electronic maps. The CNR in each county was divided into five levels: non-epidemic area, low epidemic area, low-medium epidemic area, medium-high epidemic area and high epidemic area. The Moran’s I statistic was used to evaluate the presence and direction of spatial autocorrelation over the whole study area and to test the assumption of spatial independence. The spatial clustering analysis used the Getis-Ord Gi* statistic to explore spatial hotspots. Identification of the spatiotemporal high-risk groups was then addressed with a space-time permutation model utilizing Kulldorff’s space-time scan statistics.32 The times of the Monte Carlo simulation were set as 999, and the maximum size of the spatial and temporal window was determined as 50% of the risk population and 50% of the period. The test level α was set as 0.05.
Bayesian Space-Time Model
The Bayesian space-time model was established to evaluate the impact of socioeconomic factors, population density and health resources on the CNR at the county level. We assumed that the number of notified cases (Yi,t) in county i, year t (t= 2011, …, 2019) followed the Poisson distribution. That was Yi,t~Poisson(λi,t), where 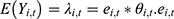 represented the expected number of notified cases in the county i, year t, which was computed as the product of the average CNR rate of Jiangsu and the population of each county during the nine years; θi,t was the ratio of the actual value of CNR to the expected value of CNR in county i, year t, namely, the relative rate (RR) value of CNR. We used the log function form of θi,t to establish the Bayesian space-time interaction model as the following:33


α0 was the intercept, Xk,i,t was the kth socioeconomic or health resource factor variable in county i and year t; βk was the regression coefficient of the corresponding variable, whose prior distribution was normal. Besag-York-Mollie (BYM) model was applied to estimate the spatial components, which were composed of spatially structured random effect μi and spatially unstructured random effect vi. μi was generally considered to obey a conditional autoregressive prior structure (CAR) in the spatial epidemiology of infectious diseases,34,35 indicating that county i is more closely related to the disease CNR patterns of neighboring counties. The vi was supposed to be subject to a normal distribution, meaning that the CNR in that county differed from the neighboring counties and had an independent pattern. The time trend effect was also represented by gt, which obeyed a 1-order random walk model. Furthermore, δi,t defined the space-time interaction term. The spatial weight matrix adopted a simple adjacency-weight matrix. Four different models were conducted in the analysis of the Bayesian space-time model:


Space-time interaction effect model: 
We used the deviance information criterion (DIC) to select the Bayesian model. The model was developed as a computationally efficient alternative to Markov Chain Monte Carlo (MCMC) and incorporated into WinBUGS1.4.3 (Windows-based Bayesian inference Using Gibbs Sampling). Finally, the posterior kernel densities and history plots of the parameters were used to examine the convergence of the Markov chains. More details regarding the specific Bayesian spatiotemporal model were provided in the Supplemental Method.
Results
Descriptive Analysis of PTB, HIV and HIV-PTB Coinfection
A total of 30,6360 PTB cases were reported in Jiangsu Province from 2011 to 2019, with the CNR decreasing from 50.86/100,000 to 32.60/100,000. At the same time, the CNR of HIV increased from 2.01/100,000 in 2011 to 5.34/100,000 in 2019, and the reported cases of HIV-PTB coinfection risen from 81 to 116, with an average annual rate of 0.13/100,000 (Table 1). As shown in Figures 1–3, the areas with a high prevalence of PTB were mainly in northern Jiangsu, such as Lianyungang, Xuzhou, and Suqian, while the areas with a high prevalence of HIV were distributed in southern Jiangsu, including Suzhou, Wuxi, Changzhou and Nanjing. A high prevalence of HIV-PTB coinfection was found in Yixing and Qidong. The joinpoint regression analysis indicated that the CNR of PTB and HIV could be divided into two stages: 2011–2014 and 2015–2019. HIV-PTB coinfection was in a steady state of growth, and an annual percent change (APC) was 5.4% from 2011 to 2019 (Table S1).
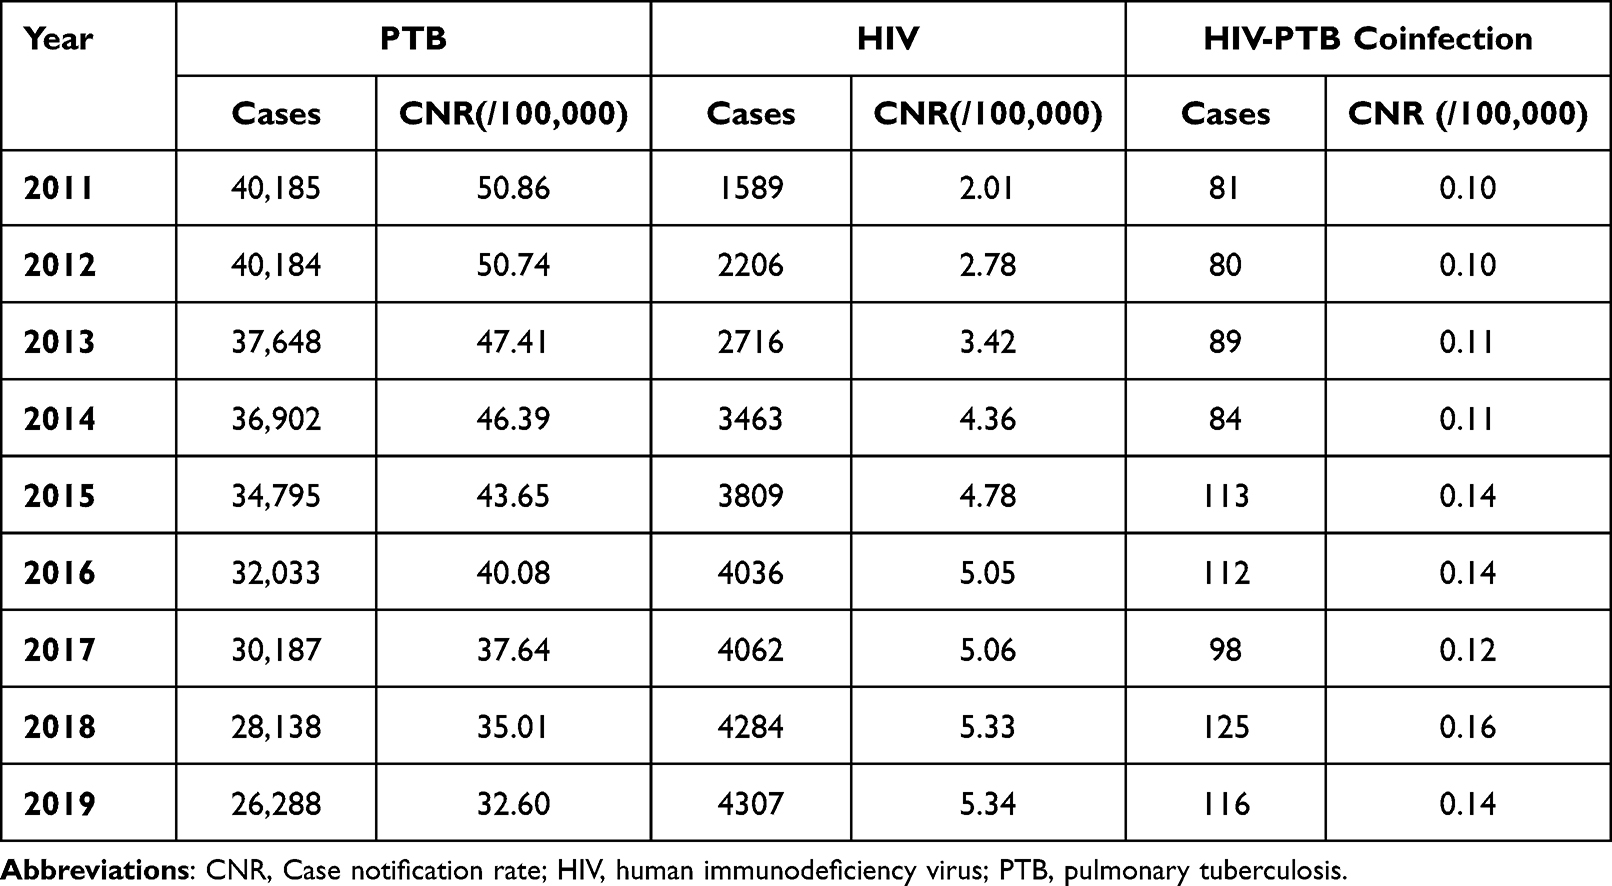 |
Table 1 Annual CNR of PTB, HIV and HIV-PTB Coinfection in Jiangsu Province |
 |
Figure 1 Spatial distribution of PTB notification rates in Jiangsu Province from 2011 to 2019. |
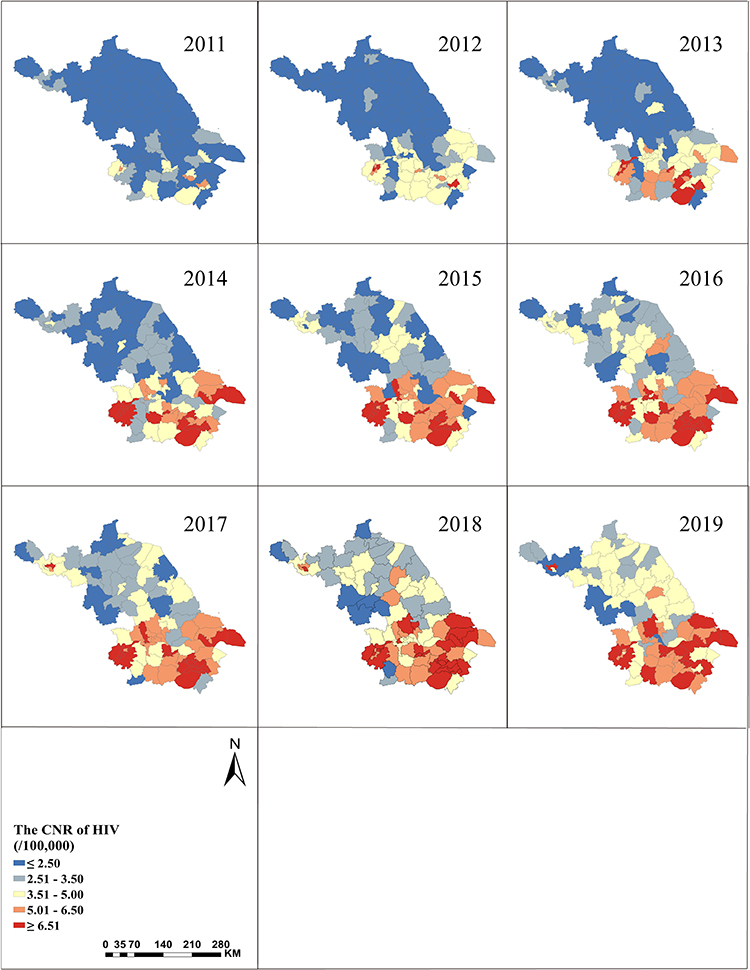 |
Figure 2 Spatial distribution of HIV notification rates in Jiangsu Province from 2011 to 2019. |
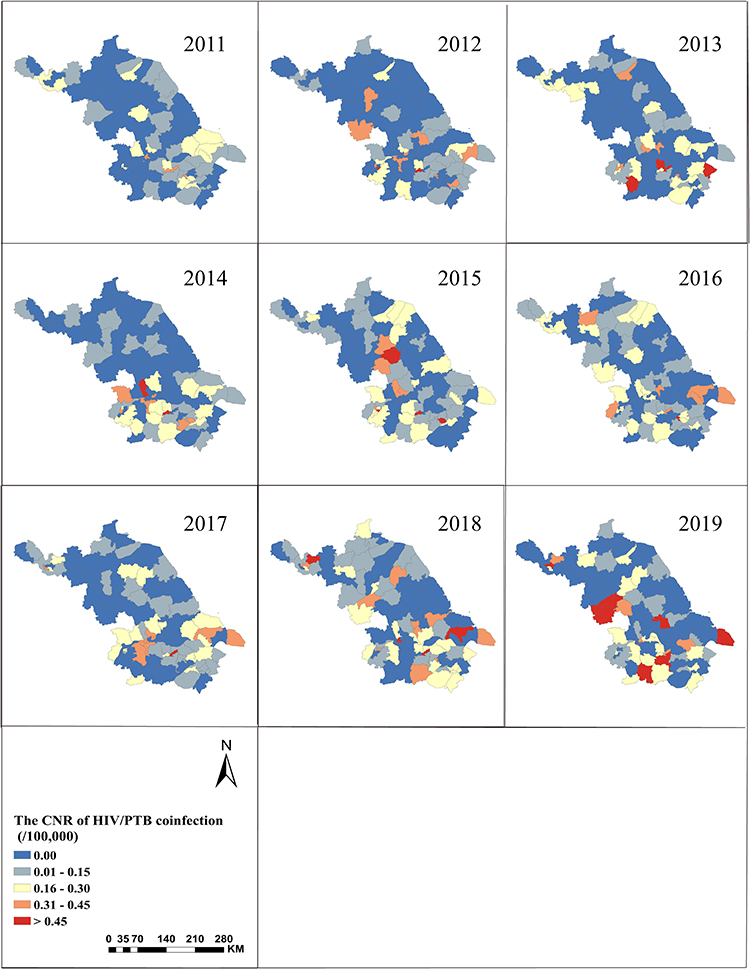 |
Figure 3 Spatial distribution of HIV-PTB coinfection notification rates in Jiangsu Province from 2011 to 2019. |
Spatiotemporal Distribution of PTB
From 2011 to 2019, the prominent epidemic peak of PTB was from March to May, and the maximum seasonal index was 1.16 in March. The notified cases dropped from November to January (Table S2). Moran’s I value and Z-scores indicated that the CNR of PTB have spatial clustering characteristics during this period (Table 2). Getis-ord Gi* hotspot analysis demonstrated that the PTB hotspots are mainly distributed in northern and central Jiangsu (Figure 4). According to the space-time permutation model, one most likely high-risk spatiotemporal clustering county and five secondary-risk clustering counties of PTB were observed (P<0.001). The first cluster area comprised twenty-four counties distributed principally in Suzhou, Wuxi, and Changzhou from June 2017 to December 2019. The second cluster area was found in Baoying from May 2013 to June 2013. The third cluster involved eleven counties predominantly distributed in Yancheng from September 2011 to March 2013 (Table S3).
 |
Table 2 Spatial Auto-Correlation Analysis of PTB, HIV and HIV-PTB Coinfection |
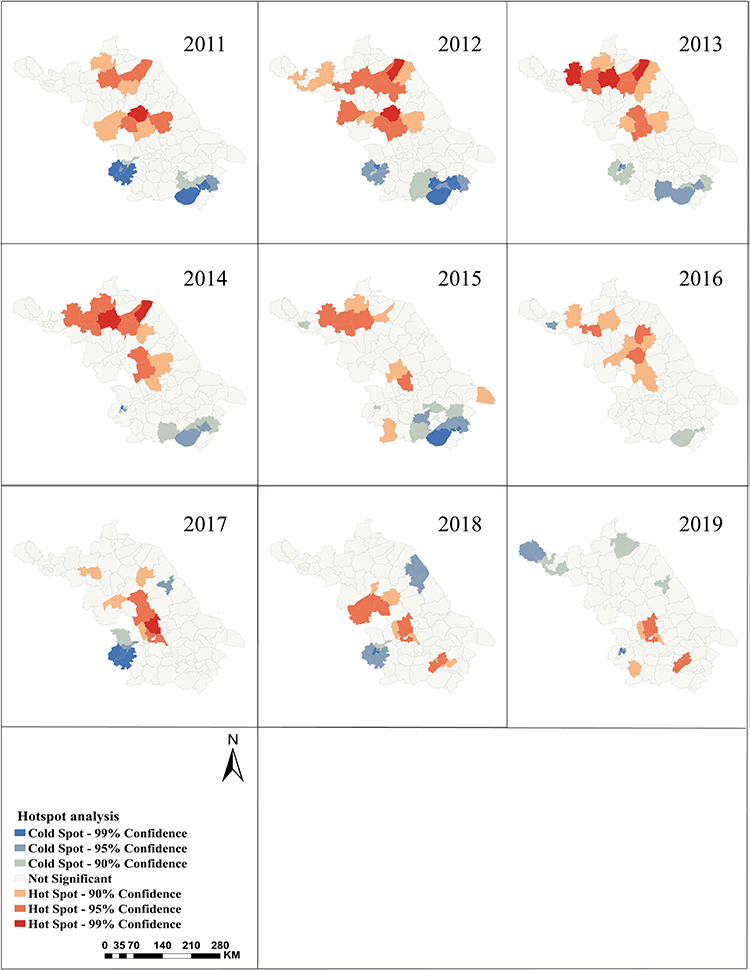 |
Figure 4 Local Getis Gi* statistic results of the hot and cold spots for PTB notification rates in Jiangsu Province. |
Spatiotemporal Distribution of HIV
The main epidemic peak of HIV from 2011 to 2019 was from May to September, and the maximum seasonal index was 1.14 in July (Table S4). The CNR of HIV had spatial clustering distributions in the past nine years (Table 2). The hotspots of HIV were mainly distributed in Nanjing, Suzhou, Wuxi, and Changzhou. (Figure 5). One most likely high-risk spatiotemporal clustering county and three secondary risk clustering counties of HIV were found by Kulldorff’s space-time scan statistical analysis (Table S3). The first cluster area comprised six counties in Nanjing from August 2011 to December 2015. The second cluster area involved thirty-three counties, mainly distributed in Yancheng, Lianyungang and Suqian from February 2018 to October 2019. In addition, from August 2011 to March 2014, the third cluster involved one county in Suzhou, and the fourth cluster was predominantly distributed in Wuxi and Changzhou, with eight counties.
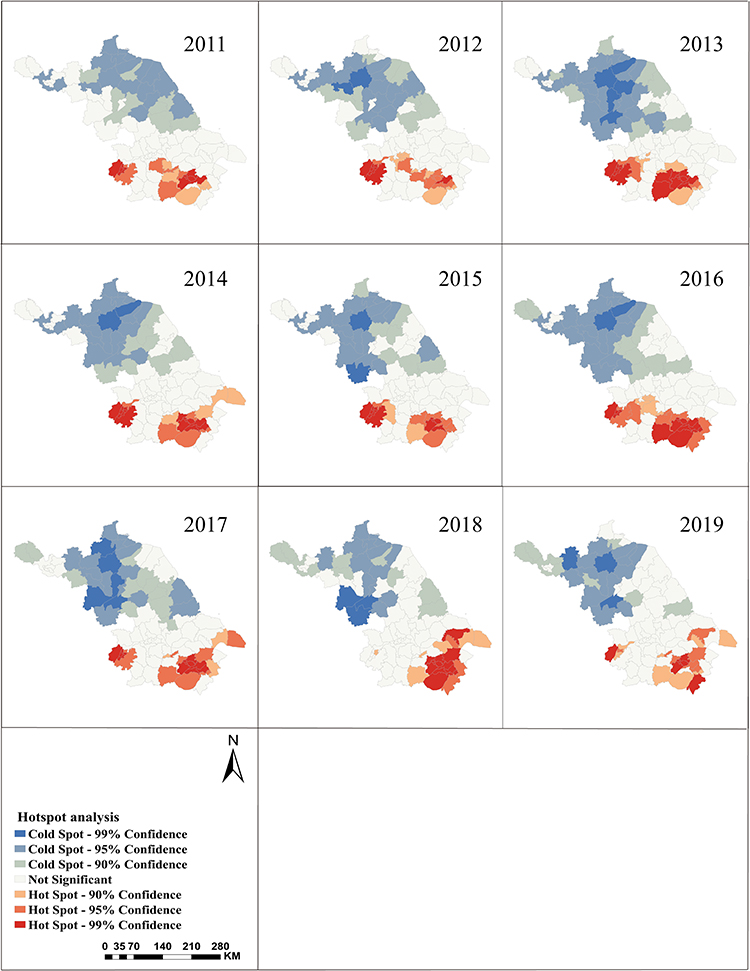 |
Figure 5 Local Getis Gi* statistic results of the hot and cold spots for HIV notification rates in Jiangsu Province. |
Spatiotemporal Distribution of HIV-PTB Coinfection
The maximum seasonal index of HIV-PTB was 1.31 in June (Table S5). We observed a global spatial autocorrelation of HIV-PTB coinfection in 2011, 2014, and 2015 (Table 2). The hotspots of HIV-PTB coinfection were primarily distributed in Nanjing, Wuxi, Zhenjiang and Changzhou (Figure 6). Moreover, Kulldorff’s space-time scan statistical analysis identified one cluster of HIV-PTB coinfection during the same period (P<0.05). The cluster contained Yuhuatai, Jianye, Qinhuai, Jiangning and Gulou in Nanjing from January 2011 to December 2015 (Table S3).
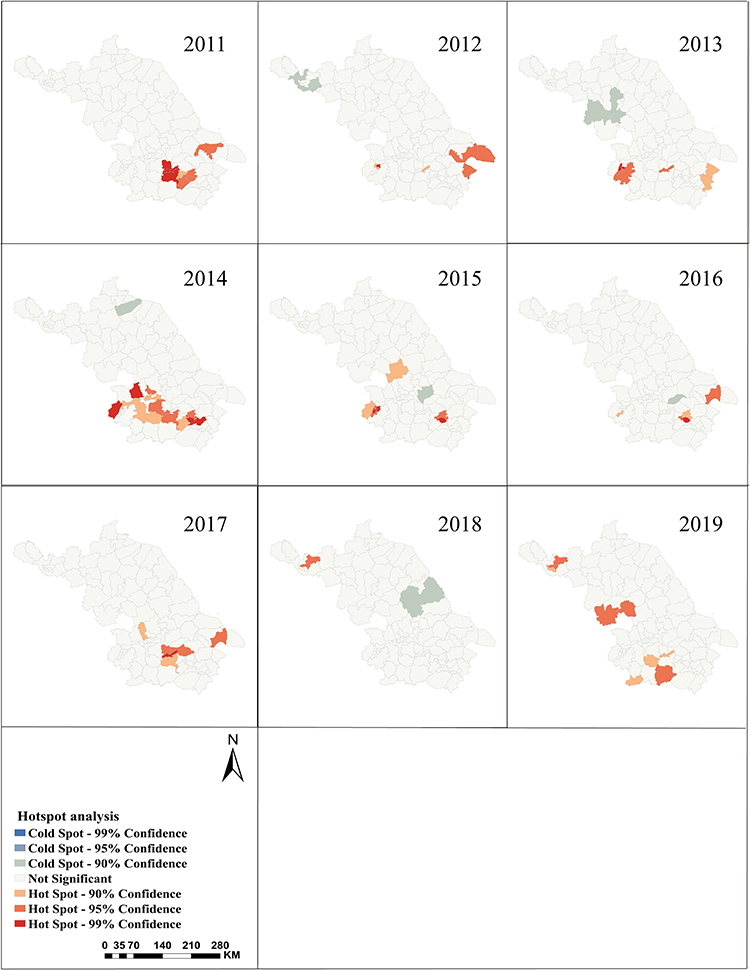 |
Figure 6 Local Getis Gi* statistic results of the hot and cold spots for HIV-PTB coinfection notification rates in Jiangsu Province. |
Spatiotemporal Analysis Using the Bayesian Model
Factor analysis was performed to eliminate the multiple correlations of PGDP, PCDI, population density, and health resources (Tables S6–8). The goodness-of-fit Bayesian space-time model (the space-time interaction effect model) was selected to estimate the role of factors on the disease CNR (Table S9). The data sets of PTB, HIV and HIV-PTB coinfection were iterated 300,000, 100,000, and 100,000 times, respectively. After discarding the first 20,000 iterations, the estimated values of each parameter tended to be steady, and then we calculated the posterior mean for each node. As shown in Table 3, PTB had negative relationships with the socioeconomic factor (RR: 0.89, 95% CI: 0.85–0.92) and population density (RR: 0.94, 95% CI: 0.92–0.96). However, HIV was positively correlated with health resource factors (RR: 1.14, 95% CI: 1.09–1.18), socioeconomic factor (RR: 1.33, 95% CI: 1.26–1.40), and population density (RR: 1.09, 95% CI:1.06–1.12). HIV-PTB coinfection was positively correlated with socioeconomic factor (RR: 1.19, 95% CI: 1.08–1.31) and population density (RR: 1.14, 95% CI: 1.06–1.23).
 |
Table 3 Bayesian Model Regression Coefficient Values |
Discussion
This study collected data on PTB, HIV, and HIV-PTB coinfection at the county level in Jiangsu from 2011 to 2019, revealing the spatial and temporal patterns of PTB, HIV, and HIV-PTB coinfection. The CNR of PTB showed a stable decreasing trend, whereas the CNR of HIV and HIV-PTB coinfection exhibited an upward trend in Jiangsu. We also indicated that socioeconomic levels might be a fundamental reason for the geographical heterogeneity of PTB, HIV, and HIV-PTB coinfection.
The CNR of PTB showed a downward trend year by year, which may be related to the great attention of the State to the prevention and control of TB. The General Office of the State Council issued the National TB Prevention and Control Plan (2011–2015) in November 2011 and adopted a series of prevention and control measures. Subsequently, during the “13th Five-Year Plan (2016–2020)” for TB prevention and control, regions across the country continued to improve their TB prevention and control service systems, further promoting the end of the TB epidemic. The spatial distribution of TB is related to geographical location, economic, demographic, and environmental factors, and its transmission is characterized by spatial clustering.11,36,37 Discovering the imbalance of disease risk among regions and their influencing factors is of great significance for the allocation of medical resources and implementation of geographically targeted interventions. The CNR of PTB was negatively associated with socioeconomic levels and decreased gradually from north to south in Jiangsu. This may be due to the lower economic status, insufficient medical service system and facilities resources, and patients can not get timely diagnosis and treatment in the northern region. Previous studies have also concluded that TB is strongly associated with poverty and poor living conditions.38–40 In South Korea and Northeast Brazil, demographic and socioeconomic conditions had strong explanatory power in making spatial differences in TB incidence. TB was more prevalent in areas with poor socioeconomic levels and high population density.38,39 However, our study found a negative correlation between the CNR of PTB and population density, which may be related to the “high in the south, low in the north” population distribution in Jiangsu. The rural area of northern Jiangsu was large and the population was scattered. The population density has further decreased in recent years due to the outflow of people to southern Jiangsu.41 The population density in Jiangsu Province significantly correlated with the regional economic levels.42 Efforts for TB prevention and control should be strengthened in areas with low economic development in Jiangsu Province.
China has one of the highest TB burden in the world and faces public health challenges related to TB, such as drug resistance and HIV/TB coinfection.5,43 This study showed that HIV infection was more common in economically developed regions, consistent with previous reports.40,44–46 A survey of HIV infection in Indian adults found that HIV infection is more prevalent in urban areas with better socioeconomic conditions.40 In Ethiopia, HIV transmission was also more common in urban settings.44 The rapid economic development in southern Jiangsu can cause large-scale population fluctuations, which may contribute to HIV transmission. As rural-to-urban migrant labor increases, so does the exposure of migrants to sex workers, and their consistent condom use is a lower percentage.47,48 Furthermore, MSM accounted for the highest proportion of newly reported HIV/AIDS cases in Jiangsu Province.49 MSM tended to migrate to cities with a prosperous economy, developed service industry, more employment opportunities and inclusive culture.50 These may be responsible for the higher CNR of HIV in southern than in central and northern Jiangsu. HIV-PTB coinfection hotspots are mainly located in the urban areas of Nanjing, Wuxi, and Changzhou, which may be attributed to the higher HIV prevalence. Aturinde et al46 suggested that the high prevalence of HIV contributes to the HIV-TB coinfection hotspot around Lake Victoria. In the Southeast region of Brazil, HIV-TB coinfection high-risk clusters were also mainly distributed in the central part of the municipality.45 As HIV is highly associated with TB,46 strengthening HIV prevention and control and early initiation of antiretroviral treatment can reduce the TB burden. Bidirectional screening among people living with HIV and TB is recommended to identify people with HIV-TB as early as possible and urge them to complete treatment.
Our study also suffered from some limitations. One limitation was that the present study only considered socioeconomic factors, health resources factors and population density; other factors, such as meteorological factors and environmental pollutants, may also impact the temporal and spatial distribution of infectious diseases. Another limitation of our study is that it used nationally monitored case notification data as an alternative measure for the general infected population. Such data face the challenge of under-reporting, which may bias observations and grouping of variables at the county level.
Conclusions
In conclusion, the CNR of PTB has shown a decreasing trend from 2011 to 2019, while the CNR of HIV and HIV-PTB coinfection has shown an increasing trend with apparent spatial and temporal clustering in Jiangsu Province. The government should strengthen TB prevention and control, publicity, and education efforts in northern Jiangsu, while early screening and enhanced treatment of TB for HIV-infected patients in southern Jiangsu to reduce the disease burden. Further studies are needed to assess environmental and social factors in identified high-risk areas and to explore local and regional patterns of TB and HIV at the sub-district level.
Abbreviations
HIV, Human immunodeficiency virus; PTB, Pulmonary tuberculosis; CNR, Case notification rate; PGDP, Per capita gross domestic product; MSM, Men who have sex with men; GIS, Geographical information systems; LISA, Local indicators of spatial association; PCDI, Per capita disposable income; RR, Relative rate; CI, Confidence interval.
Data Sharing Statement
All data generated or analyzed during this study are included in this article.
Ethics Approval and Informed Consent
This study was approved by the Ethics Committee of Nanjing Medical University (Nanjing, Jiangsu, China). The studies involving human datasets were reviewed and approved by the Jiangsu Provincial Center for Disease Control and Prevention. Informed consent was not necessary for this study because the data from the case-reporting and management system were de-identified and the personal information of patients did not appear in this study.
Acknowledgments
We thank the staff members at the county, prefecture, and provincial levels of the Centers for Disease Control and Prevention across Jiangsu Province for their efforts and assistance in data collection.
Funding
This study was funded by the National Natural Science Foundation of China (81973103), the Medical Research Project of Jiangsu Health Commission (ZDB2020013), and the Nanjing Major Science and Technology Specific Project (2021-11005). The funding agencies had no role in the study design, data collection, analysis, decision to publish, or preparation of the manuscript.
Disclosure
The authors have no conflict of interest to declare.
References
1. Naghavi M, Abajobir AA, Abbafati C. Global, regional, and national age-sex specific mortality for 264 causes of death, 1980–2016: a systematic analysis for the global burden of disease study 2016. Lancet. 2017;390(10100):1151–1210. doi:10.1016/s0140-6736(17)32152-9
2. Kyu HH, Maddison ER, Henry NJ. Global, regional, and national burden of tuberculosis, 1990–2016: results from the global burden of diseases, injuries, and risk factors 2016 study. Lancet Infect Dis. 2018;18(12):1329–1349. doi:10.1016/s1473-3099(18)30625-x
3. World Health Organization. Global Tuberculosis Report 2021. World Health Organization; 2021.
4. Dheda K, Barry CE, Maartens G. Tuberculosis. Lancet. 2016;387(10024):1211–1226. doi:10.1016/S0140-6736(15)00151-8
5. Jiang H, Liu M, Zhang Y, et al. Changes in incidence and epidemiological characteristics of pulmonary Tuberculosis in Mainland China, 2005–2016. JAMA network open. 2021;4(4):e215302. doi:10.1001/jamanetworkopen.2021.5302
6. Li Q, Liu M, Zhang Y, et al. The spatio-temporal analysis of the incidence of tuberculosis and the associated factors in mainland China, 2009–2015. Infect Genet Evol. 2019;75:103949. doi:10.1016/j.meegid.2019.103949
7. Li Z, Liu Q, Zhan M, Tao B, Wang J, Lu W. Meteorological factors contribute to the risk of pulmonary tuberculosis: a multicenter study in eastern China. Sci Total Environ. 2021;793:148621. doi:10.1016/j.scitotenv.2021.148621
8. Yu Y, Wu B, Wu C, Wang Q, Hu D, Chen W. Spatial-temporal analysis of tuberculosis in Chongqing, China 2011–2018. BMC Infect Dis. 2020;20(1):531. doi:10.1186/s12879-020-05249-3
9. Huang L, Li XX, Abe EM, et al. Spatial-temporal analysis of pulmonary tuberculosis in the northeast of the Yunnan province, People’s Republic of China. Infect Dis Pover. 2017;6(1):53. doi:10.1186/s40249-017-0268-4
10. Areias C, Briz T, Nunes C. Pulmonary tuberculosis space-time clustering and spatial variation in temporal trends in Portugal, 2000–2010: an updated analysis. Epidemiol Infect. 2015;143(15):3211–3219. doi:10.1017/s0950268815001089
11. Hu M, Feng Y, Li T, et al. Unbalanced risk of pulmonary tuberculosis in china at the subnational scale: spatiotemporal analysis. JMIR Public Health Surveill. 2022;8(7):e36242. doi:10.2196/36242
12. Chen ZY, Deng XY, Zou Y, et al. A Spatio-temporal Bayesian model to estimate risk and influencing factors related to tuberculosis in Chongqing, China, 2014–2020. Arch Public Health. 2023;81(1):42. doi:10.1186/s13690-023-01044-z
13. Peters JS, Andrews JR, Hatherill M, et al. Advances in the understanding of Mycobacterium tuberculosis transmission in HIV-endemic settings. Lancet Infect Dis. 2019;19(3):e65–e76. doi:10.1016/S1473-3099(18)30477-8
14. Bruchfeld J, Correia-Neves M, Källenius G. Tuberculosis and HIV Coinfection. Cold Spring Harb Perspect Med. 2015;5(7):a017871. doi:10.1101/cshperspect.a017871
15. Xu B, Li J, Wang M. Epidemiological and time series analysis on the incidence and death of AIDS and HIV in China. BMC Public Health. 2020;20(1):1906. doi:10.1186/s12889-020-09977-8
16. Qiu B, Wu Z, Tao B, et al. Risk factors for types of recurrent tuberculosis (reactivation versus reinfection): a global systematic review and meta-analysis. Int J Infect Dis. 2022;116:14–20. doi:10.1016/j.ijid.2021.12.344
17. Global HIV Programme. Available from: https://www.who.int/teams/global-hiv-hepatitis-and-stis-programmes/hiv/strategic-information/hiv-data-and-statistics.
18. Ord JK, Getis A. Local spatial autocorrelation statistics: distributional issues and an application. Geogr Anal. 1995;27(4):286–306. doi:10.1111/j.1538-4632.1995.tb00912.x
19. Qin Q, Guo W, Tang W, et al. Spatial analysis of the human immunodeficiency virus epidemic among men who have sex with men in China, 2006–2015. Clin Infect Dis. 2017;64(7):956–963. doi:10.1093/cid/cix031
20. Yang H, Li Y, He F, et al. Demographic characteristics and hot-spot areas of recent infections among new HIV Diagnoses in Sichuan, China, Between 2018 and 2020. Infect Drug Resist. 2023;16:779–789. doi:10.2147/IDR.S394828
21. Dowdy DW, Golub JE, Chaisson RE, Saraceni V. Heterogeneity in tuberculosis transmission and the role of geographic hotspots in propagating epidemics. Proc Natl Acad Sci U S A. 2012;109(24):9557–9562. doi:10.1073/pnas.1203517109
22. Hoseini B, Bagheri N, Kiani B, Azizi A, Tabesh H, Tara M. Access to dialysis services: a systematic mapping review based on geographical information systems. Geospat Health. 2018;13(1):577. doi:10.4081/gh.2018.577
23. Kiani B, Bagheri N, Tara A, Hoseini B, Tabesh H, Tara M. Revealed access to haemodialysis facilities in northeastern Iran: factors that matter in rural and urban areas. Geospat Health. 2017;12(2):584. doi:10.4081/gh.2017.584
24. Wang Y, Zhao C, Liu Z, Gao D. Spatiotemporal Analysis of AIDS Incidence and Its Influencing Factors on the Chinese Mainland, 2005–2017. Int J Environ Res Public Health. 2021;18(3):1043. doi:10.3390/ijerph18031043
25. Shen Y, Lu H. Prevalence and predictors of tuberculosis among adults with newly diagnosed HIV/AIDS. Internat J Infect Dis. 2016;45:412. doi:10.1016/j.ijid.2016.02.879
26. Getaneh T, Negesse A, Dessie G, Desta M. The impact of tuberculosis co-infection on virological failure among adults living with HIV in Ethiopia: a systematic review and meta-analysis. J Clin Tuberc Other Mycobact Dis. 2022;27:100310. doi:10.1016/j.jctube.2022.100310
27. El-Khatib Z, Ekstrom AM, Ledwaba J, et al. Viremia and drug resistance among HIV-1 patients on antiretroviral treatment: a cross-sectional study in Soweto, South Africa. AIDS. 2010;24(11):1679–1687. doi:10.1097/QAD.0b013e32833a097b
28. Rebouças MC, Silva MOD, Haguihara T, Brites C, Netto EM. Tuberculosis incidence among people living with HIV/AIDS with virological failure of antiretroviral therapy in Salvador, Bahia, Brazil. Braz J Infect Dis. 2017;21(5):562–566. doi:10.1016/j.bjid.2017.05.005
29. Otiende V, Achia T, Mwambi H. Bayesian modeling of spatiotemporal patterns of TB-HIV co-infection risk in Kenya. BMC Infect Dis. 2019;19(1):902. doi:10.1186/s12879-019-4540-z
30. Alene KA, Viney K, Moore HC, Wagaw M, Clements ACA. Spatial patterns of tuberculosis and HIV co-infection in Ethiopia. PLoS One. 2019;14(12):e0226127. doi:10.1371/journal.pone.0226127
31. Stoica Călăraşu C, Popa Miulescu AM, Turcu AA, Nitu FM. The profile of the patients with double infection HIV and TB in South West of Romania. Curr Health Sci J. 2021;47(1):107–113. doi:10.12865/chsj.47.01.17
32. Kulldorff M, Heffernan R, Hartman J, Assunção R, Mostashari F. A space-time permutation scan statistic for disease outbreak detection. PLoS Med. 2005;2(3):e59. doi:10.1371/journal.pmed.0020059
33. Souza WV, Carvalho MS, Albuquerque Mde F, Barcellos CC, Ximenes RA. Tuberculosis in intra-urban settings: a Bayesian approach. Trop Med Int Health. 2007;12(3):323–330. doi:10.1111/j.1365-3156.2006.01797.x
34. Thway AM, Rotejanaprasert C, Sattabongkot J, et al. Bayesian spatiotemporal analysis of malaria infection along an international border: hlaingbwe township in Myanmar and tha-song-yang district in Thailand. Malar J. 2018;17(1):428. doi:10.1186/s12936-018-2574-0
35. Lau SY, Chen E, Wang M, et al. Association between meteorological factors, spatiotemporal effects, and prevalence of influenza A subtype H7 in environmental samples in Zhejiang province, China. Sci Total Environ. 2019;663:793–803. doi:10.1016/j.scitotenv.2019.01.403
36. Yang LJ, Li T, Chen W. 2013-2018年中国结核病空间聚集性分析 [Study on spatial clustering characteristics of tuberculosis in China, 2013–2018]. Zhonghua Liu Xing Bing Xue Za Zhi. 2020;41(11):1843–1847. Chinese. doi:10.3760/cma.j.cn112338-20200114-00029
37. Liu MY, Li QH, Zhang YJ, et al. Spatial and temporal clustering analysis of tuberculosis in the mainland of China at the prefecture level, 2005–2015. Infect Dis Pover. 2018;7(1):106. doi:10.1186/s40249-018-0490-8
38. Lima S, Dos Santos AD, Duque AM, et al. Spatial and temporal analysis of tuberculosis in an area of social inequality in Northeast Brazil. BMC Public Health. 2019;19(1):873. doi:10.1186/s12889-019-7224-0
39. Im C, Kim Y. Spatial pattern of tuberculosis (TB) and related socio-environmental factors in South Korea, 2008–2016. PLoS One. 2021;16(8):e0255727. doi:10.1371/journal.pone.0255727
40. Krishnamoorthy Y, Majella MG, Rajaa S, Bharathi A, Saya GK. Spatial pattern and determinants of HIV infection among adults aged 15 to 54 years in India - Evidence from national family health survey-4 (2015–16). Trop Med Int Health. 2021;26(5):546–556. doi:10.1111/tmi.13551
41. Shen F, Yang L, He X, Zhou C, Adams JM. Understanding the spatial-temporal variation of human footprint in Jiangsu Province, China, its anthropogenic and natural drivers and potential implications. Sci Rep. 2020;10(1):13316. doi:10.1038/s41598-020-70088-w
42. Lu YQ. Evolvement of spatial pattern of population with data at county level in Jiangsu Province. Prog Phys Geogr. 2012;167–175.
43. Dheda K, Gumbo T, Maartens G, et al. The lancet respiratory medicine commission: 2019 update: epidemiology, pathogenesis, transmission, diagnosis, and management of multidrug-resistant and incurable tuberculosis. Lancet Respir Med. 2019;7(9):820–826. doi:10.1016/s2213-2600(19)30263-2
44. Alene KA, Elagali A, Barth DD, et al. Spatial codistribution of HIV, tuberculosis and malaria in Ethiopia. BMJ Global Health. 2022;7(2):e007599. doi:10.1136/bmjgh-2021-007599
45. Cavalin RF, Pellini ACG, Lemos RRG, Sato APS. TB-HIV co-infection: spatial and temporal distribution in the largest Brazilian metropolis. Rev Saude Publica. 2020;54:e112. doi:10.11606/s1518-8787.2020054002108
46. Aturinde A, Farnaghi M, Pilesjö P, Mansourian A. Spatial analysis of HIV-TB co-clustering in Uganda. BMC Infect Dis. 2019;19(1):612. doi:10.1186/s12879-019-4246-2
47. Wang Y, Lu R, Wu G, et al. Changing trends of HIV, syphilis, and hepatitis C among Male Migrant Workers in Chongqing, China: nine Consecutive Cross-Sectional Surveys, 2010–2018. Int J Environ Res Public Health. 2020;17(3):875. doi:10.3390/ijerph17030875
48. Yuan FS, Liu L, Liu LH, et al. Epidemiological and spatiotemporal analyses of HIV/AIDS prevalence among older adults in Sichuan, China between 2008 and 2019: a population-based study. Int J Infect Dis. 2021;105:769–775. doi:10.1016/j.ijid.2021.02.077
49. Hu H, Liu X, Zhang Z, Xu J, Fu G, Huan X. 江苏省2011—2013年新报告HIV感染者/艾滋病患者新发感染状况分析 [Recent infected and newly reported HIV cases in Jiangsu province, 2011–2013]. Zhonghua Liu Xing Bing Xue Za Zhi. 2014;35(10):1115–1118. Chinese.
50. Huang D, Wang J, Yang T. Mapping the spatial-temporal distribution and migration patterns of men who have sex with men in mainland china: a web-based study. Int J Environ Res Public Health. 2020;17(5):1469. doi:10.3390/ijerph17051469
 © 2023 The Author(s). This work is published and licensed by Dove Medical Press Limited. The full terms of this license are available at https://www.dovepress.com/terms.php and incorporate the Creative Commons Attribution - Non Commercial (unported, v3.0) License.
By accessing the work you hereby accept the Terms. Non-commercial uses of the work are permitted without any further permission from Dove Medical Press Limited, provided the work is properly attributed. For permission for commercial use of this work, please see paragraphs 4.2 and 5 of our Terms.
© 2023 The Author(s). This work is published and licensed by Dove Medical Press Limited. The full terms of this license are available at https://www.dovepress.com/terms.php and incorporate the Creative Commons Attribution - Non Commercial (unported, v3.0) License.
By accessing the work you hereby accept the Terms. Non-commercial uses of the work are permitted without any further permission from Dove Medical Press Limited, provided the work is properly attributed. For permission for commercial use of this work, please see paragraphs 4.2 and 5 of our Terms.