Back to Journals » Cancer Management and Research » Volume 11
Spatial heterogeneity of KRAS mutations in colorectal cancers in northern France
Authors Turpin A, Genin M, Hebbar M, Occelli F ![]() , Lanier C
, Lanier C ![]() , Vasseur F, Descarpentries C, Pannier D, Ploquin A
, Vasseur F, Descarpentries C, Pannier D, Ploquin A
Received 4 April 2019
Accepted for publication 25 July 2019
Published 13 September 2019 Volume 2019:11 Pages 8337—8344
DOI https://doi.org/10.2147/CMAR.S211119
Checked for plagiarism Yes
Review by Single anonymous peer review
Peer reviewer comments 2
Editor who approved publication: Dr Beicheng Sun
Anthony Turpin,1–3 Michael Genin,4 Mohamed Hebbar,1,2 Florent Occelli,5 Caroline Lanier,5 Francis Vasseur,4 Clotilde Descarpentries,6 Diane Pannier,7 Anne Ploquin1
1Medical oncology unit, Hôpital Claude Huriez, F-59000 Lille, France; 2Lille University Medical School, Université Lille Nord de France, Lille, France; 3University Lille, CNRS, Institut Pasteur de Lille, UMR 8161 - Mechanisms of Tumorigenesis and Target Therapies, F-59021 Lille, France; 4EA 2694-Santé Publique: épidémiologie et qualité des soins, University Lille, CHU Lille, 59000 Lille, France; 5EA 4483 - Impact de l’environnement chimique sur la santé humaine, University of Lille, 59000 Lille, France; 6Division of Biochemistry and Molecular Biology, Oncology and Molecular Genetics Laboratory, CHU Lille, Lille, France; 7Department of Medical Oncology, Centre Oscar Lambret, Lille, F-59000, France
Correspondence: Anthony Turpin
Medical Oncology Unit, Hôpital Claude Huriez, Rue Michel Polonovski, Lille Cedex 59037, France
Tel +33 32 044 5461
Fax +33 32 044 4381
Email [email protected]
Background: Somatic mutations in the KRAS gene are the most common oncogenic mutations found in human cancers. However, no clinical features have been linked to KRAS mutations in colorectal cancer [CRC].
Purpose: In this study, we attempted to identify the potential geographical population clusters of KRAS mutations in CRC patients in northern France.
Patients and methods: All patients with CRC who were identified to have KRAS mutations between 2008 and 2014 at the Regional Molecular Biology Platform at Lille University Hospital were included. 2,486 patients underwent a KRAS status available, with 40.9% of CRC with KRAS mutations in northern France. We retrospectively collected demographic and geographic data from these patients. The proportions of KRAS mutation were smoothed to take into account the variability related to low frequencies and spatial autocorrelation. Geographical clusters were searched using spatial scan statistical models.
Results: A mutation at KRAS codon 12 or 13 was found in 1,018 patients [40.9%]. We report 5 clusters of over-incidence but only one elongated cluster that was statistically significant [Cluster 1; proportion of KRAS mutation among CRC: 0.4570; RR=1.29; P=0.0314]. We made an ecological study which did not highlight a significant association between KRAS mutations and the distance to the Closest Waste Incineration Plant, and between KRAS mutations and The French Ecological Deprivation Index but few socio-economic and environmental data were available.
Conclusion: There was a spatial heterogeneity and a greater frequency of KRAS mutations in some areas close to major highways and big cities in northern France. These data demand deeper epidemiological investigations to identify environmental factors such as air pollution as key factors in the occurrence of KRAS mutations.
Keywords: colorectal cancer, KRAS mutation, spatial scan statistics, carcinogens, highways
Novelty and impact
Our results suggest a spatial heterogeneity of KRAS mutations in colorectal cancer across northern France. We identified 5 clusters with a high proportion of KRAS codon 12-13 mutations, and only one elongated cluster close to major regional highways was statistically significant. Further studies are warranted to elucidate the causal role of carcinogens in the occurrence of KRAS mutations.
Introduction
KRAS gene mutations are the most common oncogenic mutations in human cancers.1 They are heterozygous mutations corresponding to a substitution of a single amino acid which prevents the dephosphorylation and thus activates the KRAS protein, an oncogenic GTPase.2
There is a strong correlation of KRAS genotype (i.e., mutated or not) with primary cancer and metastasis in metastatic colorectal cancer (mCRC). This underlines the early characteristics of KRAS mutation,2,3 which essentially drives the adenoma-cancer disease progression4 culminating into metastasis.5 In 2008, KRAS mutational status was associated with good outcomes in mCRC patients treated with cetuximab and panitumumab.6,7 Furthermore, these studies showed that in patients with mutated KRAS gene, cetuximab had little or no effect compared to standard chemotherapy. The results implied that EGFR inhibitors would be effective only in cases with wild-type RAS tumor including NRAS and/or KRAS mutations, representing approximately 50% of patients.8,9 The systematic investigation of KRAS and NRAS mutational status for exons 2, 3, and 4 was thus required before any prescription of anti-EGFR.9
The KRAS mutation rate appears to differ based on geographic location. In Asia, 33.3% of CRC patients have been identified to have KRAS mutations.10 In Europe, the proportion of CRC patients with KRAS mutations is 36%,11 with 38% in France.12
The spatial heterogeneity of CRC has been demonstrated at the regional and cantonal levels in France.13 No study has yet clarified this result by characterizing the spatial distribution of the genotypes.
The aim of this study was to analyze the spatial variations of the KRAS mutation proportion in CRC, in northern France on a small geographical scale, during the period from 2008 to 2014. Furthermore, the link between the spatial variations of KRAS mutation proportion and the distance to closest waste incineration plant (CWIP) and the social deprivation was investigated by means of an ecological study in the goal to identify environmental factors as putative key factors in the occurrence of KRAS mutations.
Materials and methods
This study was conducted in northern France, which had a total population of 4,050,756 inhabitants at the time of the 2012 national census. This area is divided into 170 cantons [a French small administrative area with population ranging from 12,934 to 231,491 inhabitants]. The centroid of each canton as defined by the geographical center (latitude and longitude) was used for the spatial analyses.
Source of epidemiological data
All patients with CRC who underwent KRAS mutation status determination between 2008 and 2014 at the Regional Molecular Biology Platform at Lille University Hospital were included in our cohort. The retrospective data collected were demographic data: sex, age, canton of residence at the time of primary diagnosis; the KRAS mutational status: absence/presence of mutation and type. The data were deidentified.
This study was approved by the CCTIRS (Comité Consultatif sur le Traitement de l’Information en matière de Recherche dans le domaine de la Santé, approval n°14.728) and is in full accordance with French laws.
KRAS mutation analysis
Genomic DNA was isolated from 10-µm paraffin-embedded sections using the QIAamp DNA FFPE Tissue DNA extraction kit (Qiagen, Courtaboeuf, France) according to the manufacturer’s protocol. Mutation analysis of KRAS codons 12 and 13 was performed by pyrosequencing using the PyroMark™ MD system (Biotage, Qiagen). Genomic DNA (25 ng) was amplified by PCR and sequenced with the PyroMark™ KRAS kit according to the manufacturer’s instructions (Qiagen). DNA samples from cell lines known to be KRAS mutated and KRAS wild-type were introduced in each series as positive and negative controls, respectively. Each detected mutation was checked by a new amplification and analysis. The lower limit of detection of pyrosequencing assay was between 5% and 10% mutated DNA.
Ecological data
Deprivation index
The French Ecological Deprivation Index (EDI) was computed for each canton for measuring the deprivation.14 This index is composed of 10 variables: overcrowding, no access to a system of central or electric heating, non-owner, unemployment, foreign nationality, no access to a car, unskilled worker-farm worker, household with more than 6 persons, low-level of education and single-parent household. Higher index in a canton correlated with higher deprivation. Socioeconomic data were extracted from the 2012 national population census, provided by the French national institute Institut National de la statistique et des études économiques. The obtained French EDI was considered as quartiles for ecological regression described in the section “Statistical analyses.”
Distance to closest waste incineration plant (CWIP)
The data of the French national institute Agence de l’Environnement et de la Maîtrise de l’Energie were used to identify the 10 waste incineration plants in activity before and during the period of the study and located in the studied geographical area. For each canton, the Euclidian distance in kilometers between its centroid and the CWIP were computed. The obtained distance to CWIP was considered as quartiles for ecological regression.
Statistical analyses
Descriptive analysis
Quantitative variables were described using mean (SD) in case of normal distribution or using median (interquartile interval) otherwise. The normality of the distributions was assessed using histograms, normal probability plot and the Shapiro–Wilk’s test. Qualitative variables were described by means of percentages (frequencies).
Smoothing the proportion of KRAS mutations
The crude proportion of KRAS mutations by cantons showed high instability due to low frequencies. A spatial smoothing method was used to reduce this instability and take into account the spatial autocorrelation between neighboring cantons. We used a hierarchical Bayesian three-level binomial model as proposed by Besag et al15. The number of CRC with KRAS mutation per canton was considered as an outcome variable and the total number of CRC per canton as an offset. In this mixed model, the variances of the two random spatial effects have a non-informative gamma prior distribution as suggested by Bernadinelli et al16. The model was fitted using the Integrated Nested Laplace Approximation (INLA) method.17,18 A 95% Bayesian credible interval (BCI) was associated with each proportion estimate.
Spatial cluster detection
The detection of significant spatial clusters of cantons with a high proportion of KRAS mutation was performed. We used spatial scan statistics on the basis of a Bernoulli model to test the presence of KRAS mutation clusters and identify their location without pre-selection bias.19 These methods are powerful and largely used in the field of epidemiology.20–22 We used an elliptic spatial scan statistic that allows the detection of cluster of an elliptical shape, including circular shape than can be considered as a special case of an ellipse.23
We observed that circular clusters may still be highlighted since the circle can be considered as a special case of an ellipse. The significance of each detected clusters has been evaluated using 9,999 Monte-Carlo replications under the null hypothesis of absence of cluster. A RR was associated with each significant cluster. The RR was interpreted as the risk of observing a KRAS mutation in the cluster compared to the rest of studied area.
Ecological regression
In order to analyze the association between geographical variations of KRAS mutation proportion and the ecological variables, we used an extension of the previous hierarchical Bayesian model that includes the two ecological variables (French EDI and distance to the CWIP) as fixed effects in the model with a non-informative prior as suggested by Lawson.24 First quartile of each ecological variable was considered as the reference. Each quartile was assigned an RR and its BCI at the 95% level.
Smoothing of KRAS mutation proportions and ecological regression analyses were carried out using the R software v. 3.4.3 (package: R-INLA).25 The cluster detection was performed using the SaTScan software v. 9.6.26 Maps were performed using QGIS software v. 2.18.27 All statistical analyses were considered significant at 0.05 type 1 error.
Results
During the period from 2008 to 2014, 2486 patients underwent a KRAS mutation status determination in northern France. The median age was 61 years (54;71) and 41.5% of the patients were women. Among the 2486 patients, 1018 showed a KRAS mutation (40.9%). The most frequent mutations observed were Gly12Asp (14.3%, n=355), Gly12Val (9.8%, n=243) and Gly13Asp (6.8%, n=169) (Figure 1).
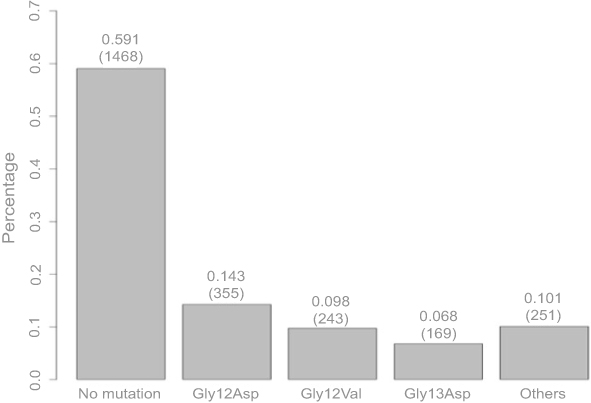 |
Figure 1 Distribution of KRAS mutation types. |
Spatial analysis
Among the 170 cantons of the studied area, the median number of CRC per canton was 9 (4; 20) and the median number of CRC with KRAS mutation per canton was 3 (1; 8). Only three cantons did not have CRC cases.
Smoothed proportions of KRAS mutation
The smoothed proportions of KRAS mutation varied from 0.2829 (95% BCI: [0.1804; 0.3941]) in the canton of Dunkerque, located in the north of the studied area, to 0.5126 (95% BCI: [0.3163; 0.7187]) in the canton of Outreau, close to the city of Boulogne-sur-Mer. The average-smoothed proportion of KRAS mutation was 0.3952 (95% BCI: [0.2606; 0.5418]). The geographical distribution of the smoothed proportions of KRAS mutation is shown in Figure 2.
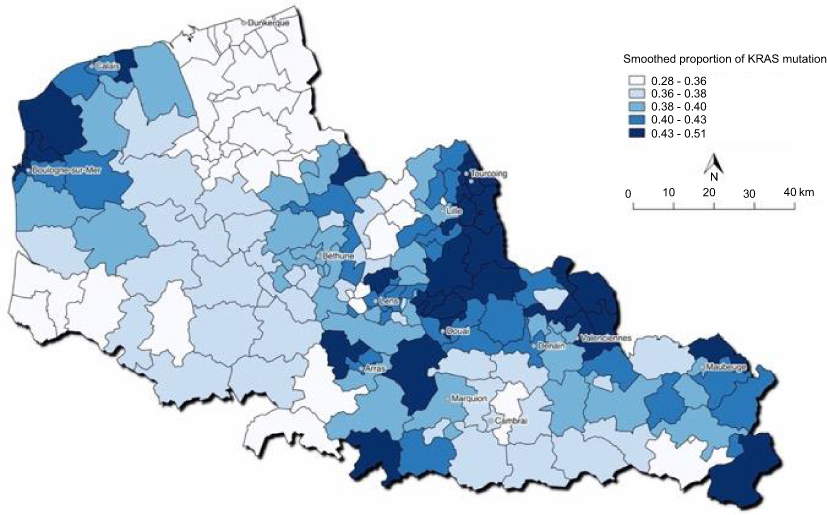 |
Figure 2 Spatial distribution of smoothed proportions of KRAS mutations in northern France, 2008–2014. |
Spatial clusters detection
The elliptic spatial scan statistics detected 5 clusters of high proportion of KRAS mutation. The clusters characteristics are presented in Table 1. Only one elongated cluster was statistically significant ranging from the city of Tourcoing to the city of Marquion (Cluster 1; smoothed proportion of KRAS mutation: 0.4570; RR=1.29; P=0.0314) close to the major highways. This cluster is mapped in Figure 3.
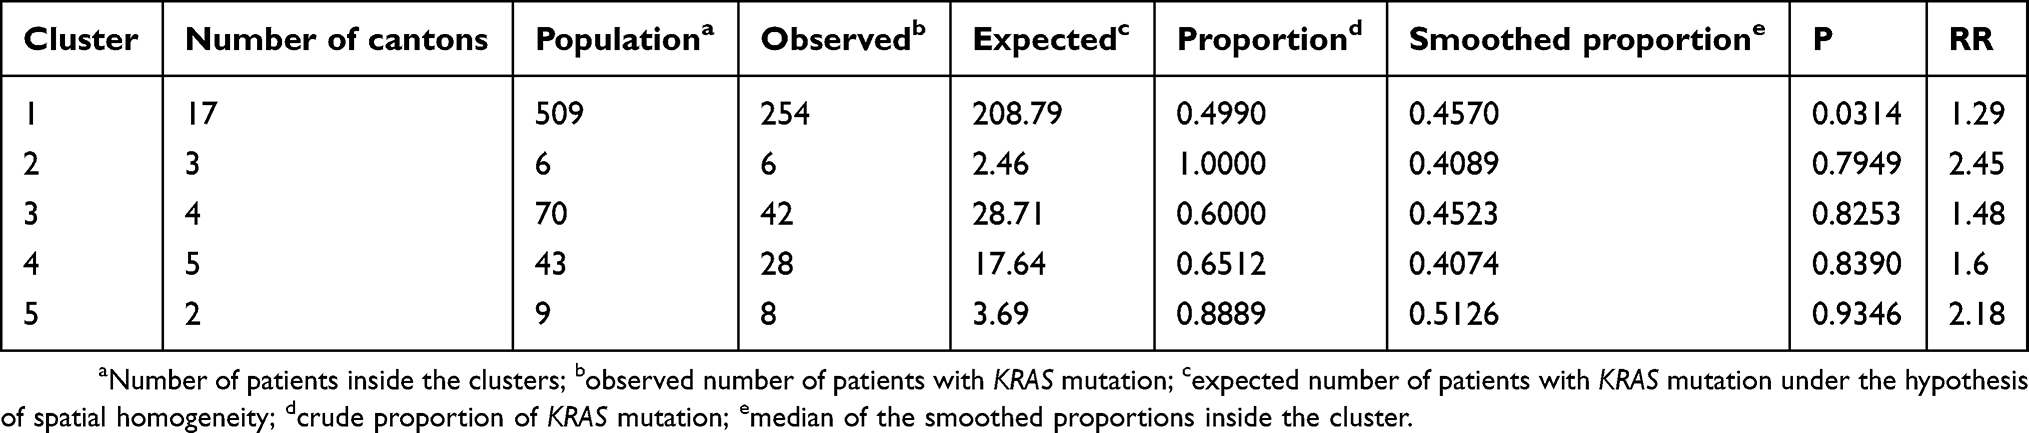 |
Table 1 Spatial clusters of high proportion of KRAS mutations identified by the elliptic spatial scan statistics in northern France, 2008–2014 |
 |
Figure 3 Spatial cluster of high proportion of KRAS mutations identified by elliptic spatial scan statistics, northern France, 2008–2014. |
Ecological regression
Using the first quartile as reference, the RR of KRAS mutation was assessed for each level of distance of the CWIP and French EDI (Figure 4). Based on the 95% BCI associated to the RRs, no significant association was highlighted between KRAS mutation and the distance to the CWIP (Q2: RR=0.82, 95% BCI: [0.60;1.12]; Q3: RR=0.93, 95% BCI: [0.67;1.30], Q4: RR=0.98, 95% BCI: [0.64;1.49]). According to the same methodology, no significant association between KRAS mutation and deprivation index was found (Q2: RR=0.98, 95% BCI: [0.70;1.37], Q3: RR=1.07, 95% BCI: [0.77;1.48], Q4: RR=0.93, 95% BCI: [0.69;1.25]).
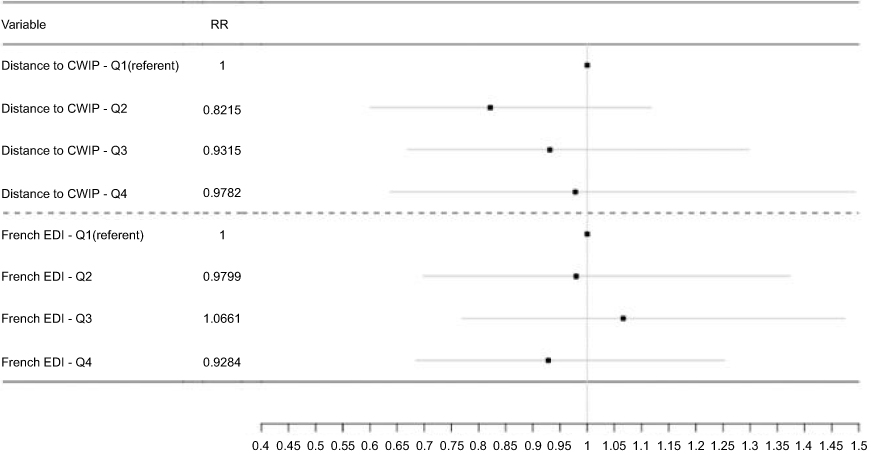 |
Figure 4 RRs (95% BCI) of KRAS mutation by French EDI and distance (in km) to the CWIP quartiles.Abbreviations: BCI, Bayesian credible interval; EDI, Ecological Deprivation Index; CWIP, closest waste incineration plant. |
Discussion
We highlighted significant spatial variations in the proportion of KRAS mutations in northern France. In addition, the implementation of elliptic spatial scan statistic made it possible to reveal the existence of a significant spatial cluster of a higher proportion of KRAS mutations.
The proximity of the significant cluster with regional highways nodes is questioning (Figure 3), requiring further ecological investigations.
In the literature, only two studies proposed a geographic but not spatial analysis of the rate of KRAS mutated CRCs: in these studies, the country was divided into 4 or 5 large regions and inter-regional comparisons of the proportion of KRAS mutated cancers were performed. In India, a cohort-study of 1323 patients revealed that the KRAS mutations were more common in northern India than in the rest of the country (in 339 patients, 86 KRAS mutant versus 253 KRAS wild type; P<0.01).28 In Brazil, of the 8234 patients analyzed, KRAS mutations were more frequent in parts of Southeast and North. The geographic distribution of KRAS mutations was not similar, for example, the mutation Gly12Asp (GGT > GAT) was the highest in most regions with the exception of the North where Gly12Val (GGT > GTT) was the most frequent.29 Thus, the authors hypothesized that this observation could be explained by the large ethnic disparity in Brazil with a prevalence of migrant European settlers in the southern region and a prevalence of Amerindian native people in the north.29
In USA, KRAS mutations were statistically less frequent in non-Hispanic Whites when compared to that in African-Americans (P=0.0001).30 A possible explanation of the different rates of KRAS mutations observed in the populations would be the disparity in testing due to different economic status. Another possible explanation for the geographic disparity of KRAS mutation could be lifestyle.
Martinez et al31 found a correlation between tobacco consumption and the presence of KRAS mutations in colorectal polyps and the same correlation was reported by Curtin et al32 in rectal cancers. Similarly, alcohol was also associated with increased RR of colon cancer with KRAS mutation.33 A significant relationship was also established with obesity, particularly with the waist–hip ratio in women and KRAS-mutated CRCs.34 The use of alcohol and tobacco in northern France, which is higher than in other French regions, and the high prevalence of obesity35 could be confounding factors in the geographic clustering observed.
Our study has some limitations. There was in northern France between 2008 and 2010 an estimate of 1283 (1196–1376) incident-cases per year.36 Over a 6-year period, our study may have only included less than one-third of the total CRC patients with KRAS mutations. The recruitment of KRAS status via a reference center for a test routinely prescribed by the other centers suggests the representativeness of the study population compared to the overall regional population. Nevertheless, if in some centers KRAS mutation determination was more frequently requested in non-metastatic patients, the prevalence could have been increased superficially resulting in a greater number of patients to be included in our study. Another bias could be relocation if a significant number of patients migrated from another region since, at the time of diagnosis, we recorded the place of residence and not the geographical history of patients.
In the ecological study, no significant association was highlighted between KRAS mutations and the distance to the CWIP and between KRAS mutations and deprivation index but few socio-economic and environmental data were available.
Outdoor air pollution, known as carcinogen (Group 1 in the IARC classification), is a mixture of multiple pollutants. Although this classification is for lung cancer, it is relevant to question the impact of such pollution on CRC. Specifically, some traffic-related pollutants, such as NO2 and benzene, are suspected to be involved in the pathogenesis of CRC.37,38 High-level exposure to diesel emissions may increase the risk of rectal cancer in Canadian men,39 not colonic cancer. A study including more than 600,000 adults in the US who participated in the Cancer Prevention Study II and who were followed for 22 years (from 1982 to 2004), examined associations of mortality from cancer at 29 sites with long-term ambient exposure to three ambient pollutants: PM2.5, nitrogen dioxide (NO2) and ozone (O3). In over 43,000 non-lung cancer deaths, exposure to NO2, a pollutant considered consensually to be a marker of traffic pollution, was associated with CRC death, with a 6% increase per 6.5 ppb increment.40 The presence of the cluster along the major axes could also be explained by the presence of polluting industries, located close to the motorways. Industrial emissions can contribute to cumulative and long-term exposure of populations. An increase in mortality due to CRC was linked to the vicinity of the polluting industries (i.e., metal production, paper and wood production) in Spain.37
Our results are inconsistent with those of a study that suggests pesticide exposure as another explanatory factor.38 Agricultural areas with high pesticide use are clustered in the North and Southeastern regions of our study area. However, these areas did not feature among regions with high mutation proportions or in the cluster.
These data focused on CRC highlighted the current lack of information on the relationship between environmental pollution and KRAS mutations. Deepening this link will improve understanding of the underlying mechanisms of mCRC.
Conclusion
There is a spatial heterogeneity suggesting a higher prevalence of KRAS mutated CRC in geographical areas in Northern France. One relevant cluster was in close vicinity to highways network. Epidemiological investigations should be conducted to identify environmental factors in the occurrence of KRAS mutations.
Highlights
- Our results suggest a spatial heterogeneity of KRAS mutations in colorectal cancer across northern France.
- We identified 5 clusters with a high proportion of KRAS codon 12–13 mutations.
- Only one elongated cluster including a major highway was significant.
Acknowledgment
We would like to thank Severine Marchant (Centre Oscar Lambret) for editing the manuscript and Editage (www.editage.com) for English language editing. The abstract has been accepted for the ASCO 2019 annual meeting in Chicago, IL; abstract n°e15101, citation: J Clin Oncol 37, 2019 (suppl; abstr e15101).
Disclosure
A travel grant by Sanofi-Genzyme was obtained by Anthony Turpin. Dr Anthony Turpin reports personal fees from Amgen, Merck, Servier, and grants from Astra-Zeneca, Pfizer, outside of the submitted work. Dr Clotilde Descarpentries reports non-financial support from Astra-Zeneca and Roche, outside the submitted work. The authors report no other conflicts of interest in this work.
References
1. Porru M, Pompili L, Caruso C, Biroccio A, Leonetti C. Targeting KRAS in metastatic colorectal cancer: current strategies and emerging opportunities. J Exp Clin Cancer Res CR. 2018;37(1):57. doi:10.1186/s13046-018-0719-1
2. Artale S, Sartore-Bianchi A, Veronese SM, et al. Mutations of KRAS and BRAF in primary and matched metastatic sites of colorectal cancer. J Clin Oncol Off J Am Soc Clin Oncol. 2008;26(25):4217–4219. doi:10.1200/JCO.2008.18.7286
3. Santini D, Loupakis F, Vincenzi B, et al. High concordance of KRAS status between primary colorectal tumors and related metastatic sites: implications for clinical practice. Oncologist. 2008;13(12):1270–1275. doi:10.1634/theoncologist.2008-0181
4. Vogelstein B, Fearon ER, Hamilton SR, et al. Genetic alterations during colorectal-tumor development. N Engl J Med. 1988;319(9):525–532. doi:10.1056/NEJM198809013190901
5. Huang D, Sun W, Zhou Y, et al. Mutations of key driver genes in colorectal cancer progression and metastasis. Cancer Metastasis Rev. 2018;37(1):173–187. doi:10.1007/s10555-017-9726-5
6. Lièvre A, Bachet J-B, Boige V, et al. KRAS mutations as an independent prognostic factor in patients with advanced colorectal cancer treated with cetuximab. J Clin Oncol Off J Am Soc Clin Oncol. 2008;26(3):374–379. doi:10.1200/JCO.2007.12.5906
7. Amado RG, Wolf M, Peeters M, et al. Wild-type KRAS is required for panitumumab efficacy in patients with metastatic colorectal cancer. J Clin Oncol Off J Am Soc Clin Oncol. 2008;26(10):1626–1634. doi:10.1200/JCO.2007.14.7116
8. Douillard J-Y, Oliner KS, Siena S, et al. Panitumumab – FOLFOX4 treatment and RAS mutations in colorectal cancer. N Engl J Med. 2013;369(11):1023–1034. doi:10.1056/NEJMoa1305275
9. Van Cutsem E, Cervantes A, Adam R, et al. ESMO consensus guidelines for the management of patients with metastatic colorectal cancer. Ann Oncol. 2016;27(8):1386–1422. doi:10.1093/annonc/mdw141
10. Phua LC, Ng HW, Yeo AHL, et al. Prevalence of KRAS, BRAF, PI3K and EGFR mutations among Asian patients with metastatic colorectal cancer. Oncol Lett. 2015;Oct;10(4):2519–2526. doi:10.3892/ol.2015.3560
11. Ciardiello F, Tejpar S, Normanno N, et al. Uptake of KRAS mutation testing in patients with metastatic colorectal cancer in Europe, Latin America and Asia. Target Oncol. 2011;6(3):133–145. doi:10.1007/s11523-011-0181-x
12. Chretien A-S, Harlé A, Meyer-Lefebvre M, et al. Optimization of routine KRAS mutation PCR-based testing procedure for rational individualized first-line-targeted therapy selection in metastatic colorectal cancer. Cancer Med. 2013;Feb(1):11–20. doi:10.1002/cam4.47
13. Les cancers en France, édition 2017, collection Les Données. Avril: institut national du cancer; 2018.
14. Pornet C, Delpierre C, Dejardin O, et al. Construction of an adaptable European transnational ecological deprivation index: the French version. J Epidemiol Community Health. 2012;66(11):982–989. doi:10.1136/jech.2010.109538
15. Besag J, York J, Mollié A. Bayesian image restoration, with two applications in spatial statistics. Ann Inst Stat Math. 1991;43(1):1–20. doi:10.1007/BF00116466
16. Bernardinelli L, Clayton D, Montomoli C. Bayesian estimates of disease maps: how important are priors? Stat Med. 1995;14(21–22):2411–2431. doi:10.1002/sim.4780142111
17. Blangiardo M, Cameletti M, Baio G, Rue H. Spatial and spatio-temporal models with R-INLA. Spat Spatio-Temporal Epidemiol. 2013;1(4):33–49. doi:10.1016/j.sste.2012.12.001
18. Kulldorff M. A spatial scan statistic. Commun Stat – Theory Methods. 1997;26(6):1481–1496. doi:10.1080/03610929708831995
19. Genin M, Duhamel A, Preda C, et al. Space-time clusters of Crohn’s disease in northern France. J Public Health. 2013;21(6):497–504. doi:10.1007/s10389-013-0580-9
20. Beuscart J-B, Genin M, Dupont C, et al. Potentially inappropriate medication prescribing is associated with socioeconomic factors: a spatial analysis in the French Nord-Pas-de-Calais Region. Age Ageing. 2017. doi:10.1093/ageing/afw245
21. Cucala L, Genin M, Lanier C, Occelli F. A multivariate Gaussian scan statistic forspatial data. Spat Stat. 2017;1(21):66–74. doi:10.1016/j.spasta.2017.06.001
22. Castra L, Genin M, Escutnaire J, et al. Socioeconomic status and incidence of cardiac arrest: a spatial approach to social and territorial disparities. Eur J Emerg Med. 2019.Jun;26(3):180–187.
23. Kulldorff M, Huang L, Pickle L, Duczmal L. An elliptic spatial scan statistic. Stat Med. 2006;25(22):3929–3943. doi:10.1002/sim.2490
24. Lawson A. Bayesian Disease Mapping: Hierarchical Modeling in Spatial Epidemiology.
25. R Core Team. R: A Language and Environment for Statistical Computing. [internet]. Vienna, Austria: R Foundation for Statistical Computing; 2016. Available from: https://www.R-project.org/.
26. Kulldorff M. SaTScan: software for the spatial and space-time scan statistics. Available from: http://www.satscan.org/.
27. QGIS Development Team. QGIS Geographic Information System. Open Source Geospatial Foundation Project; 2018. Available from: http://qgis.osgeo.org.
28. Patil H, Korde R, Kapat A. KRAS gene mutations in correlation with clinicopathological features of colorectal carcinomas in Indian patient cohort. Med Oncol Northwood Lond Engl. 2013;30(3):617. doi:10.1007/s12032-013-0617-5
29. Gil Ferreira C, Aran V, Zalcberg-Renault I, et al. KRAS mutations: variable incidences in a Brazilian cohort of 8,234 metastatic colorectal cancer patients. BMC Gastroenterol. 2014;14:73. doi:10.1186/1471-230X-14-73
30. Staudacher JJ, Yazici C, Bul V, et al. Increased frequency of KRAS mutations in African Americans compared with caucasians in sporadic colorectal cancer. Clin Transl Gastroenterol. 2017;8(10):e124. doi:10.1038/ctg.2017.48
31. Martínez F, Fernández-Martos C, Quintana MJ, et al. APC and KRAS mutations in distal colorectal polyps are related to smoking habits in men: results of a cross-sectional study. Clin Transl Oncol Off Publ Fed Span Oncol Soc Natl Cancer Inst Mex. 2011;13(9):664–671.
32. Curtin K, Samowitz WS, Wolff RK, Herrick J, Caan BJ, Slattery ML. Somatic alterations, metabolizing genes and smoking in rectal cancer. Int J Cancer. 2009;125(1):158–164. doi:10.1002/ijc.v125:1
33. Jayasekara H, MacInnis RJ, Williamson EJ, et al. Lifetime alcohol intake is associated with an increased risk of KRAS+ and BRAF-/KRAS− but not BRAF+ colorectal cancer. Int J Cancer. 2017;140(7):1485–1493. doi:10.1002/ijc.30568
34. Brändstedt J, Wangefjord S, Nodin B, et al. Associations of anthropometric factors with KRAS and BRAF mutation status of primary colorectal cancer in men and women: a cohort study. PLoS One. 2014;9(6):e98964. doi:10.1371/journal.pone.0098964
35. Réalisé au sein de l’observatoire régional de la santé et du social. Diagnostic territorialisé des hauts-de-france territoires de proximité. https://www.hauts-de-france.ars.sante.fr/sites/default/files/2017-01/ORS-Diagnostic_part_1_0.pdf.
36. Colonna M, Mitton N, Remontet L, et al. Incidence régionale des cancers 2008–2010. Évaluation de trois méthodes d’estimations: Analyse et résultats. Saint-Maurice, France: Institut de veille sanitaire; 2014:191.
37. López-Abente G, García-Pérez J, Fernández-Navarro P, Boldo E, Ramis R. Colorectal cancer mortality and industrial pollution in Spain. BMC Public Health. 2012;1(12):589. doi:10.1186/1471-2458-12-589
38. Martin FL, Martinez EZ, Stopper H, Garcia SB, Uyemura SA, Kannen V. Increased exposure to pesticides and colon cancer: early evidence in Brazil. Chemosphere. 2018;209:623–631. doi:10.1016/j.chemosphere.2018.06.118
39. Kachuri L, Villeneuve PJ, Parent M-É, Johnson KC, Harris SA. Workplace exposure to diesel and gasoline engine exhausts and the risk of colorectal cancer in Canadian men. Environ Health Glob Access Sci Source. 2016;14(15):4.
40. Turner MC, Krewski D, Diver WR, et al. Ambient air pollution and cancer mortality in the cancer prevention study II. Environ Health Perspect. 2017;125(8):087013. doi:10.1289/EHP36
 © 2019 The Author(s). This work is published and licensed by Dove Medical Press Limited. The
full terms of this license are available at https://www.dovepress.com/terms
and incorporate the Creative Commons Attribution
- Non Commercial (unported, 3.0) License.
By accessing the work you hereby accept the Terms. Non-commercial uses of the work are permitted
without any further permission from Dove Medical Press Limited, provided the work is properly
attributed. For permission for commercial use of this work, please see paragraphs 4.2 and 5 of our Terms.
© 2019 The Author(s). This work is published and licensed by Dove Medical Press Limited. The
full terms of this license are available at https://www.dovepress.com/terms
and incorporate the Creative Commons Attribution
- Non Commercial (unported, 3.0) License.
By accessing the work you hereby accept the Terms. Non-commercial uses of the work are permitted
without any further permission from Dove Medical Press Limited, provided the work is properly
attributed. For permission for commercial use of this work, please see paragraphs 4.2 and 5 of our Terms.