Back to Journals » Pediatric Health, Medicine and Therapeutics » Volume 17
Spatial Distribution and Determinants of Inadequate Vitamin A–Rich Food Consumption Among Children Aged 6–23 Months in Somalia: Evidence from the 2020 Somalia Demographic and Health Survey
Authors Osman OM ![]() , Abdi HA, Abdilleh MM, Muse AH
, Abdi HA, Abdilleh MM, Muse AH ![]() , Osman AM, Muse YH
, Osman AM, Muse YH
Received 7 December 2025
Accepted for publication 7 May 2026
Published 14 May 2026 Volume 2026:17 587150
DOI https://doi.org/10.2147/PHMT.S587150
Checked for plagiarism Yes
Review by Single anonymous peer review
Peer reviewer comments 5
Editor who approved publication: Professor Roosy Aulakh
Osman M Osman,1 Hamse Adam Abdi,1 Mohamed Mahamoud Abdilleh,2 Abdisalam Hassan Muse,2 Abdirahman M Osman,1 Yahye Hassan Muse2
1College of Medicine and Health Science, University of Hargeisa, Hargeisa, Somalia; 2Faculty of Science and Humanities, School of Postgraduate Studies and Research (SPGSR), Amoud University, Hargeisa, Somalia
Correspondence: Osman M Osman, College of Medicine and Health Science, University of Hargeisa, Hargeisa, Somalia, Email [email protected]
Purpose: Vitamin A deficiency (VAD) is a critical public health issue in Somalia, yet evidence regarding dietary practices remains limited. This study assessed the prevalence, geographical distribution, and determinants of Vitamin A-rich food consumption among children aged 6– 23 months.
Methods: Using 2020 Somali Demographic and Health Survey (SDHS) data (n=2,806), we employed two-level multilevel mixed-effects logistic regression to identify individual and community-level determinants. Spatial analysis, including Global Moran’s I and Getis-Ord Gi* statistics, was performed to assess geographical clustering and identify consumption hotspots.
Results: Only 33.75% of children consumed adequate Vitamin A-rich foods. Multilevel analysis revealed that children aged 18– 23 months (AOR=2.78), those with formally educated mothers (AOR=1.42), and urban residents were more likely to consume these foods. Conversely, children with a birth order of two or more (AOR=0.44), and those from rural (AOR=0.72) or nomadic (AOR=0.22) households, had significantly lower odds of consumption. Spatial analysis confirmed significant geographical clustering (Moran’s I = 0.24, p=0.048), identifying high-consumption hotspots in Awdal and Shabeellaha Dhexe, and low-consumption coldspots in Bari, Gedo, and Woqooyi Galbeed.
Conclusion: Somali children face a substantial deficiency in Vitamin A-rich food intake, driven by pronounced sociodemographic and geographical disparities. These findings underscore the urgent need for multisectoral interventions. Strategies should prioritize enhancing maternal education and implementing context-specific programs for rural and nomadic communities to mitigate the burden of VAD in Somalia.
Keywords: vitamin A-rich foods, children, multilevel analysis, spatial distribution, Somalia
Introduction
Vitamin A, a nutrient that dissolves in fat, is available in two main forms: retinol, which is preformed vitamin A found in animal-based foods, and pro-vitamin carotenoids, which are present in fruits and vegetables.1 Vitamin D plays a crucial role in several bodily functions, such as maintaining vision, bolstering the immune system, producing red blood cells, and encouraging growth.2,3 Worldwide, approximately 190 million preschool-aged children (33.3%) are at risk of vitamin A deficiency (VAD), with 124 million requiring vitamin A-rich food or supplements. This deficiency is especially common in low-income areas, such as sub-Saharan Africa (48%) and South Asia (44%).4–6 According to a 2015 UNICEF report, VAD is the third most prevalent and severe nutritional problem among young children, following protein-energy malnutrition and iron-deficiency anaemia.7
Vitamin A deficiency (VAD) is a significant public health challenge in low-income countries.8 This issue remains a public health concern in sub-Saharan Africa (SSA).9 VAD is associated with elevated rates of morbidity and mortality from measles, diarrhoea, malaria, and other infectious diseases among children in low- and middle-income countries (LMICs). Research indicates that the prevalence of VAD in Africa ranges from 8.5% to 79%.10 Previous studies conducted in various regions of Africa have revealed that the consumption of vitamin A and vitamin A-rich foods in Ghana was insufficient at 52%. The Demographic and Health Surveys (DHS) reports from Malawi in 2015 and Uganda in 2016 indicated that 79.1% and 66.5% of children, respectively, consumed foods high in vitamin.9,11 The World Health Organization (WHO) recommends the inclusion of appropriate plant-based complementary foods and animal products, such as meat, poultry, fish, and eggs, to fulfil the nutritional requirements of children. Vitamin A deficiency (VAD) in children significantly contributes to mortality from measles, diarrhoea, malaria, and other infectious diseases.12,13 Key global strategies to combat VAD include exclusive breastfeeding, vitamin A supplementation, dietary diversification, and food fortification.14
In Somalia, a demographic and health survey indicated that 27% of children under the age of five exhibit stunted growth, signifying a height deficit relative to their ages. Additionally, 12% of these children were classified as wasted, denoting a lower than normal weight for their height, and 21% were underweight, reflecting a weight below the expected norm for their age. Furthermore, 41% of breastfed children under two years of age received solid or semi-solid complementary foods in conjunction with breast milk. Among children aged 0–23 months, 23% consumed grain-based foods, while 18% ingested fruits and vegetables rich in vitamin A. Moreover, 13% and 12% of children in this age group were provided with dairy products such as cheese and yoghurt and animal-based foods including meat, fish, and poultry, respectively.15
Only 33% of children aged 6–23 months consumed vitamin A-rich foods during the day or night before the survey. Nationally, more than one-third of children exhibit vitamin A deficiency when assessed using RBP, with those under 2 years of age being less susceptible to this deficiency than older children.15,16 Several significant factors influence the consumption of foods high in vitamin A and iron among children, including the mother’s age, occupation, and education level; the child’s age and gender; birth order; media exposure; wealth index; prenatal and postnatal care; and the location of birth and residence.17–20
Although recent studies like Ali et al (2025) have employed the 2020 Somalia Demographic and Health Survey (SDHS) to explore the sociodemographic factors influencing Vitamin A intake using multilevel modeling, there remains a notable gap in research concerning the geographic variability of these risks. Current research successfully identifies individuals at risk, such as children with mothers who are uneducated or living in poverty, but lacks the spatial analysis needed to determine where these risks are most prevalent. By combining multilevel mixed-effects modeling with sophisticated spatial analysis techniques (Moran’s I and Getis-Ord Gi*), this study addresses the “spatial blindness” of earlier models and pinpoints specific areas of nutritional deprivation. This integrated approach offers a precision public health framework that goes beyond administrative borders, providing a more focused strategy for interventions in Somalia’s complex and geographically varied environment.21
The findings of this study will contribute to the advancement of the United Nations’ Sustainable Development Goals (SDGs), specifically SDG 2 (Zero Hunger) and SDG 3 (Good Health and Well-being).22–24 These insights will be valuable for policymakers, program managers, and researchers focusing on child nutrition.
Material and Methods
Data Source and Study Design
A cross-sectional study examined data from the 2020 Somali Demographic and Health Survey (SDHS), a nationally representative survey that collects comprehensive health and demographic information from Somali women aged 15–49. The analysis employed the Kids Recode (KR) dataset, which provides a detailed array of child health indicators, particularly those related to immunisation rates, childhood diseases, and vitamin A supplementation.15 The study was deemed exempt from full review by the Hargeisa Group Hospital Research IRB the primary ethical review body for health-related research associated with the University of Hargeisa College of Medicine and Health Science because it involved the secondary analysis of de-identified, publicly available data from the Somalia Demographic and Health Survey (SDHS), posing no risk to participants.
Study Population and Sampling Technique
This study focused on infants and young children (IYC) aged 6–23 months in Somalia during the survey period. The sample comprised a subset of this demographic, specifically IYC residing in the selected enumeration areas (EAs), who were included in the analysis. A two-stage sampling approach was employed to ensure balanced representation of urban and rural areas. Initially, 500 EAs were selected, with 112 and 388 allocated to the urban and rural regions, respectively. In the second stage, 26 households were systematically chosen from each EA, resulting in 13,000 total households. Figure 1 shows that 2,806 infants and young children (IYC) were included, and sampling weights were applied to ensure that the results were representative at the national level.15
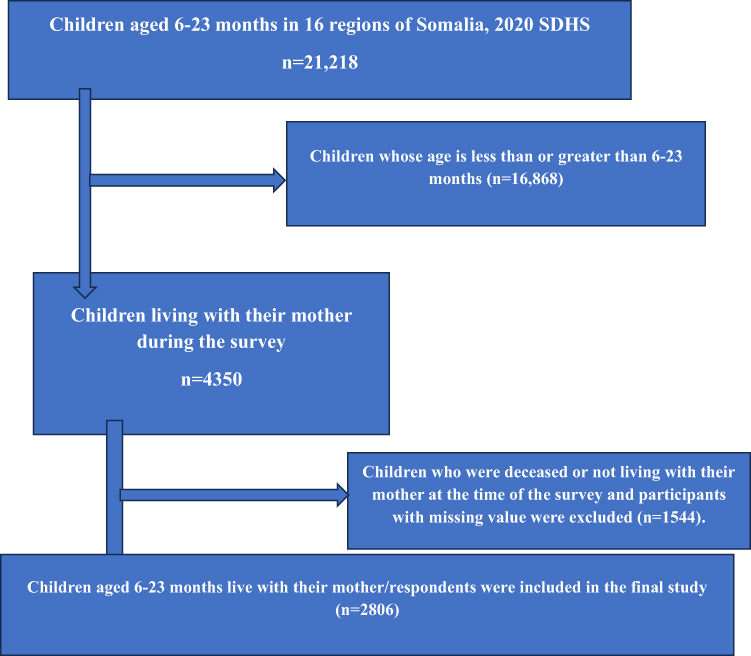 |
Figure 1 Sample study selection of children aged 6–23 months in emerging regions, SDHS 2020. |
Measurement of Variables
Outcome Variable
In this study, the dependent variable was the consumption of foods rich in vitamin A. Children’s responses were classified as “Met=0” if they had eaten at least one of the seven vitamin A-rich foods (egg, meat, vegetables, green leafy vegetables, fruits, organ meat, and fish) within the 24 hours preceding the interview. On the other hand, they were categorised as “Not-Met=1” if they had not consumed any of these seven food items during the same period.25,26
Independent Variables
Maternal-related factors included maternal age, education, place of delivery, and media exposure.
Child related factors: child age, child sex, birth order, number of children under five years.
Household related factors: wealth index, family size, and source of water.
Community-related factors: Region and place of residence.
Data Management and Statistical Analysis
Data processing activities, including cleaning, recording, and analysis, were performed using STATA version 16, with variables derived from KR files. Participants without outcome variables were excluded from the analysis. Additionally, to adjust for potential biases due to sampling and non-responses, sample weights were incorporated into the analysis. Descriptive statistics were used to summarise the characteristics at both the individual and community levels using frequency distribution, tables, and charts. Given the hierarchical structure of the DHS data, in which children are nested within households and households within geographic clusters, standard logistic regression is unsuitable because of the potential correlation of outcomes within clusters. To address this, a two-level multilevel mixed-effects logistic regression model was employed that accounts for community-level clustering through random effects while estimating the effects of the predictor variables. The degree of clustering was assessed using the intraclass correlation coefficient (ICC), and the proportional change in deviance (PCV) was used to evaluate the impact of community-level factors on variance. Model selection was based on deviance, and the model exhibiting the lowest deviance was considered best fit. Variables with a p-value < 0.05 in the bivariable analyses were included in the multivariable model. This multivariable analysis comprised four models: (1) a null model (Model 0) without explanatory variables to assess the variation between clusters and calculate the ICC; (2) Model I with only individual-level variables to examine their effects; (3) Model II with only community-level factors to evaluate their effects; and (4) Model III with both individual- and community-level variables to assess their combined fixed and random effects. Variables with p < 0.05 in the multivariate analysis were identified as significant predictors of complementary feeding among infants and young children, with adjusted odds ratios (AORs) and 95% confidence intervals (CIs). In the spatial analysis, the spatial autocorrelation statistic (Global Moran’s I) was used to explore the spatial distribution of complementary feeding practices among infants and young children in the study area, specifically to determine whether these practices were dispersed, clustered, or randomly distributed in the study area. Moran’s I, a spatial statistic, measures spatial autocorrelation by producing a single value between −1 and +1 that indicates the level of clustering or dispersion. It is more sensitive to standardised spatial covariance than Geary’s C, which depends on the sum of squared distances. The spatial distribution of vitamin A-rich foods was examined using the Getis-Ord Local Spatial Statistics Tool, which identified statistically significant hotspots, indicating areas with high rates of Vitamin A-rich food consumption, and cold spots, indicating areas with low rates of Vitamin A-rich food consumption.
Results
Prevalence of Vitamin A Rich Food Consumption
In the age group of 6–23 months, just 33.75% of children consumed foods high in Vitamin A whereas 66.25% did not reach the recommended Vitamin A intake (Figure 2). The findings also revealed that a significant majority (66.2509%) were classified as “Unmet”, indicating insufficient consumption of Vitamin A-rich foods. Regarding specific food categories, “Flesh Foods” were consumed by 14.2195% of the children, “Eggs” by 7.73343%, “Vitamin A Fruits and Vegetables” by 5.95153%, and “Other Fruits and Vegetables” by 5.84462%. These statistics underscore that, although some Vitamin A-rich foods were part of the diet, the overall intake was inadequate for a significant number of children in this age group, as shown in (Figure 3).
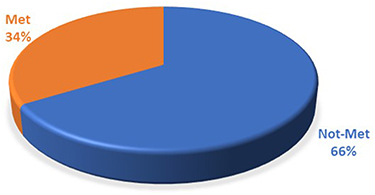 |
Figure 2 Prevalence of Vitamin A rich food consumption among children aged 6–23 months (SDHS, 2020). |
 |
Figure 3 Proportion of Vitamin A rich Foods consumed by children aged 6–23 months (SDHS, 2020). |
Sociodemographic Characteristics of the Study Participants
(Table 1) This research examined 2,806 children, with the majority being 12–17 months old (46.9%), male (52.2%), and firstborn (87.9%). Most families had fewer than five children under five years old (58.5%) and consisted of 4–6 members (46.0%). Maternal characteristics showed a significant lack of formal education (82.6%) and a high rate of home births (80.6%), with 61.7% of mothers citing distance as a significant obstacle to accessing healthcare. Media exposure was extremely limited, with 96.3% not exposed. Participants were located in urban (38.4%), nomadic (33.5%), and rural (28.1%) areas, with the largest regional representation from the Sanaag (10.1%) and Sool (9.9%) regions. Economically, nearly half (47.2%) were classified as poor, and the majority (69.5%) used non-improved water sources for drinking.
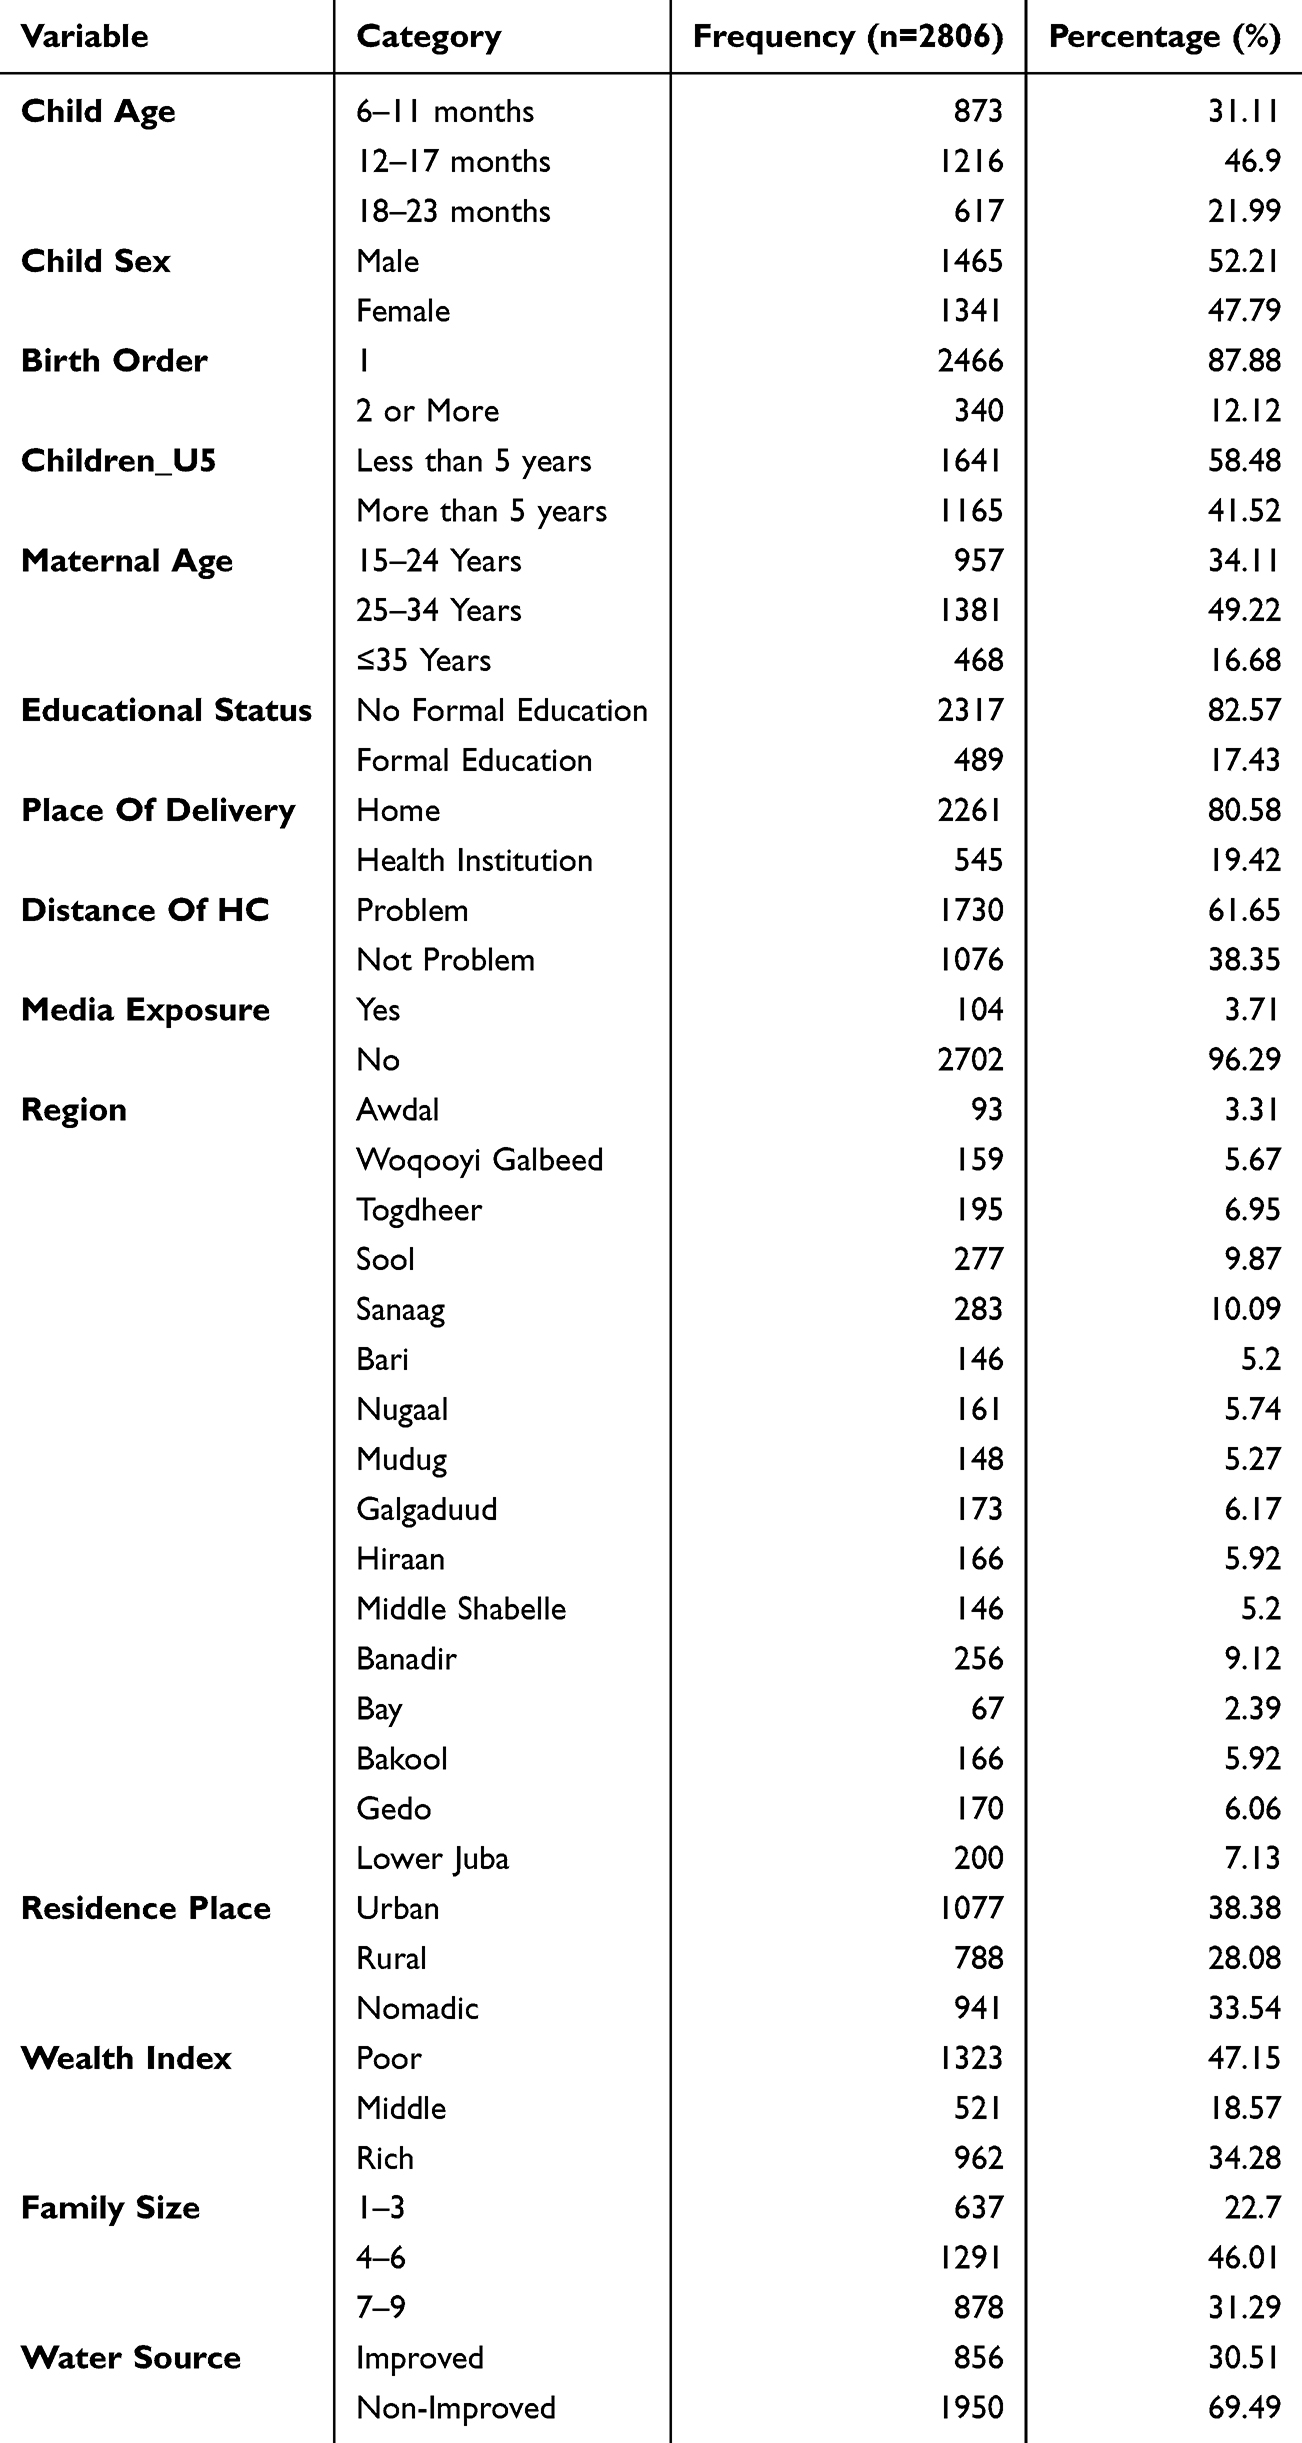 |
Table 1 Socio-Demographic Characteristics of Mothers and Children of Study Participants: Further Analysis of Somalia Demographic and Health Survey, 2020 |
Factors Associated with Vitamin A Rich Foods Consumption Among Children Aged 6–23 Months in Somalia Using Chi-Square Test: Further Analysis of Somalia Demographic and Health Survey 2020
(Table 2) Chi-square tests in bivariate analysis indicated a significant correlation between all examined factors and the consumption of Vitamin A-rich foods (p<0.05). Infants aged 6–11 months had the lowest consumption rate at 24.3%, compared to older age groups (χ2=51.11, p<0.001), and males consumed slightly more than females (35.6% vs. 31.8%, p=0.034). Maternal influences were notable, with children of mothers who had formal education showing higher consumption rates (48.9% vs. 30.6%, p<0.001), as well as those born in health facilities (52.7% vs. 29.2%, p<0.001). Factors such as proximity to health centers, media exposure (65.4% vs. 32.5%), and access to improved water sources (P=0.004) were also positive indicators. There were significant spatial and socioeconomic disparities (χ2 values >219, p<0.001); urban dwellers (50.5%) and the wealthiest households (49.0%) had higher consumption compared to nomadic (13.2%) and impoverished (20.1%) groups. Regionally, the highest consumption was in Banadir (75.0%), while the lowest was in Lower Juba (15.5%).
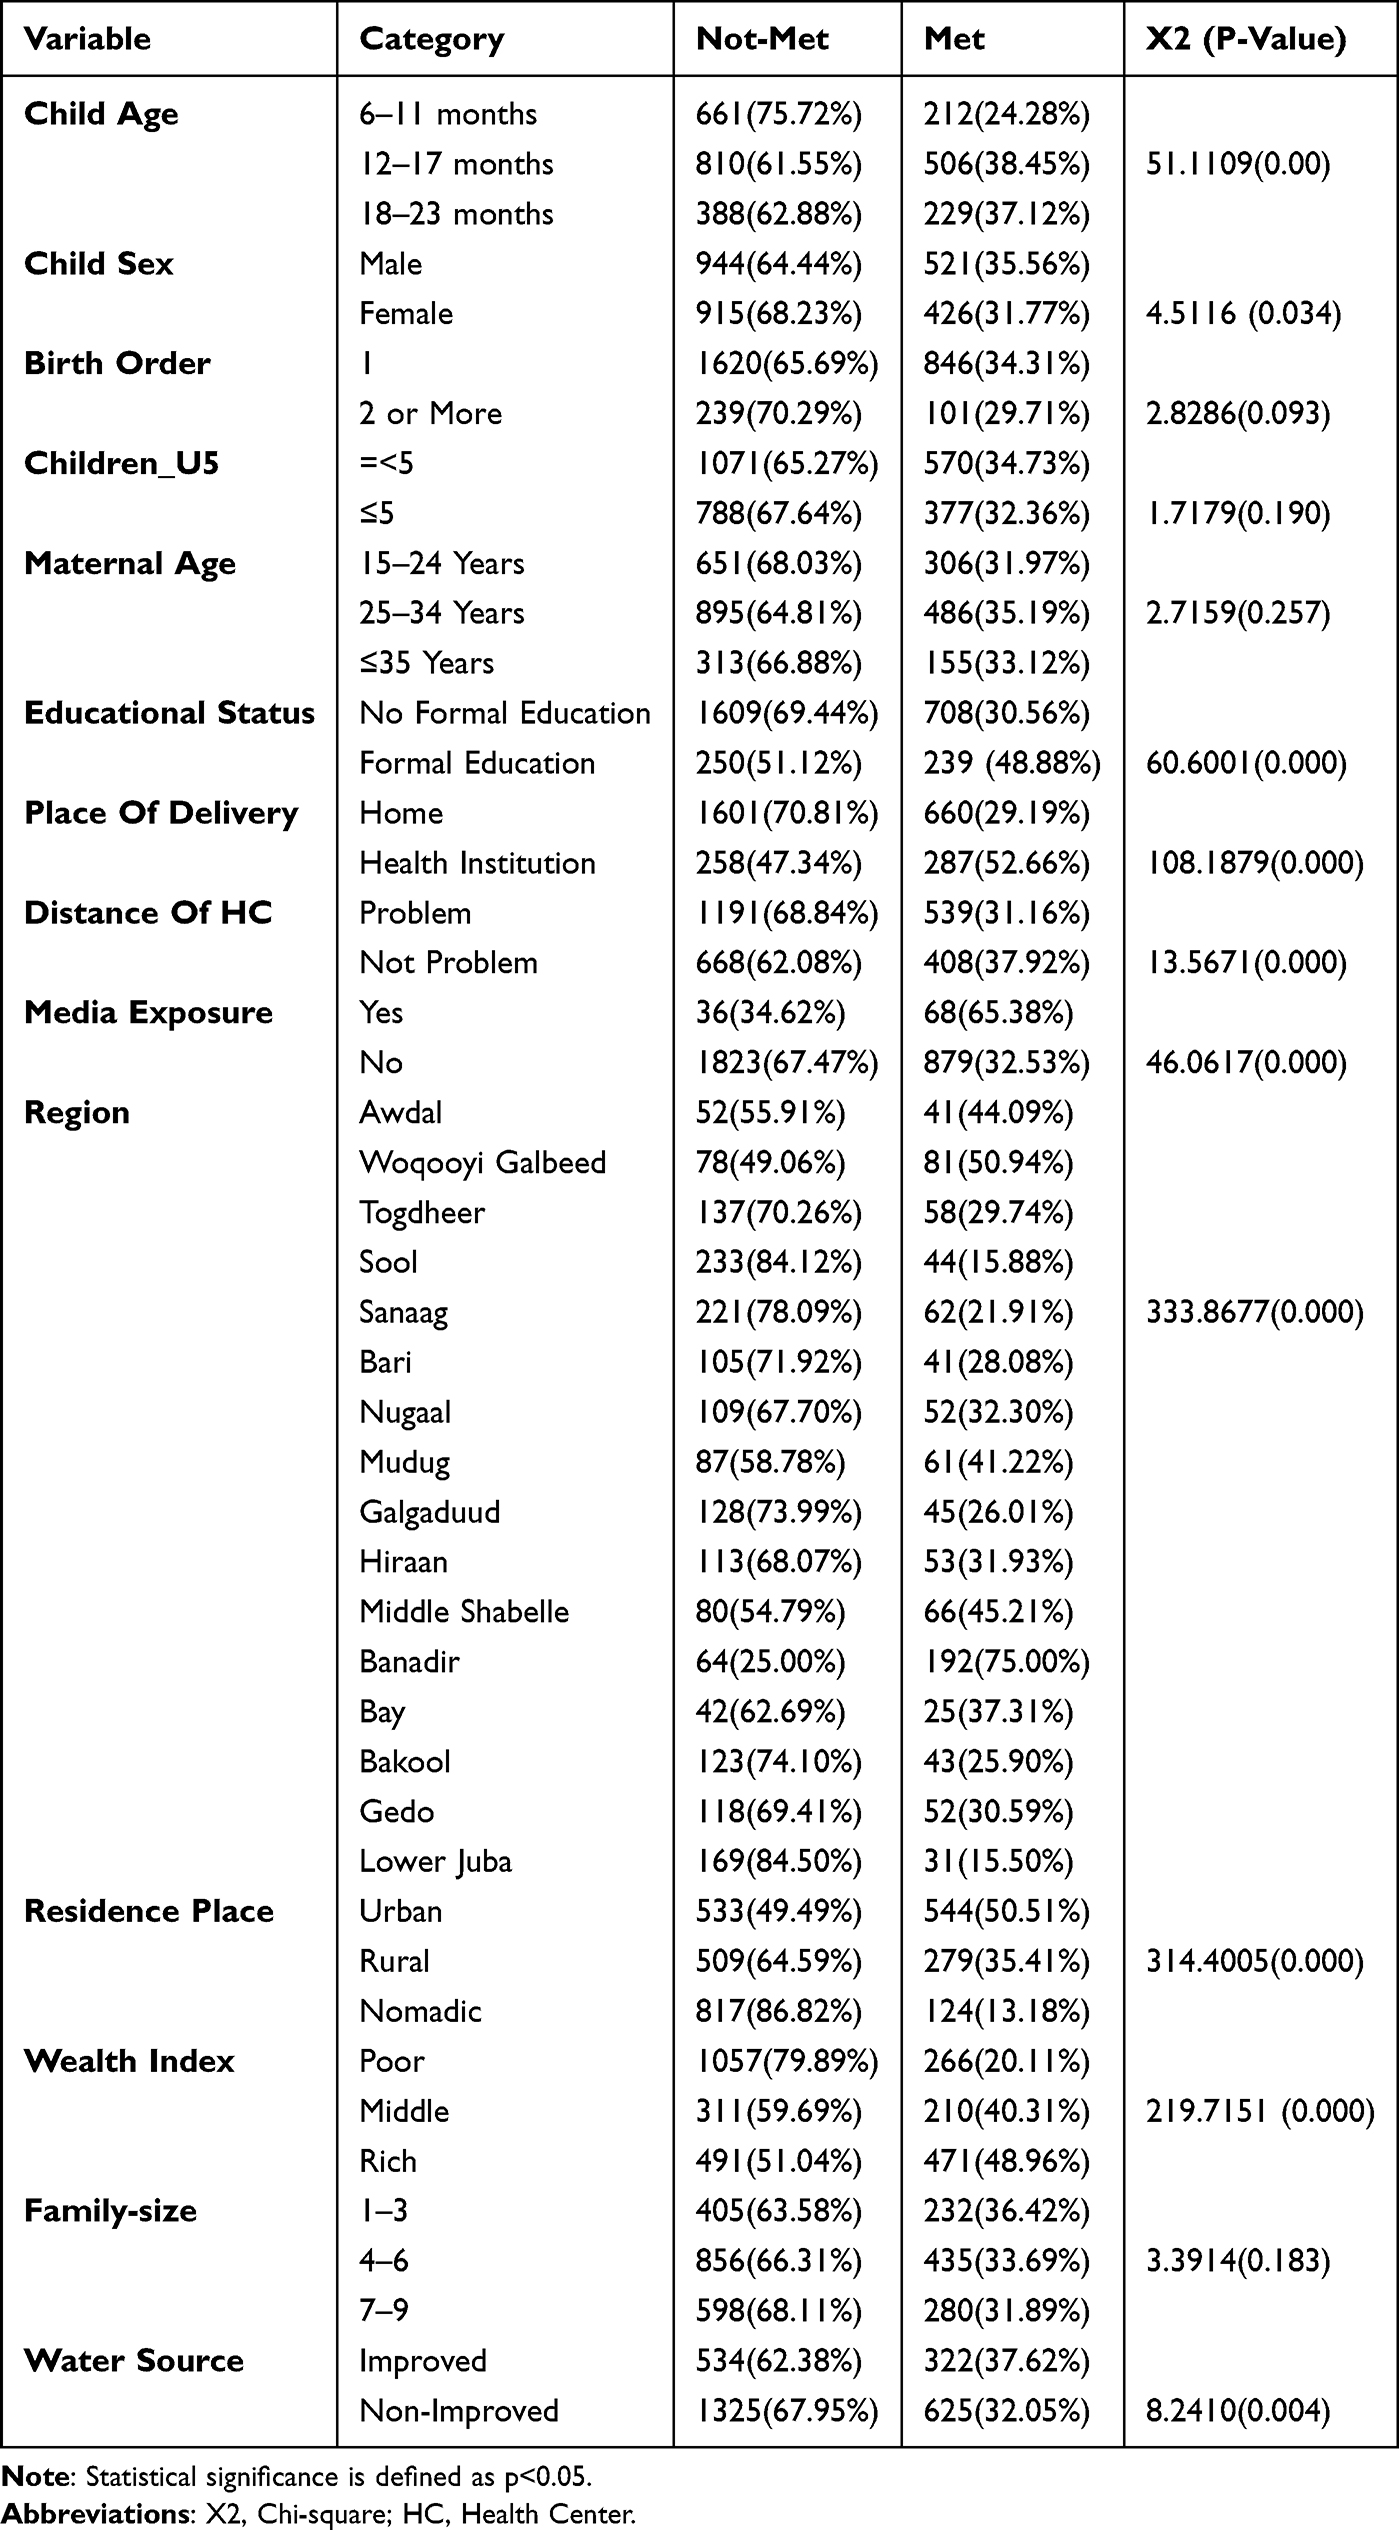 |
Table 2 Factors Associated with Vitamin Rich Foods Consumption Among Children Aged 6–23 Months: Further Analysis of Somalia Demographic and Health Survey, 2020 |
Multilevel Analysis of Factors Associated with Vitamin A Rich Foods Among Children Aged 6–23 Months in Somalia: Further Analysis of Somalia Demographic and Health Survey 2020
(Table 3) Through multilevel analysis, several key factors influencing the consumption of Vitamin A-rich foods were identified. Among child-related factors, age was significant, with children aged 12–17 months (AOR=2.37, 95% CI: 1.89–2.96) and 18–23 months (AOR=2.78, 95% CI: 2.11–3.67) having higher odds compared to those aged 6–11 months. Conversely, children with a birth order of two or more had reduced odds (AOR=0.44, 95% CI: 0.33–0.61). Maternal influences were also notable; increased consumption was associated with mothers aged 25 years or older, those with formal education (AOR=1.42, 95% CI: 1.11–1.82), and those exposed to media (AOR=0.53 for no exposure; 95% CI: 0.33–0.86). Regional differences were pronounced: children in Banadir had nearly twice the odds of consuming these foods compared to those in Awdal (AOR=1.99), while children in nine other regions, such as Sool, Sanaag, and Lower Juba, had significantly lower odds (AOR range 0.13–0.44). Additionally, children from rural (AOR=0.72) and nomadic (AOR=0.22) households were much less likely to consume these foods than those from urban areas.
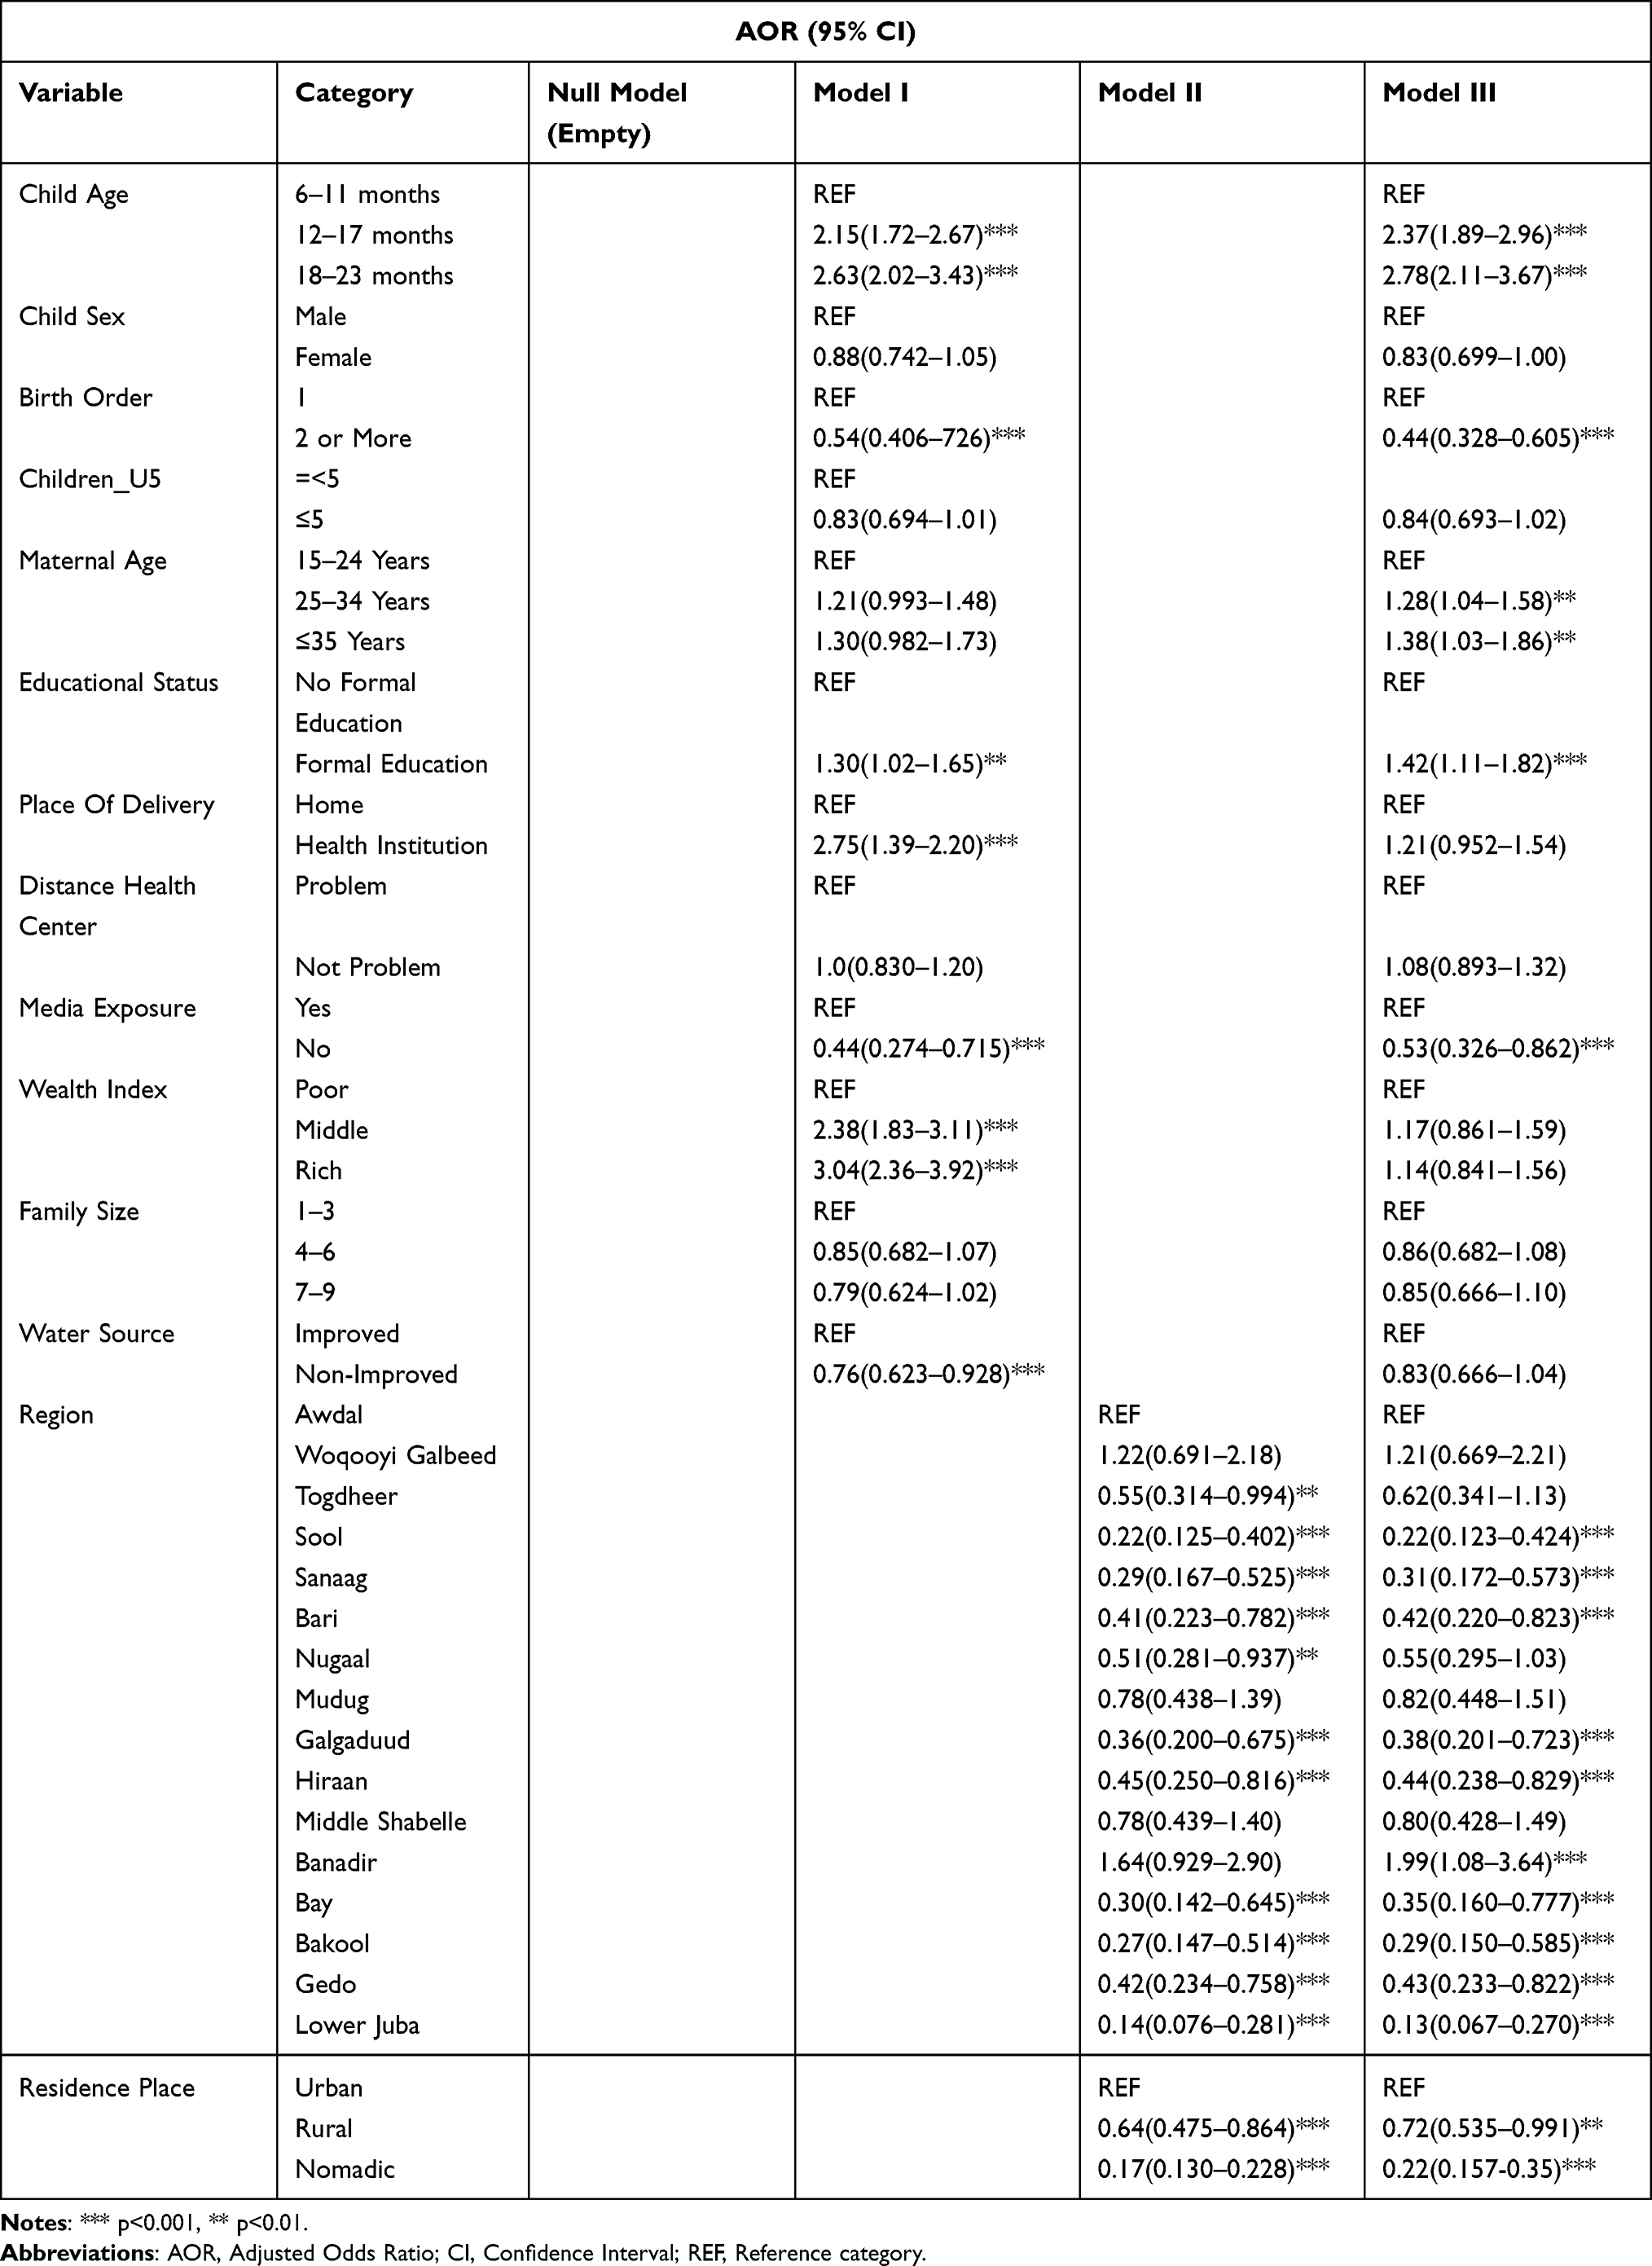 |
Table 3 Multilevel Analysis of Vitamin Rich Foods Consumption Among Children Aged 6–23 Months: Further Analysis of Somalia Demographic and Health Survey, 2020 |
(Table 4) Hierarchical modeling was utilized to evaluate the influences at various levels on the consumption of foods rich in Vitamin A. The initial model showed a significant intra-class correlation coefficient (ICC) of 0.34 (pandlt;0.001), suggesting that 34.0% of the variance in consumption was due to differences at the cluster level. This ICC progressively decreased to 13.0% in Model I, which considered individual and household factors, and further to 3.7% in Model II, which accounted for community factors. The comprehensive final model (Model III) accounted for most of the cluster-level variation, leaving a residual ICC of 2.65% (pandlt;0.001). Model III was the best fitting model, as indicated by the lowest AIC (2972.16) and BIC (3180.04) values, and a significant improvement in the Likelihood Ratio test compared to Model II (p=0.03). These findings confirm that the consumption of Vitamin A is significantly affected by factors spanning multiple levels, from individual traits to broader contextual settings.
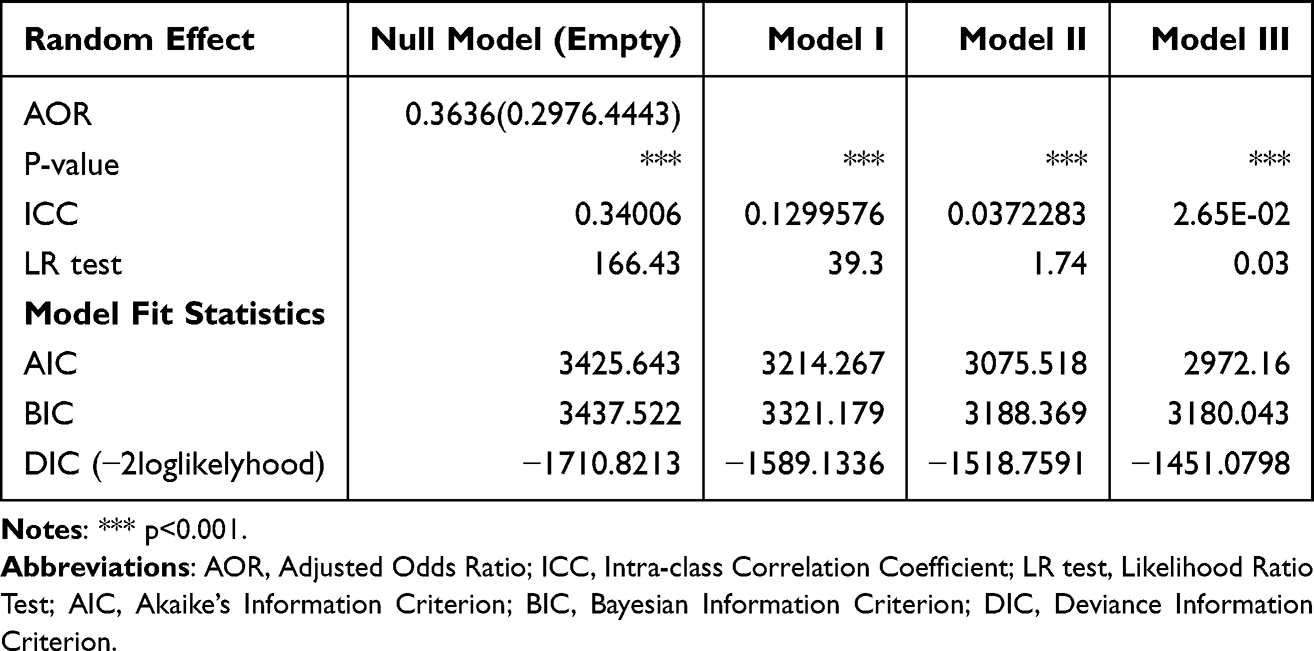 |
Table 4 Random Effect Analysis and Model Comparison |
Spatial Distribution of Vitamin A-Rich Food Consumption Among Children
Figure 4 THE spatial distribution of Vitamin A-rich food intake among children in Somalia, as depicted on the map, reveals significant geographical patterns and regional disparities crucial for pinpointing high-risk zones and guiding targeted nutritional interventions. The map illustrates a clear division, with the highest consumption rates (0.441 to 0.750) observed in the northwestern areas of Awdal and Woqooyi Galbeed, as well as in the southern regions of Bay and Shabeellaha Dhexe. In contrast, the lowest consumption rates (0.155–0.259) were noted in Sanaag and Jubbada Hoose, suggesting that these populations are more susceptible to Vitamin A deficiency. Other regions, including Sool, Bakool, and Galguduud, exhibit relatively low consumption, whereas areas such as Togdheer, Mudug, and Hiiraan show moderate-to-high levels. This distinct geographical pattern underscores the necessity of localised public health strategies to effectively tackle nutritional deficiencies throughout the country.
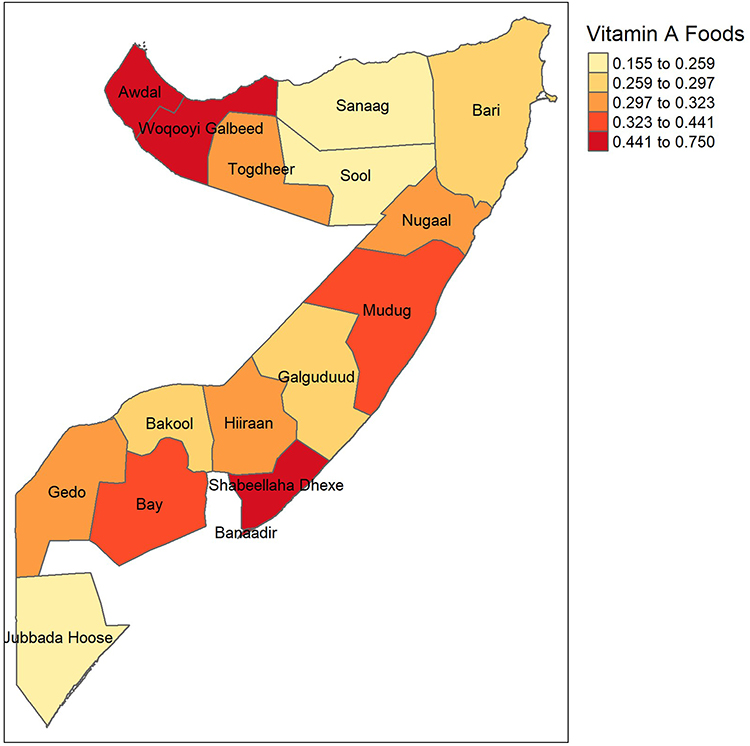 |
Figure 4 Spatial Distribution of Vitamin A-rich food consumption among children (SDHS 2020). |
(Table 5) The Global Moran’s I test was employed to evaluate the spatial autocorrelation in the intake of Vitamin A-rich foods among children in Somalia. The figure demonstrates that the findings indicate a statistically moderate and significant positive spatial autocorrelation (Moran’s I = 0.24, z-score = 1.66, p = 0.048). This suggests that regions with similar consumption levels, whether high or low, tend to cluster. This result supports the rejection of the null hypothesis of random spatial distribution, confirming that the pattern of Vitamin A-rich food consumption is not random but exhibits distinct geographic areas with similar consumption rates (Figure 5).
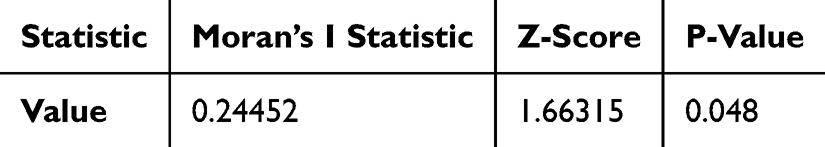 |
Table 5 Global Moran’s I Spatial Autocorrelation |
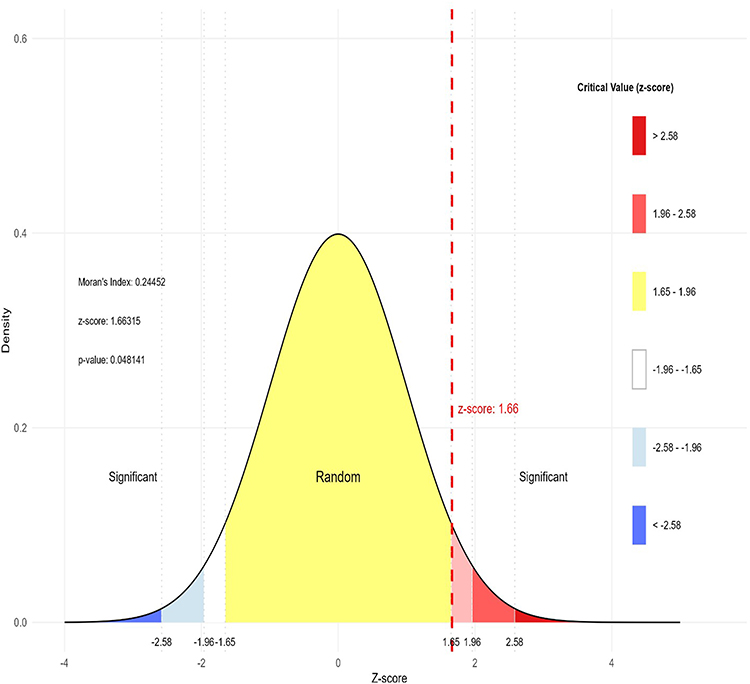 |
Figure 5 Normal distribution curve of Vitamin A rich food consumption. |
Local Moran’s I Spatial Autocorrelation
Figure 6 expanding on global spatial autocorrelation patterns, Local Moran’s I analysis offers a more nuanced understanding of the localised clustering effects related to vitamin A-rich food consumption. The Local Moran’s I map reveals significant spatial clustering of similar consumption levels in areas like Jubbada Hoose, Awdal, and Shabeellaha Dhexe, which show high positive Moran’s I values ranging from 0.361 to 2.126. These regions highlighted areas with strong local spatial autocorrelation, indicating consistent consumption patterns within the clusters. In contrast, regions such as Woqooyi Galbeed, Sool, Mudug, and Galguduud exhibited low or negative Moran’s I values between −0.529 and 0.065, indicating spatial heterogeneity and variability in consumption levels.
 |
Figure 6 Local Moran’s I spatial autocorrelation (SDH,S 2020). |
The p-value map enhances this analysis by emphasising the statistical significance of spatial patterns. In most regions, such as the high-clustering areas of Jubbada Hoose and Awdal, the p-values were below 0.1, indicating statistically significant spatial patterns of clustering. In contrast, Bari and Shabeellaha Dhexe, with p-values of 0.1 or higher, showed patterns that lacked statistical significance, suggesting that their observed clustering or dispersion may have resulted from random variation. Collectively, these findings highlight the spatial disparities in the consumption of Vitamin A-rich foods, with some regions exhibiting statistically significant clustering, while others show heterogeneity or insignificant patterns. This underscores the need for targeted, region-specific interventions to address the localised disparities across Somalia.
Hotspots and Coldspots Analysis (Getis-Ord Gi*)
Figure 7 illustrates that the Getis-Ord Gi* statistic identifies both hotspots and cold spots, indicating areas with significantly high or low consumption of Vitamin A-rich foods, respectively. Regions such as Awdal, Galguduud, and Shabeellaha Dhexe exhibited high positive Gi* values (0.565–1.362), designating them as notable hotspots with concentrated higher consumption. These areas, shown in green, may suggest improved dietary diversity or better access to specific foods. Conversely, regions such as Bari, Gedo, and Woqooyi Galbeed displayed strong negative Gi* values (−1.471 to −0.789), marking them as significant cold spots with lower consumption clustering. These areas, highlighted in red, are priority zones that may require targeted nutritional interventions and public health initiatives. These findings underscore the considerable spatial variations in Vitamin A-rich food consumption and highlight the need for geographically focused, evidence-based public health strategies to address nutritional deficiencies throughout Somalia.
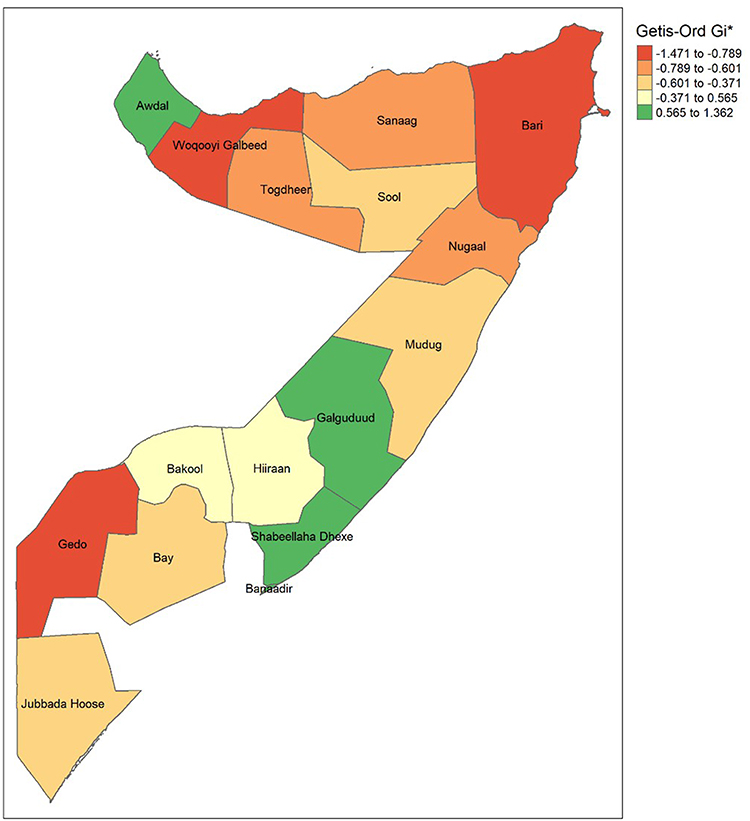 |
Figure 7 Hotspot and Coldspot Analysis (Getis-Ord Gi*) (SDHS 2020). |
Discussion
This research offers an in-depth evaluation of the consumption of Vitamin A-rich foods among children aged 6 to 23 months in Somalia, showing a low prevalence rate of 33.75%. Through multilevel analysis, it was determined that community-level factors contributed to 34.0% of the variation in consumption, with Model III emerging as the most suitable model. Important individual-level predictors included the child’s age, the mother’s education, media exposure, and household wealth, while community-level factors such as the region and place of residence were also significant. Additionally, spatial analysis revealed notable geographical clustering (Moran’s I = 0.24), pinpointing specific consumption hotspots in Awdal and Shabeellaha Dhexe and critical coldspots in Bari, Gedo, and Woqooyi Galbeed. These results emphasize the complex nature of nutritional deprivation in Somalia and highlight the necessity for interventions that tackle both sociodemographic and geographic disparities.
The proportion of infants and young children who met the recommended intake of vitamin A-rich foods was similarly low, with only 34% reaching the required consumption levels. The results of this study are higher than those of other studies conducted in Burundi (16%), Rwanda (23%),27 Ethiopia (13.3%–24%),28 and Wolaita Sodo, Ethiopia (18%).29 However, these figures are lower than those reported in studies from other regions, such as India (58.1%),30 Ghana (52%),9 Malawi (79.1%),31 and Bangladesh (72%).32 These differences can be attributed to variations in socioeconomic status, access to various foods and levels of maternal education. Additionally, the study design, sample size, and measurement tools may have contributed to these discrepancies.
The research indicated that children aged 12–23 months were much more likely to eat foods rich in vitamin A than those aged 6–11 months, aligning with findings from studies conducted in Ethiopia.33–35 This could be attributed to older children’s greater exposure to family meals, enhanced chewing and digestion capabilities, and the tendency for many women to introduce weaning at a later stage in the child’s development.36,37
Maternal education was positively associated with the consumption of foods rich in vitamin A, as evidenced by studies conducted in 91 low- and middle-income countries, including India.38–40 Mothers with education tend to possess greater nutritional knowledge, access health-related information more effectively, and implement better feeding practices, which, in turn, improves their children’s dietary quality.41,42
Exposure to media had a notably positive impact, consistent with research conducted in various regions of Ethiopia.43–45 Mothers with access to media are more likely to obtain information related to nutrition, which can affect feeding practices and enhance dietary diversity. Children from more affluent families were more inclined to eat vitamin A-rich foods, which is consistent with studies from Ethiopia, India, Mexico, and Kenya.46–48 A higher socioeconomic status provides better access to a variety of foods, including animal sources, fruits, and vegetables that are high in vitamin A.
Notable regional differences were identified at the community level in the study. Children residing in Banadir were more likely to consume vitamin A-rich foods, whereas those in Sool, Sanaag, Bari, Galgaduud, Hiraan, Bay, Bakool, Gedo, and Lower Juba had considerably lower chances of consuming vitamin A-rich foods.48–50 These discrepancies may stem from variations in agricultural output, market accessibility and public health infrastructure. Additionally, children in rural and nomadic regions were less inclined to fulfil vitamin A intake guidelines than their urban counterparts,51–53 likely due to restricted access to markets, healthcare services, and a variety of food sources.
Spatial analysis revealed notable clustering in consumption patterns, identifying hotspots in Awdal and Shabellaha Dhexe, while cold spots were identified in Bari, Gedo, and Wogooyi Galbeed. This highlights the importance of geographically focused interventions to address localised nutritional deficiencies.
While this study provides a comprehensive analysis using a large, nationally representative dataset, it is important to recognize several limitations. Firstly, the cross-sectional nature of the SDHS prevents the determination of causal links between the identified factors and Vitamin A consumption. Future investigations should utilize longitudinal or prospective cohort studies to observe dietary changes over time and verify the direction of these relationships. Secondly, the reliance on maternal 24-hour recall is prone to recall bias and may not accurately represent long-term dietary habits. To address this in future evaluations, researchers should consider employing multiple-day food records or validating recall data with biochemical markers like serum retinol or retinol-binding protein (RBP) levels. Thirdly, the survey did not provide quantitative data on the amount of food consumed, which limits our ability to assess whether the intake meets the complete physiological needs for Vitamin A. Future nutritional surveys in Somalia should include weighed food records or portion-size estimation tools to offer a more detailed view of nutrient adequacy. Lastly, the dataset lacked variables such as household food security status, local market prices, and cultural feeding taboos. Future studies should aim to connect DHS data with market price monitoring systems (eg., FSNAU) and qualitative ethnographic research to gain a better understanding of the economic and cultural obstacles to accessing Vitamin A-rich foods in nomadic and rural communities.
Conclusion
This study highlights the low prevalence of vitamin A-rich food consumption among Somali children aged 6–23 months, with significant disparities driven by socio-demographic and geographic factors. Multilevel analysis revealed that both individual- and community-level factors substantially contributed to these results. Key determinants included the child’s age, maternal education, media exposure, household wealth, region, and residence. The spatial clustering of consumption patterns further emphasises the need for context-specific multisectoral interventions. Strategies should focus on improving maternal education, enhancing access to health services and information, addressing economic inequalities, and implementing regionally tailored programs to improve vitamin A intake and reduce micronutrient deficiencies in Somalia. Given that Vitamin A deficiency is a major driver of preventable blindness and immune dysfunction, the public health significance of this study is underscored by its contribution to the evidence base needed to achieve Sustainable Development Goals related to ending “hidden hunger” and ensuring healthy lives for all Somali children.
Abbreviations
VAD: Vitamin A Deficiency; IYC: Infant and Young Child. SDHS, Somali Demography and Health Survey; SDG, Sustainable Development Goals; SSA, Sub-Saharan Africa; WHO, World Health Organization.
Data Sharing Statement
Data is available online using this link on free access Somalia - Somali Health and Demographic Survey 2020 (nbs.gov.so).15
Acknowledgments
We want to show our sincere gratitude to Somalia DHS for their permission to use this data.
Author Contributions
All authors made a significant contribution to the work reported, whether that is in the conception, study design, execution, acquisition of data, analysis and interpretation, or in all these areas; took part in drafting, revising or critically reviewing the article; gave final approval of the version to be published; have agreed on the journal to which the article has been submitted; and agree to be accountable for all aspects of the work.
Funding
No funding is received in this study.
Disclosure
The authors report no competing interest in this work.
References
1. Imdad A, Yakoob MY, Sudfeld C, Haider BA, Black RE, Bhutta ZA. Impact of vitamin A supplementation on infant and childhood mortality. BMC Public Health. 2011;11(S3):S20. doi:10.1186/1471-2458-11-S3-S20
2. Kassa G, Mesfin A, Gebremedhin S. Uptake of routine vitamin A supplementation for children in Humbo district, southern Ethiopia: community-based cross-sectional study. BMC Public Health. 2020;20(1):1500. doi:10.1186/s12889-020-09617-1
3. Benn CS, Aaby P, Arts RJ, Jensen KJ, Netea MG, Fisker AB. An enigma: why vitamin A supplementation does not always reduce mortality even though vitamin A deficiency is associated with increased mortality. Int J Epidemiol. 2015;44(3):906–17. doi:10.1093/ije/dyv117
4. Song P, Adeloye D, Li S, et al. The prevalence of vitamin A deficiency and its public health significance in children in low-and middle-income countries: a systematic review and modelling analysis. J Glob Health. 2023;13:04084. doi:10.7189/jogh.13.04084
5. Merid MW, Aragaw FM, Godana TN, et al. Wealth-related inequality in vitamin A rich food consumption among children of age 6–23 months in Ethiopia; Wagstaff decomposition of the 2019 mini-DHS data. PLoS One. 2024;19(10):e0302368. doi:10.1371/journal.pone.0302368
6. World Health Organization. Global prevalence of vitamin A deficiency in populations at risk 1995-2005: WHO global database on vitamin A deficiency. Global Prevalence of Vitamin a Deficiency in Populations at Risk 1995-2005: WHO Global Database on Vitamin a Deficiency. 2009.
7. Wardlaw T, You D, Hug L, Amouzou A, Newby H. UNICEF Report: enormous progress in child survival but greater focus on newborns urgently needed. Reproductive Health. 2014;11(1):82. doi:10.1186/1742-4755-11-82
8. Stevens GA, Bennett JE, Hennocq Q, et al. Trends and mortality effects of vitamin A deficiency in children in 138 low-income and middle-income countries between 1991 and 2013: a pooled analysis of population-based surveys. Lancet Glob Health. 2015;3(9):e528–e536. doi:10.1016/S2214-109X(15)00039-X
9. Donkor WE, Adu-Afarwuah S, Wegmüller R, et al. Complementary feeding indicators in relation to micronutrient status of Ghanaian children aged 6–23 months: results from a national survey. Life. 2021;11(9):969. doi:10.3390/life11090969
10. Rice AL, West JKP, Black RE. Vitamin A deficiency. In: Comparative Quantification of Health Risks: Global and Regional Burden of Disease Attributable to Selected Major Risk Factors. Vol. 1. 2004:0211–0256.
11. ICF NSO. (NSO)[Malawi] and Malawi Demographic and Health Survey 2015–16. Zomba, Malawi, and Rockville, Maryland, USA: NSO and ICF; 2017.
12. Rodriguez-Amaya DB. Carotenoids and Food Preparation: The Retention of Provitamin a Carotenoids in Prepared, Processed and Stored Foods. VA: John Snow Incorporated/OMNI Project Arlington; 1997.
13. Booth S, Johns T, Kuhnlein H. Natural food sources of vitamin A and provitamin A. Food Nutr Bull. 1992;14(1):1–15. doi:10.1177/156482659201400115
14. Pecora F, Persico F, Argentiero A, Neglia C, Esposito S. The role of micronutrients in support of the immune response against viral infections. Nutrients. 2020;12(10):3198. doi:10.3390/nu12103198
15. Somali-Health-Demographic-Survey-2020.
16. 2019 Somalia Micronutrient Survey. 2019.
17. Woldegebriel AG, Desta AA, Gebreegziabiher G, Berhe AA, Ajemu KF, Woldearegay TW. Dietary Diversity and Associated Factors among Children Aged 6-59 Months in Ethiopia: analysis of Ethiopian Demographic and Health Survey 2016 (EDHS 2016). Int J Pediatr. 2020;2020(1):3040845. doi:10.1155/2020/3040845
18. Kumera G, Tsedal E, Ayana M. Dietary diversity and associated factors among children of Orthodox Christian mothers/caregivers during the fasting season in Dejen District, North West Ethiopia. Nutr Metab. 2018;15(1):16. doi:10.1186/s12986-018-0248-0
19. Kundu S, Rai B, Shukla A. Prevalence and determinants of Vitamin A deficiency among children in India: findings from a national cross-sectional survey. Clin Epidemiol Global Health. 2021;11:100768. doi:10.1016/j.cegh.2021.100768
20. Chitekwe S, Parajuli KR, Paudyal N, et al. Individual, household and national factors associated with iron, vitamin A and zinc deficiencies among children aged 6–59 months in Nepal. Maternal and Child Nutrition. 2022;18(S1):e13305. doi:10.1111/mcn.13305
21. Ali AO, Hassan AM, Mahamoud HD, Barakale NM, Dahir MY, Hossain M. Determinants of Vitamin A Consumption Among Children Aged 6–23 Months in Somalia: a Multilevel Analysis of
22. Mensi A, Udenigwe CC. Emerging and practical food innovations for achieving the Sustainable Development Goals (SDG) target 2.2. Trends Food Sci Technol. 2021;111:783–789. doi:10.1016/j.tifs.2021.01.079
23. de Romana DL, Greig A, Thompson A, Arabi M. Successful delivery of nutrition programs and the sustainable development goals. Curr Opin Biotechnol. 2021;70:97–107. doi:10.1016/j.copbio.2021.03.004
24. Daru J. Sustainable Development Goals for anaemia: 20 years later, where are we now? Lancet Glob Health. 2022;10(5):e586–e587. doi:10.1016/S2214-109X(22)00127-9
25. 9789240018389-eng.
26. Rutstein SO, Rojas G. Guide to DHS statistics. Calverton MD ORC Macro. 2006;38:78.
27. Custodio E, Herrador Z, Nkunzimana T, Węziak-Białowolska D, Perez-Hoyos A, Kayitakire F. Children’s dietary diversity and related factors in Rwanda and Burundi: a multilevel analysis using 2010 Demographic and Health Surveys. PLoS One. 2019;14(10):e0223237. doi:10.1371/journal.pone.0223237
28. Seboka BT, Hailegebreal S, Yehualashet DE, et al. Exploring spatial variations and determinants of dietary diversity among children in Ethiopia: spatial and multilevel analysis using EDHS (2011–2016). J Multidisciplinary Healthc. 2021;Volume 14:2633–2650. doi:10.2147/JMDH.S327456
29. Mekisso SM, Dake SK, Haile DT, Nane D. Inadequate consumption of vitamin A-rich foods among preschool children in Wolaita Sodo, Southern Ethiopia. Frontiers in Nutrition. 2024;11:1503040. doi:10.3389/fnut.2024.1503040
30. Semba RD, de Pee S, Sun K, Campbell AA, Bloem MW, Raju V. Low intake of vitamin A–rich foods among children, aged 12–35 months, in India: association with malnutrition, anemia, and missed child survival interventions. Nutrition. 2010;26(10):958–962. doi:10.1016/j.nut.2009.08.010
31. National Statistical Office. (NSO)[Malawi] and ICF. Malawi Demographic and Health Survey 2015–16. Zomba, Malawi, and Rockville, Maryland, USA: NSO and ICF; 2017.
32. Rima FS, Kundu S, Tarannum S, Jannatul T, Sharif AB. Spatial variations and determinants of vitamin A and iron rich food consumption among Bangladeshi children aged 6–23 months. Sci Rep. 2025;15(1):17881. doi:10.1038/s41598-025-92068-8
33. Demsash AW, Chereka AA, Kassie SY, et al. Spatial distribution of vitamin A rich foods intake and associated factors among children aged 6–23 months in Ethiopia: spatial and multilevel analysis of 2019 Ethiopian mini demographic and health survey. BMC Nutr. 2022;8(1):77. doi:10.1186/s40795-022-00573-0
34. Mekonnen TC, Workie SB, Yimer TM, Mersha WF. Meal frequency and dietary diversity feeding practices among children 6–23 months of age in Wolaita Sodo town, Southern Ethiopia. J Health Popul Nutr. 2017;36(1):18. doi:10.1186/s41043-017-0097-x
35. Haile D, Azage M, Mola T, Rainey R. Exploring spatial variations and factors associated with childhood stunting in Ethiopia: spatial and multilevel analysis. BMC Pediatric. 2016;16(1):49. doi:10.1186/s12887-016-0587-9
36. Yiengprugsawan V, Lim LL, Carmichael GA, Sidorenko A, Sleigh AC. Measuring and decomposing inequity in self-reported morbidity and self-assessed health in Thailand. Int J Equity Health. 2007;6(1):23. doi:10.1186/1475-9276-6-23
37. Langley-Evans SC. Complementary feeding: should baby be leading the way? J Hum Nutr Diet. 2022;35(2):247. doi:10.1111/jhn.12988
38. Srivastava S, Kumar S. Does socio-economic inequality exist in micro-nutrients supplementation among children aged 6–59 months in India? Evidence from National Family Health Survey 2005–06 and 2015–16. BMC Public Health. 2021;21(1):545. doi:10.1186/s12889-021-10601-6
39. Ricardo LI, Gatica-Domínguez G, Neves PA, Dos S VJ, Barros AJ, Wehrmeister FC. Sociodemographic inequalities in vegetables, fruits, and animal source foods consumption in children aged 6–23 months from 91 LMIC. Frontiers in Nutrition. 2023;10:1046686. doi:10.3389/fnut.2023.1046686
40. Paramashanti BA, Dibley MJ, Alam A, Huda TM. Wealth-and education-related inequalities in minimum dietary diversity among Indonesian infants and young children: a decomposition analysis. Global Health Action. 2022;15(1):2040152. doi:10.1080/16549716.2022.2040152
41. Senarath U, Godakandage SS, Jayawickrama H, Siriwardena I, Dibley MJ. Determinants of inappropriate complementary feeding practices in young children in Sri Lanka: secondary data analysis of demographic and health survey 2006–2007. Maternal and Child Nutrition. 2012;8:60–77. doi:10.1111/j.1740-8709.2011.00375.x
42. Dafursa K, Gebremedhin S. Dietary diversity among children aged 6–23 months in Aleta Wondo District, Southern Ethiopia. J Nutr Metabol. 2019;2019(1):2869424. doi:10.1155/2019/2869424
43. Aemro M, Mesele M, Birhanu Z, Atenafu A. Dietary diversity and meal frequency practices among infant and young children aged 6–23 months in Ethiopia: a secondary analysis of Ethiopian demographic and health survey 2011. J Nutr Metabol. 2013;2013(1):782931. doi:10.1155/2013/782931
44. Beyene M, Worku AG, Wassie MM. Dietary diversity, meal frequency and associated factors among infant and young children in Northwest Ethiopia: a cross-sectional study. BMC Public Health. 2015;15(1):1007. doi:10.1186/s12889-015-2333-x
45. Gilano G, Hailegebreal S, Seboka BT. Geographical variation and associated factors of vitamin A supplementation among 6–59-month children in Ethiopia. PLoS One. 2021;16(12):e0261959. doi:10.1371/journal.pone.0261959
46. Tiruneh SA, Fentie DT, Yigizaw ST, Abebe AA, Gelaye KA. Spatial distribution and geographical heterogeneity factors associated with poor consumption of foods rich in vitamin A among children age 6–23 months in Ethiopia: geographical weighted regression analysis. PLoS One. 2021;16(6):e0252639. doi:10.1371/journal.pone.0252639
47. Wolde M, Tessema ZT. Determinants of good vitamin A consumption in the 12 East Africa Countries using recent Demographic and health survey. PLoS One. 2023;18(2):e0281681. doi:10.1371/journal.pone.0281681
48. Kennedy ET, Ruth O. Household and preschooler vitamin A consumption in southwestern Kenya. J Nutr. 1993;123(5):841–846. doi:10.1093/jn/123.5.841
49. Gebremedhin T, Aschalew AY, Tsehay CT, Dellie E, Atnafu A. Micronutrient intake status and associated factors among children aged 6–23 months in the emerging regions of Ethiopia: a multilevel analysis of the 2016 Ethiopia demographic and health survey. PLoS One. 2021;16(10):e0258954. doi:10.1371/journal.pone.0258954
50. Gebremeskel MG, Mulugeta A, Bekele A, et al. Individual and community level factors associated with anemia among children 6—59 months of age in Ethiopia: a further analysis of 2016 Ethiopia demographic and health survey. PLoS One. 2020;15(11):e0241720. doi:10.1371/journal.pone.0241720
51. Paramashanti BA, Huda TM, Alam A, Dibley MJ. Trends and determinants of minimum dietary diversity among children aged 6–23 months: a pooled analysis of Indonesia demographic and health surveys from 2007 to 2017. Public Health Nutrition. 2022;25(7):1956–1967. doi:10.1017/S1368980021004559
52. Shagaro SS, Mulugeta BT, Kale TD. Complementary feeding practices and associated factors among mothers of children aged 6-23 months in Ethiopia: secondary data analysis of Ethiopian mini demographic and health survey 2019. Arch Public Health. 2021;79(1):205. doi:10.1186/s13690-021-00725-x
53. Kabir I, Khanam M, Agho KE, Mihrshahi S, Dibley MJ, Roy SK. Determinants of inappropriate complementary feeding practices in infant and young children in Bangladesh: secondary data analysis of Demographic Health Survey 2007. Maternal and Child Nutrition. 2012;8:11–27. doi:10.1111/j.1740-8709.2011.00379.x
 © 2026 The Author(s). This work is published and licensed by Dove Medical Press Limited. The
full terms of this license are available at https://www.dovepress.com/terms
and incorporate the Creative Commons Attribution
- Non Commercial (unported, 4.0) License.
By accessing the work you hereby accept the Terms. Non-commercial uses of the work are permitted
without any further permission from Dove Medical Press Limited, provided the work is properly
attributed. For permission for commercial use of this work, please see paragraphs 4.2 and 5 of our Terms.
© 2026 The Author(s). This work is published and licensed by Dove Medical Press Limited. The
full terms of this license are available at https://www.dovepress.com/terms
and incorporate the Creative Commons Attribution
- Non Commercial (unported, 4.0) License.
By accessing the work you hereby accept the Terms. Non-commercial uses of the work are permitted
without any further permission from Dove Medical Press Limited, provided the work is properly
attributed. For permission for commercial use of this work, please see paragraphs 4.2 and 5 of our Terms.
Recommended articles
Rotavirus Prevalence in Children with Acute Gastroenteritis Admitted to a Tertiary Hospital in Somalia in 2020-2023: A Retrospective, Single-Center Study
Orhan Z, Mohamud SM, Mohamud RYH, Doğan S
Pediatric Health, Medicine and Therapeutics 2024, 15:365-373
Published Date: 27 November 2024