Back to Journals » International Journal of Chronic Obstructive Pulmonary Disease » Volume 17
Spatial Association of Environmental and Dietary Factors with COPD Deaths
Authors Aktas S, Tuzuner B, Mergen M, Sultan-Ali I, Kocak M ![]()
Received 25 February 2022
Accepted for publication 25 June 2022
Published 26 July 2022 Volume 2022:17 Pages 1643—1650
DOI https://doi.org/10.2147/COPD.S364076
Checked for plagiarism Yes
Review by Single anonymous peer review
Peer reviewer comments 3
Editor who approved publication: Prof. Dr. Richard Russell
Video abstract presented by Mehmet Kocak.
Views: 203
Selman Aktas,1,2 Begum Tuzuner,3 Mahmut Mergen,4 Ibrahim Sultan-Ali,5 Mehmet Kocak4
1School of Medicine, Health Sciences University, Istanbul, Turkey; 2School of Medicine, Istanbul University-Cerrahpaşa, Istanbul, Turkey; 3School of Engineering, Bogazici University, Istanbul, Turkey; 4International School of Medicine, Istanbul Medipol University, Istanbul, Turkey; 5School of Medicine, the University of Tennessee Health Science Center, Memphis, TN, USA
Correspondence: Mehmet Kocak, Email [email protected]
Introduction: Chronic obstructive pulmonary disease (COPD) remains a significant health concern globally and spatiotemporal investigations on the etiology and progression of COPD are needed to develop more effective and timely preventive measures. To address this continuing need, we explored the association of air-quality and meteorological markers, fruit and vegetable consumption and drinking water source trajectories with COPD death rate.
Methods: For 81 provinces of Turkey, we extracted and merged data in four dimensions: provincial COPD deaths, provincial annual meteorological and air-quality markers, drinking water source data covering rivers, dams, wells, and springs, and annual provincial fruits and vegetables consumption. To investigate the association of these markers with COPD deaths, we used a spatial modelling approach accounting for the spatial autocorrelation.
Results: Controlling for household expenditure on cigarette and alcohol and elderly population size, our models suggest that provinces with higher consumption of lemon and higher temperature reported lower level of COPD deaths and provinces high in Nitrogen Dioxide concentration reported higher COPD deaths on average.
Conclusion: Therefore, provinces with such profiles need to develop closer screening and follow-up of patients with COPD and encourage healthier diets and lifestyles.
Keywords: chronic obstructive pulmonary disease, air quality markers, meteorology markers, drinking water sources, fruit and vegetable consumption
Introduction
Chronic obstructive pulmonary disease (COPD) is a slowly progressive disease, characterized by lung function impairment due to air flow obstruction.1 The exact prevalence of COPD worldwide is largely unknown, but estimates have varied from 7% to 19%. The Burden of Obstructive Lung Disease (BOLD) study found a global prevalence of 10.1%. Men were found to have a pooled prevalence of 11.8% and women 8.5%,2 according to the World Health Organization estimates that 65 million people have moderate-to-severe COPD. They also predict that COPD will be the third leading cause of death worldwide by 2030 (https://www.who.int/respiratory/copd/burden/en/).
COPD is a complex disorder that results from both environmental and genetic risk factors.3 Common symptoms include cough, sputum production and shortness of breath. Smoking and indoor and outdoor air pollutants are well-known risk factors for COPD.4 Other risk factors for COPD include occupational dusts and chemicals (such as vapours, irritants, and fumes) and frequent lower respiratory infections during childhood (https://www.who.int/respiratory/copd/causes/en/). Exposure to cigarette smoke is a known risk factor,5,6 and treatments were developed to alleviate this negative effect.7,8 Alcohol consumption is another known risk factor for COPD9 as well as aging.10
In this study, we aimed to explore the association of air-quality trajectories of six air-quality markers, fruit and vegetable consumption and drinking water source trajectories with COPD death rate using spatiotemporal data for Turkey. We will describe our data and analytical approach in Materials and Methods section, will present the study findings in the Results section, and discuss these findings with comparisons and contrasts with the literature in the Discussion section.
Materials and Methods
The primary outcome of this work is the COPD deaths, which we will call the DISEASE dimension. In this dimension, the annual number of COPD deaths for 81 provinces of Turkey was requested from the Turkish Statistical Institute for Years 2018 and 2019, and by taking the average for the two years, we came up with a COPD burden indicator for each province. The second dimension of our data collection efforts targeted FOOD CONSUMPION. In this dimension, fruit and vegetable sales data covering 37 different fruits or vegetables sold in local markets within each of the 81 provinces was obtained from the Turkish Ministry of Commerce for Years 2018–2020. We targeted AIR QUALITY as our third dimension of data. To enrich this dimension, data on air quality markers, namely, Particulate Matter 10 and 2.5 (PM10 and PM2.5), sulfur dioxide (SO2), Carbon Monoxide (CO), Nitrogen Dioxide (NO2), and Ozone (O3) were manually extracted from the periodic Environmental Impact Evaluation (EIE) reports generated by the Turkish Ministry of Environment and Urbanization for each of the 81 provinces of Turkey for years 2017–2019. PM2.5 was not available in about half of the provinces, and we dropped this marker from our modeling efforts. Province-level radon data was also manually extracted from a radon concentration map of Turkey by the Turkish Atomic Agency in 2014. Another environmental dimension we collected data from was METEOROLOGY, where province-level air pressure, humidity, rainy days in a year, maximum-average-minimum temperatures, windspeed as well as total sunlight, sun radiation, and electromagnetic field. We also aimed to cover the DRINKING WATER quality dimension as percentages of drinking water sources from streams, dams, lakes, ponds, springs and wells. This data was also manually extracted for each of the 81 provinces from the periodic Environmental Impact Evaluation (EIE) reports generated by the Turkish Ministry of Environment and Urbanization for each state on an annual basis between years 2000–2018. From the BEHAVIOR dimension, we were not able to obtain province-level data, while cigarette and alcohol consumption data were obtained from 11 regions and these regional values were assigned to provinces that fall into these regions. We also obtain the province-level elderly (age >65) population proportion as a control variable along with smoking and alcohol consumption.
Data from these dimensions were merged with province ID and year identifiers. Variables that require population normalization such as COPD deaths, food consumption or drinking water source were normalized by the population size of each province for each year appropriately. The air-quality and meteorology markers were expressed as annual averages within each province. Representative maps of different data dimensions have been provided in Figures 1–3.
 |
Figure 1 Map of Annual COPD Deaths. |
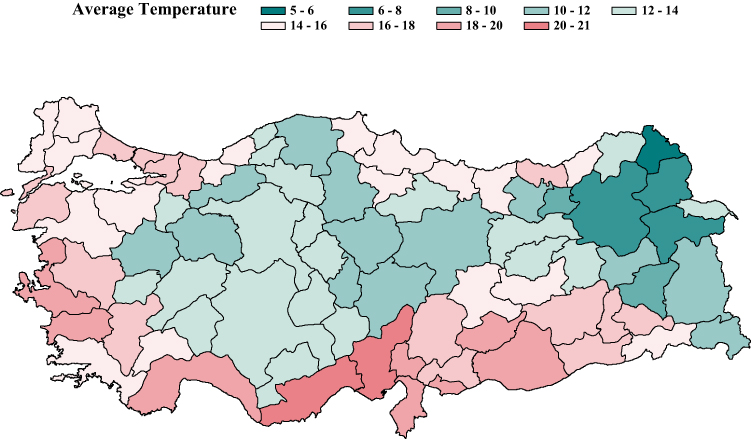 |
Figure 2 Map of Annual Average Temperature. |
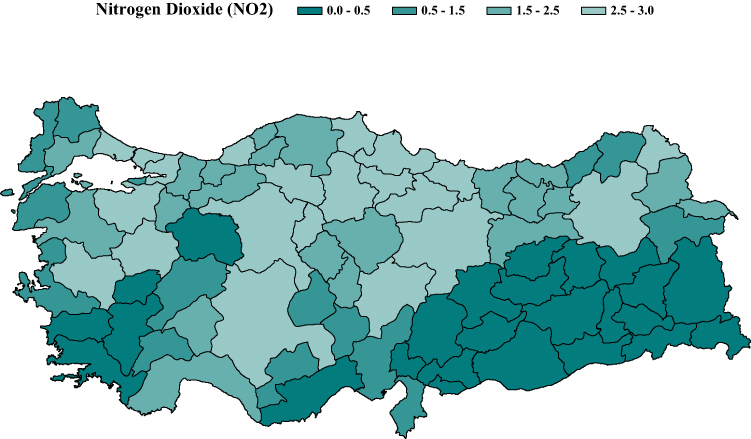 |
Figure 3 Map of Annual Average Nitrogen Dioxide (NO2) Concentration. |
Since the outcome variable, COPD deaths, is of spatial nature, we tested for the spatial autocorrelation using the Moran’s I statistic,11 which suggested a highly significant spatial autocorrelation (p < 0.0001). This significant spatial autocorrelation necessitated that spatial regression models be used to model the association of COPD deaths with other environmental markers. To do so, we used SPATIALREG procedure in SAS Version 9.4 (®, Cary, North Carolina, USA) and compared the following 11 models for better model fitting
(https://support.sas.com/rnd/app/ets/procedures/ets_spatialreg.html):
- linear model with spatial lag of X (SLX) effects
- spatial autoregressive (SAR) model
- spatial Durbin model (SDM)
- spatial error model (SEM)
- spatial Durbin error model (SDEM)
- spatial moving average (SMA) model
- spatial Durbin moving average (SDMA) model
- spatial autoregressive moving average (SARMA) model
- spatial Durbin autoregressive moving average (SDARMA) model
- spatial autoregressive confused (SAC) model
- spatial Durbin autoregressive confused (SDAC) model.
Each of these 11 models requires a distance weight matrix. To obtain such a matrix, we constructed an 81 × 81 distance matrix, representing distances from the centroids of each of the 81 provinces to the centroids of the other provinces with diagonal elements being zero (0) as the distance of a province to itself is zero. The spatial weights were obtained as the reciprocal of the actual distances.
In addition to representing each province by averages of these markers, another approach we employed to generate an environmental signature for each province was to generate median-dichotomization, tertiles, and quartiles of each independent variable across the years over which the data was available; thus, each province’s signature was given an ordinal marker ranging from low-exposure or consumption to high-exposure or consumption. This approach would help eliminate the impact of potential outliers in predictors and help with interpretations of the modeling results.
To form a longitudinal signature for each province, whenever there are sufficient longitudinal data, we built change-trajectories for a given marker using the TRAJ procedure developed for SAS by Jones and Nagin.12 This approach was practical especially for drinking water sources, namely, dam, spring, well, and river, categorizing provinces as low-, intermediate-, and high-consumption. We present an example of such trajectories in Figure 4.
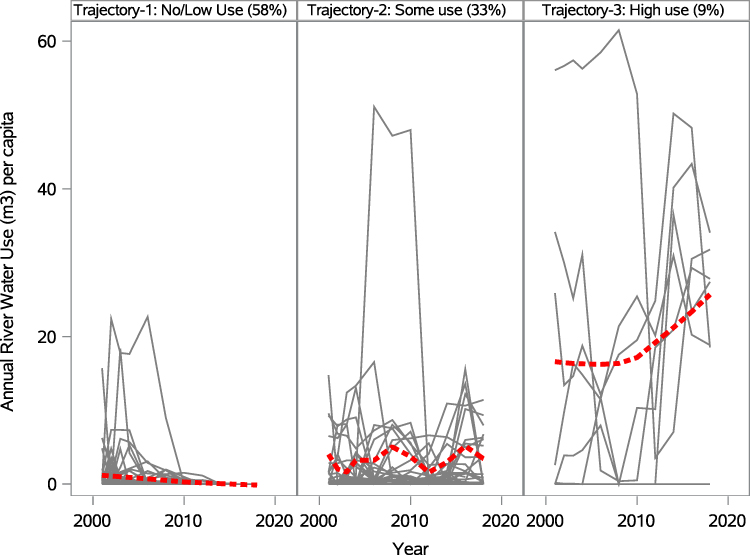 |
Figure 4 River-water consumption trajectories. |
Overall, 37 fruit and vegetable consumption markers including the total fruit and vegetable consumption, 9 air-quality markers including radon, sun radiation, electromagnetic field concentration, 10 meteorological markers including sunlight, and 4 drinking water source profiles. Due to the large number of predictors, we used the Benjamini-Hochberg False Discovery Rate (FDR) approach13 to control the false discovery rate within each phase of our model-building approach.
For model building, we first assessed the association of smoking, alcohol consumption, household expenditure on cigarette and alcohol, and elderly-age concentration with deaths due to COPD as control variables. Among these four control variables, household expenditure on cigarette and alcohol and elderly-age concentration remained significant in our initial models, where both of these control variables were positively associated with COPD deaths as expected. We then investigated the associations of the given predictors as continuous markers, as quartiles, as median-dichotomized, and change trajectories if available. Then, we formed a final model by including all markers significant at FDR = 0.10 and eliminating the insignificant markers in this final model using the stepwise backward elimination approach. In deciding which spatial model is better, we utilized Akaike Information Criterion.
Results
The intercept model for COPD deaths indicated that Spatial Moving Average (SMA) model provides the best fit addressing the spatial autocorrelation, followed by Spatial Auto-regressive and Moving Average (SARMA) model. In initial control models, expenditure of household income on cigarette and alcohol and elderly population proportion were positively associated with COPD deaths (Figure 5), where provinces with higher level of elderly population and provinces with higher household income spent on cigarette and alcohol reported higher number of COPD deaths. Controlling for these markers, average temperature, air pressure, NO2, and onion and carrot consumptions were significantly associated with COPD deaths with FDR-corrected p-values <0.1. Provinces with higher temperature and air pressure, or higher consumption of onion and carrot reported lower deaths due to COPD, and provinces with higher concentration of NO2 reported higher COPD deaths (Figure 5).
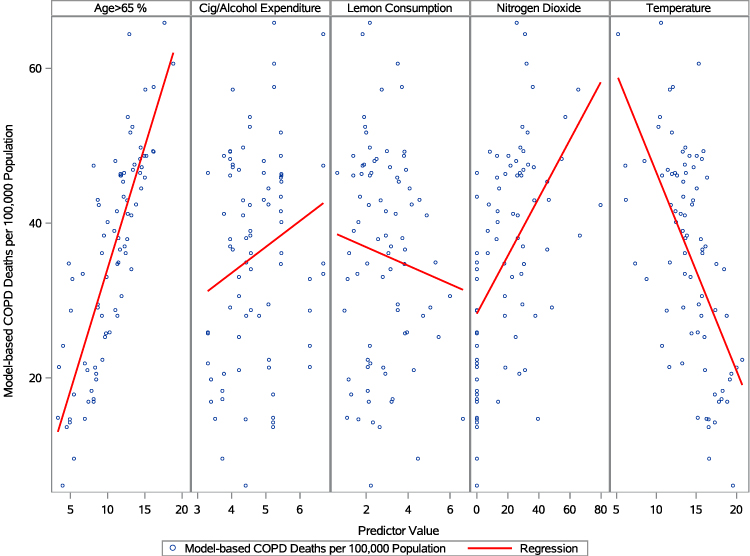 |
Figure 5 Model-Based COPD Deaths and Significant Markers in the final model. |
When quartile representations of all the markers were used, the above five markers kept their significance and new markers, namely, beets, total fruits, mango, pineapple, purslane, and mushroom consumptions were found to be significant as well. With median dichotomization, only temperature and air pressure were found to be significant after FDR correction and 0.1 false discovery rate. Finally, when change trajectories were utilized, carrot and lemon consumption trajectories were found to be significant as well controlling for expenditure of household income on cigarette and alcohol and elderly population proportion.
We reached a final model (Table S1) by using a stepwise backward elimination strategy in a multivariable spatial model where the control variables and the above-mentioned significant markers were used. The final model suggests that elderly age population, household expenditure on cigarette and alcohol, and NO2 are positively associated with COPD deaths and average temperature and lemon consumption trajectory are negatively associated with COPD deaths (Figure 5).
Discussions
In this study, we have investigated the association of fruit and vegetable consumption, air quality and meteorological markers, and drinking water sources with COPD deaths using spatial models in which spatial autocorrelation of the outcome variables and predictors can be accounted for. We have started the model building by assessing the existence of spatial autocorrelation in our dependent variable, COPD deaths, and chose which spatial model best fits the data. Our initial testing showed strong spatial autocorrelation among the provinces, which is visible in Figure 2 as patches of provinces clustered together. We then identified the significant variables from the pool of our predictors by also taking into account the multiple-testing issue through Benjamini-Hochberg False Discovery Rate (FDR)-corrected p-values for the model parameters. We then reached our final model by eliminating the insignificant predictors in the final multivariable spatial model. In our findings, we strived to stay away from any claim of causality and considered our findings as potential hypotheses to be investigated further in future prospective trials.
One of the main findings from our analyses is the negative association of temperature with COPD deaths controlling for the proportion of elderly population as well as household expenditure on cigarette and alcohol. McCormack et al14 suggested that more COPD deaths occur in colder seasons, perhaps due to the increased likelihood of seasonal infections, such as influenza, which is indirectly in line with our findings that provinces with higher average temperature annually reported lower level of COPD deaths. Tseng et al15 also showed that decreasing temperatures result in increases in the likelihood of COPD exacerbation.
The second most significant effect we found was air-pressure; however, due to the high-correlation of air-pressure with average temperature (rho = 0.75, p < 0.0001), this marker did not remain significant in the final model. Among the air-quality measures, only nitrogen-dioxide (NO2) was significantly positively associated with COPD deaths. Provinces with higher NO2 annually reported higher level of COPD deaths. Zhang et al16 showed in a similar spatial modeling framework that increased humidity increases the relative risk of hospitalization. Saki et al17 also showed increased COPD hospitalization due to an increased NO2 concentration.
From the continuous markers, onion and carrot consumptions were also found to be negatively associated with COPD deaths. When quartile representatives were used in significance assessment, in addition to the above-mentioned markers, beets, total fruits, mango, pineapple, purslane, and mushroom were also found to be negatively associated, suggesting that provinces with higher level consumptions of these food items reported lower number of COPD deaths. When the change profiles of food markers were used, lemon and carrot consumptions showed negative associations, suggesting that provinces with higher level consumptions of carrot and lemon reported lower number of COPD deaths. These findings are partly confirmatory to the review by Kaluza et al18 and Yin et al,19 which suggest the overall benefit of total fruit consumptions on COPD progression.
Our study has several weaknesses to mention. The most critical of them is that the COPD deaths were available for only two years, namely, 2018 and 2019, which limits any modeling option on the temporal dimension of the outcome variable. Therefore, we took the average of the two years to have a representative COPD burden on each state. Also, our data are at the provincial level, which limits our sample size to 81 as Turkey has 81 provinces. Due to this limitation, we were careful with building our multivariable models and did so in stages of variable selection from different data dimensions. The second missing piece of our data dimension is the water quality data. We have been working on extracting such data from the public reports of municipalities and through official data requests from the Ministry of Health of Turkey; however, our efforts so far did not produce sufficient data to be included in our analysis pool. Therefore, we at least wanted to include the drinking-water sources to lessen this gap. Our food consumption dimension of our data needs to be expanded to include other critical food items such as consumption of meat, poultry, and fish and their derivatives, as well as dairy products and flour-based products, such as bread, pastries, desserts, and so on. Not least, another missing or weak area of our data is the behavior dimension. Through our strive to obtain such data, we were barely able to obtain regional smoking and alcohol consumption markers and we recognize that, for better modeling, we need to obtain province-level protective and harmful behavior markers.
Beyond the risk factors we strived to obtain, there may be other risk factors and confounders such as there are still many confounders, such as socioeconomic status, access to medical resources, use of biofuels, home heating types, gas-stove use, and so on. Obtaining such granular data is admittedly not easy, and we will continue our efforts to bring in more diverse data for our ongoing investigations. Furthermore, ideally, these spatial models should include multiple geographies beyond the borders of a given country; however, such endeavors are future challenges we prepare ourselves to tackle in a research arena where obtaining such granular data remains a challenge even from a single county with a unified healthcare system like Turkey.
As we gain further experience on issues accessing such data limitations or lack thereof, we plan to communicate these observations to the governmental and non-governmental organizations so that they improve their digitalization efforts to address such issues. This collective effort would lead to more complete data capture and more timely evidence-based policies, which definitely include health promotion and disease prevention policies as well.
Conclusions
In this work, our spatial models suggest that provinces with higher temperature and higher consumption of lemon report lower number of COPD deaths, while provinces with higher elderly population size, higher household expenditure on cigarette and alcohol and higher level of NO2 concentration report higher COPD deaths. Therefore, provinces with such profiles need to develop health awareness strategies to encourage healthier diets, closer screening and follow-up of patients with COPD or individuals who are more prone to develop COPD.
Data Sharing Statement
As the death records and fruit and vegetable consumption data used in this report were granted access only to the corresponding author, we do not have permission to share these data components; however, we can share the air quality data upon request.
Ethics
This is not applicable as no human subject data has been used in this study; only province-level aggregate data has been used.
Acknowledgment
This study was partially funded by TUBITAK Directorate of Science Fellowships and Grant Programmes (BİDEB)-2232 International Fellowship for Outstanding Researchers. We also thank the Turkish Republic Ministry of Commerce and Turkish Statistical Institute for data sharing. The opinion raised in this article solely belongs to its authors and does not represent the position of TUBITAK, Turkish Republic Ministry of Commerce and Turkish Statistical Institute in any shape or form.
Author Contributions
All authors made a significant contribution to the work reported, whether that is in the conception, study design, execution, acquisition of data, analysis and interpretation, or in all these areas; took part in drafting, revising or critically reviewing the article; gave final approval of the version to be published; have agreed on the journal to which the article has been submitted; and agree to be accountable for all aspects of the work.
Funding
Partial financial support was received from TUBITAK Directorate of Science Fellowships and Grant Programmes (BIDEB)-2232 International Fellowship for Outstanding Researchers (Award No: 118C306).
Disclosure
The authors report no conflicts of interest in this work.
References
1. Pauwels RA, Buist AS, Calverley PMA, Jenkins CR, Hurd SS. Global strategy for the diagnosis, management, and prevention of chronic obstructive pulmonary disease: NHLBI and WHO Global Initiative for Chronic Obstructive Lung Disease (GOLD): executive summary. Respir Care. 2001;46:798–825.
2. Anon. BTS: BTS guidelines for the management of chronic obstructive pulmonary disease. The COPD Guidelines Group of the Standards of Care Committee of the BTS. Thorax. 1997;52:S1–28. doi:10.1136/thx.52.2008.S1.5
3. Hardin M, Silverman EK. Chronic Obstr Pulm Dis journal of the COPD: chronic Obstructive Pulmonary Disease Genetics: a Review of the Past and a Look Into the Future. Chronic Obstructive Pulmonary Diseases (Miami, Fla.). 2014;1(1):33–46. doi:10.15326/jcopdf.1.1.2014.0120
4. Mannino DM, Buist AS. Global burden of COPD: risk factors, prevalence, and future trends. Lancet. 2007;370(9589):765–773. doi:10.1016/S0140-6736(07)61380-4
5. Marsh S, Aldington S, Shirtcliffe P, Weatherall M, Beasley R. Smoking and COPD: what really are the risks? Eur Respir J. 2006;28(4):883–884. doi:10.1183/09031936.06.00074806
6. Forey BA, Thornton AJ, Lee PN. Systematic review with meta-analysis of the epidemiological evidence relating smoking to COPD, chronic bronchitis and emphysema. BMC Pulm Med. 2011;11(1):1–61. doi:10.1186/1471-2466-11-1
7. Araújo NP, de Matos NA, Oliveira M, et al. Quercetin Improves Pulmonary Function and Prevents Emphysema Caused by Exposure to Cigarette Smoke in Male Mice. Antioxidants. 2022;11(2):181. doi:10.3390/antiox11020181
8. Pezzuto A, Carico E. Effectiveness of smoking cessation in smokers with COPD and nocturnal oxygen desaturation: functional analysis. Clin Respir J. 2020;14(1):29–34. doi:10.1111/crj.13096
9. Greene CC, Bradley KA, Bryson CL, et al. The association between alcohol consumption and risk of COPD exacerbation in a veteran population. Chest. 2008;134(4):761–767. doi:10.1378/chest.07-3081
10. Ito K, Barnes PJ. COPD as a disease of accelerated lung aging. Chest. 2009;135(1):173–180. doi:10.1378/chest.08-1419
11. Moran PA. Notes on continuous stochastic phenomena. Biometrika. 1950;37:
12. Jones BL, Nagin DS. Proc TRAJ: a SAS Procedure for Group-Based Modeling of Longitudinal Data. Annual Meeting Home. 2007;1:585.
13. Benjamini Y, Hochberg Y. Controlling the false discovery rate: a practical and powerful approach to multiple testing. J Royal Statistical Soc. 1995;57(1):289–300.
14. McCormack MC, Paulin LM, Gummerson CE, Peng RD, Diette GB, Hansel NN. Colder temperature is associated with increased COPD morbidity. Eur Respir J. 2017;49(6):87. doi:10.1183/13993003.01501-2016
15. Tseng CM, Chen YT, Ou SM, et al. The effect of cold temperature on increased exacerbation of chronic obstructive pulmonary disease: a nationwide study. PLoS One. 2013;8(3):e57066. doi:10.1371/journal.pone.0057066
16. Zhang Z, Wang J, Lu W. Exposure to nitrogen dioxide and chronic obstructive pulmonary disease (COPD) in adults: a systematic review and meta-analysis. Environ Sci Pollution Res. 2018;25(15):15133–15145. doi:10.1007/s11356-018-1629-7
17. Saki H, Goudarzi G, Jalali S, et al. Study of relationship between nitrogen dioxide and chronic obstructive pulmonary disease in Bushehr, Iran. Clin Epidemiol Global Health. 2020;8(2):446–449. doi:10.1016/j.cegh.2019.10.006
18. Kaluza J, Larsson SC, Orsini N, Linden A, Wolk A. Fruit and vegetable consumption and risk of COPD: a prospective cohort study of men. Thorax. 2017;72(6):500–509. doi:10.1136/thoraxjnl-2015-207851
19. Yin P, Jiang Y, Zhang M, Li YC, Wang LM, Zhao WH. Association between frequency of fruit and vegetable intake and chronic obstructive pulmonary disease. Chin J Preventive Med. 2011;45(8):707–710.
 © 2022 The Author(s). This work is published and licensed by Dove Medical Press Limited. The
full terms of this license are available at https://www.dovepress.com/terms
and incorporate the Creative Commons Attribution
- Non Commercial (unported, 3.0) License.
By accessing the work you hereby accept the Terms. Non-commercial uses of the work are permitted
without any further permission from Dove Medical Press Limited, provided the work is properly
attributed. For permission for commercial use of this work, please see paragraphs 4.2 and 5 of our Terms.
© 2022 The Author(s). This work is published and licensed by Dove Medical Press Limited. The
full terms of this license are available at https://www.dovepress.com/terms
and incorporate the Creative Commons Attribution
- Non Commercial (unported, 3.0) License.
By accessing the work you hereby accept the Terms. Non-commercial uses of the work are permitted
without any further permission from Dove Medical Press Limited, provided the work is properly
attributed. For permission for commercial use of this work, please see paragraphs 4.2 and 5 of our Terms.