Back to Journals » International Journal of Nanomedicine » Volume 18
Sonosensitizer Nanoplatforms Augmented Sonodynamic Therapy-Sensitizing Shikonin-Induced Necroptosis Against Hepatocellular Carcinoma
Authors Tian H, Shang H, Chen Y, Wu B ![]() , Wang C
, Wang C ![]() , Wang X
, Wang X ![]() , Cheng W
, Cheng W ![]()
Received 12 August 2023
Accepted for publication 16 November 2023
Published 28 November 2023 Volume 2023:18 Pages 7079—7092
DOI https://doi.org/10.2147/IJN.S435104
Checked for plagiarism Yes
Review by Single anonymous peer review
Peer reviewer comments 2
Editor who approved publication: Dr Yan Shen
Huimin Tian, Haitao Shang, Yichi Chen, Bolin Wu, Chunyue Wang, Xiaodong Wang, Wen Cheng
Department of Ultrasound, Harbin Medical University Cancer Hospital, Harbin, People’s Republic of China
Correspondence: Wen Cheng, Department of Ultrasound, Harbin Medical University Cancer Hospital, No. 150, Haping Road, Nangang District, Harbin, Heilongjiang Province, 150081, People’s Republic of China, Tel +86 13313677182, Fax +86 451 85718392, Email [email protected]
Background: Apoptosis resistance of hepatocellular carcinoma (HCC) often leads to treatment failure. Nonetheless, overcoming the resistance of HCC to apoptosis by inducing necroptosis of tumor cells to bypass the apoptotic pathway may be a promising treatment strategy. Sonodynamic therapy (SDT) has broad prospects in disease treatment because of its noninvasive characteristic and spatiotemporal control. The combination of SDT and shikonin in the treatment of HCC is expected to be a new tumor treatment method that can overcome apoptosis resistance.
Methods: In this study, the antitumor effect was evaluated using normal liver cell line WRL68, HCC cell line HepG2 and HepG2 xenograft mouse models. Indocyanine green (ICG) was loaded on nanobubbles (NBs) to construct ICG-loaded nanobubbles (ICG-NBs). Combined sonosensitizer nanoplatforms with ultrasound (US) to achieve efficient SDT, the combination of SDT and shikonin in treating HCC can activate shikonin-induced necroptosis. As a result, tumor cells that produced apoptosis resistance were destroyed by necroptosis.
Results: The results indicated a successful preparation of ICG-NBs with a uniform particle size of 273.0 ± 118.9 nm spherical structures. ICG-NB-mediated SDT, in combination with shikonin treatment, inhibited the viability, invasion, and migration of tumor cells. SDT + shikonin treatment group caused a substantial increase in necroptotic cells. The increased degree of tumor necrosis and the upregulated expression of receptor-interacting protein 3 kinase were observed in vivo studies, which indicated that the antitumor effect was accompanied by enhanced necroptosis in the SDT + shikonin treatment group.
Conclusion: ICG-NB-mediated SDT combined with shikonin inhibits the growth of HCC by increasing the necroptosis of tumor cells. Therefore, this combination therapy is a promising treatment strategy against the specific cancer.
Keywords: sonodynamic therapy, hepatocellular carcinoma, necroptosis, shikonin, sonosensitizer
Introduction
Primary liver cancer ranks third in tumor incidence.1,2 Due to the lack of specific clinical manifestations, primary liver cancer is already at the advanced stage at the time of diagnosis, resulting in poor prognosis of the disease.3,4 Hepatocellular carcinoma (HCC) is the main etiologic type of primary liver carcinoma.5,6 The current clinical targeted therapeutics for advanced HCC, such as sorafenib, face drug resistance after several months of treatment, which reduces the therapeutic efficacy.7,8 Thus, it is urgent to explore ways to improve drug resistance and the therapeutic effect of liver cancer, which is an essential research direction for HCC treatment.
Bcl-2 and Bcl-XL mediated tumor cell apoptosis resistance is the cause of treatment failure in primary liver cancer.9,10 The necroptotic signaling pathway can eliminate apoptosis-resistant tumor cells by inducing cell death without the apoptotic pathway.11 Necroptosis can overcome Bcl-2 and Bcl-XL-mediated apoptosis resistance, which may become a new way to improve tumor resistance.12 Necroptosis, a novel mode of cell death distinct from necrosis and apoptosis, was first proposed in 2005, with morphological features of necrotic cells.13–15 Moreover, necroptosis is regulated by receptor-interacting protein 1 kinase (RIPK1) and RIPK3-mediated signaling pathways and hence, has been considered a target for tumor therapy.16–20 Therefore, inducing necroptosis of tumor cells is an effective treatment to solve the resistance of tumor cells to apoptosis.
Shikonin is a small molecular naphthoquinone compound extracted from the Chinese herbal medicine Lithospermum, which exerts an antitumor effect.21–23 In addition to the traditional mechanism of apoptosis, shikonin induces necroptosis of tumor cells under inhibited apoptosis,24–26 thus overcoming the issue of tumor resistance caused by anticancer drugs through P-glycoprotein, Bcl-2, and Bcl-XL. Moreover, shikonin has an efficient antitumor effect and can be combined with other tumor treatments to overcome drug resistance caused by traditional treatment methods.
Noninvasive treatments, such as photodynamic therapy, have been applied in the clinical field with satisfactory therapeutic effects.27 However, deep tumors cannot be eliminated due to insufficient penetration of light.28 Although derived from photodynamic therapy, SDT is based on ultrasound (US) and sonosensitizer; it also has deep tissue penetration and low systemic toxicity, making it an ideal alternative approach.29–34 SDT exerts antitumor effects mainly through US cavitation, the chemical effects of singlet oxygen and hydroxyl radicals, and the chemical effects of sonosensitizers.35,36 Since tumor cells resist apoptosis, SDT has a limited impact on tumor treatment. Therefore, it can be combined with other non-apoptotic tumor treatment methods to open a novel avenue of tumor treatment.37,38 Indocyanine green (ICG) is a synthetic, infrared-sensitive, fluorescent dye with low toxicity, no participation in biotransformation in vivo, and rapid excretion. It is the only dye reagent approved by the United States Food and Drug Administration for humans due to its high safety, and can also be used for multimodal imaging.39,40 ICG can be activated by US to produce abundant reactive oxygen species (ROS) that are excellent sonosensitizers.41 However, the utilization of ICG is restricted by its aggregation and rapid clearance in vivo.42,43 Therefore, loading ICG with nanobubbles (NBs) would improve these limitations. Also, US-mediated cavitation can enhance the production of ROS.
In this study, ICG-loaded nanobubbles (ICG-NBs) were constructed and combined with US to achieve efficient SDT. Subsequently, SDT combined with shikonin therapy triggered increased necroptosis, improved the drug resistance caused by tumor cell apoptosis resistance, and significantly improved the antitumor effects in vivo and in vitro, thereby SDT combined with shikonin providing a new therapeutic approach for treating primary HCC (Scheme 1).
 |
Scheme 1 Schematic illustration of the preparation of ICG-NBs and ICG-NBs mediated sonodynamic therapy (SDT) sensitizing necroptosis against hepatocellular carcinoma. |
Materials and Methods
Chemicals and Reagents
Avanti Polar Lipids (Alabaster, AL, USA) supplied DSPC and DSPE-PEG-2000. DCFH-DA, JC-1, and Annexin V-FITC Apoptosis Detection Kit were obtained from Beyotime Biotechnology (Shanghai, China). Hoechst 33,342/PI was purchased from Solarbio Technology (Beijing, China). ICG was obtained from Shanghai Yuanye Bio-technology (Shanghai, China). Shikonin and necrostatin-1 (Nec-1) were procured from MCE Chemicals Technology (Shanghai, China). The Cell Counting Kit-8 (CCK-8) was obtained from Sevenbio (Beijing, China).
Fabrication of ICG-NBs
The weight proportion of 1.2-distearoyl-sn-glycero-3-phosphocholine (DSPC) and 1.2-distearoyl-sn-glycero-3-phosphoethanolamine (DSPE-PEG-2000) was 9:1. The lipid powder was dissolved in dichloromethane and methanol at a volume ratio of 2:1 in a 50 °C water bath. After dissolution, the organic solvent was evaporated to form a phospholipid film. The phospholipid membranes were solubilized in a PBS solution containing 50 μg/mL ICG. The mixture was filtered through a micro-extruder 200 nm filter membrane (Avanti Polar Lipids). The filtrate was vacuum-sealed in a bottle filled with perfluoropropane (C3F8) and placed in a dental amalgamator (YJT Medical Apparatus and Instruments, Shanghai, China) for thorough mixing to produce ICG-NBs (Figure 1A). The whole process was carried out in the dark.
 |
Figure 1 Characterization of ICG-NBs. (A) The microstructure diagram of ICG-NBs. (B) Transmission electron microscopy image of ICG-NBs. (C) Transmission electron microscopy image of ICG-NBs after storage for 48 h at 37°C. (D) Zeta potential of ICG-NBs and NBs. (E) The dynamic light scattering analyzer results showed the particle size of ICG-NBs. (F) Ultraviolet absorption spectrum results showed the absorbance spectra of ICG, NBs, and ICG-NBs. |
Characterization
The morphology and distribution of ICG-NBs were observed under a transmission electron microscope (TEM, Hitachi, Japan). The absorption spectra of ICG, NBs, and ICG-NBs were measured using a UV-vis-NIR spectrophotometer (Agilent Technology, California, USA). Dynamic light scattering analyzer (DLS, Malvern Zetasizer Nano ZS90, UK) was used to determine the size of particles and the zeta potential of ICG-NBs. At the same time, DLS was used to evaluate the stability of ICG-NBs after 48 h in PBS and DMEM containing 10% fetal bovine serum (FBS). In order to examine the durability of ICG-NBs, TEM was used to observe any significant change in the particle size after 48 h of storage at 37 °C. ICG in vitro release experiment was carried out at 37°C. The experimental group used US (3.0 W/cm2, 60s) to irradiate the PBS solution of ICG-NBs, and the negative control (NC) group did not use US irradiation. Then, the solution at different time points (0, 0.5, 1, 2, 3, 4, 8, 16, and 24 h) was centrifuged at 8000 rpm/min. The amount of ICG in the supernatant was detected by UV-vis-NIR spectrophotometer, and the percentage of ICG release was calculated.
HepG2 Cell Culture
The human HCC cell line HepG2 and normal human liver cell line WRL68 were utilized in this study, as approved by the Ethics Committee of Harbin Medical University. All the cells were purchased from the Cell Bank of Chinese Academy of Sciences (Shanghai, China). The cells were grown in Dulbecco’s modified Eagle medium (DMEM, Gibco, Invitrogen, USA) with 10% FBS in a 37 °C CO2 incubator. Cell passage was performed every other day.
Cell Viability
The cells were seeded in 96-well plates at a density of 1×10⁴ and grown overnight to ensure adhesion. After treatment with shikonin (0.5, 1, 2, 5, 7.5, and 10 μM) for approximately 24 h, the cell viability was assessed by CCK-8 assay. Then, the cells were treated (6, 12, 24, 36, and 48 h) with 50 μM Nec-1 and assayed for cell viability. The WRL68 cell line was treated with different concentrations of ICG (25, 50, 75, 100, 125, and 150 μg/mL), and the cell viability was detected by CCK-8 assay. Under similar experimental conditions, different concentrations of ICG and ICG-NBs (25, 50, 75, 100, 125, and 150 μg/mL) were applied for 4 h post or no to the US for 60s (3.0 W/cm2). The percentage of cell survival was determined after ICG and ICG-NBs combined with US treatment and ICG treatment alone. The maximum half inhibitory concentration (IC50) of ICG-NBs combined with US and shikonin was calculated. Finally, the cell survival rate at a specific concentration was determined after combining the two treatment methods using CCK-8 assay. The absorbance value was measured on a microplate reader (Promega Corp, Madison, WI, USA), and the relative cell viability was calculated.
ROS Detection
The cells were seeded in 6-well plates (2 × 10⁵ cells/well), and the medium was removed after 24-h incubation, and DMEM, ICG-NBs, shikonin, and ICG-NBs+shikonin were added, respectively. ICG-NB and ICG-NBs+shikonin groups were subjected to US treatment for SDT. Then, the medium of each group was replaced with DCFH-DA and incubated for 20 min in the dark. Subsequently, the plates were rinsed with DMEM, and the fluorescence was examined under a fluorescence microscope (LX71, Olympus, Tokyo, Japan), and the levels were measured using ImageJ software (National Institutes of Health, Bethesda, MD, USA).
Changes in Mitochondrial Membrane Potential (MMP)
After various treatments, HepG2 cells were incubated for 20 min in JC-1 reagent before washing and resuspension in chilled phosphate-buffered saline (PBS). The red and green fluorescence inside the cells was observed by fluorescence microscopy and analyzed by ImageJ software.
Transwell Assay
The cells treated with DMEM, SDT, shikonin, and SDT+shikonin were seeded in a transwell chamber (Costar, USA) with 8.0 μm pores, and the chamber was placed in a 24-well plate. 5×10⁴ cells were inoculated in the top chamber in 100 μL of FBS-free DMEM, while 800 μL of DMEM containing 10% FBS was loaded into the bottom chamber to assess the migration capacity of the cells. The top chamber was precoated with the Matrigel matrix. A similar protocol was applied to detect cell invasion. After 24-h incubation, the cells in the bottom chamber were fixed with 4% paraformaldehyde, stained with 0.1% crystal violet, and counted in three fields per well.
Hoechst 33,342 and Propidium Iodide (PI) Staining
The cells were seeded, cultured overnight, and treated in different groups, as described above. Then, 5 μL of Hoechst 33,342 and 5 μL of PI were incubated with the cells at 4 °C in the dark for 20 min. The intracellular fluorescence was determined using a fluorescence microscope, and at least three random fields were examined for each sample.
Assessment of Cell Death by Flow Cytometry
The six groups of HepG2 cells inoculated in 6-well plates were as follows: NC, SDT, shikonin, SDT combined with shikonin, Nec-1+shikonin, and Nec-1+SDT+shikonin. Groups 1–4 were treated as described above, while Groups 5 and 6 were pretreated with 50 μM Nec-1 before treating the cells with shikonin and SDT+shikonin. Then, the cells were washed twice with PBS, and 1×10⁴ cells were resuspended in 195 μL binding fluid. Subsequently, the cells were stained with PI and Annexin V-FITC in the dark for 15 min. After adding 400 μL of the binding buffer to each tube, apoptotic and necrotic cells were quantified on a flow cytometer (BD Biosciences, Franklin Lakes, NJ, USA). Following the manufacturing guidelines, Annexin V-FITC+, PI- indicates apoptotic cells, while Annexin V-FITC+, PI+ indicates necrotic cells. The percentage of cells in each quadrant was calculated using FlowJo software version 10.6.2.
Establishment of HCC Mouse Model and Treatment Methods
Female Balb/c mice without thymus were obtained from Vital River Laboratory Animal Technology (Beijing, China) for in vivo studies. The animals were maintained in a pathogen-free environment, with a 12-h light/dark cycle, and acclimatized to their surroundings for 3 days. Then, HepG2 cells (3 × 10⁶ cells/each) were injected subcutaneously. When the tumors developed to 100–150 mm3, the mice were divided into NC and experimental groups for the treatments.
The biodistribution of ICG-NBs was studied by fluorescence imaging in vitro and in vivo. ICG-NBs were injected into HepG2 tumor-bearing mice via the tail vein at an experimental concentration (ICG concentration was 1 mg/kg). At different times after intravenous injection (2, 4, 8, 12, and 24 h), the fluorescence intensity was recorded using a small animal in vivo imager. The excitation wavelength is 705–780 nm, and the emission wavelength is 810–885 nm. The mice were euthanized 24 h after the injection of the ICG-NBs, and the tumors, lungs, heart, liver, spleen, and kidneys of the mice were collected for imaging to detect in vitro fluorescence signals. The experiment has been repeated three times, and Bruker MI SE software was used to analyze the data.
The mice in each group were injected 50 μL ICG-NBs and shikonin mixture via tail vein injection for 14 days; PBS was administered to the NC group. The drugs were administered once in 2 days, while the weight of each mouse was measured on an electronic balance to assess the biosafety of the drug. The tumor size was estimated every 2 days using Vernier calipers and at the end of the experiment on day 14. Then, the tumors and vital organs were fixed in 4% paraformaldehyde, paraffin-embedded, and sectioned into 3–5-μm-thick slices. Hematoxylin/eosin (HE) staining was used to determine the extent of necrosis within the tumors and the presence or absence of damage to relevant internal organs (heart, lung, liver, kidney, and spleen). RIPK3 expression was detected in tumor samples by immunohistochemical staining using specific antibodies. Five different view areas were observed under a microscope at 200× to capture the images.
Statistical Analysis
All data were replicated three times, and the results were presented as the mean ± standard deviation (SD). Comparative analysis and data from each group were plotted using GraphPad Prism 9.0. The statistical differences among the groups were examined using one-way analysis of variance (ANOVA). p < 0.05 indicated a significant difference between the control and sample values.
Results
Fabrication and Characterization of ICG-NBs
ICG-NBs revealed uniform circular formations under TEM (Figure 1B). Also, the stability of ICG-NBs was assessed to determine any significant change in the particle size after storage at 37 °C for 48 h (Figure 1C). The results showed that the p-value of particle size change after 48 h was 0.0847, indicating the stability of ICG-NBs. The zeta potential of the ICG-NB surface was −1.089 ± 0.067 mV, which was lower than that of NBs (−0.654 ± 0.256 mV) (Figure 1D). Consistent with TEM measurements, the size of ICG-NB particles tested by DLS was 273.0 ± 118.9 nm (Figure 1E). DLS measured the particle size of ICG-NBs in PBS solution to be 277.2 ± 135.4 nm after 48 h. The p-value of the particle size difference compared with that before placement was 0.677 (Figure S1A). The particle size was 280.3 ± 141.8 nm after 48 h in DMEM containing 10% FBS, compared with the particle size before placement and the p-value was 0.548 (Figure S1B). The p-values after placement were not statistically significant, further indicating that ICG-NBs had good biostability.
ICG-NBs showed an absorption peak at about 780 nm on the UV-vis-NIR spectrophotometer, consistent with the ICG measurement results; at the same time, there is no absorption peak of NBs at 780 nm (Figure 1F), indicating that ICG was successfully encapsulated into NBs. In the in vitro release experiment of ICG, it was observed that the release of ICG was about 67.0 ± 1.8% within 4 h after US irradiation at 37 °C, which was significantly higher than that of the NC group (9.2 ± 1.7%), indicating that the US could effectively control the release of ICG (Figure S1C). The lower ICG release in the NC group suggested that the PBS solution of ICG-NBs had higher biosafety.
Cell Cytotoxicity Assay of ICG and Shikonin
The cytotoxicity of ICG and ICG-NBs combined with US and ICG alone was compared using the CCK-8 assay. As shown in Figure 2A, ICG alone did not affect the survival rate of HepG2 cells. Meanwhile, ICG alone did not affect the survival rate of normal liver cell line WRL68 cells. It shows that ICG has high security (Figure S2). After ICG and ICG-NBs were combined with the US, the cell viability was observed to be 69.4 ± 4.9% and 62.8 ± 2.4%, respectively, when the ICG concentration was 25 μg/mL. Therefore, under the action of the US, ICG-NBs have more potent cytotoxicity than ICG (p < 0.001). The IC50 of ICG-NBs combined with the US was 57.77 μg/mL, so 50 μg/mL was selected as the concentration of ICG-NBs in SDT treatment (Figure 2B).
 |
Figure 2 Cytotoxic effect of shikonin and SDT in HepG2 cells. (A) HepG2 cells were treated with ICG, ICG+US, and ICG-NBs+US for 24 h, and cell viability was analyzed by CCK-8 assay. (B) The dose-effect curves of HepG2 cells to ICG-NBs+US. (C) Drug sensitivity of HepG2 cells to shikonin and SDT+shikonin. (D) The dose-effect curves of HepG2 cells to shikonin. *p < 0.05, **p < 0.01, ***p < 0.001, ****p < 0.0001. |
Similarly, the influence of different concentrations of shikonin and shikonin combined with SDT on cell viability was evaluated by CCK-8 assay. The findings demonstrated that the cytotoxicity of shikonin on cells was concentration-dependent (Figure 2C) with an IC50 value of 3.011 μM (Figure 2D). There was no significant difference in cell viability between the shikonin + US treatment group and the simple shikonin treatment group (p > 0.05). The combination of shikonin was combined with SDT, the cell survival rate decreased significantly, and compared to the shikonin group, the difference was statistically significant (p < 0.05).
Hoechst 33,342 and PI Double-Staining
The cell membrane’s structural integrity and the nucleus morphology were assessed by Hoechst 33,342/PI double-staining, and the morphological features were associated with the mode of tumor cell death. Hoechst 33,342 is a blue fluorescence dye that penetrates intact cell membranes and stains DNA, while PI does not penetrate the intact cell membranes; hence, red fluorescence was detected only in necrotic cells. The cells in the SDT or NC group showed no red fluorescence-producing cells, indicating that no cells underwent necrosis in these two groups (Figure 3A). In the shikonin and combined treatment groups, the cells showed standard nuclear size and dark blue and dark red fluorescence, indicating necrosis. Next, quantitative analysis was performed according to the number of cells producing red fluorescence in the field of view. The results showed that shikonin treatment effectuates necrotic cell death morphology in tumor cells. Combination therapy further raised the number of HepG2 cells exhibiting necrotic cell death morphology. The difference in the number of cells that lost their intact cell membrane structure differed significantly between the shikonin-treated and combination-treated groups (p < 0.0001) (Figure 3B).
 |
Figure 3 SDT enhanced shikonin-induced necroptosis in HepG2 cells. (A) Hoechst 33,342/PI double-staining was performed in HepG2 cells to observe the number of PI-permeable cells in each group (scale bar: 50 μm). (B) The number of necrotic cells in different treatment groups. (C) Flow cytometry combined with Annexin V/PI double-staining showed that incubated with shikonin or SDT+shikonin resulted in obvious necroptosis in HepG2 cells. (D) Effects of Nec-1 on HepG2 cell activity. (E) Statistical results from experiments of cell necroptosis in HepG2 cells. ****p < 0.0001. |
Flow Cytometry Detection of Necroptosis
The pattern of HepG2 cell death caused by the combination treatment was investigated using flow cytometry. The results are shown in Figure 3C. Approximately 92.8 ± 1.30% of the NC group (Annexin V-/PI-) comprised normal cells. On the other hand, the percentage of cells in the Q2 region between the SDT-treated and the control groups did not differ significantly, suggesting that SDT had little or no effect on tumor cell necrosis. In the shikonin therapy group, the proportion of necrotic cells within the Q2 area was 32.5 ± 2.03%, while that in the combination treatment group was 43.1 ± 1.33%. To further elucidate the death pathway, each of these two groups was treated with Nec-1. The impact of Nec-1 on cell viability was investigated using the CCK-8 test; the findings did not reveal any significant difference between the Nec-1 and control groups (Figure 3D). Next, after pretreatment with Nec-1, necrotic cells in the Q2 area were decreased to 3.9 ± 0.6% in the shikonin-treated group, which did not differ substantially from the control group (Figure 3E), suggesting that shikonin induces necroptosis in HepG2 cells. In the combined treatment group, Q2 necrotic cell number was decreased to 4.0 ± 0.32% after pretreatment with Nec-1, which was similar to the control group, indicating that the combined treatment group induced the necroptotic pathway. Taken together, the number of cells undergoing necroptosis was considerably elevated in the combination treatment group compared to the shikonin treatment group (p < 0.05).
Detection of Intracellular ROS
As shown in Figure 4A, the green fluorescence of the NC group was weak. Treatment with SDT and shikonin alone produced a strong green fluorescence compared to the NC group, and SDT or shikonin alone groups could have trace amounts of ROS. In contrast, the green fluorescence rose significantly in the SDT+shikonin group compared to the remaining groups, confirming that the SDT+shikonin treatment group had a strong ROS generation ability. The fluorescence intensity of different groups is shown in Figure 4B. Compared to the NC group, the fluorescence level differed significantly in each group; also, the variation in fluorescence intensity of the SDT+shikonin group was significantly different compared to the other groups (p < 0.05).
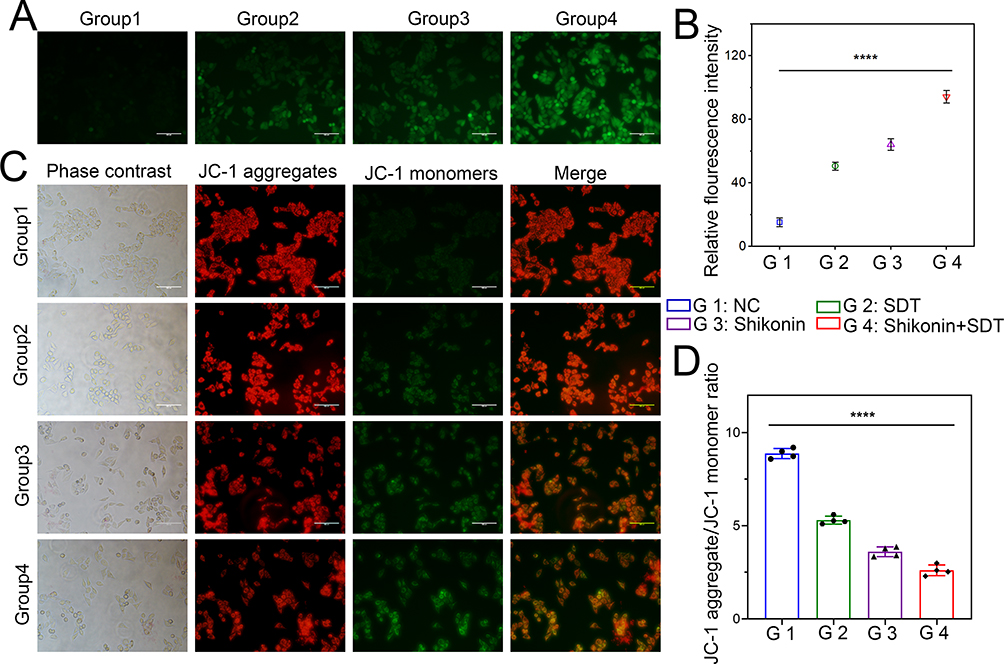 |
Figure 4 Detection of intracellular ROS generation and MMP changes. (A) Fluorescence imaging of HepG2 cells stained by DCFH-DA (scale bar: 50 μm). (B) The quantification of fluorescence intensity in different groups. (C) Fluorescence microscopic imaging of HepG2 cells stained by JC-1 (scale bar: 50 μm). (D) The aggregate/monomer fluorescence intensity ratio of JC-1 in HepG2 cells. ****p < 0.0001. |
MMP Changes Affect Cell Death
The results of fluorescence microscopy are presented in Figure 4C. The cells in the NC group had an intense red and light green fluorescence, suggesting that JC-1 aggregates in the mitochondrial matrix, with high levels of MMP. The combined treatment group showed weak red and robust green fluorescence, suggesting that in the combination treatment group JC-1 monomers are formed but no not aggregate in the mitochondrial matrix. The cellular MMP declined significantly and produced strong green fluorescence. The depolarization of the MMP was measured based on the ratio of red to green fluorescence produced by the cell. As shown in Figure 4D, after SDT+shikonin combined treatment, the proportion of JC-1 aggregates/monomers was significantly decreased compared to other groups (p < 0.0001), suggesting that a decrease in MMP is linked to cell death due to the combination treatment.
Inhibition of HepG2 Cell Migration and Invasion Ability
Transwell assay was used to evaluate the effect of combination therapy on the invasive and metastatic capacity of HCC by detecting the changes in the invasion and migration abilities of HepG2 cells after treatment for transwell assay. As shown in Figure 5A and B, the number of cells undergoing invasion and migration was considerably lower in the group receiving combination therapy compared to the other groups (p < 0.001). The findings showed that the combination treatment suppressed the invasion and migration abilities of tumor cells.
 |
Figure 5 Detection of HepG2 cells migration and invasion ability changes after different treatments (scale bar: 100 μm). (A) Representative images of HepG2 cells with migration and invasion ability after different treatments. (B) Quantitative analysis of cells with invasive and migration capacity at the bottom of the upper chamber. **p < 0.01, ***p < 0.001, ****p < 0.0001. |
Evaluation of Anticancer Effect of SDT Combined with Shikonin in vivo
In vivo, fluorescence imaging was used to analyze the distribution of ICG-NBs in the mouse model, and images were taken at different times after drug injection. The fluorescence signal gathered at the tumor site after ICG-NBs injection, and a certain fluorescence intensity could still be detected at the tumor site after 24 h (Figure S3A). It shows that the ICG-NBs can be well gathered in the tumor location. After 24 h, the main organs and tumors of mice were separated for in vitro fluorescence imaging. The results showed that ICG-NBs had higher fluorescence intensity in the tumor site than in other vital organs (Figure S3B).
As demonstrated in Figure 6A, the tumor volume in the SDT combined with the shikonin group was significantly smaller than that in either the control, shikonin, or SDT alone treatment groups on day 14 (p < 0.05). Moreover, tumor weight was significantly reduced in the SDT combined with the shikonin treatment group compared to other groups on day 14 (Figure 6B). The vital organs, such as the heart, lung, liver, kidney, and spleen, were sliced and stained with HE. The outcomes revealed that after 14 days of SDT combined with shikonin treatment, the pathological changes in the main organs could be ignored, indicating that the approach was safe (Figure 6C). Therefore, SDT combined with shikonin had a favorable effect against HCC in vivo, while weight measurements did not show any marked differences in mice from different treatment groups, indicating that the treatment did not generate any side effects (Figure 6D).
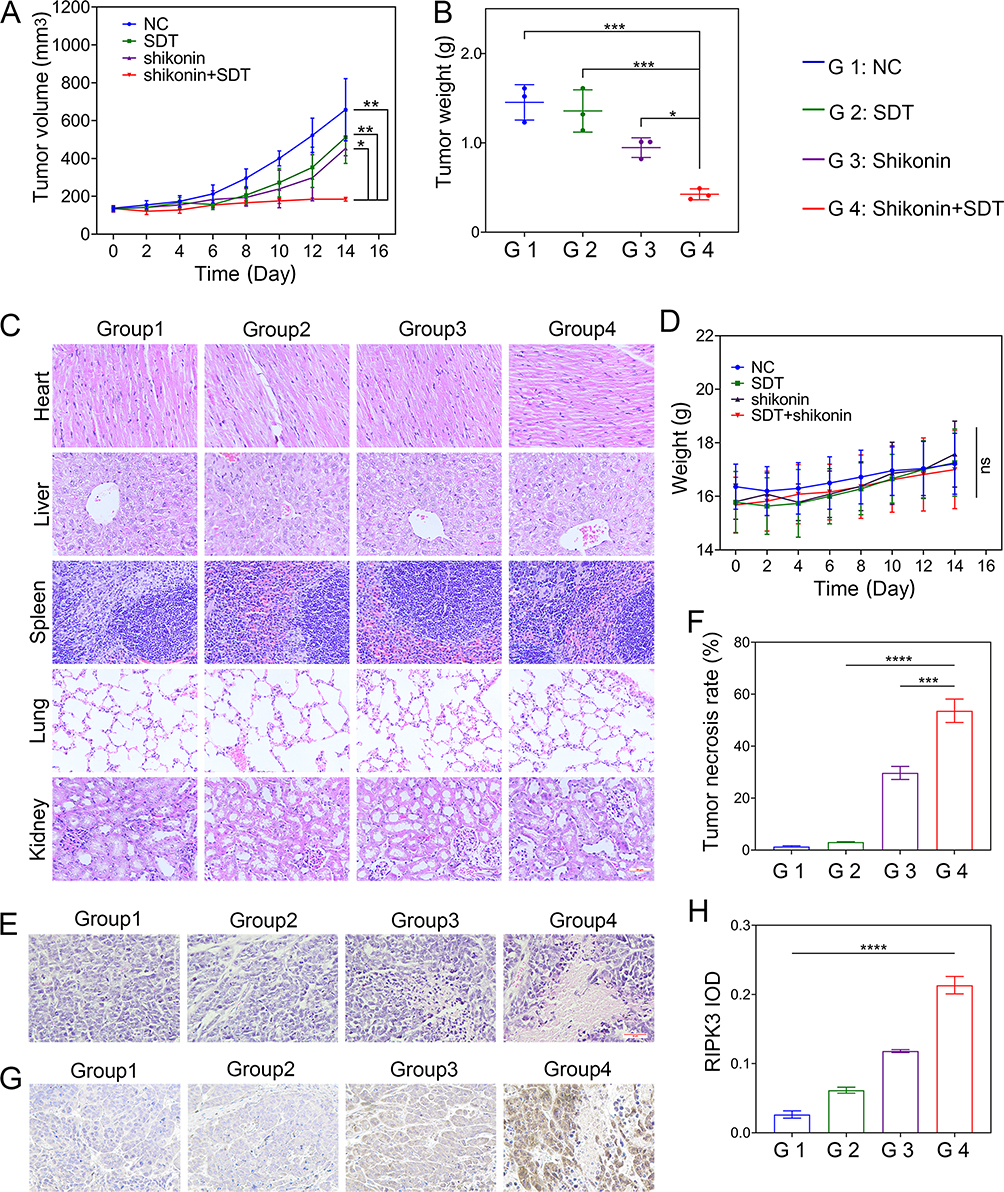 |
Figure 6 SDT+shikonin inhibits the growth of HepG2 cells in vivo. (A) The curve of tumor volume over time. (B) Quantification of the mean weight of tumors. (C) HE staining of major organ slides of the mice at 14 days (scale bar: 50 μm). (D) Body weight of mice as a function of time. (E) Images of HE-stained tumor tissue sections (scale bar: 50 μm). (F) Quantitative statistics of tumor necrosis percentage in different treatment groups. (G) Immunohistochemical analysis of RIPK3 expression in tumor tissues (scale bar: 50 μm). (H) The statistical results of the IOD/Area of RIPK3. *p < 0.05, **p < 0.01, ***p < 0.001, ****p < 0.0001. |
HE staining results of the tumor tissue sections showed that the degree of tumor cell necrosis was more prominent in the SDT combined with the shikonin treatment group than in other groups (Figure 6E and F). Furthermore, necroptosis is usually accompanied by upregulated RIPK3 expression. Immunohistochemical staining with RIPK3-specific antibodies showed that a large number of tumor cells displayed brown cytoplasm in the SDT+shikonin treatment group compared to other groups, indicating an upregulated expression of RIPK3 in the SDT+shikonin group (Figure 6G and H). These results indicated that shikonin can induce necroptosis, which is increased further in combination with SDT, indicating that SDT sensitizes shikonin-induced necroptosis.
Discussion
Accumulating evidence demonstrates that HCC, with a low cure rate and poor prognosis, is the primary cause of cancer-related deaths globally.44,45 Thus, practical strategies for the treatment of HCC are an urgent requirement.44 Although it is noninvasive and safe, SDT alone is not ideal and must be used in conjunction with other treatment approaches to enhance the tumor-killing effect.46,47 Necroptosis is a programmed cell necrosis.48 Herein, we used shikonin to induce necroptosis, kill apoptotic-resistant tumor cells, and avoid multidrug resistance.
ICG can generate abundant ROS under US treatment and has a high safety profile; thus, it has been selected as the sonosensitizer. In the present study, the hydrophilic heads of phospholipid NBs were loaded with ICG to prepare ICG-NBs with improved biocompatibility and bioavailability. ICG-NBs enable the targeted release of the sonosensitive drug ICG from NBs post-US. The US can cause cavity oscillation inside the ICG-NBs and cause the nanobubble to rupture and release the drug. In addition, the physical impact, such as the cavitation effect of US damages the cytoskeleton and cell membrane, increases the permeability of the target cells, and facilitates drug entry into the cells. The ICG-NBs fabricated in this experiment showed a homogeneous spherical structure (Figures 1B and 1E).
ICG-NBs can markedly strengthen the therapeutic efficacy of SDT compared with ICG alone, which is related to the damage of cell membranes by NBs under the action of the US. And because the lipid composition of NBs is similar to the cell membrane, ICG is more easily internalized by HepG2 cells. The cytotoxicity of ICG-NBs-mediated SDT combined with shikonin was further significantly enhanced (Figure 2A and C).
To further explore the way of cell death, morphological detection was first performed. Morphological changes are essential factors in assessing cell death patterns. The morphological changes in necroptosis are distinguished from apoptosis by impaired integrity of the cytoplasmic membrane, resulting in increased cell size and disrupted nuclear organization.49 To observe whether these necroptotic features occurred in different treatment groups, cell membrane integrity and atomic morphology were assessed by Hoechst 33,342/PI double-staining. As shown in Figure 3A, shikonin caused morphological changes in necrotic cells and the combination treatment pronounced the necrotic cell morphology. The number of necrotic cells in different groups was quantified by flow cytometry, and the outcomes were similar to those of Hoechst 33,342/PI double-staining. As a potent inhibitor, Nec-1 inhibits necroptosis but not apoptosis and thus can distinguish between necroptosis and apoptosis. After pretreatment with 50 μM Nec-1 for 4 h, flow cytometry data revealed a dramatically decreased percentage of necrotic cells, indicating that this cell death was via the necroptotic pathway rather than necrosis secondary to apoptosis (Figure 3C). Interestingly, SDT in combination with shikonin provides a novel approach to address drug resistance due to apoptosis resistance by enhancing necroptosis.
To further explore the reasons for the increase of necroptotic cells in the SDT + shikonin treatment group, ROS were detected. The results showed that the production of ROS in the SDT + shikonin treatment group was significantly increased (Figure 4A). The results of ROS production were consistent with the results of cell viability experiments, indicating that the increase in ROS was an essential reason for the decrease in cell viability. Some studies have demonstrated that ROS regulate the RIPK1/RIPK3 necrotic bodies-mediated signaling, leading to necroptosis.50,51 SDT + shikonin treatment group generates a significant amount of ROS and promotes necroptosis-related protein production. SDT + shikonin treatment group may trigger the necroptosis of HepG2 cells through the production of a large amount of ROS and increase tumor cell mortality in the SDT + shikonin treatment group.
Oxidative stress affects mitochondrial membrane stability. The stability of MMP underlies the normal function of mitochondria to provide energy for tumor cells. The decrease in MMP indicates mitochondrial dysfunction. In the combined treatment group, the MMP decreased markedly (Figure 4C), indicating a prominent mitochondrial dysfunction caused by the SDT + shikonin treatment. The level of oxidative stress within tumor cells and the stability of MMP affect tumor cell invasion and migration potential. The results of transwell experiments indicated that the inhibitory effect of the SDT + shikonin treatment group on the invasion and migration of HCC was greater than the other groups (Figure 5A); thus, the SDT + shikonin treatment could inhibit tumor invasion and metastasis.
The in vivo effect of the combination treatment was investigated using tumor-bearing mice. Compared to other therapies, the tumor size and mass decreased drastically in the combined therapy group, demonstrating an excellent in vivo antitumor growth effect of the combination treatment group (Figure 6A and B). On the other hand, the combination treatment did not affect the mice’s body weight or vital organs, indicating its biosafety (Figure 6C and D). Initially, HE staining of the tumor tissue sections illuminated the function of necroptosis in the antitumor impact in vivo, suggesting that the combination treatment group had notably higher necrosis rates than the other treatment groups (Figure 6F). RIPK3 is a crucial mediator in the development of necroptosis; hence, immunohistochemical staining using specific antibodies was employed to observe RIPK3 expression.52 The findings revealed that the combined treatment group induces tumor cells to undergo necroptosis via upregulated RIPK3 expression (Figure 6H).
Nevertheless, the present study has some limitations. First, only the HepG2 cell line was assessed in this study, and the effect of this treatment on other liver cancer cell lines is unknown. Second, the therapeutic effect and the long-term impact of treatment in orthotopic liver cancer models were not evaluated. Future studies will explore the influence of combined therapy on the orthotopic liver cancer model.
Conclusion
In conclusion, our study confirmed that SDT combined with shikonin is a new treatment for HCC. The possibility of ICG-NBs as a new SDT sonosensitizer was proposed. We demonstrated for the first time that SDT combined with shikonin can increase the necroptosis of tumor cells, which may be related to the increase of RIPK3 expression caused by the rise in ROS production. SDT combined with shikonin can inhibit the growth, invasion, and migration of tumor cells. These findings illustrated that SDT combined with shikonin may become a novel, noninvasive therapeutic option for HCC treatment.
Abbreviations
SDT, sonodynamic therapy; ROS, reactive oxygen species; US, ultrasound; HCC, hepatocellular carcinoma; MMP, mitochondrial membrane potential; RIPK3, receptor-interacting protein 3; ICG, indocyanine green; ICG-NBs, ICG-loaded nanobubbles.
Data Sharing Statement
The data that support the findings of this study are available on request from the corresponding author upon reasonable request.
Ethics Approval
All protocols in this study were approved by the Committee on the Ethics of Animal Experiments of Harbin Medical University in compliance with the Guide for the Care and Use of Laboratory Animals published by the NIH.
Funding
This research was supported by the National Natural Science Foundation of China (grant number 82171947), and the Heilongjiang Provincial Natural Science Foundation of China (grant number ZD2021H005).
Disclosure
The authors report no conflicts of interest in this work.
References
1. Polyzos SA, Chrysavgis L, Vachliotis ID, Chartampilas E, Cholongitas E. Nonalcoholic fatty liver disease and hepatocellular carcinoma: insights in epidemiology, pathogenesis, imaging, prevention, and therapy. Semin Cancer Biol. 2023;93:20–35. doi:10.1016/j.semcancer.2023.04.010
2. Toh MR, Wong EYT, Wong SH, et al. Global Epidemiology and Genetics of Hepatocellular Carcinoma. Gastroenterology. 2023;164(5):766–782. doi:10.1053/j.gastro.2023.01.033
3. Yang C, Zhang H, Zhang L, et al. Evolving therapeutic landscape of advanced hepatocellular carcinoma. Nat Rev Gastroenterol Hepatol. 2023;20(4):203–222. doi:10.1038/s41575-022-00704-9
4. Laface C, Fedele P, Maselli FM, et al. Targeted therapy for hepatocellular carcinoma: old and new opportunities. Cancers. 2022;14(16):4028. doi:10.3390/cancers14164028
5. Vogel A, Meyer T, Sapisochin G, Salem R, Saborowski A. Hepatocellular carcinoma. Lancet. 2022;400(10360):1345–1362. doi:10.1016/S0140-6736(22)01200-4
6. Wang Z, Qin H, Liu S, Sheng J, Zhang X. Precision diagnosis of hepatocellular carcinoma. Chin Med J. 2023;136(10):1155–1165. doi:10.1097/CM9.0000000000002641
7. Xu J, Ji L, Liang Y, et al. CircRNA-SORE mediates sorafenib resistance in hepatocellular carcinoma by stabilizing YBX1. Signal Transduct Target Ther. 2020;5(1):298. doi:10.1038/s41392-020-00375-5
8. Eun JW, Yoon JH, Ahn HR, et al. Cancer-associated fibroblast-derived secreted phosphoprotein 1 contributes to resistance of hepatocellular carcinoma to sorafenib and lenvatinib. Cancer Commun. 2023;43(4):455–479. doi:10.1002/cac2.12414
9. Mohammad RM, Muqbil I, Lowe L, et al. Broad targeting of resistance to apoptosis in cancer. Semin Cancer Biol. 2015;35:S78–S103. doi:10.1016/j.semcancer.2015.03.001
10. Gong Y, Fan Z, Luo G, et al. The role of necroptosis in cancer biology and therapy. Mol Cancer. 2019;18(1):100. doi:10.1186/s12943-019-1029-8
11. Liu T, Sun X, Cao Z. Shikonin-induced necroptosis in nasopharyngeal carcinoma cells via ROS overproduction and upregulation of RIPK1/RIPK3/MLKL expression. Onco Targets Ther. 2019;12:2605–2614. doi:10.2147/OTT.S200740
12. Barar E, Genome SJ. Metabolism, or immunity: which is the primary decider of pancreatic cancer fate through non-apoptotic cell death? Biomedicines. 2023;11(10):2792. doi:10.3390/biomedicines11102792
13. Han W, Xie J, Fang Y, Wang Z, Pan H. Nec-1 enhances shikonin-induced apoptosis in leukemia cells by inhibition of RIP-1 and ERK1/2. Int J Mol Sci. 2012;13(6):7212–7225. doi:10.3390/ijms13067212
14. Xuan Y, Hu X. Naturally-occurring shikonin analogues--a class of necroptotic inducers that circumvent cancer drug resistance. Cancer Lett. 2009;274(2):233–242. doi:10.1016/j.canlet.2008.09.029
15. Seo J, Nam YW, Kim S, Oh DB, Song J. Necroptosis molecular mechanisms: recent findings regarding novel necroptosis regulators. Exp Mol Med. 2021;53(6):1007–1017. doi:10.1038/s12276-021-00634-7
16. Degterev A, Huang Z, Boyce M, et al. Chemical inhibitor of nonapoptotic cell death with therapeutic potential for ischemic brain injury. Nat Chem Biol. 2005;1(2):112–119. doi:10.1038/nchembio711
17. Yan J, Wan P, Choksi S, Liu ZG. Necroptosis and tumor progression. Trends Cancer. 2022;8(1):21–27. doi:10.1016/j.trecan.2021.09.003
18. Galluzzi L, Kepp O, Chan FK, Kroemer G. Necroptosis: mechanisms and relevance to disease. Annu Rev Pathol. 2017;12:103–130. doi:10.1146/annurev-pathol-052016-100247
19. Zhang T, Wang Y, Inuzuka H, Wei W. Necroptosis pathways in tumorigenesis. Semin Cancer Biol. 2022;86(Pt 3):32–40. doi:10.1016/j.semcancer.2022.07.007
20. Martens S, Bridelance J, Roelandt R, Vandenabeele P, Takahashi N. MLKL in cancer: more than a necroptosis regulator. Cell Death Differ. 2021;28(6):1757–1772. doi:10.1038/s41418-021-00785-0
21. Ding Y, He C, Lu S, et al. MLKL contributes to shikonin-induced glioma cell necroptosis via promotion of chromatinolysis. Cancer Lett. 2019;467:58–71. doi:10.1016/j.canlet.2019.09.007
22. Chen X, Yang L, Oppenheim JJ, Howard MZ. Cellular pharmacology studies of shikonin derivatives. Phytother Res. 2002;16(3):199–209. doi:10.1002/ptr.1100
23. Guo C, He J, Song X, et al. Pharmacological properties and derivatives of shikonin-A review in recent years. Pharmacol Res. 2019;149:104463. doi:10.1016/j.phrs.2019.104463
24. Li S, Zhang T, Xu W, et al. Sarcoma-targeting peptide-decorated polypeptide nanogel intracellularly delivers shikonin for upregulated osteosarcoma necroptosis and diminished pulmonary metastasis. Theranostics. 2018;8(5):1361–1375. doi:10.7150/thno.18299
25. Boulos JC, Rahama M, Hegazy MF, Efferth T. Shikonin derivatives for cancer prevention and therapy. Cancer Lett. 2019;459:248–267. doi:10.1016/j.canlet.2019.04.033
26. Feng W, Shi W, Liu S, et al. Fe(III)-shikonin supramolecular nanomedicine for combined therapy of tumor via ferroptosis and necroptosis. Adv Healthc Mater. 2022;11:2.
27. Kim EJ, Mangold AR, DeSimone JA, et al. Efficacy and safety of topical hypericin photodynamic therapy for early-stage cutaneous T-Cell Lymphoma (Mycosis Fungoides): the FLASH phase 3 randomized clinical trial. JAMA Dermatol. 2022;158(9):1031–1039. doi:10.1001/jamadermatol.2022.2749
28. Hu X, Zhang YS, Liu YC, Wang N, Zeng XT, Zhang LL. Emerging photodynamic/sonodynamic therapies for urological cancers: progress and challenges. J Nanobiotechnology. 2022;20(1):437. doi:10.1186/s12951-022-01637-w
29. Yumita N, Nishigaki R, Umemura K, Umemura S. Hematoporphyrin as a sensitizer of cell-damaging effect of ultrasound. Jpn J Cancer Res. 1989;80(3):219–222. doi:10.1111/j.1349-7006.1989.tb02295.x
30. Canaparo R, Foglietta F, Barbero N, Serpe L. The promising interplay between sonodynamic therapy and nanomedicine. Adv Drug Deliv Rev. 2022;189:114495. doi:10.1016/j.addr.2022.114495
31. Yin T, Chen H, Ma A, et al. Cleavable collagenase-assistant nanosonosensitizer for tumor penetration and sonodynamic therapy. Biomaterials. 2023;293:121992. doi:10.1016/j.biomaterials.2022.121992
32. Son S, Kim JH, Wang X, et al. Multifunctional sonosensitizers in sonodynamic cancer therapy. Chem Soc Rev. 2020;49(11):3244–3261. doi:10.1039/C9CS00648F
33. Wen M, Yu N, Wu S, et al. On-demand assembly of polymeric nanoparticles for longer-blood-circulation and disassembly in tumor for boosting sonodynamic therapy. Bioact Mater. 2022;18:242–253. doi:10.1016/j.bioactmat.2022.03.009
34. Wu B, Yuan Y, Liu J, et al. Single-cell RNA sequencing reveals the mechanism of sonodynamic therapy combined with a RAS inhibitor in the setting of hepatocellular carcinoma. J Nanobiotechnology. 2021;19(1):177. doi:10.1186/s12951-021-00923-3
35. Maleki A, Seyedhamzeh M, Yuan M, et al. Titanium-based nanoarchitectures for sonodynamic therapy-involved multimodal treatments. Small. 2023;19(12):e2206253. doi:10.1002/smll.202206253
36. Nowak KM, Schwartz MR, Breza VR, Price RJ. Sonodynamic therapy: rapid progress and new opportunities for non-invasive tumor cell killing with sound. Cancer Lett. 2022;532:215592. doi:10.1016/j.canlet.2022.215592
37. Xu M, Zhou L, Zheng L, et al. Sonodynamic therapy-derived multimodal synergistic cancer therapy. Cancer Lett. 2021;497:229–242. doi:10.1016/j.canlet.2020.10.037
38. Zhang Y, Zhang X, Yang H, et al. Advanced biotechnology-assisted precise sonodynamic therapy. Chem Soc Rev. 2021;50(20):11227–11248. doi:10.1039/D1CS00403D
39. Kaibori M, Matsui K, Hayashi M. Theranostics using indocyanine green lactosomes. Cancers. 2022;14(15):3840. doi:10.3390/cancers14153840
40. Wang H, Li X, Tse BW, et al. Indocyanine green-incorporating nanoparticles for cancer theranostics. Theranostics. 2018;8(5):1227–1242. doi:10.7150/thno.22872
41. Wang R, Song C, Gao A, et al. Antibody-conjugated liposomes loaded with indocyanine green for oral targeted photoacoustic imaging-guided sonodynamic therapy of Helicobacter pylori infection. Acta Biomater. 2022;143:418–427. doi:10.1016/j.actbio.2022.02.031
42. Nguyen Cao TG, Kang JH, You JY, et al. Safe and targeted sonodynamic cancer therapy using biocompatible exosome-based nanosonosensitizers. ACS Appl Mater Interfaces. 2021;13(22):25575–25588. doi:10.1021/acsami.0c22883
43. Chen Y, Shang H, Wang C, et al. RNA-Seq explores the mechanism of oxygen-boosted sonodynamic therapy based on all-in-one nanobubbles to enhance ferroptosis for the treatment of HCC. Int J Nanomedicine. 2022;17:105–123. doi:10.2147/IJN.S343361
44. Sung H, Ferlay J, Siegel RL, et al. Global cancer statistics 2020: GLOBOCAN estimates of incidence and mortality worldwide for 36 cancers in 185 countries. CA Cancer J Clin. 2021;71(3):209–249. doi:10.3322/caac.21660
45. Garg T, Shrigiriwar A, Habibollahi P, et al. Intraarterial therapies for the management of hepatocellular carcinoma. Cancers. 2022;14(14):3351. doi:10.3390/cancers14143351
46. Shang H, Chen Y, Wang C, et al. RNA-Seq technology reveals the mechanism of SDT combined with novel nanobubbles against HCC. Front Mol Biosci. 2021;8:791331. doi:10.3389/fmolb.2021.791331
47. Wu W, Xu M, Qiao B, et al. Nanodroplet-enhanced sonodynamic therapy potentiates immune checkpoint blockade for systemic suppression of triple-negative breast cancer. Acta Biomater. 2023;158:547–559. doi:10.1016/j.actbio.2022.12.023
48. Khoury MK, Gupta K, Franco SR, Liu B. Necroptosis in the pathophysiology of disease. Am J Pathol. 2020;190(2):272–285. doi:10.1016/j.ajpath.2019.10.012
49. Zhang Y, Chen X, Gueydan C, Han J. Plasma membrane changes during programmed cell deaths. Cell Res. 2018;28(1):9–21. doi:10.1038/cr.2017.133
50. Huang C, Luo Y, Zhao J, et al. Shikonin kills glioma cells through necroptosis mediated by RIP-1. PLoS One. 2013;8:6.
51. Lu B, Gong X, Wang ZQ, et al. Shikonin induces glioma cell necroptosis in vitro by ROS overproduction and promoting RIP1/RIP3 necrosome formation. Acta Pharmacol Sin. 2017;38(11):1543–1553. doi:10.1038/aps.2017.112
52. Weinlich R, Oberst A, Beere HM, Green DR. Necroptosis in development, inflammation and disease. Nat Rev Mol Cell Biol. 2017;18(2):127–136. doi:10.1038/nrm.2016.149
 © 2023 The Author(s). This work is published and licensed by Dove Medical Press Limited. The
full terms of this license are available at https://www.dovepress.com/terms
and incorporate the Creative Commons Attribution
- Non Commercial (unported, 3.0) License.
By accessing the work you hereby accept the Terms. Non-commercial uses of the work are permitted
without any further permission from Dove Medical Press Limited, provided the work is properly
attributed. For permission for commercial use of this work, please see paragraphs 4.2 and 5 of our Terms.
© 2023 The Author(s). This work is published and licensed by Dove Medical Press Limited. The
full terms of this license are available at https://www.dovepress.com/terms
and incorporate the Creative Commons Attribution
- Non Commercial (unported, 3.0) License.
By accessing the work you hereby accept the Terms. Non-commercial uses of the work are permitted
without any further permission from Dove Medical Press Limited, provided the work is properly
attributed. For permission for commercial use of this work, please see paragraphs 4.2 and 5 of our Terms.