Back to Journals » Diabetes, Metabolic Syndrome and Obesity » Volume 13
Soluble Suppression of Tumorigenicity 2 is Directly Correlated with Glycated Hemoglobin in Individuals with an Average glycemia in the Normal/Prediabetes Range
Received 24 February 2020
Accepted for publication 5 July 2020
Published 3 August 2020 Volume 2020:13 Pages 2711—2718
DOI https://doi.org/10.2147/DMSO.S251135
Checked for plagiarism Yes
Review by Single anonymous peer review
Peer reviewer comments 2
Editor who approved publication: Dr Konstantinos Tziomalos
Amal Hasan,1 Waleed Aldhahi2,3
1Department of Immunology and Microbiology, Dasman Diabetes Institute, Kuwait City, Kuwait; 2Medical Division, Dasman Diabetes Institute, Kuwait City, Kuwait; 3Department of Medicine, Mubarak Al-Kabeer Hospital, Kuwait City, Kuwait
Correspondence: Amal Hasan Email [email protected]
Purpose: Cardiovascular disease can be detected in individuals with prediabetes. The purpose of this study was to determine whether soluble suppression of tumorigenicity 2 (sST2), which is elevated in cardiovascular disease and/or type 2 diabetes, is correlated with glycated haemoglobin in individuals with glycemia in the normal/prediabetes range.
Patients and Methods: The anthropometric, biochemical and metabolic parameters were measured in 30 adults, and the plasma levels of sST2 were quantified.
Results: sST2 was directly correlated with glycated hemoglobin in individuals with glycemia in the normal/prediabetes range. Participants who were at the higher end of glycated hemoglobin (5.8– 6.4%) had significantly higher sST2 compared to those at the lower end (≤ 5.5%). Moreover, sST2 was directly correlated with homeostatic model assessment of insulin resistance (HOMA-IR), alkaline phosphatase, and waist circumference. However, the correlation between sST2 and HOMA-IR or waist circumference was lost after adjusting for age, gender or body mass index.
Conclusion: Circulating sST2 may be used to establish a cut-off value for cardiometabolic risk/disease in individuals with glycemia in the normal/prediabetes range.
Keywords: glycated hemoglobin, prediabetes, soluble suppression of tumorigenicity 2
Introduction
Suppression of tumorigenicity 2 (ST2), a member of the toll-like/interleukin (IL)-1-receptor-like superfamily, exists in two isoforms with opposing biological activities. The transmembrane isoform (ST2L) confers the biological activities of interleukin (IL)-33, while the soluble isoform (sST2) serves as an antagonistic decoy receptor.1,2 The IL-33/ST2 axis is a key regulator of inflammation and tissue repair, and thus, is considered a prognostic marker in several diseases.3 The IL-33/ST2L axis is protective against obesity, insulin resistance and type 2 diabetes (T2D).4–6 In humans, higher levels of circulating IL-33 has been associated with a favorable metabolic profile.7,8 Similarly, the IL-33/ST2L axis has been shown to be protective against cardiovascular disease (CVD), including atherosclerosis6 and cardiac fibrosis.9 IL-33 blocks the differentiation of macrophage-derived foam cells,10 which are responsible for the formation of atherosclerotic plaques,11 and induces the production of anti-oxidized low-density lipoprotein antibodies,6 which enhance the clearance of pro-atherogenic lipoproteins from the circulation.12
Therefore, while IL-33 through its interaction with ST2L is protective against T2D and CVD, the decoy receptor sST2, through inhibiting this interaction, may be detrimental. Indeed, a recent study in mice has shown that sST2, which is associated with obesity, exacerbates the depletion of protective regulatory T cells and group 2 innate lymphoid cells in the adipose tissue, and in so doing promotes insulin resistance.13 Importantly, studies have shown that sST2 is elevated in individuals with T2D,14–16 post-transplant diabetes mellitus,17,18 and CVD.19,20 Moreover, sST2 is associated with markers of metabolic dysfunction in atherosclerotic disease,21 and with increased CVD mortality.21,22 It has also been shown to be elevated in other inflammatory conditions such as inflammatory bowel disease,23 gut mucosal damage,3 and sepsis.24 However, the source of sST2 is unclear but it is thought to be secreted as a result of tissue damage and/or be secondary to an unregulated ongoing inflammatory process.25
T2D and prolonged hyperglycaemia are associated with increased risk of CVD such as coronary heart disease.26,27 However, recent studies have reported that CVD, such as subclinical atherosclerosis and left ventricular systolic and diastolic dysfunction, can be detected in individuals with prediabetes.28 This suggests that CVD may develop prior to or concomitantly with the onset of metabolic disease. Therefore, identification of early biomarkers that may be associated with the onset of cardiometabolic disease is of considerable importance. Since elevated levels of sST2 are associated with both CVD19–22 and T2D,14–16 we hypothesized that sST2 may serve as a novel biomarker to detect subclinical CVD risk in the earliest stages of metabolic disease development. Therefore, we conducted a preliminary study to determine whether sST2 is correlated with glycated haemoglobin (HbA1c) in individuals with glycemia in the normal/prediabetes range.
Patients and Methods
Study Participants
The study was conducted in accordance with the ethical principles of the Declaration of Helsinki and approved by the Ethical Review Committee of Dasman Diabetes Institute (DDI), Kuwait. This work was conducted using samples of participants that were enrolled as part of the Obesity Program (RA2010003). To address the question of the current study, the inclusion criteria included adult volunteers (age range between 21 and 65 years) with either normal glycemia or glycemia in the prediabetes range, and no other health condition or medication ingestion, and no previous or current exercise program. Individuals with body mass index (BMI) in the normal (BMI ≤ 25 kg/m2), overweight (BMI 26–29 kg/m2) and obese (BMI 30–40 kg/m2) range were included. The American Diabetes Association Criteria were used to classify participants as either having no diabetes or prediabetes. Participants with conditions other than prediabetes or taking any kind of medications were excluded. Based on these criteria, a total of 30 participants (15 females and 15 males, age range between 26 and 59 years) with an HbA1c in the normal (<5.7%) and prediabetes (5.7–6.4%) range (based on HbA1c criteria defined by the American Diabetes Association;29 oral glucose tolerance test was not conducted) were included in this study. Participants were further classified into three groups (HbA1c ≤5.5, n = 9; HbA1c 5.6–5.7, n = 11; HbA1c 5.8–6.4, n = 10) for analytic purposes. The participants had no comorbid health conditions and were not on any type of medication. All participants had provided written informed consents.
Anthropometric and Laboratory Measurements
After measuring participant’s body weight (kg) and height (to the nearest 0.5 cm), the BMI was calculated as weight/height2 (kg/m2) and used as an overall index of adiposity. The waist circumference and hip circumference were measured with a flexible tape according to the guidelines of the International Diabetes Federation (IDF). After exhalation, the waist circumference was measured on a horizontal plane at a point that was equally distant from the lowest rib and the upper border of the iliac crest. Hip circumference was measured on a horizontal plane at the maximum protuberance of the buttocks which parallels the ischiopubic symphysis in the front. The waist-to-hip ratio (WHR) was calculated by dividing the waist perimeter by the hip perimeter. The body composition, including percentage of body fat (PBF) and soft lean mass (SLM), was measured using IOI 353 Body Composition Analyzer (Jawon Medical).
Fasting blood samples were obtained, and plasma glucose, serum total cholesterol, triglycerides (TG), high-density lipoprotein (HDL) cholesterol, alanine aminotransferase (ALT), alkaline phosphatase (ALP), aspartate aminotransferase (AST) and total Bilirubin (TBIL) were measured using the Siemens Dimension RXL chemistry analyser (Diamond Diagnostics, Holliston, MA, USA). Low-density lipoprotein (LDL) cholesterol was estimated. HbA1c was determined using VariantTM (Bio-Rad, Hercules, CA, USA). The white blood cell count was measured using XN-1000 Haematology Analyser (Sysmex, USA). C-reactive protein (CRP) was measured using commercially available Enzyme-Linked Immunosorbent Assay (ELISA) kits (BioVendor, USA). sST2 was measured using commercially available ELISA kits (Abcam, USA). Insulin was measured using commercially available Iso-insulin ELISA kits (Mercodia, Uppsala, Sweden). Homeostatic Model Assessment of Insulin Resistance (HOMA-IR) was calculated using the following formula: glucose in mmol/L x insulin in mIU/mL/22.5. Anthropometric, biochemical and metabolic parameters are shown in Table 1.
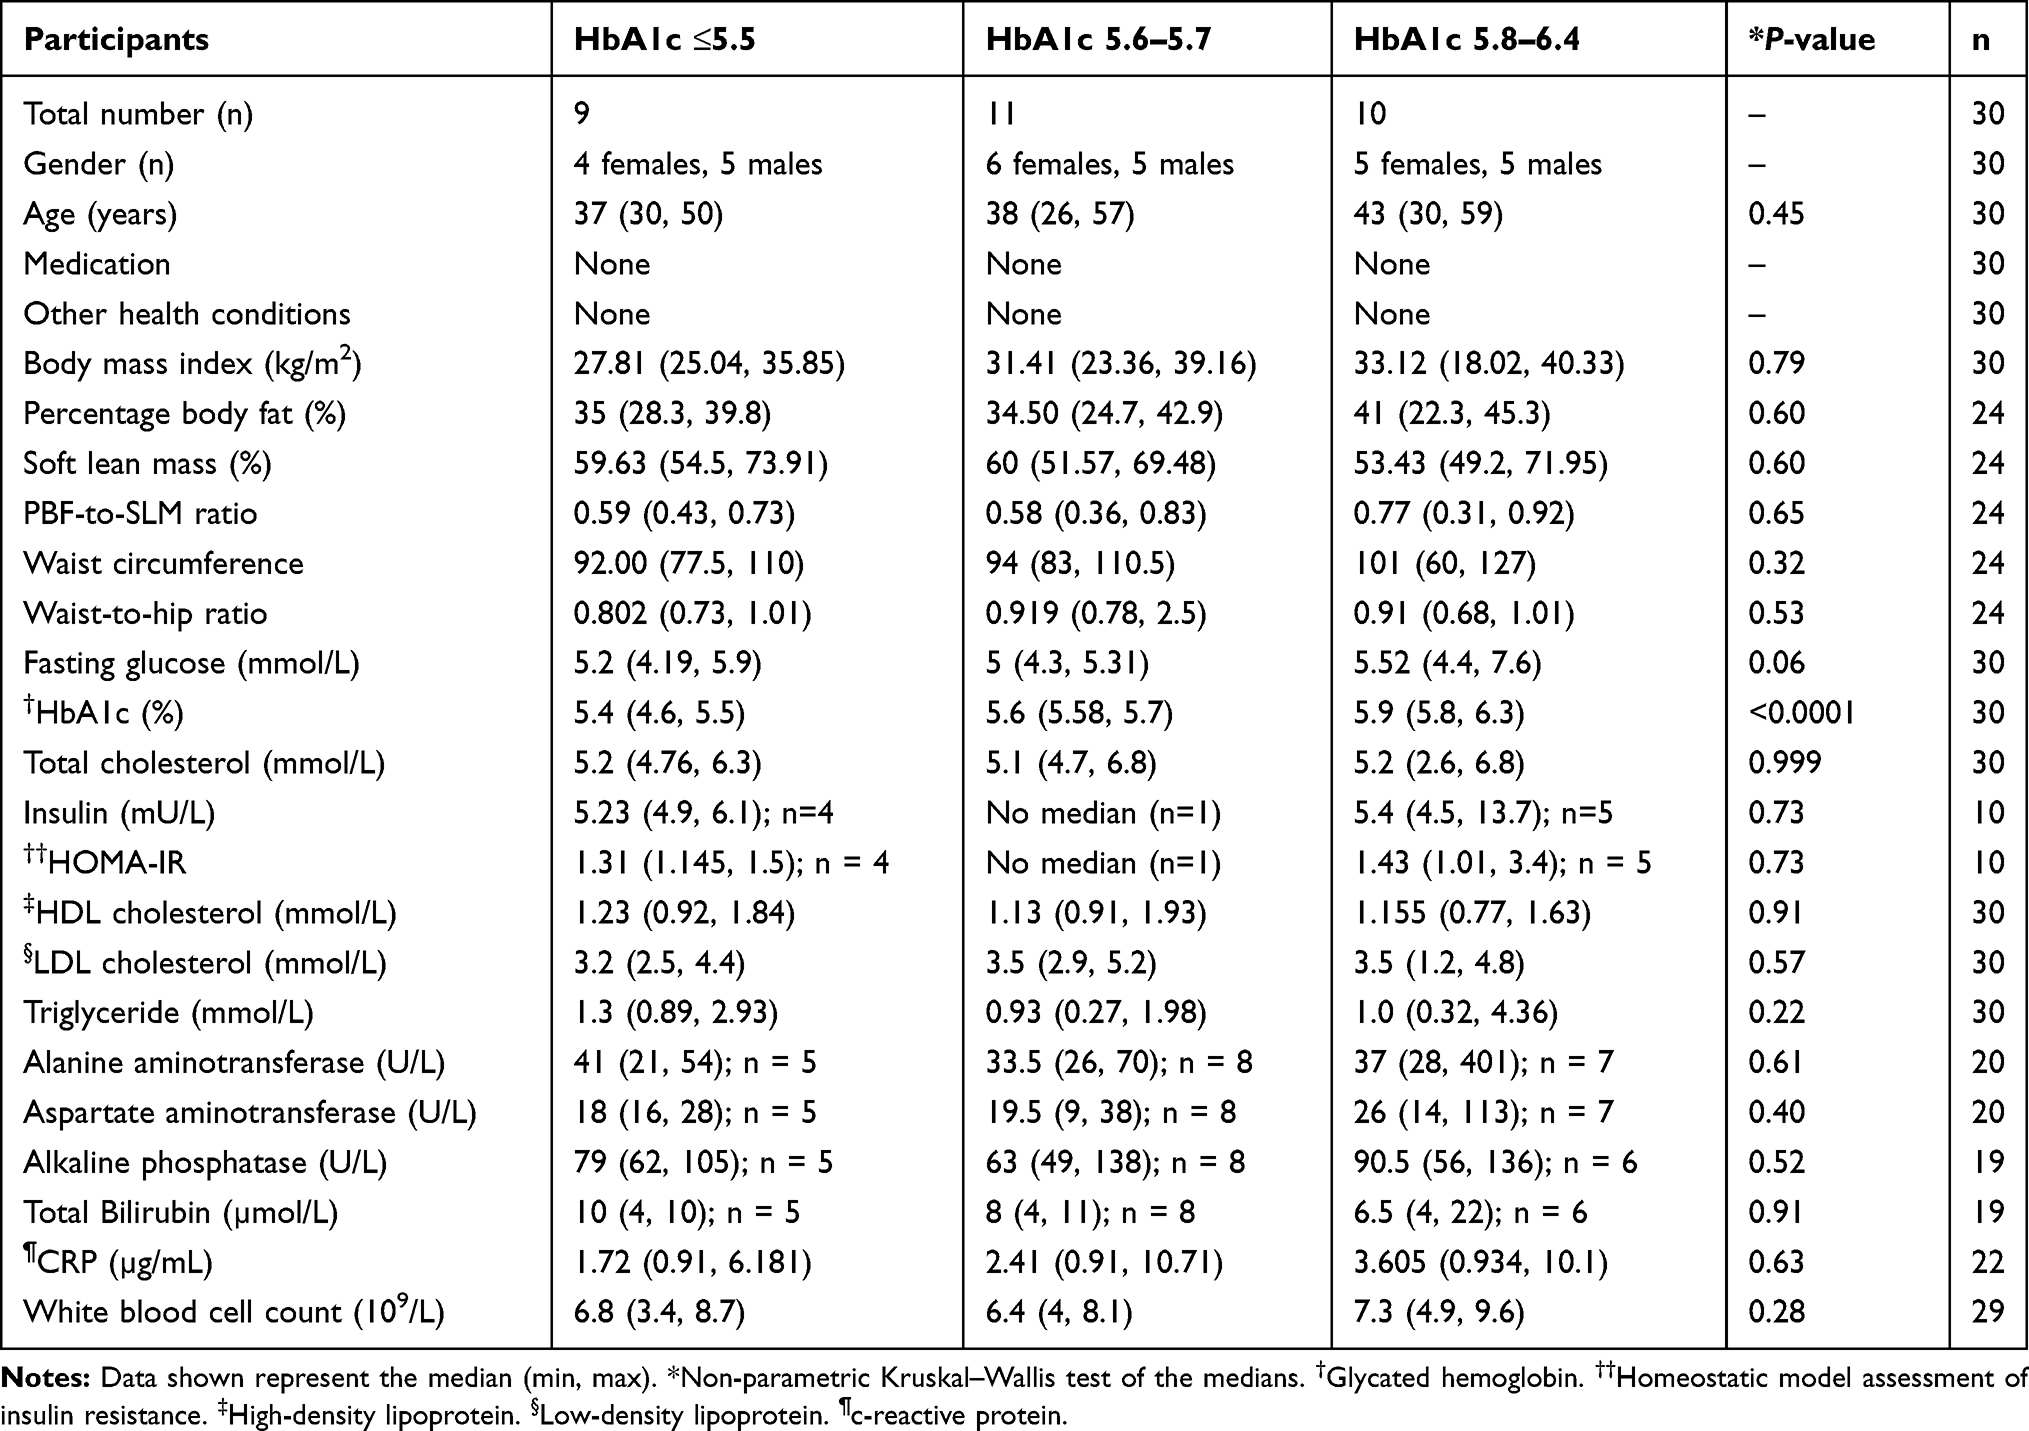 |
Table 1 Anthropometric, Biochemical and Metabolic Characteristics of the Study Groups |
Statistical Analysis
Statistical analysis was conducted using the GraphPad Prism software (version 8.0.2; San Diego, CA, USA). To compare between groups of data, the non-parametric Kruskal–Wallis test, as well as the Mann–Whitney test, were conducted. For correlation analysis, the non-parametric Spearman r test was applied. Linear regression analysis was conducted using IBM SPSS software (version 25; New York, USA). A P-value <0.05 was considered statistically significant.
Results
Our data showed that sST2 is directly correlated with HbA1c (r = 0.53; P = 0.0028; n = 30) in individuals with overall glycemia in the normal/prediabetes range (Figure 1A). This correlation remained significant after adjusting for age (r = 0.563, P = 0.001), gender (r = 0.559, P = 0.002), BMI (r = 0.502, P = 0.005), and age/gender/BMI combined (r = 0.573, P = 0.002). Moreover, there was a significant (Kruskal–Wallis test, P = 0.018) increase in the level of sST2 with increasing HbA1c. In this regard, participants who were at the higher end of the HbA1c range (HbA1c 5.8–6.4) had significantly (P = 0.004) higher sST2 compared to those at the lower end (HbA1c ≤5.5) (median 210.7, n = 10 vs. median 110.1, n = 9). Similarly, individuals who were at the middle range (HbA1c 5.6–5.7) had higher levels of sST2 compared to those at the lower end (HbA1c ≤5.5), which was almost statistically significant (P = 0.056; median 175, n = 11 vs. median 110.1, n = 9) (Figure 1B). The data also showed that sST2 was directly correlated with HOMA-IR (r = 0.66; P = 0.04; n = 10). This correlation was maintained when adjusted for gender (r = 0.699, P = 0.036), but lost when adjusted for age (r = 0.565, P = 0.113), BMI (r = 0.593, P = 0.092) and age/gender/BMI combined (r = 0.37, P = 0.414) (Figure 1C).
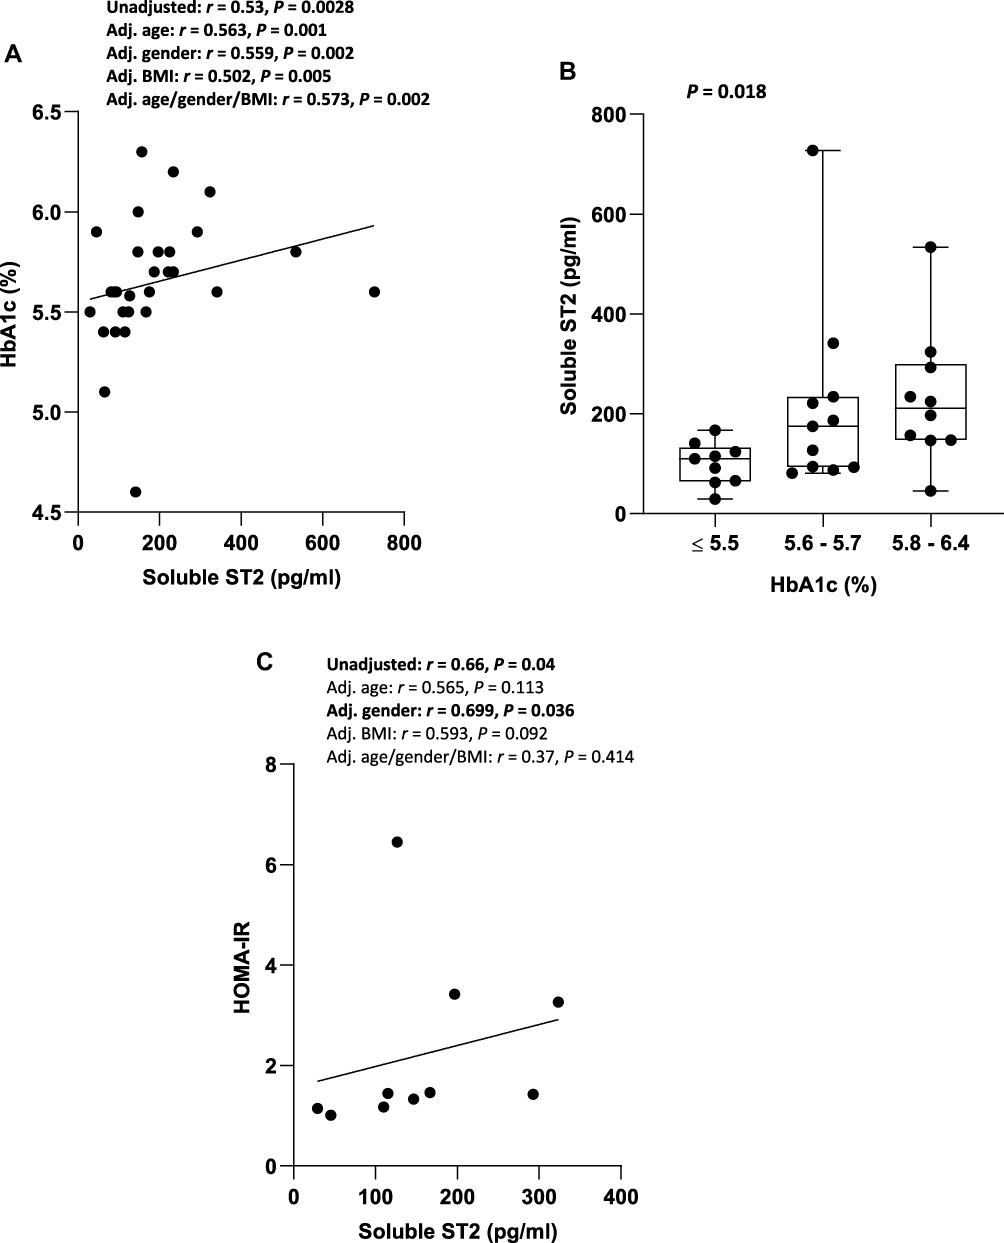 |
Figure 1 Correlation between sST2 and HbA1c and HOMA-IR in individuals with glycemia in the normal/prediabetes range. (A) sST2 was directly correlated with HbA1c in individuals with glycemia in the normal/prediabetes range. (B) There was an increase in sST2 with increasing HbA1c in individuals with glycemia in normal/prediabetes range. (C) sST2 was directly correlated with HOMA-IR in individuals with glycemia in the normal/prediabetes range. Abbreviations: sST2, soluble suppression of tumorigenicity 2; HbA1c, glycated hemoglobin; HOMA-IR, homeostatic model assessment of insulin resistance; BMI, body mass index; Adj., Adjusted. |
In addition, sST2 was directly correlated with ALP (r = 0.58, P = 0.009, n = 19) (Figure 2A), which remained significant when adjusted for age (r = 0.583, P = 0.011), gender (r = 0.535, P = 0.022), BMI (r = 0.556, P = 0.017), and age/gender/BMI combined (r = 0.508, P = 0.045). However, no correlation was observed between sST2 and ALT or AST. Of note, 15%, 5% and 10% of participants tested (a total of ~65% were tested) had high levels of one or two of the liver enzymes ALT, AST or ALP, respectively. These participants were at the middle (HbA1c 5.6–5.7, n = 2) or higher range (HbA1c 5.8–6.4, n = 3) of HbA1c. Moreover, a direct correlation was found between sST2 and waist circumference (r = 0.5; P = 0.0099; n = 24) in individuals with glycemia in the normal/prediabetes range (Figure 2B). This correlation was lost when adjusted for the BMI (r = 0.312, P = 0.147) and age/gender/BMI combined (r = 0.173, P = 0.454), but maintained when adjusted for age (r = 0.514, P = 0.012) or gender (r = 0.476, P = 0.022). There was no significant difference in waist circumference among the three HbA1c groups.
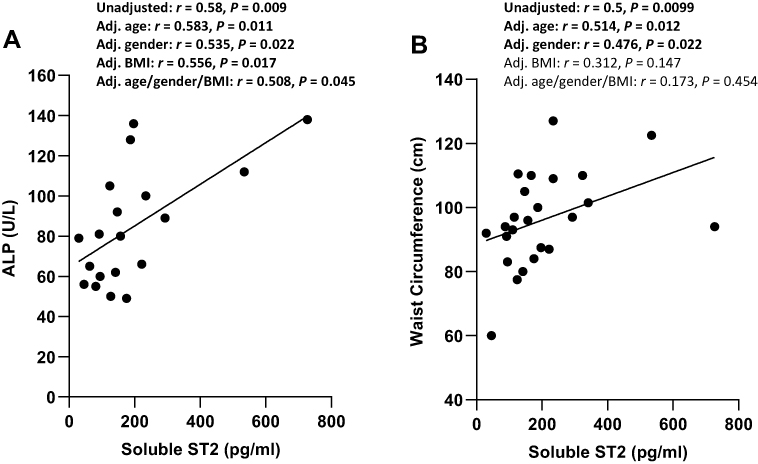 |
Figure 2 Correlation between sST2 and ALP and waist circumference in individuals with glycemia in the normal/prediabetes range. (A) sST2 was directly correlated with ALP in individuals with glycemia in the normal/prediabetes range. (B) sST2 was directly correlated with waist circumference in individuals with glycemia in normal/prediabetes range. Abbreviations: sST2, soluble suppression of tumorigenicity 2; ALP, alkaline phosphatase; BMI, body mass index; Adj., adjusted. |
Discussion
CVD, such as subclinical atherosclerosis and left ventricular systolic and diastolic dysfunction, has been reported in individuals with prediabetes.28 This suggests that subclinical CVD may occur early during metabolic disease development, and that HbA1c may not be an adequate marker to detect early/subclinical cardiometabolic disease in high-risk populations. Since sST2 is elevated in both CVD19,20 and T2D,14–16 we investigated whether sST2 is correlated with HbA1c in individuals with glycemia in the normal/prediabetes range. Our data showed a direct correlation between sST2 and HbA1c, which was confirmed by comparative analysis. This suggests that subclinical cardiometabolic risk may already be occurring in individuals with glycemia in the normal/prediabetes range. In addition, when sST2 was assessed for possible correlation with other markers of cardiometabolic disease risk,30–32 a direct correlation was found between sST2 and HOMA-IR, ALP, and waist circumference. However, the correlation between sST2 and HOMA-IR was lost after adjusting for age or BMI, and similarly, the correlation between sST2 and waist circumference was lost after adjusting for BMI.
Chronic low-grade inflammation (or meta-inflammation) is associated with the development of insulin resistance and T2D.33 A major contributing factor in the development of meta-inflammation is gut dysbiosis, gut-barrier dysfunction, and increased translocation of bacterial endotoxin (lipopolysaccharide, LPS) from the gut lumen into the circulation (metabolic endotoxemia). In this respect, elevated plasma endotoxin has been reported in individuals with obesity, atherosclerosis, non-alcoholic fatty liver disease, and T2D.34 Crucially, sST2 has also been shown to be elevated in individuals with T2D14,15 and CVD.20 The source of sST2 is unclear with some studies suggesting that it may be secreted as a result of tissue damage and/or be secondary to an unregulated ongoing inflammatory process.25 Indeed, sST2 has been associated with an aggravated immune status in humans,35 and is thought to be secreted to induce endotoxin tolerance and to attenuate acute tissue damage.36,37 In addition, sST2 may originate from the heart to attenuate aggravated immune responses in organs exposed to environmental and/or autologous antigens. In this regard, in vitro studies have shown that inflammatory cytokines including IL-1α, IL-1β, and TNFα, and supernatants derived from LPS-stimulated PBMC, caused a significant increase in sST2 secretion by cardiac myocytes.35 Likewise, stress/injury also induced the release of sST2 by cardiac myocytes and cardiac fibroblasts. Moreover, vascular endothelial cells are important sources of sST2,38 which secrete the protein in response to inflammatory cytokines such as IL-1β and TNFα.39
In our study, we found a direct correlation between sST2 and HbA1c in individuals with glycemia in the normal/prediabetes range. A similar correlation was observed between sST2 and HOMA-IR (lost when adjusted for age or BMI), ALP, and waist circumference (lost when adjusted for BMI). The lack of correlation between sST2 and other liver enzymes may have been due to the low number of participants tested. Overall, our data may suggest the presence of an ongoing subclinical inflammatory process and/or tissue damage (and/or dysfunction in the regulation of the IL-33/ST2L/sST2 system), which may be accompanied with a gradual decline in glucose regulation. The “increased” sST2 may have originated from the gut (as a result of gut dysbiosis/mucosal inflammation), pancreatic tissue (as a result of overload/stress or subclinical inflammation) and/or cardiac myocytes (in response to inflammation or stress). Importantly, and owing to the ability of sST2 to down-regulate IL-33, any pathological process that leads to chronically elevated sST2 (even if mildly elevated), and/or its dysregulation, may be detrimental to cardiac health. In this regard, chronically elevated sST2 may lead to chronic downregulation of cardioprotective IL-33 leading to subclinical CVD.
In general, our data suggest that HbA1c may not be an adequate marker to detect early/subclinical cardiometabolic disease in individuals with glycemia in the normal/prediabetes range. Therefore, sST2 may serve as a valuable early biomarker of subclinical inflammation, and thus, be used as an adjunctive test along with HbA1c (and other tests) to detect subclinical cardiometabolic disease in high-risk populations.
Conclusion
sST2 is directly correlated with HbA1c, HOMA-IR, ALP, and waist circumference in individuals with glycemia in the normal/prediabetes range. Thus, sST2 may prove to be a valuable biomarker to identify individuals at increased risk of developing cardiometabolic disease, despite having an HbA1c in the normal/prediabetes range. A large-scale study is underway to confirm these findings, and to establish a cut-off value for sST2 (as well as assess other CVD biomarkers). It is hoped that sST2, in conjunction with HbA1c and other tests of glucometabolic homeostasis, can be used to detect subclinical cardiometabolic disease in high-risk populations.
Acknowledgments
We acknowledge the Kuwait Foundation for the Advancement of Sciences (KFAS) for funding the study (grant number RA2010003). We thank Mr. Shihab Kochumon for conducting the insulin/HOMA-IR test, and for the linear regression analysis using SPSS software. We thank staff from the Clinical Laboratory Department, Medical Fitness Center, and the National Dasman Diabetes BioBank for their support.
Disclosure
The authors report no conflicts of interest in this work.
References
1. Lohning M, Grogan JL, Coyle AJ, et al. T1/ST2 expression is enhanced on CD4+ T cells from schistosome egg-induced granulomas: analysis of Th cell cytokine coexpression ex vivo. J Immunol. 1999;162:3882–3889.
2. Hayakawa H, Hayakawa M, Kume A, Tominaga S. Soluble ST2 blocks interleukin-33 signaling in allergic airway inflammation. J Biol Chem. 2007;282:26369–26380. doi:10.1074/jbc.M704916200
3. Mehraj V, Jenabian MA, Ponte R, et al. The plasma levels of soluble ST2 as a marker of gut mucosal damage in early HIV infection. AIDS. 2016;30:1617–1627. doi:10.1097/QAD.0000000000001105
4. Miller AM, Asquith DL, Hueber AJ, et al. Interleukin-33 induces protective effects in adipose tissue inflammation during obesity in mice. Circ Res. 2010;107:650–658. doi:10.1161/CIRCRESAHA.110.218867
5. Miller AM, Liew FY. The IL-33/ST2 pathway–A new therapeutic target in cardiovascular disease. Pharmacol Ther. 2011;131:179–186. doi:10.1016/j.pharmthera.2011.02.005
6. Miller AM, Xu D, Asquith DL, et al. IL-33 reduces the development of atherosclerosis. J Exp Med. 2008;205:339–346. doi:10.1084/jem.20071868
7. Hasan A, Al-Ghimlas F, Warsame S, et al. IL-33 is negatively associated with the BMI and confers a protective lipid/metabolic profile in non-diabetic but not diabetic subjects. BMC Immunol. 2014;15:19. doi:10.1186/1471-2172-15-19
8. Anand G, Vasanthakumar R, Mohan V, Babu S, Aravindhan V. Increased IL-12 and decreased IL-33 serum levels are associated with increased Th1 and suppressed Th2 cytokine profile in patients with diabetic nephropathy (CURES-134). Int J Clin Exp Pathol. 2014;7:8008–8015.
9. Sanada S, Hakuno D, Higgins LJ, Schreiter ER, McKenzie AN, Lee RT. IL-33 and ST2 comprise a critical biomechanically induced and cardioprotective signaling system. J Clin Invest. 2007;117:1538–1549. doi:10.1172/JCI30634
10. McLaren JE, Michael DR, Salter RC, et al. IL-33 reduces macrophage foam cell formation. J Immunol. 2010;185:1222–1229. doi:10.4049/jimmunol.1000520
11. Lusis AJ. Atherosclerosis. Nature. 2000;407:233–241. doi:10.1038/35025203
12. Pawlak K, Mysliwiec M, Pawlak D. Oxidized LDL to autoantibodies against oxLDL ratio - The new biomarker associated with carotid atherosclerosis and cardiovascular complications in dialyzed patients. Atherosclerosis. 2012;224:252–257. doi:10.1016/j.atherosclerosis.2012.07.011
13. Zhao XY, Zhou L, Chen Z, et al. The obesity-induced adipokine sST2 exacerbates adipose treg and ILC2 depletion and promotes insulin resistance. Sci Adv. 2020;6:eaay6191. doi:10.1126/sciadv.aay6191
14. Fousteris E, Melidonis A, Panoutsopoulos G, et al. Toll/interleukin-1 receptor member ST2 exhibits higher soluble levels in type 2 diabetes, especially when accompanied with left ventricular diastolic dysfunction. Cardiovasc Diabetol. 2011;10:101. doi:10.1186/1475-2840-10-101
15. Lin YH, Zhang RC, Hou LB, et al. Distribution and clinical association of plasma soluble ST2 during the development of type 2 diabetes. Diabetes Res Clin Pract. 2016;118:140–145. doi:10.1016/j.diabres.2016.06.006
16. Hu X, Zhang H, Song Y, et al. Soluble ST2 is associated with increased carotid intima-media thickness in patients with type 2 diabetes mellitus: a case-control study. Medicine. 2020;99:e18940. doi:10.1097/MD.0000000000018940
17. Griffith ML, Jagasia MH, Misfeldt AA, et al. Pretransplantation C-peptide level predicts early posttransplantation diabetes mellitus and has an impact on survival after allogeneic stem cell transplantation. Biol Blood Marrow Transplant. 2011;17:86–92. doi:10.1016/j.bbmt.2010.06.010
18. Rowan CM, Teagarden AM, Cater DT, Moser EAS, Baykoyannis G, Paczesny S. Early high plasma ST2, the decoy IL-33 receptor, in children undergoing hematopoietic cell transplantation is associated with the development of post-transplant diabetes mellitus. Haematologica. 2020;105:e249–e252. doi:10.3324/haematol.2019.222992
19. Sharim J, Daniels LB. Soluble ST2 and soluble markers of fibrosis: emerging roles for prognosis and guiding therapy. Curr Cardiol Rep. 2020;22:41. doi:10.1007/s11886-020-01288-z
20. Dzudie A, Dzekem BS, Kengne AP. NT-pro BNP and plasma-soluble ST2 as promising biomarkers for hypertension, hypertensive heart disease and heart failure in sub-Saharan Africa. Cardiovasc J Afr. 2017;28:406–407.
21. Cardellini M, Rizza S, Casagrande V, et al. Soluble ST2 is a biomarker for cardiovascular mortality related to abnormal glucose metabolism in high-risk subjects. Acta Diabetol. 2019;56:273–280. doi:10.1007/s00592-018-1230-z
22. Somuncu MU, Kalayci B, Avci A, et al. Predicting long-term cardiovascular outcomes of patients with acute myocardial infarction using soluble ST2. Horm Mol Biol Clin Investig. 2020. doi:10.1515/hmbci-2019-0062
23. Pastorelli L, Garg RR, Hoang SB, et al. Epithelial-derived IL-33 and its receptor ST2 are dysregulated in ulcerative colitis and in experimental Th1/Th2 driven enteritis. Proc Natl Acad Sci U S A. 2010;107:8017–8022. doi:10.1073/pnas.0912678107
24. Brunner M, Krenn C, Roth G, et al. Increased levels of soluble ST2 protein and IgG1 production in patients with sepsis and trauma. Intensive Care Med. 2004;30:1468–1473. doi:10.1007/s00134-004-2184-x
25. Hodzic Z, Schill EM, Bolock AM, Good M. IL-33 and the intestine: the good, the bad, and the inflammatory. Cytokine. 2017;100:1–10. doi:10.1016/j.cyto.2017.06.017
26. Emerging Risk Factors C, Sarwar N, Gao P, et al. Diabetes mellitus, fasting blood glucose concentration, and risk of vascular disease: a collaborative meta-analysis of 102 prospective studies. Lancet. 375;2010:2215–2222. doi:10.1016/S0140-6736(10)60484-9
27. Gao Y, Lu B, Sun ML, et al. Comparison of atherosclerotic plaque by computed tomography angiography in patients with and without diabetes mellitus and with known or suspected coronary artery disease. Am J Cardiol. 2011;108:809–813. doi:10.1016/j.amjcard.2011.04.032
28. Reis JP, Allen NB, Bancks MP, et al. Duration of diabetes and prediabetes during adulthood and subclinical atherosclerosis and cardiac dysfunction in middle age: the CARDIA study. Diabetes Care. 2018;41:731–738. doi:10.2337/dc17-2233
29. Marathe PH, Gao HX, Close KL. American Diabetes Association standards of medical care in diabetes 2017. J Diabetes. 2017;9:320–324. doi:10.1111/1753-0407.12524
30. Kissebah AH, Vydelingum N, Murray R, et al. Relation of body fat distribution to metabolic complications of obesity. J Clin Endocrinol Metab. 1982;54:254–260. doi:10.1210/jcem-54-2-254
31. Wang Y, Rimm EB, Stampfer MJ, Willett WC, Hu FB. Comparison of abdominal adiposity and overall obesity in predicting risk of type 2 diabetes among men. Am J Clin Nutr. 2005;81:555–563. doi:10.1093/ajcn/81.3.555
32. Pouliot MC, Despres JP, Lemieux S, et al. Waist circumference and abdominal sagittal diameter: best simple anthropometric indexes of abdominal visceral adipose tissue accumulation and related cardiovascular risk in men and women. Am J Cardiol. 1994;73:460–468. doi:10.1016/0002-9149(94)90676-9
33. Fernandez-Real JM, Pickup JC. Innate immunity, insulin resistance and type 2 diabetes. Diabetologia. 2012;55:273–278. doi:10.1007/s00125-011-2387-y
34. Faraj TA, McLaughlin CL, Erridge C. Host defenses against metabolic endotoxaemia and their impact on lipopolysaccharide detection. Int Rev Immunol. 2017;36:125–144. doi:10.1080/08830185.2017.1280483
35. Mildner M, Storka A, Lichtenauer M, et al. Primary sources and immunological prerequisites for sST2 secretion in humans. Cardiovasc Res. 2010;87:769–777. doi:10.1093/cvr/cvq104
36. Brint EK, Xu D, Liu H, et al. ST2 is an inhibitor of interleukin 1 receptor and toll-like receptor 4 signaling and maintains endotoxin tolerance. Nat Immunol. 2004;5:373–379. doi:10.1038/ni1050
37. Espinassous Q, Garcia-de-Paco E, Garcia-Verdugo I, et al. IL-33 enhances lipopolysaccharide-induced inflammatory cytokine production from mouse macrophages by regulating lipopolysaccharide receptor complex. J Immunol. 2009;183:1446–1455. doi:10.4049/jimmunol.0803067
38. Villacorta H, Maisel AS. Soluble ST2 testing: a promising biomarker in the management of heart failure. Arq Bras Cardiol. 2016;106:145–152. doi:10.5935/abc.20150151
39. Bartunek J, Delrue L, Van Durme F, et al. Nonmyocardial production of ST2 protein in human hypertrophy and failure is related to diastolic load. J Am Coll Cardiol. 2008;52:2166–2174. doi:10.1016/j.jacc.2008.09.027
 © 2020 The Author(s). This work is published and licensed by Dove Medical Press Limited. The
full terms of this license are available at https://www.dovepress.com/terms
and incorporate the Creative Commons Attribution
- Non Commercial (unported, 3.0) License.
By accessing the work you hereby accept the Terms. Non-commercial uses of the work are permitted
without any further permission from Dove Medical Press Limited, provided the work is properly
attributed. For permission for commercial use of this work, please see paragraphs 4.2 and 5 of our Terms.
© 2020 The Author(s). This work is published and licensed by Dove Medical Press Limited. The
full terms of this license are available at https://www.dovepress.com/terms
and incorporate the Creative Commons Attribution
- Non Commercial (unported, 3.0) License.
By accessing the work you hereby accept the Terms. Non-commercial uses of the work are permitted
without any further permission from Dove Medical Press Limited, provided the work is properly
attributed. For permission for commercial use of this work, please see paragraphs 4.2 and 5 of our Terms.