Back to Journals » Journal of Inflammation Research » Volume 15
Soluble Programmed Cell Death Protein 1 and Its Ligand: Potential Biomarkers to Predict Acute Kidney Injury After Surgery in Critically Ill Patients
Authors Wang J, Zheng X ![]() , Jiang Y, Jia H, Shi X, Han Y, Li Q, Li W
, Jiang Y, Jia H, Shi X, Han Y, Li Q, Li W
Received 12 January 2022
Accepted for publication 11 March 2022
Published 24 March 2022 Volume 2022:15 Pages 1995—2008
DOI https://doi.org/10.2147/JIR.S356475
Checked for plagiarism Yes
Review by Single anonymous peer review
Peer reviewer comments 2
Editor who approved publication: Professor Ning Quan
Jingyi Wang, Xi Zheng, Yijia Jiang, Huimiao Jia, Xiaocui Shi, Yue Han, Qingping Li, Wenxiong Li
Surgical Intensive Care Unit, Beijing Chaoyang Hospital, Capital Medical University, Beijing, People’s Republic of China
Correspondence: Wenxiong Li, Surgical Intensive Care Unit, Beijing Chaoyang Hospital, Capital Medical University, 8 Gongren Tiyuchang Nanlu, Chaoyang District, Beijing, 100020, People’s Republic of China, Tel +86 13601097813, Email [email protected]
Purpose: Programmed cell death protein 1 (PD-1) and programmed death-ligand 1 (PD-L1) have been detected in injury kidney. However, their expressions are unclear in mice kidneys under renal ischemia-reperfusion injury (IRI). In this study, we would observe the expressions of PD-1 and PD-L1 in kidney tissues and analyze the association between the concentrations of PD-1 and PD-L1 in mouse kidney homogenate and the corresponding concentrations of soluble PD-1 (sPD-1) and soluble PD-L1 (sPD-L1) in plasma after renal IRI. Further, we explored the predictive value of sPD-1 and sPD-L1 for acute kidney injury (AKI) in high-risk patients after surgery.
Methods: This study established an AKI model induced by IRI in mice. Plasma, kidney samples, and homogenate were collected 0h, 24h, and 48h after surgery for immunohistochemistry and enzyme-linked immunosorbent assay. Then, we continuously enrolled 88 AKI high-risk patients who underwent noncardiac surgery. The biomarkers, including sPD-1, sPD-L1, and urine neutrophil gelatinase-associated lipocalin (NGAL), tissue inhibitor of metalloproteinase-2 (TIMP-2), insulin-like growth factor-binding protein 7 (IGFBP7), were detected immediately after surgery.
Results: Our data revealed the concentrations of PD-1 and PD-L1 in kidney homogenate, and sPD-1 and sPD-L1 in plasma significantly increased at 0h, 24h, and 48h after IRI. A positive association was found between PD-1 and sPD-1 (r = 0.774, p < 0.001), and between PD-L1 and sPD-L1 (r = 0.881, p < 0.001). Compared to NGAL, [TIMP-2]*[IGFBP7], sPD-1 and sPD-L1 showed better predictive abilities for AKI with an area under the ROC curve of 0.856 (95% confidence interval [CI]: 0.825– 0.958, p < 0.001) and 0.906 (95% CI: 0.764– 0.921, p < 0.001).
Conclusion: The increased expressions of PD-1 and PD-L1 in kidneys under IRI suggested they may play essential roles in AKI development. sPD-1 and sPD-L1 can indirectly reflect the expressions of PD-1 and PD-L1 in kidneys, respectively. sPD-1 and sPD-L1 showed excellent predictive ability for AKI in high-risk patients.
Keywords: acute kidney injury, ischemia-reperfusion injury, programmed cell death protein 1, programmed death-ligand 1
Introduction
Acute kidney injury (AKI) is characterized by a sudden decrease in glomerular filtration rate, manifested by increased serum creatinine or oliguria.1 After ICU admission, 74.2% of patients have an episode of AKI, which incurs a significantly increased length of stay and risk of mortality.2–4 Postoperative AKI affects approximately one-fifth of patients after major surgery.5 Ischemia-reperfusion injury (IRI) is a common cause of AKI after surgery. Due to intraoperative hypotension and hypovolemia, transient ischemia is the most important risk factor for postoperative AKI.6 These acute ischemia will cause the detachment and death of proximal tubular epithelial cells.7–9 Meanwhile, inflammatory mediators released during major surgery cause increased capillary permeability and vascular leak, thus increasing edema,10 which damages local renal blood flow, aggravates tubular ischemia. These processes, along with endothelial cell injury or immunologic alteration, contribute to the pathophysiological consequences of ischemic AKI.11
Programmed death ligand 1 (PD-L1), as the transmembrane protein, is widely expressed in immune cells and non-immune cells.12 Some studies have shown that renal epithelial cells can express PD-L1 under some stimulation.13,14 IFN-γ, IFN-β are able to exert a major up-regulation of PD-L1 expression on primary human renal proximal tubule epithelial cells.14 Programmed cell death protein 1 (PD-1) is an inhibitory receptor expressed by various activated immune cells such as lymphocytes, monocytes, and dendritic cells.12 Positive staining for PD-1 could be detected in infiltrating lymphocytes in renal interstitial space in the mouse nephritis model.15,16 Therefore, we speculated that the expressions of PD-L1 and PD-1 in kidney tissue play important roles after renal ischemia-reperfusion injury.
Soluble PD-1 (sPD-1) and PD-L1 (sPD-L1) in plasma could reflect PD-1 and PD-L1 levels in vivo to some extent, respectively.17,18 Liu et al found that sPD-L1 could be an important biomarker to predict 28-day mortality in patients with sepsis, with similar accuracy as acute physiology and chronic health evaluation (APACHE II) and sequential organ failure assessment (SOFA) score.19 In this study, we try to establish an animal model induced by renal IRI to observe the expressions of PD-1 and PD-L1 in kidney tissue and analyze the association between the concentrations of PD-1 and PD-L1 in kidney homogenate and the corresponding concentrations of sPD-1 and sPD-L1 in plasma. Further, we explore the predictive value of sPD-1 and sPD-L1 for AKI in high-risk patients after major surgery.
Materials and Methods
Animal Experiments
Animals
Female adult Balb/c mice (Charles River Laboratories, bodyweight 20±2 g) were used and kept in separate cages. The feeding environment was specific pathogen-free. The mice were maintained under a 12 h light/dark cycle at 23.6°C and humidity with free access to sterilized chow diet and water. All procedures complied with the ARRIVE guidelines and the National Institutes of Health Guidelines for the Care and Use of Laboratory Animals. This study was approved by the Capital Medical University Ethics Committee (approval no. AEEI-2021-314).
Renal IRI Model
Bilateral renal ischemia was induced as described.20 Briefly, after being anesthetized, the mice made bilateral back incisions, and both renal pedicles were dissected. Bilateral kidneys were observed to change from bright red to pale and then turn to dark red. After 25 minutes of ischemia, the clamps were removed and the kidneys changed from dark red to bright red. This time point was defined as IRI 0h. For sham animals, renal pedicles were isolated but not clamped. Both kidneys were removed at 0 h, 24 h, and 48 h after surgery. Thirty-one mice were divided into three groups: control (n=1), sham (n=15), IRI (n=15). Five mice were needed for each time point in the sham and IRI groups.
Histopathology
Tubular necrosis in the outer medulla region of the kidney was observed under × 200 magnification, assessed by hematoxylin and eosin (HE) staining, as reported before.21–23 The left kidney of the mouse was fixed with 10% paraformaldehyde solution. Renal tissue specimen was embedded with paraffin wax and sliced for HE staining. Histopathological studies were performed under a light microscope. Slides were examined by a histopathologist who was blinded to the experiment. All specimens were examined for morphological parameters, including epithelial cell vacuolization, tubular cell flattening, degeneration, tubular dilatation, hyaline cast, and debris materials in tubular lumen on a semi-quantitative score from 1 to 5, while the score of zero was assigned to the normal tissue without damage.24
Immunohistochemistry
Paraffin-embedded sections of methanol-Carnoy fixed tissue were stained for PD-1 and PD-L1. After being deparaffinized and hydrated, tissue slices were incubated for 10 minutes with 3% H2O2. Then, samples were incubated with antibodies (AF7695 for PD-1; AF7710 for PD-L1, A0208 for secondary antibodies; Beyotime, Shanghai, China) at 37°C. Then, the slices were treated using 3,3’-diaminobenzidine substrate (Thermo Fisher Scientific) and counterstained with hematoxylin. The positive cells were brownish-yellow cytoplasm or cell membrane. Histologic morphometry for PD-1 and PD-L1 was performed with an ImageJ v 1.53. The results are expressed as the mean percentage of area ± standard deviation (SD).
Enzyme-Linked Immunosorbent Assay (ELISA)
The right kidney was subjected to ELISA analysis. One hundred milligrams of kidney sample was treated with 1mL of phosphate-buffered saline and stored overnight at −20°C. After two freeze–thaw cycles to break the cell membranes, the homogenates were centrifuged for 5 minutes at 5000g, 4°C. The supernate was removed and detected immediately. Blood samples were centrifuged for 15 minutes at 1000g at 4°C with 30 minutes of collection. Protein levels of PD-1 and PD-L1 in kidney homogenates and plasma were assayed with the sandwich immunoassay Multispot Cytokine Assay (CSB-E13586m, CSB-EL004911MO, Cusabio, Wuhan, China), according to the manufacturer’s protocol.
Clinical Study
Study Setting and Population
The present study was conducted in a 20-bed Surgical ICU of Beijing Chaoyang Hospital from January 1, 2020, and October 31, 2020. The study was designed, performed, and reported according to the reporting standards of diagnostic accuracy guidelines, which were approved by the human ethics committee of Beijing Chaoyang Hospital of Capital Medical University (approval no. 2020-ke-236), and written informed consent was obtained from each individual. This study was conducted in accordance with the Declaration of Helsinki and has been registered in Chinese Clinical Trial Registry (approval no. ChiCTR2000034401).
We continuously screened patients who were expected to stay in the ICU for more than 48 hours after noncardiac surgery. Patients who were enrolled met at least one of the following high-risk factors for AKI described by KDIGO (Kidney Disease: Improving Global Outcomes): 1) sepsis; 2) requiring vasopressor or mechanical ventilation; 3) severe trauma; 4) circulatory shock.25 The exclusion criteria included age <18 years, development of AKI before ICU admission, insufficient data or blood samples, chronic kidney disease (CKD); nephrectomy or renal transplantation, not transferred to ICU immediately after surgery.
Clinical Endpoint and Definitions
The primary endpoint was the occurrence of AKI within 72 hours after surgery. The definition and classification of AKI are based on the standard of serum creatinine (SCr) or urine output (UO) proposed by KIDGO.25 CKD was defined according to the National Kidney Foundation standard, and the estimated glomerular filtration rate (GFR) was <60 mL/min/1.73 m2 for at least 3 months, regardless of any reason.26
Data Collection
Demographic information and clinical data include baseline SCr, use of nephrotoxic drugs (angiotensin-converting enzyme inhibitors, aminoglycosides, non-steroidal anti-inflammatory drugs), comorbidities, surgery, and length of ICU and hospital stays were prospectively collected during hospitalization and recorded in the case report forms. Blood lactate, use of vasopressor (including dopamine, epinephrine, norepinephrine, and vasopressin), mechanical ventilation, APACHE II, and SOFA scores on the day of ICU admission were recorded. Serum creatinine was detected and recorded at ICU admission and every 12 h after that until the third day after ICU admission. UO was measured hourly from the urinary catheter within 72 h after ICU admission.
Sample and Laboratory Analysis
Blood and urine samples were collected immediately after surgery. The collected samples were allowed to stand for 30 minutes, then centrifuged at 3000 rpm at 4 °C for 10 minutes, and the supernatant was stored at –80 °C.
The concentrations of urine neutrophil gelatinase-associated lipocalin (NGAL) (CSB-E09408h, Cusabio, Wuhan, China), urine tissue inhibitor of metalloproteinase-1 (TIMP-2) (DTM200, R&D Systems, Minneapolis, MN, USA), urine insulin-like growth factor-binding protein 7 (IGFBP7) (ARG81498, Arigo Biolaboratories, Shanghai, China), plasma sPD-1 (CSB-E13643h, Cusabio, Wuhan, China) and sPD-L1 (CSB-E13644h, Cusabio, Wuhan, China) were measured by commercial ELISA kits. The testing process was carried out in full accordance with the instructions, and the testers turned a blind eye to the clinical data, and the competent physician turned a blind eye to the biomarker test results.
Statistical Analysis
The obtained results were analyzed with the SPSS statistics 24 (IBM, Chicago, IL, USA), GraphPad Prism 5.0 (GraphPad Software, San Diego, USA), MedCalc v. 16.4.3 (MedCalc Software bvba, Ostend, Belgium), and R 4.1.1 (R Project for Statistical Computing, Vienna, Austria). Continuous variables were presented as mean ± SD or median of the 25th and 75th percentiles (interquartile range [IQR]), categorical variables were presented as percentiles. Continuous data between two groups were compared using the Unpaired Student’s t-test. When not following the normal distribution, nonparametric statistical analyses were applied. The Mann–Whitney test was used to compare two independent samples. Categorical variables used the Chi-square test. Correlation coefficients were obtained by applying Spearman’s rank correlation.
Logistic regression analysis was performed to find out the risk factors of AKI development. A receiver operating characteristic (ROC) curve was used to evaluate the predictive value of biomarkers. The optimal cutoff value was determined by the Youden index. To compare the predictive performance of the clinical risk model before and after adding different biomarkers, we calculated the statistical significance of the difference between the area under the ROC curve (AUC) values with the method of DeLong.27 Besides, we evaluated the improvement in the predictive accuracy of the models by calculating the relative integrated discrimination improvement (IDI) and the net reclassification improvement (NRI), as described by Pencina.28 We also used decision curve analysis (DCA), estimating the new predictive models’ clinical usefulness and net benefit, as described by Vickers.29 This analysis identifies patients at risk of AKI based on the clinical prediction model with and without biomarkers. For all analyses, p<0.05 was considered statistically significant.
Results
Expressions of PD-1 and PD-L1 in the Mice Kidney
Pathological analysis showed that the structure of renal tubular epithelial cells in the control group (Supplementary Figure 1A) and sham group (Supplementary Figure 1B) was normal, and there were no obvious abnormal changes in the glomerulus and renal tubules. After surgery, IRI mice showed apparent renal tissue injury, swelling of renal tubular epithelial cells, expansion of lumen, the disappearance of brush edge, disordered and lost arrangement of the renal tubular structure, stenosis of interstitial part, infiltration of inflammatory cells, and significantly increased protein cast (Supplementary Figure 1C). IRI mice greatly enhanced the acute tubular necrosis scores compared to the sham group at 0 h, 24 h, 48 h after surgery, respectively. The pathology damage scores in all experimental groups were demonstrated (Supplementary Figure 1D).
The increased depositions of PD-1 (Figure 1A–D) and PD-L1 (Figure 2A–D) in mice kidneys were observed in the IRI group compared to the sham group at 0 h, 24 h, and 48 h after surgery, respectively. Immunohistochemistry showed PD-1 was primarily expressed in the renal interstitium (Figure 1A–C), and PD-L1 (Figure 2A–C) was present in tubular epithelial cells.
 |
Figure 1 The expression of PD-1 in kidney tissue of mice. The IHC of PD-1 was shown in control groups (A), sham groups (B) and IRI groups (C). Quantification is represented in panel (D). Data are expressed as mean ± standard deviation. Difference between IRI group and sham group was made using unpaired Student’s t-test for normally distributed data. Images, × 200; original scale bar, 100 μm. **p<0.01. ***p<0.001. Abbreviations: PD-1, programmed cell death protein 1; IRI, ischemia-reperfusion injury; IHC, immunohistochemistry. |
 |
Figure 2 The expression of PD-L1 in kidney tissue of mice. The IHC of PD-L1 was shown in control groups (A), sham groups (B) and IRI groups (C). Quantification is represented in panel (D). Data are expressed as mean ± standard deviation. Difference between IRI group and sham group was made using unpaired Student’s t-test for normally distributed data. Images, × 200; original scale bar, 100 μm. **p<0.01. ***p<0.001. Images, × 200; original scale bar, 100 μm. Abbreviations: PD-L1, programmed death-ligand 1; IRI, ischemia-reperfusion injury; IHC, immunohistochemistry. |
Spearman’s Rank Correlation
The concentrations of sPD-1, sPD-L1 in plasma and PD-1, PD-L1 in kidney homogenate are shown in Figure 3A. The Spearman’s rank correlation showed sPD-1 concentration in plasma increased correspondingly with PD-1 concentration in kidney homogenate (r=0.774, p<0.001), sPD-L1 in plasma also showed a positive correlation with PD-L1 in kidney homogenate (r=0.881, p<0.001) (Figure 3B).
 |
Figure 3 The concentrations of sPD-1 and sPD-L1 in plasma and the concentrations of PD-1 and PD-L1 in kidney homogenate (A). Correlation was shown between sPD-1 in plasma and PD-1 in kidney homogenate (r = 0.774, p<0.001) (B), between sPD-L1 in plasma and PD-L1 in kidney homogenate (r = 0.881 p<0.001) (B) using Spearman’s test. Abbreviations: PD-1, programmed cell death protein 1; PD-L1, programmed death-ligand 1; IRI, ischemia-reperfusion injury. |
Patient Characteristics and Outcomes
During the study, 232 patients who underwent noncardiac surgery were screened. After excluding the ineligible patients, 88 patients had at least 1 recognized risk factor for AKI. Eighteen (20%) patients developed AKI within 72 hours after enrollment. Their characteristics and outcomes are shown in Table 1. Patients with AKI development had more extended ICU stay, hospital stay, and duration of mechanical ventilation than patients without AKI development. ICU mortality and hospital mortality were significantly higher in patients with AKI development than patients without AKI development (Table 1).
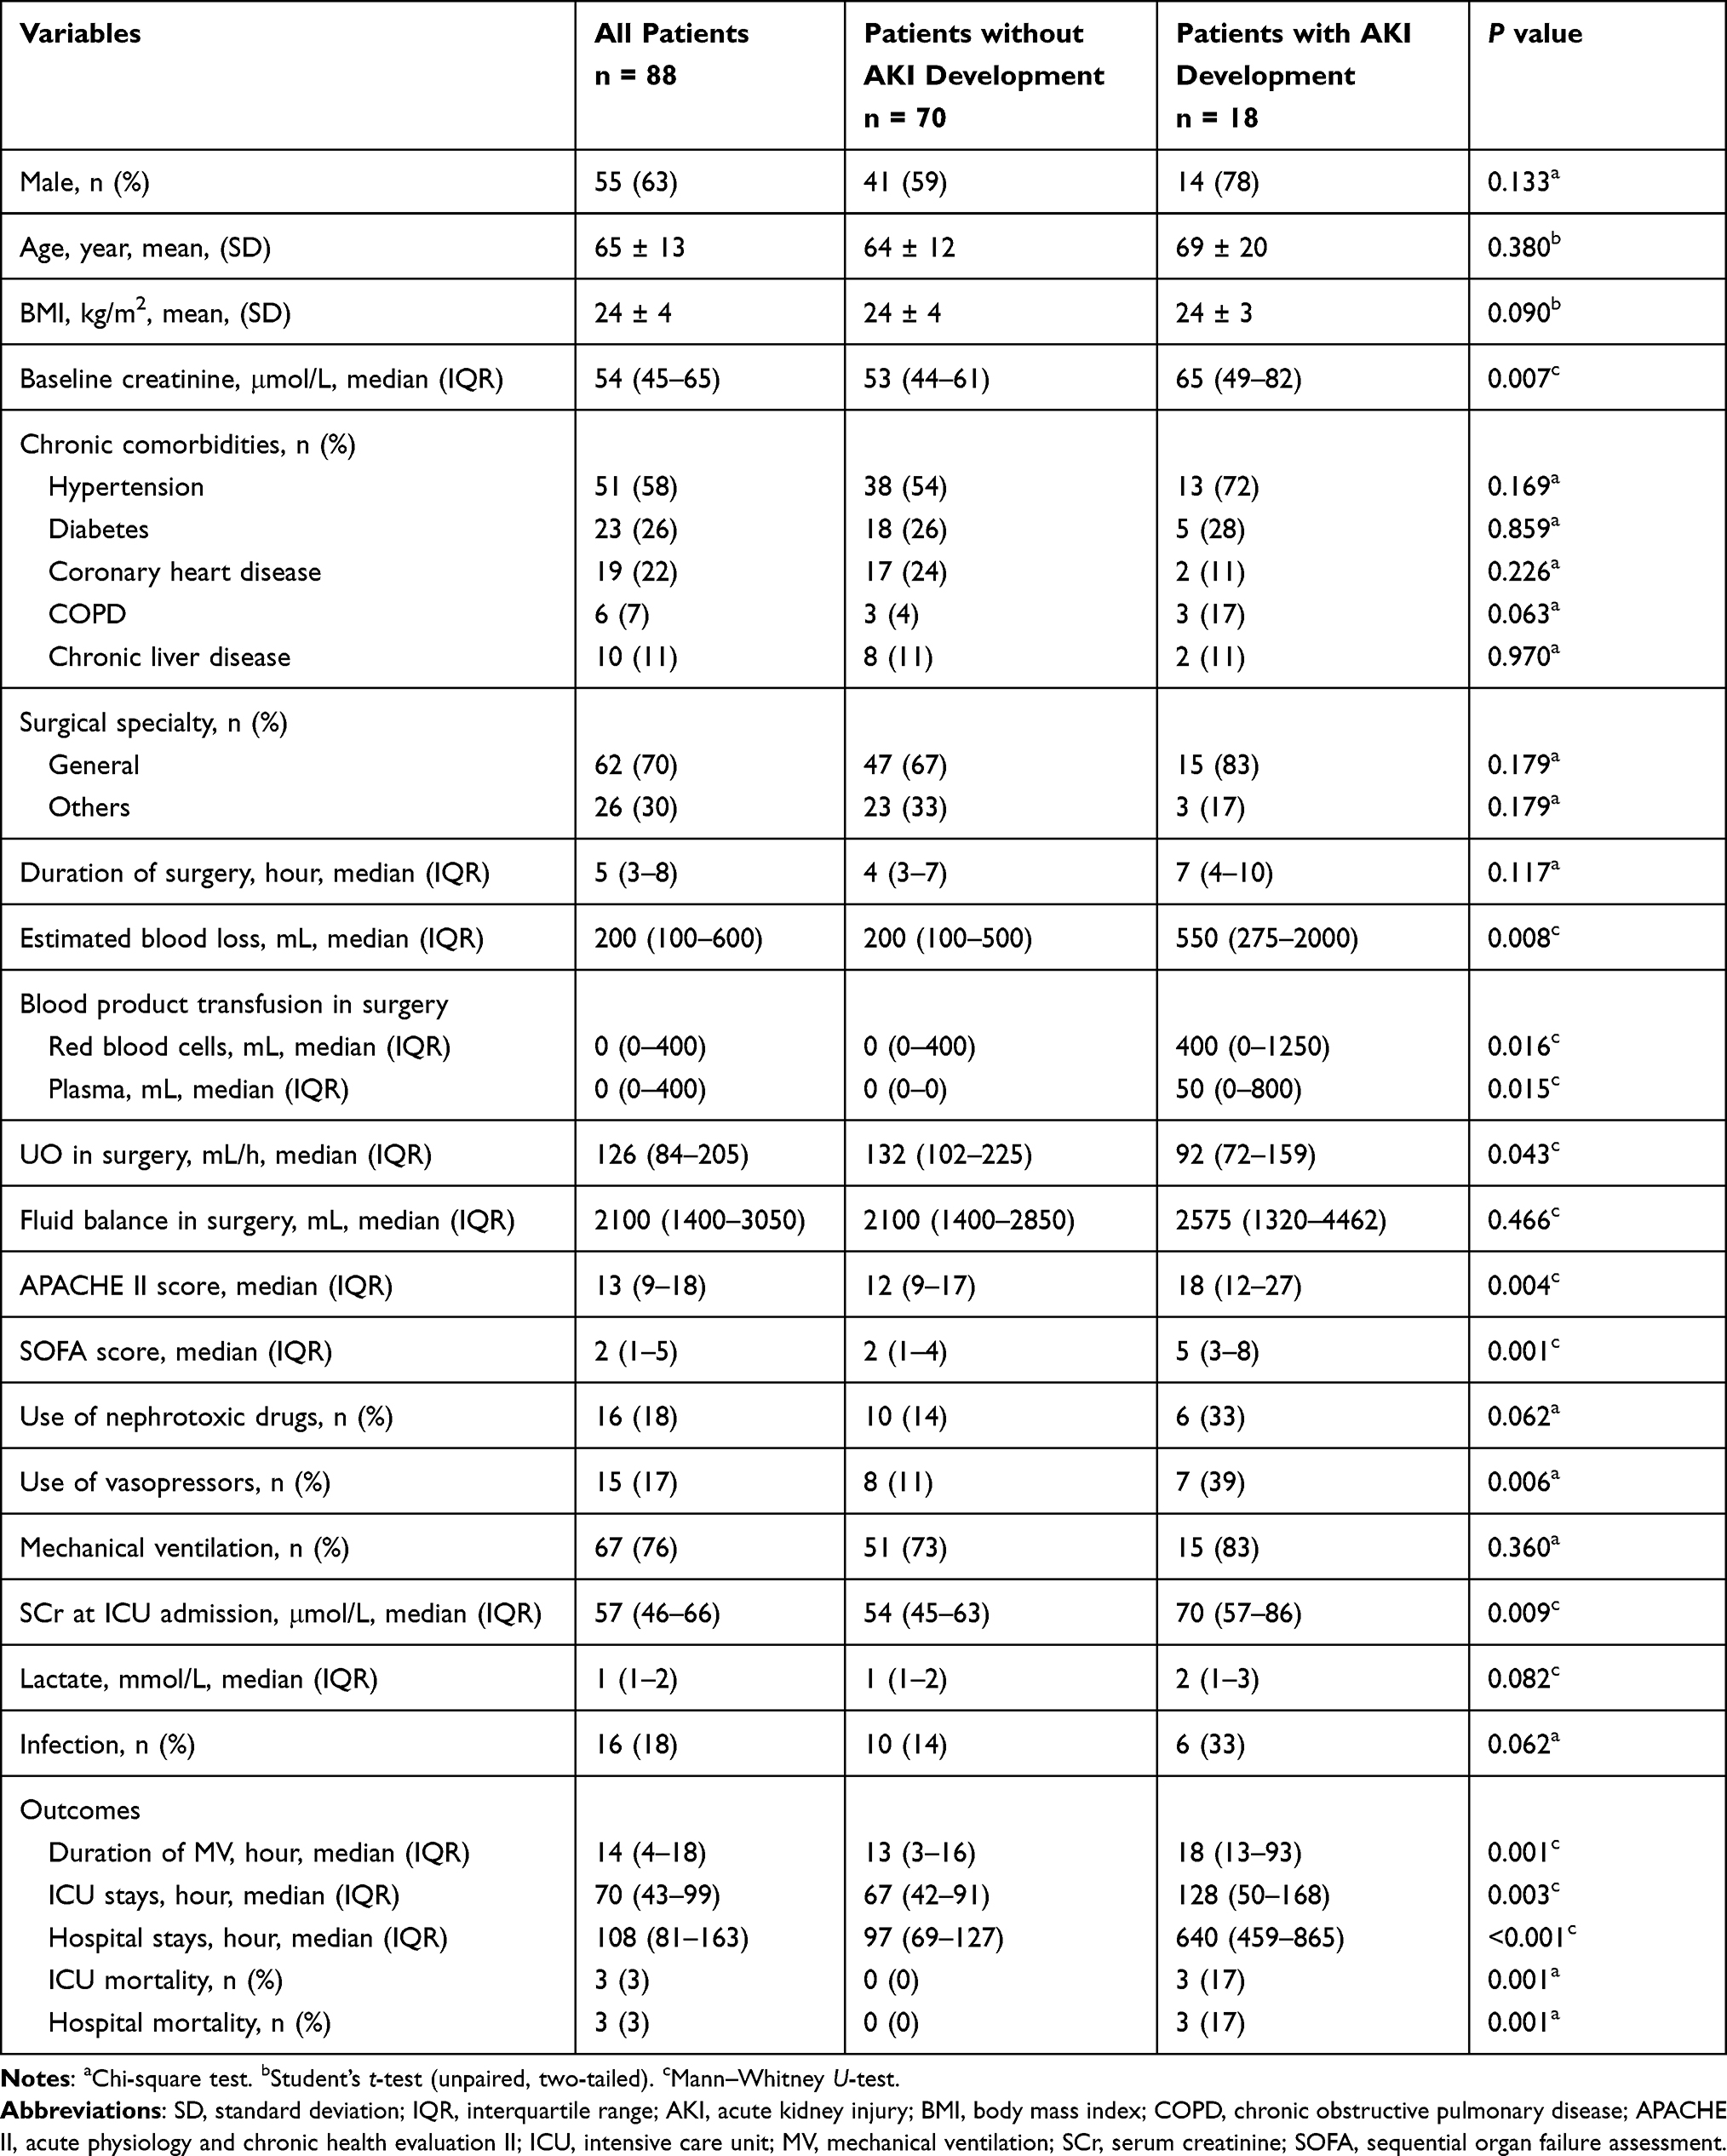 |
Table 1 Baseline Characteristics and Outcomes of Patients with or without AKI Development |
Predictive Performance of sPD-1 and sPD-L1 for AKI Compared to Other Biomarkers
The concentrations of plasma sPD-1, sPD-L1, and urine NGAL, [TIMP-2]*[IGFBP7] (the product of TIMP-2 and IGFBP7) were significantly higher in the patients with AKI development compared with the patients without AKI, respectively (Table 2). The univariate logistic regression analysis showed sPD-1, sPD-L1, and urine NGAL, [TIMP-2]*[IGFBP7] were independent risk factors for AKI development. sPD-L1 and sPD-1 had an AUC of 0.906 (95% confidence interval [CI]: 0.825–0.958, p<0.001) and 0.856 (95% CI: 0.764–0.921, p<0.001) for predicting AKI, respectively, with corresponding cutoff values of 49.513 pg/mL and 105.161 pg/mL (Figure 4A), showing higher performance than other biomarkers. In contrast, urine NGAL and [TIMP-2]*[IGFBP7] showed lower performance with AUCs of 0.660 (95% CI: 0.551–0.757, p=0.038), 0.675 (95% CI: 0.541–0.810, p=0.022), respectively (Supplementary Table 1). The specificity and sensitivity of all biomarkers for predicting AKI were showed in Supplementary Table 1.
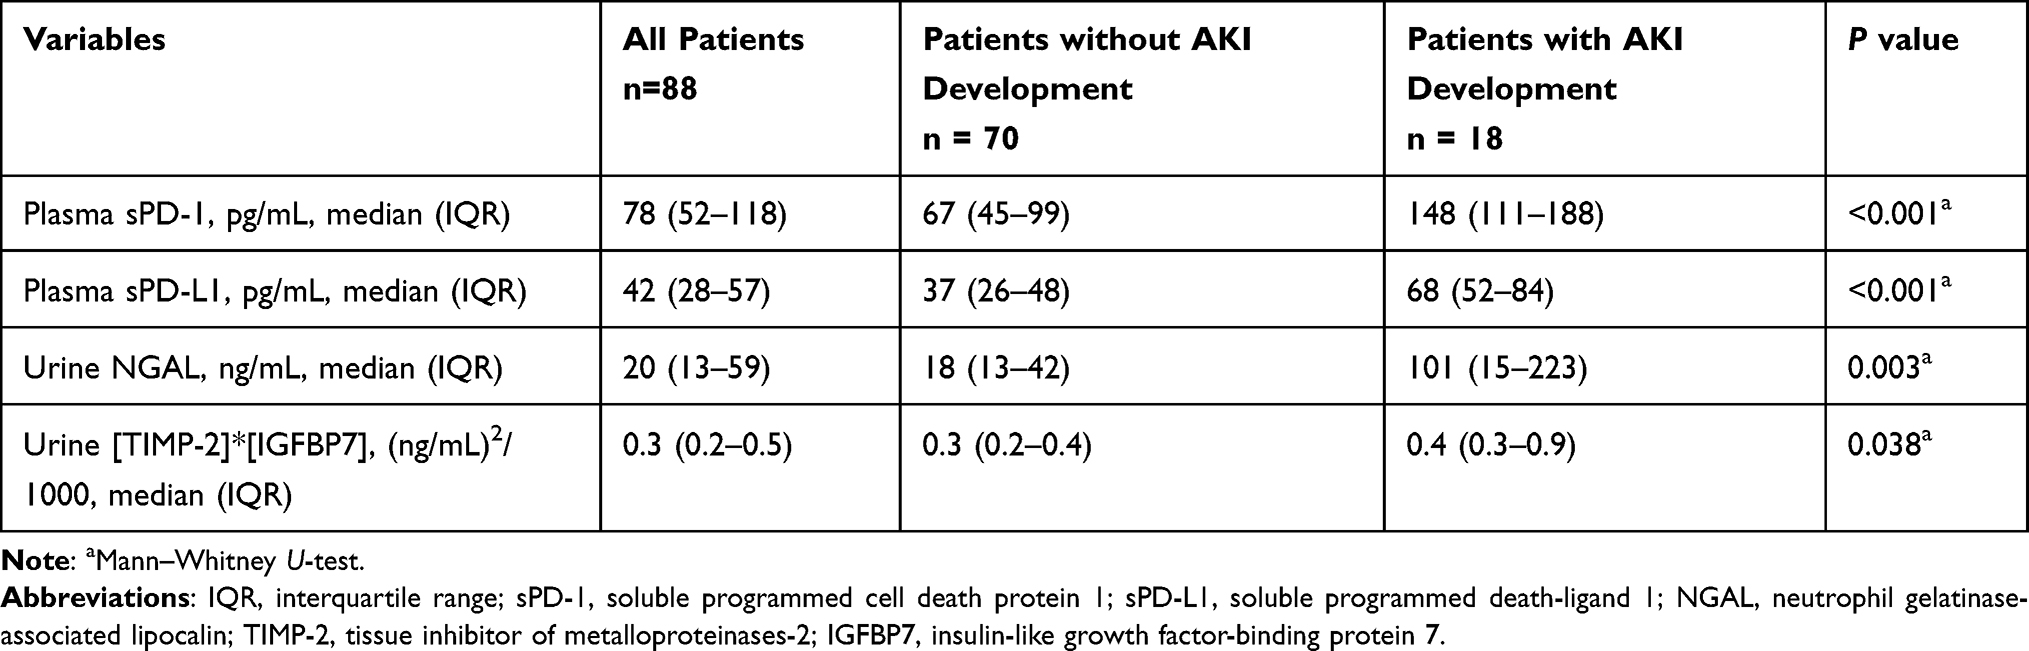 |
Table 2 Levels of sPD-1, sPD-L1 and Other Biomarkers in Patients with or without AKI Development |
 |
Figure 4 Predictive value of sPD-1 and sPD-L1 for AKI in high-risk patients after surgery. ROCs of sPD-1 and sPD-L1 (A) were shown; ROCs of clinic model and clinic model combined biomarkers (B) were shown. Abbreviations: sPD-1, soluble programmed cell death protein 1; sPD-L1, soluble programmed death-ligand 1. |
Predictive Superiority of Plasma sPD-1 and sPD-L1 Over Other Biomarkers in the AKI Risk Model
The univariate logistic regression analysis showed that baseline creatinine, estimated blood loss, use of vasopressors, SOFA score, APACHE II score, and SCr at ICU admission were associated with AKI development. Of these variables, APACHE II score and SCr at ICU admission were retained for the final model (Supplementary Table 2). The calibration of the model is confirmed with the Hosmer–Lemeshow goodness-of-fit test (p>0.05). This clinical model predicted AKI with an AUC of 0.787 (95% CI: 0.686–0.868, p<0.001) (Figure 4B).
To evaluate the improvement of risk prediction with the addition of biomarkers to the established clinical model, we determined DeLong’s test, the NRI, and the IDI indices (Table 3). The inclusion of sPD-1 or sPD-L1 respectively improved the predictive ability of the clinical model for AKI (Figure 4B), supported by NRI (0.291 for sPD-1, 95% CI: 0.068–0.513, p=0.011; 0.375 for sPD-L1, 95% CI: 0.148–0.602, p=0.001), IDI (0.215 for sPD-1, 95% CI: 0.065–0.365, p=0.005; 0.263 for sPD-L1, 95% CI: 0.135–0.390, p<0.001) and DeLong’s test (p=0.007 for sPD-1; p=0.026 for sPD-L1) (Table 3). In contrast, the model was not improved by adding NGAL or [TIMP-2]*[IGFBP7]. The predictive accuracy can be improved when sPD-1 or sPD-L1 combined with clinical risk factors of AKI, including APACHE II score and SCr at ICU admission. Multivariate logistic regression analysis calculated the probability for AKI development basing on clinic-sPD-1 and clinic-sPD-L1 risk prediction model: the probability for AKI development = 1/(1+e-z), z = 10.761–0.124×(APACHE II score) - 0.062×(SCr at ICU admission) - 0.033×(sPD-1), and z = 10.964–0.118×(APACHE II score) - 0.046×(SCr at ICU admission) - 0.093×(sPD-L1), respectively.
 |
Table 3 Comparison of the ROC Curves, NRI and IDI of Combination vs Clinic Models in Predicting AKI |
Figure 5 shows the decision curves of five models (clinic, clinic-[TIMP-2]*[IGFBP7], clinic-NGAL, clinic-sPD-1, clinic-sPD-L1) for predicting AKI development. X-axis indicates the threshold probability for AKI development, and the Y-axis indicates the net benefit. A higher net benefit is provided by those prediction models that are farthest away from the slanted dash grey line and the horizontal black line. The clinic-sPD-1 and clinic-sPD-L1 had the similar highest net benefit at 10–40% of the probability threshold, which means, if a patient with a risk of AKI between 10% and 40% warranted further therapy, AKI screening using clinic-sPD-1 or clinic-sPD-L1 might have the most benefit for high-risk patients. The net benefit of the five models tended to be similar with increasing probability threshold, and they showed significant differences at low probability threshold.
 |
Figure 5 Decision curve for prediction of AKI using different prediction models. Abbreviations: AKI, acute kidney injury; sPD-1, soluble programmed cell death protein 1; sPD-L1, soluble programmed death-ligand 1; NGAL, neutrophil gelatinase-associated lipocalin; TIMP-2, tissue inhibitor of metalloproteinases-2; IGFBP7, insulin-like growth factor-binding protein 7. |
Discussion
The kidney is susceptible to blood flow shortage and hypoxia caused by surgery due to its high metabolic activity and vascular anatomy. IRI is a major cause of early postoperative AKI, characterized by uncontrolled renal inflammation and tubular epithelial cell death. In our study, the bilateral renal pedicle was completely clamped by a vascular clamp for 25 minutes, and then the reperfusion model was released. From the observation of HE staining, it could be seen that the renal tubular epithelial cell edema, interstitial thickening, and inflammatory cell infiltration occurred immediately after IRI. It had been demonstrated that T cell was an important modulator of renal IRI.30 Compared to wild-type control mice, CD4/CD8-deficient mice improved recovery from renal IRI, with decreased tubular necrosis and infiltrating neutrophils.31 The mechanisms T cells might mediate renal IRI were not known. Some investigators observed that T cell adhesion on renal tubular epithelial cells was significantly enhanced in the IRI model after exposure of tubular epithelial cells to hypoxia-reoxygenation, which suggested a possible mechanism by which T cells might mediate postischemic renal tubular dysfunction in vivo.31 PD-1 is related to inhibiting lymphocyte activation and can negatively regulate the activation and proliferation of T and B lymphocytes and the production of cytokines.32 In this study, PD-1 and PD-L1 expressions were tested by immunohistochemistry and ELISA. Although PD-1 and PD-L1 were expressed at a low level in normal kidneys, PD-1 and PD-L1 staining were significantly enhanced in IRI kidneys of mice. In addition, the concentrations of PD-1 and PD-L1 in IRI kidney homogenate were significantly higher than that in normal kidneys. Therefore, it is suggested that the PD-1/PD-L1 pathway may play an important role in renal IRI.33,34
This study observed that PD-L1 expression was primarily restricted to proximal tubules, and PD-1 was predominantly expressed in the tubulointerstitial space. As reported by others, in renal biopsies from patients with type IV lupus nephritis, there was intense staining for PD-L1 mRNA and protein in proximal tubules, especially in areas of mononuclear infiltration, and intense PD-1 staining was also detected in infiltrating mononuclear and lymphocytes cells in the vicinity of proximal tubules.35 Therefore, it is likely that PD-L1 in tubular epithelial cells interacts with PD-1 on infiltrated lymphocytes during renal IRI. It seems that the up-regulation of PD-1 and PD-L1 may be due to the local immune response caused by over-activated T cells exuding into the renal tubulointerstitium during IRI. For self-protection, the expression of PD-L1 in renal tubular epithelial cells was up-regulated and combined with PD-1 on the surface of exudative T cells, which was conducive to limiting the excessive damage of inflammation and regulating the homeostasis of exudative effector T cells and memory T cells.32,36
It is not feasible to obtain the patient’s kidney tissue for relevant assays in clinical practice. Therefore, we first explored the relationship between sPD-1 in plasma and PD-1 in kidney homogenate, between sPD-L1 in plasma and PD-L1 in kidney homogenate in animal experiments. We found that the concentrations of PD-1 and PD-L1 in kidney tissue correlated positively with corresponding sPD-1 and sPD-L1 in plasma, which made sPD-1 and sPD-L1 possible biomarkers for predicting AKI development after surgery among high-risk patients.
We used sPD-1 and sPD-L1 in plasma as biomarkers for the first time to investigate their predictive capacity on AKI development after surgery in high-risk patients. Our study found that concentrations of sPD-1 and sPD-L1 in plasma were significantly higher in patients who developed AKI after noncardiac surgery than in patients without AKI development, and sPD-1 and sPD-L1 were independently associated with the occurrence of AKI. At present, the most widely used biomarkers for predicting AKI are urine TIMP-2 and IGFBP7, which express in tubular cells in response to DNA damage and are markers for G1 arrest. Urine [TIMP-2]*[IGFBP7] showed excellent ability to predict AKI, which is already approved by FDA and commercially available in the United States. However, FDA also indicated that [TIMP-2]*[IGFBP7] had false-positive results, and they will be magnified if the test is used inappropriately in low-risk patients. NGAL is regarded as the early kidney tubular damage biomarkers, which concentration reaches a peak approximately 6 hours after tubular injury and follows a dose–response curve to injury severity.37,38 However, NGAL expression lacks specificity as a biomarker. The performance of NGAL as a diagnostic biomarker for AKI has been evaluated in adult cardiac surgery, emergency patients, or critically ill patients.39–44 In these settings, the AUC varied significantly depending on confounding factors such as biomarker sampling timing for AKI diagnosis, sample material, and population.45–48 NGAL increases with age and infection and is higher in females. And its diagnostic accuracy increases with the increase of AKI severity. However, most AKI patients in our cohort had only mild kidney injury, and the rise in NGAL expression was relatively insignificant. Notably, sPD-L1 and sPD-1 had excellent predictive abilities for AKI in postoperative high-risk patients, with corresponding AUC of 0.906 and 0.856, which were superior to urine [TIMP-2]*[IGFBP7] and NGAL.
Based on our study results, we believe that PD-L1 and PD-1 play important roles in the development of postoperative AKI, and sPD-L1 and sPD-1 are promising biomarkers for predicting postoperative AKI, which may guide the implementation of preventive measures (optimization of fluid resuscitation and individualized hemodynamic parameters, etc) in high-risk patients. Further studies are needed to study the active mechanism of PD-L1 and PD-1 in AKI and validate their applicable values in the future.
Our study had some limitations. Firstly, other diseases can also affect plasma concentrations of sPD-1 and sPD-L1. In future research, the effects of other diseases (CKD, sepsis, cancer, etc) on plasma concentrations of sPD-1 and sPD-L1 need to be further assessed in larger populations. Secondly, we did not have a validation cohort to confirm the predictive value of sPD-L1 and sPD-L1, which should be addressed in future studies. Additionally, we did not discuss immune checkpoint inhibitors in this study, which will be our direction in clinical research and animal experiments in the future.
Conclusion
The increased expressions of PD-1 and PD-L1 in kidney tissue of renal IRI mice suggest that they may play important roles in the development of AKI. sPD-1 and sPD-L1 can indirectly reflect the expressions of PD-1 and PD-L1 in kidney tissue, respectively. sPD-L1 and sPD-1 are independent risk factors of AKI development, which show excellent predictive ability for postoperative AKI in high-risk patients. The predictive accuracy can be improved when sPD-1, sPD-L1 combined with clinical factors of serum creatinine at ICU admission and APACHE II score.
Abbreviations
PD-1, programmed cell death protein 1; PD-L1, programmed death-ligand 1; sPD-1, soluble programmed cell death protein 1; sPD-1, soluble programmed death-ligand 1; IRI, ischemia-reperfusion injury; AKI, acute kidney injury; NGAL, neutrophil gelatinase-associated lipocalin; TIMP-2, tissue inhibitor of metalloproteinase-2; IGFBP7, insulin-like growth factor-binding protein 7; SD, standard deviation; KDIGO, Kidney Disease: Improving Global Outcomes; CKD, chronic kidney disease; UO, urine output; SCr, serum creatinine; ROC, receiver operating characteristic; DCA, decision curve analysis; IDI, integrated discrimination improvement; NRI, net reclassification improvement; HE, hematoxylin and eosin; IHC, immunohistochemistry; GFR, glomerular filtration rate; IQR, interquartile range; COPD, chronic obstructive pulmonary disease; BMI, body mass index; ICU, Intensive care unit; APACHE II, acute physiology and chronic health evaluation II; SOFA, sequential organ failure assessment; AUC, area under the receiver operating characteristic curve; MV, mechanical ventilation.
Data Sharing Statement
The datasets used and/or analyzed during the current study are available from the corresponding author on reasonable request.
Ethics Approval
The animal experiment in this study was approved by the Capital Medical University Ethics Committee on the use of animals in research and education (approval no. AEEI-2021-314). The human experiment in this study was approved by the human ethics committee of Beijing Chaoyang Hospital of Capital Medical University (approval no. 2020-ke-236). The clinical study has been registered in Chinese Clinical Trial Registry (approval no. ChiCTR2000034401).
Consent for Publication
All authors agreed to the publication of this research.
Acknowledgments
We thank the medical research center of Beijing Chaoyang Hospital for providing the experimental place and the related software used in this research. We thank the Charles River Laboratories provided the mice.
Author Contributions
All authors contributed to data analysis, drafting or revising the article, gave final approval of the version to be published, agreed to the submitted journal, and agree to be accountable for all aspects of the work.
Funding
This study was supported by Capital’s Funds for Health improvement and research (approval no. 2020-2-2061) and Beijing Key Clinical Speciality Excellence Project.
Disclosure
The authors report no conflicts of interest or financial disclosure in this work.
References
1. Levey AS, James MT. Acute kidney injury. Ann Intern Med. 2017;167(9):ITC66–ITC80. doi:10.7326/AITC201711070
2. Ülger F, Pehlivanlar Küçük M, Küçük AO, et al. Evaluation of acute kidney injury (AKI) with RIFLE, AKIN, CK, and KDIGO in critically ill trauma patients. Eur J Trauma Emerg Surg. 2018;44(4):597–605. doi:10.1007/s00068-017-0820-8
3. Oweis AO, Alshelleh SA, Momany SM, Samrah SM, Khassawneh BY, Al Ali MAK. Incidence, risk factors, and outcome of acute kidney injury in the intensive care unit: a single-center study from Jordan. Crit Care Res Pract. 2020;2020:8753764. doi:10.1155/2020/8753764
4. Cohen SD, Kimmel PL. Long-term sequelae of acute kidney injury in the ICU. Curr Opin Crit Care. 2012;18(6):623–628. doi:10.1097/MCC.0b013e328358d3f5
5. Vaara ST, Bellomo R. Postoperative renal dysfunction after noncardiac surgery. Curr Opin Crit Care. 2017;23(5):440–446. doi:10.1097/MCC.0000000000000439
6. Schmid S, Kapfer B, Heim M, et al. Algorithm-guided goal-directed haemodynamic therapy does not improve renal function after major abdominal surgery compared to good standard clinical care: a prospective randomised trial. Crit Care. 2016;20:50. doi:10.1186/s13054-016-1237-1
7. Priante G, Gianesello L, Ceol M, Del Prete D, Anglani F. Cell death in the kidney. Int J Mol Sci. 2019;20(14):3598. doi:10.3390/ijms20143598
8. Suzuki C, Tanida I, Ohmuraya M, et al. Lack of cathepsin D in the renal proximal tubular cells resulted in increased sensitivity against renal ischemia/reperfusion injury. Int J Mol Sci. 2019;20(7):1711. doi:10.3390/ijms20071711
9. Havasi A, Borkan SC. Apoptosis and acute kidney injury. Kidney Int. 2011;80(1):29–40. doi:10.1038/ki.2011.120
10. Koch A, Zacharowski P, Boehm O, Zacharowski K. Innate immunity, coagulation and surgery. Front Bio Sci. 2009;14:2970–2982. doi:10.2741/3427
11. FPerner A, Prowle J, Joannidis M, Young P, Hjortrup PB, Pettilä V. Fluid management in acute kidney injury. Intensive Care Med. 2017;43(6):807–815. doi:10.1007/s00134-017-4817-x
12. Chamoto K, Al-Habsi M, Honjo T. Role of PD-1 in immunity and diseases. Curr Top Microbiol Immunol. 2017;410:75–97. doi:10.1007/82_2017_67
13. Lai KN, Leung JC, Chan LY, Guo H, Tang SC. Interaction between proximal tubular epithelial cells and infiltrating monocytes/T cells in the proteinuric state. Kidney Int. 2007;71(6):526–538. doi:10.1038/sj.ki.5002091
14. Wilkinson R, Wang X, Roper KE, Healy H. Activated human renal tubular cells inhibit autologous immune responses. Nephrol Dial Transplant. 2011;26(5):1483–1492. doi:10.1093/ndt/gfq677
15. Mataki N, Kikuchi K, Kawai T, et al. Expression of PD-1, PD-L1, and PD-L2 in the liver in autoimmune liver diseases. Am J Gastroenterol. 2007;102(2):302–312. doi:10.1111/j.1572-0241.2006.00948.x
16. Menke J, Lucas JA, Zeller GC, et al. Programmed death 1 ligand (PD-L) 1 and PD-L2 limit autoimmune kidney disease: distinct roles. J Immunol. 2007;179(11):7466–7477. doi:10.4049/jimmunol.179.11.7466
17. Chen Y, Wang Q, Shi B, et al. Development of a sandwich ELISA for evaluating soluble PD-L1 (CD274) in human sera of different ages as well as supernatants of PD-L1+ cell lines. Cytokine. 2011;56(2):231–238. doi:10.1016/j.cyto.2011.06.004
18. Frigola X, Inman BA, Lohse CM, et al. Identification of a soluble form of B7-H1 that retains immunosuppressive activity and is associated with aggressive renal cell carcinoma. Clin Cancer Res. 2011;17(7):1915–1923. doi:10.1158/1078-0432.CCR-10-0250
19. Liu M, Zhang X, Chen H, et al. Serum sPD-L1, upregulated in sepsis, may reflect disease severity and clinical outcomes in septic patients. Scand J Immunol. 2017;85(1):66–72. doi:10.1111/sji.12509
20. Decuypere JP, Hutchinson S, Monbaliu D, Martinet W, Pirenne J, Jochmans I. Autophagy dynamics and modulation in a rat model of renal Ischemia-reperfusion injury. Int J Mol Sci. 2020;21(19):7185. doi:10.3390/ijms21197185
21. Zhang D, Wang Y, Zeng S, et al. Integrated analysis of prognostic genes associated with ischemia-reperfusion injury in renal transplantation. Front Immunol. 2021;12:747020. doi:10.3389/fimmu.2021.747020
22. Kinsey GR, Huang L, Jaworska K, et al. Autocrine adenosine signaling promotes regulatory T cell-mediated renal protection. J Am Soc Nephrol. 2012;23(9):1528–1537. doi:10.1681/ASN.2012010070
23. Kinsey GR, Huang L, Vergis AL, Li L, Okusa MD. Regulatory T cells contribute to the protective effect of ischemic preconditioning in the kidney. Kidney Int. 2010;77(9):771–780. doi:10.1038/ki.2010.12
24. Sugawara H, Moniwa N, Kuno A, et al. Activation of the angiotensin II receptor promotes autophagy in renal proximal tubular cells and affords protection from ischemia/reperfusion injury. J Pharmacol Sci. 2021;145(2):187–197. doi:10.1016/j.jphs.2020.12.001
25. Palevsky PM, Liu KD, Brophy PD, et al. KDOQI US commentary on the 2012 KDIGO clinical practice guideline for acute kidney injury. Am J Kidney Dis. 2013;61(5):649–672. doi:10.1053/j.ajkd.2013.02.349
26. Bellomo R, Ronco C, Kellum JA, Mehta RL, Palevsky P; Acute Dialysis Quality Initiative workgroup. Acute renal failure - definition, outcome measures, animal models, fluid therapy and information technology needs: the second international consensus conference of the Acute Dialysis Quality Initiative (ADQI) Group. Crit Care. 2004;8(4):R204–R212. doi:10.1186/cc2872
27. DeLong ER, DeLong DM, Clarke-Pearson DL. Comparing the areas under two or more correlated receiver operating characteristic curves: a nonparametric approach. Biometrics. 1988;44(3):837–845. doi:10.2307/2531595
28. Pencina MJ, D’Agostino RB
29. Vickers AJ, Elkin EB. Decision curve analysis: a novel method for evaluating prediction models. Med Decis Making. 2006;26(6):565–574. doi:10.1177/0272989X06295361
30. Burne-Taney MJ, Yokota N, Rabb H. Persistent renal and extrarenal immune changes after severe ischemic injury. Kidney Int. 2013;24(10):1529–1536. doi:10.1681/ASN.2012080784
31. Rabb H, Daniels F, O’Donnell M, et al. Pathophysiological role of T lymphocytes in renal ischemia-reperfusion injury in mice. Am J Physiol Renal Physiol. 2000;279(3):F525–F531. doi:10.1152/ajprenal.2000.279.3.F525
32. Masopust D, Vezys V, Marzo AL, Lefrançois L. Preferential localization of effector memory cells in nonlymphoid tissue. Science. 2001;291(5512):2413–2417. doi:10.1126/science.1058867
33. Zhang J, Chen Y, Li J, et al. Renal tubular epithelial expression of the coinhibitory molecule B7-DC (programmed death-1 ligand). J Nephrol. 2006;19(4):429–438.
34. Chen Y, Zhang J, Li J, et al. Expression of B7-H1 in inflammatory renal tubular epithelial cells. Nephron Exp Nephrol. 2006;102(3–4):e81–e92. doi:10.1159/000089686
35. Ding H, Wu X, Gao W. PD-L1 is expressed by human renal tubular epithelial cells and suppresses T cell cytokine synthesis. Clin Immunol. 2005;115(2):184–191. PMID: 15885642. doi:10.1016/j.clim.2005.01.005
36. Mackay CR. Homing of naive, memory and effector lymphocytes. Curr Opin Immunol. 1993;5(3):423–427. doi:10.1016/0952-7915(93)90063-x
37. Haase-Fielitz A, Bellomo R, Devarajan P, et al. The predictive performance of plasma neutrophil gelatinase-associated lipocalin (NGAL) increases with grade of acute kidney injury. Nephrol Dial Transplant. 2009;24(11):3349–3354. doi:10.1093/ndt/gfp234
38. Mishra J, Dent C, Tarabishi R, et al. Neutrophil gelatinase-associated lipocalin (NGAL) as a biomarker for acute renal injury after cardiac surgery. Lancet. 2005;365(9466):1231–1238. doi:10.1016/S0140-6736(05)74811-X.
39. Parikh CR, Coca SG, Thiessen-Philbrook H, et al. Postoperative biomarkers predict acute kidney injury and poor outcomes after adult cardiac surgery. J Am Soc Nephrol. 2011;22(9):1748–1757. doi:10.1681/ASN.2010121302
40. Di Somma S, Magrini L, De Berardinis B, et al. Additive value of blood neutrophil gelatinase-associated lipocalin to clinical judgement in acute kidney injury diagnosis and mortality prediction in patients hospitalized from the emergency department. Crit Care. 2013;17(1):R29. doi:10.1186/cc12510
41. Nickolas TL, Schmidt-Ott KM, Canetta P, et al. Diagnostic and prognostic stratification in the emergency department using urinary biomarkers of nephron damage: a multicenter prospective cohort study. J Am Coll Cardiol. 2012;59(3):246–255. doi:10.1016/j.jacc.2011.10.854
42. Hjortrup PB, Haase N, Treschow F, Møller MH, Perner A. Predictive value of NGAL for use of renal replacement therapy in patients with severe sepsis. Acta Anaesthesiol Scand. 2015;59(1):25–34. doi:10.1111/aas.12427
43. Mårtensson J, Glassford NJ, Jones S, et al. Urinary neutrophil gelatinase-associated lipocalin to hepcidin ratio as a biomarker of acute kidney injury in intensive care unit patients. Minerva Anestesiol. 2015;81(11):1192–1200.
44. Ralib AM, Pickering JW, Shaw GM, Than MP, George PM, Endre ZH. The clinical utility window for acute kidney injury biomarkers in the critically ill. Crit Care. 2014;18(6):601. doi:10.1186/s13054-014-0601-2
45. Endre ZH, Pickering JW, Walker RJ, et al. Improved performance of urinary biomarkers of acute kidney injury in the critically ill by stratification for injury duration and baseline renal function. Kidney Int. 2011;79(10):1119–1130. doi:10.1038/ki.2010.555
46. Haase-Fielitz A, Haase M, Devarajan P. Neutrophil gelatinase-associated lipocalin as a biomarker of acute kidney injury: a critical evaluation of current status. Ann Clin Biochem. 2014;51(Pt 3):335–351. doi:10.1177/0004563214521795
47. Albert C, Zapf A, Haase M, et al. Neutrophil gelatinase-associated lipocalin measured on clinical laboratory platforms for the prediction of acute kidney injury and the associated need for dialysis therapy: a systematic review and meta-analysis. Am J Kidney Dis. 2020;76(6):826–841. doi:10.1053/j.ajkd.2020.05.015
48. Haase M, Bellomo R, Devarajan P, Schlattmann P, Haase-Fielitz A; NGAL Meta-analysis Investigator Group. Accuracy of neutrophil gelatinase-associated lipocalin (NGAL) in diagnosis and prognosis in acute kidney injury: a systematic review and meta-analysis. Am J Kidney Dis. 2009;54(6):1012–1024. doi:10.1053/j.ajkd.2009.07.020
 © 2022 The Author(s). This work is published and licensed by Dove Medical Press Limited. The
full terms of this license are available at https://www.dovepress.com/terms
and incorporate the Creative Commons Attribution
- Non Commercial (unported, 3.0) License.
By accessing the work you hereby accept the Terms. Non-commercial uses of the work are permitted
without any further permission from Dove Medical Press Limited, provided the work is properly
attributed. For permission for commercial use of this work, please see paragraphs 4.2 and 5 of our Terms.
© 2022 The Author(s). This work is published and licensed by Dove Medical Press Limited. The
full terms of this license are available at https://www.dovepress.com/terms
and incorporate the Creative Commons Attribution
- Non Commercial (unported, 3.0) License.
By accessing the work you hereby accept the Terms. Non-commercial uses of the work are permitted
without any further permission from Dove Medical Press Limited, provided the work is properly
attributed. For permission for commercial use of this work, please see paragraphs 4.2 and 5 of our Terms.