Back to Journals » Psychology Research and Behavior Management » Volume 15
Sleep Quality Partially Mediate the Relationship Between Depressive Symptoms and Cognitive Function in Older Chinese: A Longitudinal Study Across 10 Years
Authors Guo H, Zhang Y ![]() , Wang Z, Shen H
, Wang Z, Shen H ![]()
Received 21 December 2021
Accepted for publication 16 March 2022
Published 1 April 2022 Volume 2022:15 Pages 785—799
DOI https://doi.org/10.2147/PRBM.S353987
Checked for plagiarism Yes
Review by Single anonymous peer review
Peer reviewer comments 2
Editor who approved publication: Professor Mei-Chun Cheung
Huan Guo,1,2 Yancui Zhang,3 Zhendong Wang,4 Heyong Shen2
1School of Human Resources, Guangdong University of Finance & Economics, Guangzhou, People’s Republic of China; 2Institute of Analytical Psychology, City University of Macau, Macau, People’s Republic of China; 3Postdoctoral Research Center of School of Psychology, Nanjing Normal University, Nanjing, People’s Republic of China; 4School of Basic Medical Sciences, Shanghai University of Traditional Chinese Medicine, Shanghai, People’s Republic of China
Correspondence: Heyong Shen, Email [email protected]
Objective: This study aimed to examine the relationship between cognitive function and depressive symptoms and to explore the mediating role of sleep quality in the cognition-depression relationship in Chinese older adults (OAs).
Methods: Data came from a nationally representative sample of 16,209 Chinese OAs (aged 65+) from 2008, 2011, 2014, and 2018 waves of the Chinese Longitudinal Healthy Longevity Survey (CLHLS). A random intercept cross-lagged panel model (RI-CLPM) combined with mediation analysis was adopted to determine the relationship between cognitive function and depressive symptoms and the mediating effect of sleep quality on the ascertained cognition–depression relationship.
Results: Poorer cognitive function at prior assessment points were significantly associated with severe depressive symptoms at subsequent assessments, and vice versa. Sleep quality partially mediated the prospective relationship of cognition on depressive symptoms, which accounted for 3.92% of the total effect of cognition on depression.
Discussion: Cognitive decline may predict subsequent depressive symptoms, and vice versa. The impact of cognition on depression is partially explained by its influence on sleep quality. Multidisciplinary interventions aimed at reducing depression and cognitive decline per se as well as improving sleep quality would be beneficial for emotional well-being and cognitive health in OAs.
Keywords: cognitive function, depressive symptoms, sleep quality, random intercept cross-lagged panel model, mediation, Chinese older adults
Introduction
As the life expectancy of the world’s population continues to increase, research on cognitive aging has been greatly promoted.1 Cognitive deterioration and accompanying physical and mental health problems, such as dementia, depression, sleep disorders, and disability, are considered to be the most challenging problems faced by an aging society.2 This will greatly damage the quality of life of the elderly and increase the burden of cognitive impairment.3 Mild Cognitive Impairment (MCI) is defined as a transitional stage between normal aging and dementia, which is characterized by cognitive deficits.4 The risk of dementia in MCI patients is significantly higher, with an annual progression rate between 8% and 15%.5–7 It is not only the main cause of disability and death among older adults (OAs) but has a profoundly detrimental effect on their families and caregivers. With a rapidly aging population, MCI was prevalent in recent years. In China, the prevalence of MCI among the aging population (aged 60 and older) was 14.71%.8 Therefore, it is necessary to reveal the influencing factors that can prevent and delay the harmful effects of aging.
In the past two decades, researchers have conducted to examine the relationship between cognitive function and depression.9–12 Most of these studies have shown a link between depressive symptoms and dementia or cognitive decline, but the nature of the relationship remains unclear. Many of them show that low cognitive function is a strong predictor of depression,13–15 or its manifestations, such as suicide completion,16,17 and suicidal thoughts.18,19 Research showed that depressive symptoms preceded cognitive decline.20–23 Depressed participants exhibited poorer performance at baseline and greater subsequent decline in all cognitive domains, which supports the theory that repeated depressive episodes may contribute to cognitive decline.22,23 More than just a predictor, though, many studies have shown that previous cognitive function is related to later depression,14,24–27 which suggests that cognitive function might play a causative role in depression. However, some studies did not report any significant association between cognitive function and depression.28,29 Although many studies have found a cross-sectional relation between depression and dementia or depressive symptomatology and cognitive functioning, the direction of this association is still inconsistent. For this reason, it is necessary to explore the relationship and the possible mechanism between depression and cognition in larger and longer follow-up samples.
Studies have found that poor sleep quality can affect many aspects of health, such as cognitive function,30 health status,31 emotion,32 psychological well-being,33 and others.34 Thus, sleep quality might play an important role in considering the relationship between depression and cognition.35
Firstly, a large number of investigations have shown that poor sleep quality is related to poor cognitive performance, such as processing speed, episodic memory recall, and executive function in the elderly.36–39 The link between sleep and neurodegenerative disease might be bi-directional; sleep disturbance serves not only as a marker but a promoter of cognitive impairment. Their mutual influence in many aspects is of great significance to the diagnosis and treatment of cognitive deterioration.40 Recent studies have shown that in Alzheimer’s disease (AD), the degeneration of the suprachiasmatic nucleus and prefrontal cortex in dementia disrupts sleep-wake rhythmicity and decline of cognitive ability. Markers for AD pathology are also related to sleep disorders in the elderly with normal cognition, suggesting that preclinical AD pathology may be the cause of sleep disorders. For example, in the elderly with normal cognition, amyloid deposits measured by positron emission tomography (PET) and Aβ42 levels in cerebrospinal fluid increased with self-reported decreasing sleep duration,41 excessive daytime sleep,42 longer sleep latency,43,44 and poorer sleep quality.45,46 On the other hand, sleep deprivation increases the production of amyloid-β and reduces its clearance,47 which leads to a higher risk of cognitive impairment.48–51
In addition, there is a relationship between sleep quality and depression, and it may be mutual,52–55 which leads to a vicious circle between them.35 Poor sleep quality may affect emotional regulation, in many cases leading to increased negative emotions, sleep interruption, and more severe depressive symptoms.31,56 Evidence shows that individuals with chronic insomnia are at a higher risk of developing depression, as chronic insomnia could disrupt the balance of the hypothalamic-pituitary-adrenal axis, leading to depression.57–61 Alternatively, people with depression are more likely to have sleep disturbances.62 A longitudinal study demonstrated that symptoms of depression at baseline would lead to more sleep complaints after 4 years in older adults.63 The possible mechanism is that depression can inhibit the secretion of melatonin, interfere with the circadian rhythm, and disturb sleep.64 In addition, the occurrences were not coinstantaneous, as longitudinal studies have shown the time lag of patients with sleep disorders to develop depression may exceed several months.60,61
Those studies above showed sleep quality might be bi-directional correlated with depression and cognitive function, respectively, thus sleep quality might play a role in the relationship between cognitive function and symptoms of depression. However, the existing research on the relationship between depression, cognition, and sleep was mainly cross-sectional and bilateral, they failed to examine if one variable has a causal relation to the others or the trilateral relationship between them.65,66 Longitudinal studies were desperately needed to answer the question of whether the cognitive ability is causally related to depression (or vice versa), and the possible influence of sleep quality on this relationship.
This study aimed to examine the pathways through which depression and sleep quality affect cognitive function among Chinese OAs by using data from a longitudinal nationally representative survey of the Chinese older population. Firstly, we examine the reciprocal relationship between symptoms of depression and cognitive function using a national elderly sample. We hypothesized that previous depressive symptoms would negatively predict subsequent cognitive function, and previous cognitive function would also negatively predict subsequent depressive symptoms. Then, given the potentially important role of sleep disturbance in the pathogenesis of cognitive impairment, we further explore the mediating role of sleep quality in this relationship. In addition, depression and cognitive function are influenced by many other factors, such as demographic,67 socioeconomic status,68 lifestyles,69,70 interpersonal relationships,71 and daily living activity.72 These factors may influence or cover up the relationship between depression and cognition. Therefore, in this study, we took these influencing factors as control variables and sleep quality as a mediator to investigate the mediating effect of sleep quality on the relationship between depression and cognition at a longitudinal level.
Method
Data and Sample
The data came from the Chinese Longitudinal Health and Longevity Study (CLHLS), a dynamic cohort study. The CLHLS recruited representative samples of China old adults from about half of 22 cities and counties in 31 provinces of China. The first wave of CLHLS data was collected in 1998 and conducted every three years with the latest wave in 2018. The survey covers 1.16 billion people, accounting for 85% of China’s total population. Interviews were conducted to obtain data on demographic characteristics, socioeconomic status, lifestyle, and health. More detailed information on CLHLS could be found elsewhere.73 The current study used data from the last four waves of CLHLS, each with a 3-year interval from 2008 (the “baseline” time) to 2018. Our study focused on the 2008 group, excluding respondents who were added to replace those who died in the subsequent waves. At baseline, there were 16,954 participants in the cohort. Those who reported their age at 106 or older were excluded because there was no reliable information to verify their age.74 Based on previous studies of older respondents, respondents under 64 years of age and those who lacked MMSE in the first wave were excluded as well. Therefore, the final analysis sample consists of 16,209 respondents.
Measures
Cognitive Function
Cognitive function was assessed with a Chinese modified Mini-mental State Examination (CMMSE). The original MMSE has 30 items and tests 7 domains of cognitive function.75 Considering that two-thirds of Chinese OAs are illiterate, the CLHLS deleted 2 items of language (write a complete sentence and follow a written instruction to close eyes) from the original version. To make questions for OAs easier to understand and answer, it further deleted 1 item of time orientation and 4 items of place orientation and culturally adapted the remaining 23 items.76 Each item of the Chinese CMMSE is scored 1 if the answer is correct and 0 for an incorrect answer or “unable to answer”, so higher scores indicate better cognitive function. Factor analyses revealed that a model with four factors consistently fitted the four waves’ CMMSE data well. The four factors were orientation (orientation to time and place), memory (registration and delayed recall), attention and calculation (calculation and copying intersecting polygons), and language (repeating phrase, three-step command, and naming). Cronbach’s α coefficients of the CMMSE ranged from 0.88 to 0.91 for the four waves of the CLHLS.
Depressive Symptoms
Depressive symptoms in CLHLS were assessed by a five-item scale. These five items have been often adopted to indicate depressive symptoms in various studies using the CLHLS data.77–80 Of the five questions on this scale, two questions measure positive feelings, and the other three measure negative effects. The first two questions include “Do you see the bright side of things?” and “Are you still as happy as you were when you were young?” The other three questions are “Do you often feel anxious or fearful?”, “You often feel lonely and Is it isolated?” and “Do you think the older you are, the more useless you are?”. The respondents were asked to choose from five frequency responses with 1 representing “Always”, 2 representing “Often”, 3 representing “Sometimes”, 4 representing “Seldom” and 5 representing “Never”. Then, the three negative items were reverse coded, and two positive items were added to calculate the total score. Therefore, the total score ranges from 5 to 25, with a higher value indicating more severe depressive symptoms. Previous research reported that the internal consistency reliability of the depressive emotion scale based on the 2008 sample is 0.66, above the acceptable values of 0.6.81 Principle component analysis based on the first wave generated one factor with eigenvalues ≥ 1, explaining 43% of the total variance.
Sleep Quality
Sleep quality was assessed by a single item sleep quality scale. Participants were asked to answer the following question: “how do you rate your recent sleep quality?” Responses were rated in a 5-point format (“1 = very good”, “2 = good”, “3 = fair”, “4 = bad”, or “5 = very bad”). The single item sleep quality scale is a self-reported measurement to assess sleep quality that can be used when time is constrained or quick identification of sleep impairments.82 In addition, the single-item scale reduced the response burden on participants, especially in OAs with decreased cognitive function like in the present study. The self-reported measure of sleep quality in a single item has been widely used in previous studies and has been shown to be highly correlated with the multi-item versions of the Sleep Quality Scale.83–85
Control Variables
To minimize the possibility of a third variable influence on the cognition-depression relationship and to keep the parsimony of our model, we controlled a limited number of covariates associated with depression and cognition. According to previous research, all covariates are based on baseline data.86
Firstly, demographic control variables included age, gender, and education level. Then, lifestyle covariates included physical exercise, current smoking, and current drinking status. Respondents were asked whether they regularly participate in physical exercise (1 = yes; 2 = no), whether they currently smoke (1 = yes; 2 = no), and drinking (1 = yes; 2 = no). Interpersonal relationship covariates included marital status (1 = never married, separated, divorced, or widowed; 0 = married), living arrangement (1 = alone; 0 = with family members or in an institution) and social activity. Social activity was assessed by a single question: “Do you take part in some social activities at present?” (1 = almost every day; 2 = not daily, but once for a week; 3 = not weekly, but at least once for a month; 4 = not monthly, but sometimes; 5 = never). In addition, difficulties with six types of Activities of Daily Living (ADL) (dressing, walking, bathing, eating, getting in or out of bed, and using the toilet) were assessed by asking participants to indicate whether they had any difficulty performing these activities.
Analytic Strategies
The Cross-Lagged Panel Model (CLPM) is traditionally used as a typical method to study the causal impact between variables in longitudinal panel data. However, the CLPM only considers the temporal stabilities of variables, but fails to fully consider the time-invariant individual differences, which may lead to biased estimation.87 To solve this problem, the random intercepts cross-lagged panel model (RI-CLPM) has been proposed. The RI-CLPM uses a multilevel perspective to distinguish the within-person internal process from between-person stable differences, which allows the separation of within-person effects from between-person effects.88 In this study, the RI-CLPM analysis was adopted to examine the direction and strength of association between cognition and depressive symptoms. Four domain-representative item parcels were created as the indicators of cognition,89 with each parcel representing each domain we defined in the measurement invariance. Figure 1 shows an illustration of the RI-CLPM examined in the current study. The random intercepts reflect an individual’s average, stable level of cognitive function, sleep quality, and depressive symptoms.
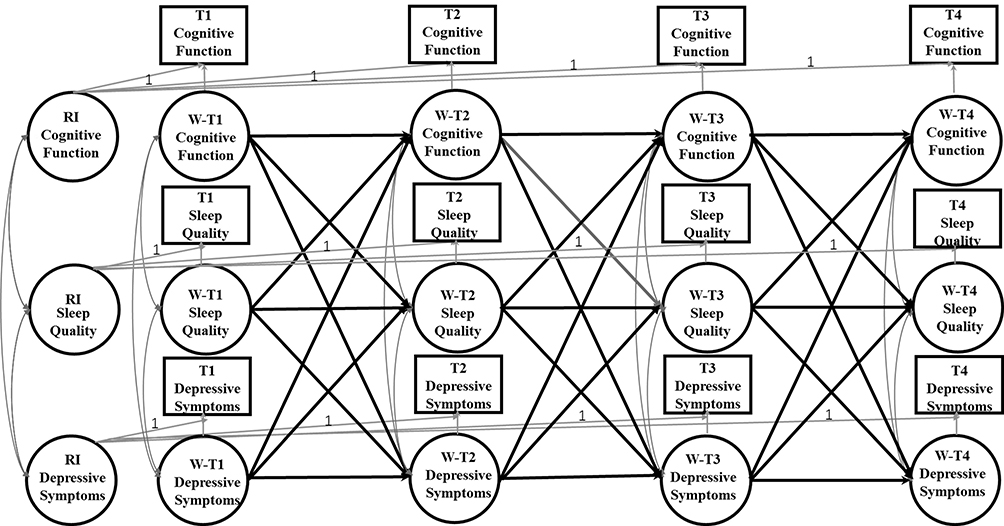 |
Figure 1 A depiction of the RI-CLPM including the relationships between cognitive function, depressive symptoms, and sleep quality across the three waves. W represents within-person variable; T1 represents 2008; T2 represents 2011; T3 represents 2014; T4 represents 2018. The observed variables are represented in the squares. Of these observed variables, latent variables at both the between and within level were constructed. These latent variables are displayed as ovals. The three random intercepts (RI Cognitive Function, RI Depressive Symptoms, and RI Sleep Quality) reflect the between-person variances. The nine latent within-person variables (WT1-WT4 Cognitive Function, WT1-WT4 Depressive Symptoms, and WT1-WT4 Sleep Quality) reflect the within-person variances across 4 waves. The within-person paths are illustrated by the modeling structure between the nine latent within-person variables: 3 autoregressive paths between the latent factors of Within Cognitive Function, 3 autoregressive paths between the latent factors of Within Depressive Symptoms, and 3 autoregressive paths between the latent factors of Within Sleep Quality; 3 cross-lagged paths from the latent factors of Within Cognitive Function to Within Depressive Symptoms and 3 cross-lagged paths from the latent factors of within Depressive Symptoms to Within Cognitive Function; 3 cross-lagged paths from the latent factors of Within Cognitive Function to Within Sleep Quality and 3 cross-lagged paths from the latent factors of Within Sleep Quality to Within Cognitive Function; 3 cross-lagged paths from the latent factors of Within Depressive Symptoms to Within Sleep Quality and 3 cross-lagged paths from the latent factors of Within Sleep Quality to Within Depressive Symptoms; correlations between Within Cognitive Function, Within Depressive Symptoms, and Within Sleep Quality at Wave 1, and between the residual correlations of Within Cognitive Function, Within Depressive Symptoms, and W Sleep Quality at Waves 2 and 3. |
Longitudinal measurement invariance of cognition across measurement occasions is a prerequisite to modeling changes over time.90 Using measurement invariance testing, Confirmatory Factor Analysis (CFA) found that our proposed construct of cognition was invariant over time on these parcels’ loadings and intercepts, and thus met the requirements for strong measurement invariance. The scalar longitudinal invariance model of cognition allowed correlations between residual error variances of the same parcel and imposed invariance constraints on the factor loadings and intercepts across the four-time points. Moreover, CFA of the five-item Depression Symptoms Scale also showed scalar longitudinal invariance, which indicates that the longitudinal cross-lagged analysis between depressive symptoms and cognitive function is permittable To simplify the model structure, the symptom of depression was computed as the total score of all five items. Our RI-CLPM mainly involved the comparison of four-level nested models (Table 1). Model 1 evaluated the correlations of cognition and depressive symptoms within time points and autoregressive paths between time points. Model 2 assessed the stability in autoregressive paths of cognition and depressive symptoms. Added cross-lagged paths of cognition and depressive symptoms, Model 3 tested the reciprocal relationships between them. Model 4 tested “stationarity” in cross-lagged paths. Nested models were compared with the corrected scaled Chi-square difference test.91 Sleep quality was hypothesized to mediate the reciprocal depression–cognition relationship ascertained in Model 4. The three indirect effects, previous depressive symptoms on posterior cognition via present sleep quality and previous cognition on posterior depressive symptoms via present sleep quality, were simultaneously tested in Model 5. The indirect effect of X predicting Y via M was the product of two direct effects on the path. Models 4i included all control variables as covariates predicting ~2008–2018 cognition and depressive symptoms based on Model 4, while Models 5i included all control variables as covariates predicting ~2008–2018 cognition, depressive symptoms, and sleep quality based on Model 5. Paths from covariates to cognition and depressive symptoms, correlations between variables at a given time, autoregressive paths of time-varying variables, and cross-lagged paths between time-varying variables were also added to Models 4i and 5i. Because RI-CLPM routinely assumes that prospective relationships between variables are stable over time,92 we applied equality constraints to the autoregressive and cross-lagged paths as well as paths from time-invariant covariates to cognition and depressive symptoms.
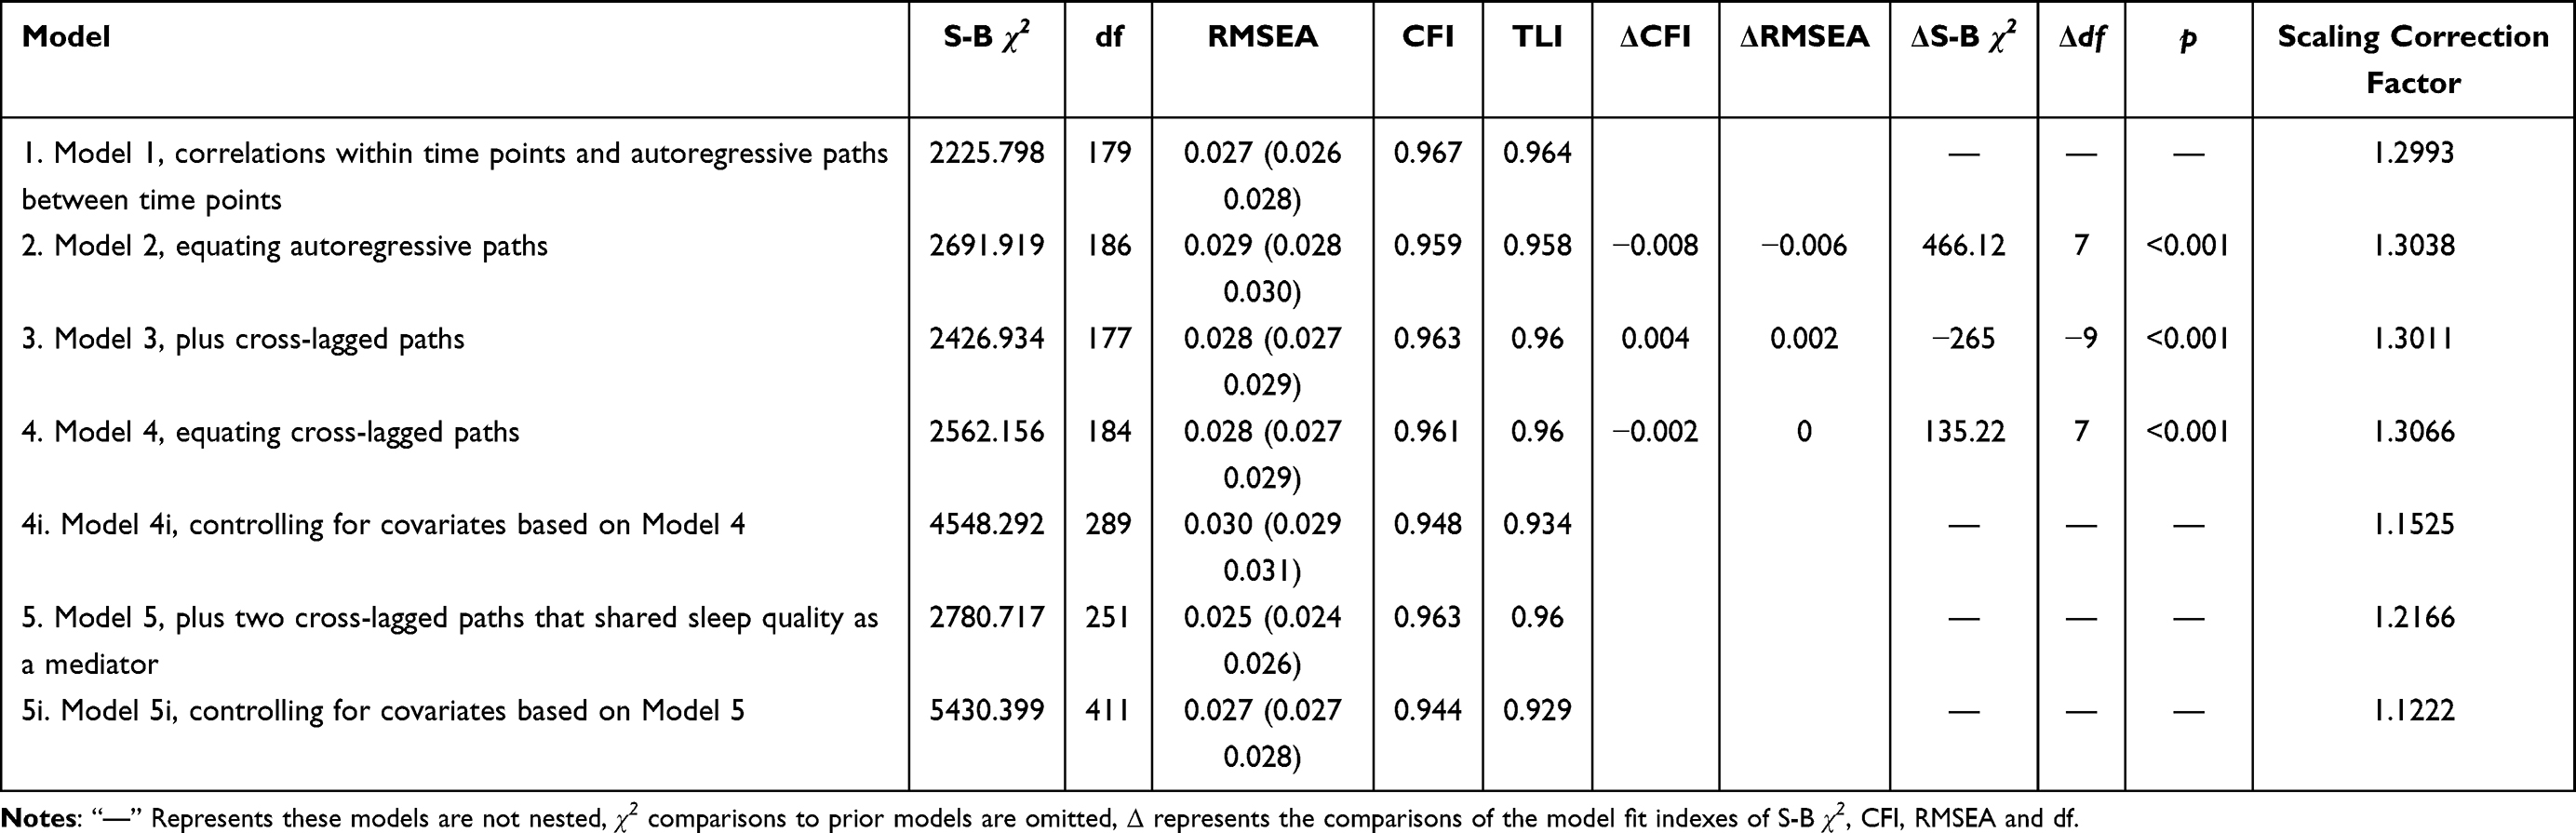 |
Table 1 Fit Indices of Structured Equation Models for Cross-Lagged Panel and Mediation Analysis |
Available data of all the 16,209 respondents were used in this study, and the missing data were dealt with Full Information Maximum Likelihood (FIML) estimation.93 The highest absolute values of skewness and kurtosis for our observed variables were 2.197 and 4.973 for the CMMSE score, therefore, the parameters were estimated with Robust Maximum Likelihood. We reported unstandardized regression coefficients (βs) and p values throughout.
The degree of model fit was assessed with Satorra–Bentler χ2 statistic (S−B χ2), Root Mean Square Error of Approximation (RMSEA), Comparative Fit Index (CFI), and Tucker–Lewis Index (TLI), however, we primarily depended on the results of RMSEA, CFI, and TLI, because χ2 goodness-of-fit statistic is too sensitive for a very large sample such as used in our study.94 RMSEA value under 0.05 represents a good fit to the data, and values between 0.05 and 0.08 indicate a reasonable fit. For the CFI/TLI, values greater than 0.90 are considered as an acceptable fit and 0.95 or more as a good fit.95 Since the sensitivity of a large sample in the χ2 difference test, the comparisons of the models were mainly determined by the difference in CFI (ΔCFI) and RMSEA (ΔRMSEA) between the base model and the constrained model.96–98 When the ΔCFI and ΔRMSEA are not greater than 0.01, the invariance model is acceptable.98 All these analyses were conducted with Mplus, version 7.4.93
Results
Descriptive Statistics
Sample characteristics are shown in Table 2. The mean scores of the existing samples from 2008 to 2018 were 17.76, 18.34, 19.24, and 19.00 for cognitive function, 17.70, 18.71, 18.64, and 18.16 for depressive symptoms, and 2.36, 2.35, 2.39, and 2.50 for sleep quality respectively. Among the 2365 survivors who were interviewed at each wave, the results of repeated-measures analysis of variance indicated that depressive symptoms increased over time between 2002 and 2011 (F = 57.591, p < 0.001), whereas mean CMMSE scores decreased (F = 555.137, p < 0.001).
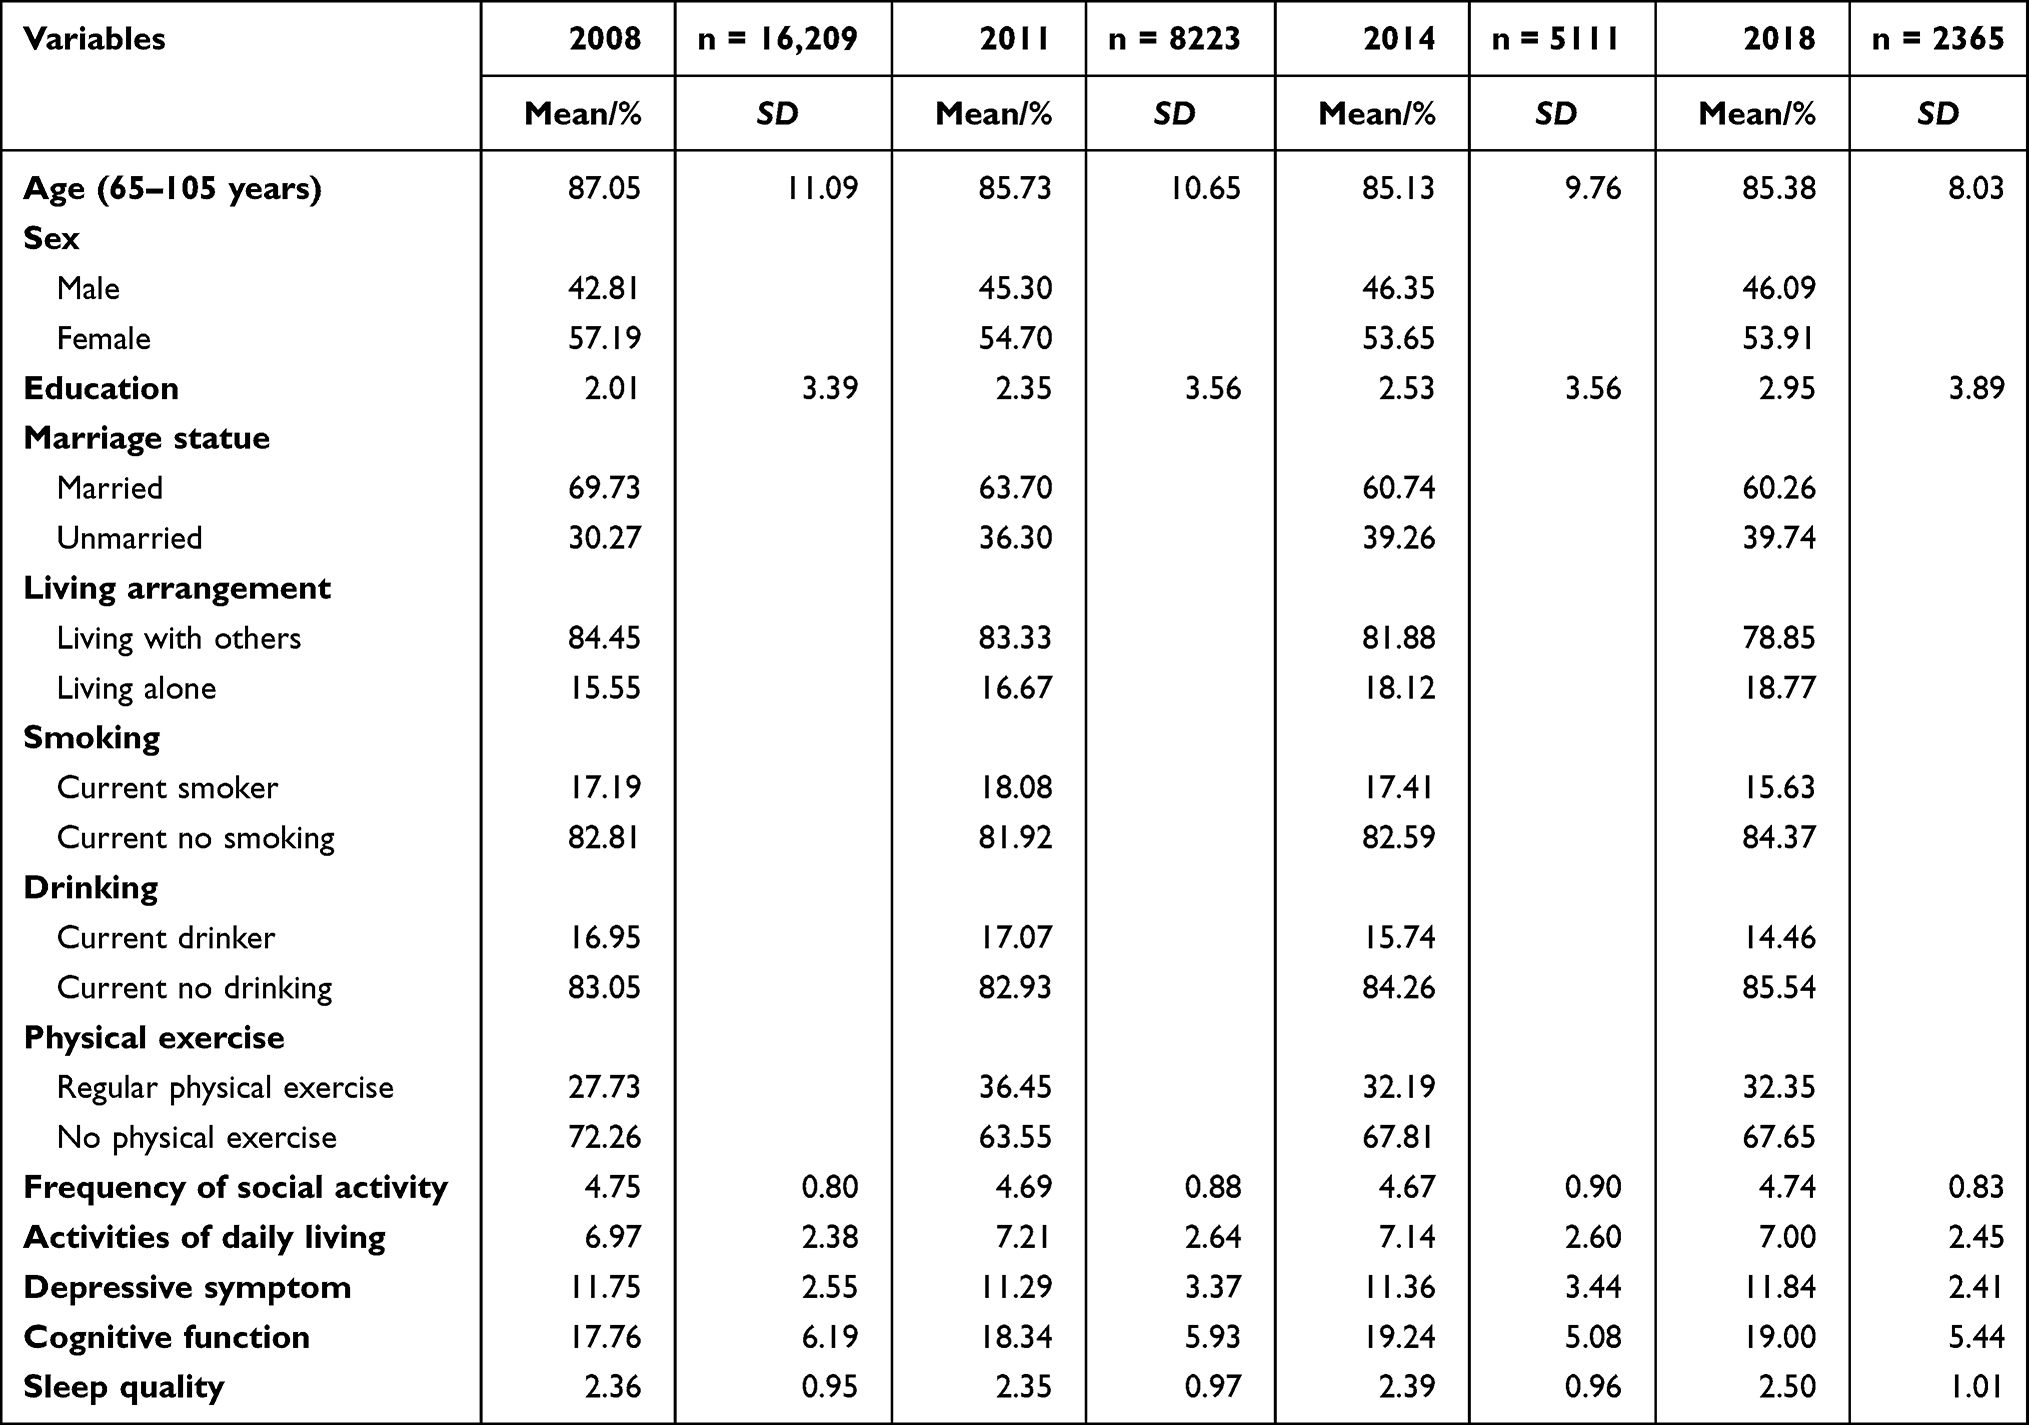 |
Table 2 Sample Characteristics of Depressive Symptoms, Cognition (MMSE Score), Sleep Quality and Covariates |
Correlations between cognitive function, depressive symptoms, and sleep quality are presented in Table 3. On any given occasion, depressive symptoms and cognitive function were negatively and significantly correlated (p < 0.001). The score of depressive symptoms was negatively correlated with later cognitive function (p < 0.001) and cognitive function was negatively correlated with the later depressive symptoms (p < 0.01). Sleep quality was positively correlated with depressive symptoms and negatively correlated with cognition both on the same occasion (p < 0.01).
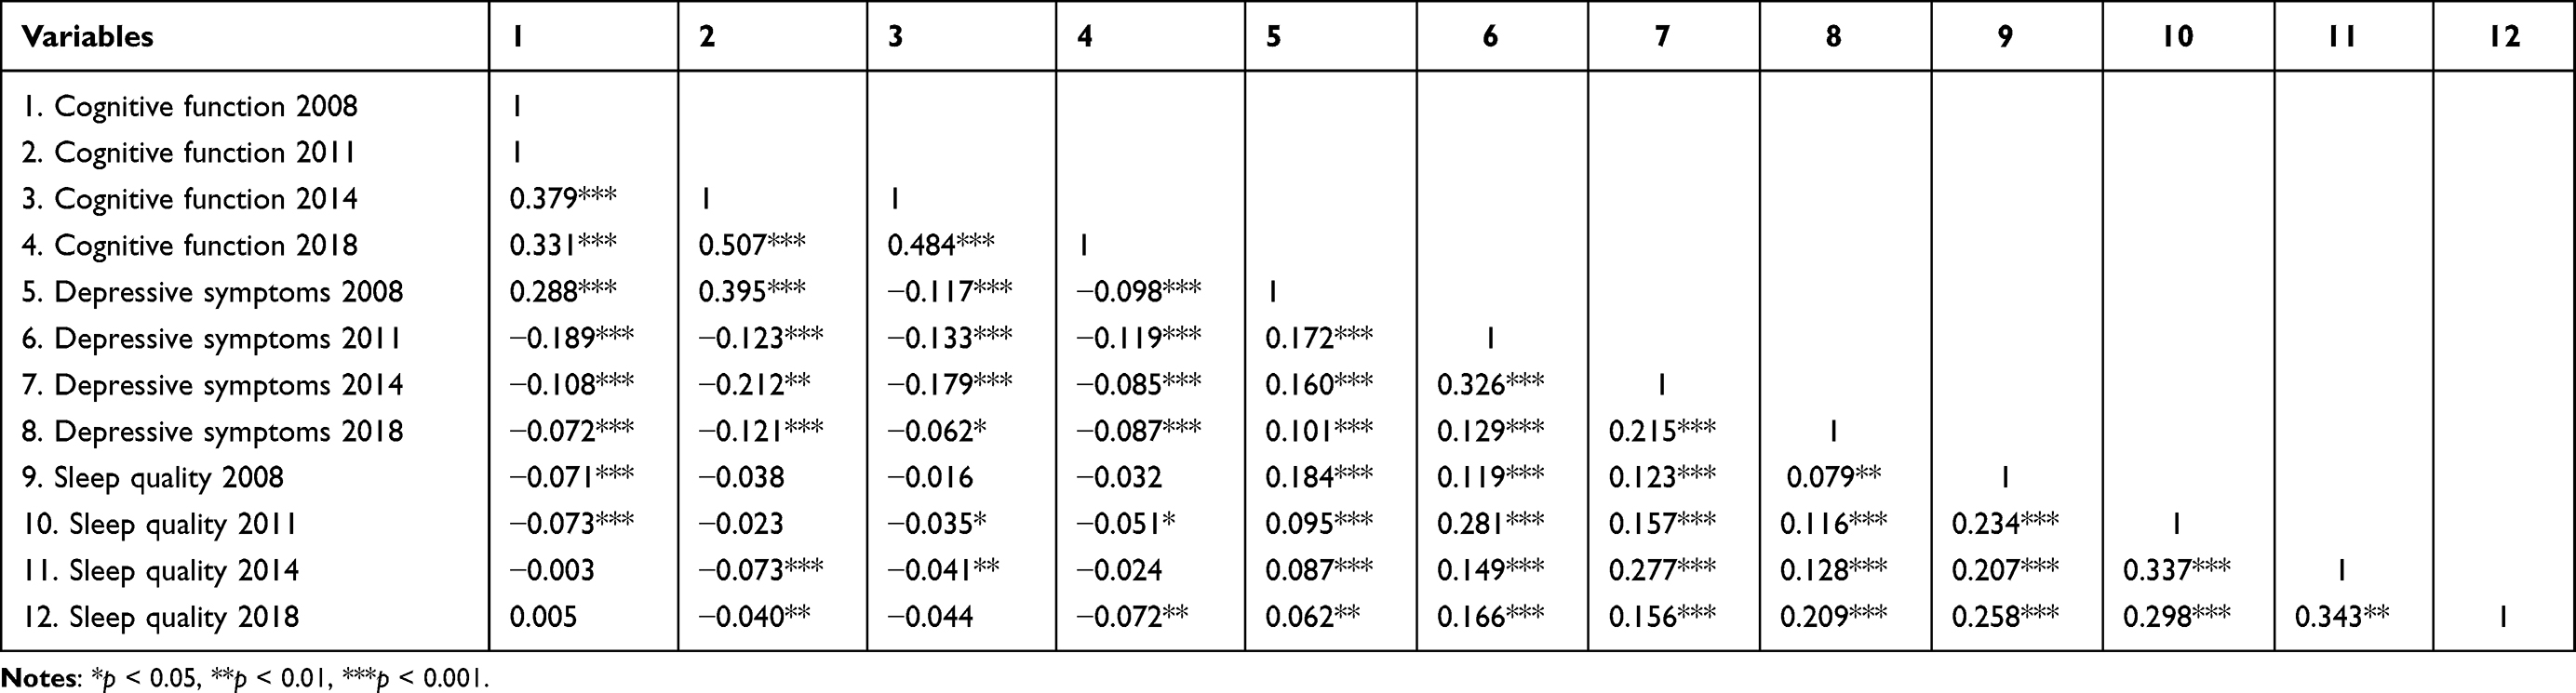 |
Table 3 Correlations Between Latent Variables of Depressive Symptoms and Cognitive Function and a Manifest Variable of Sleep Quality |
The Reciprocal Relationship Between Depressive Symptoms and Cognitive Function
Figure 2 depicts Model 4i. After controlling for covariates, Model 4i fitted the data adequately (RMSEA = 0.030, CFI = 0.948, TLI = 0.933; Table 1), and the 3-year cross-lagged effects of prior depressive symptoms on cognition (β = −0.016, p < 0.01) and cognition on subsequent depressive symptoms (β = −0.244, p < 0.001) were significant. Lower prior cognitive function predicted higher subsequent depressive symptoms (p < 0.01), and higher prior depressive symptoms predicted lower subsequent cognitive function (p < 0.001).
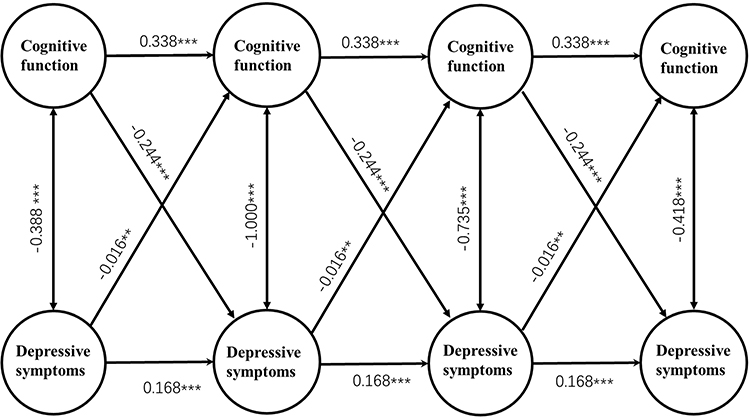 |
Figure 2 Latent variable cross-lagged panel model of the reciprocal relationship between depressive symptoms and cognitive function. Parcels of cognitive function, overtime correlations between parcel-specific residuals, fixed residual variances of depressive symptoms and control variables are not shown to enhance clarity. Unstandardized regression coefficients are presented. ***p < 0.001, **p < 0.01. |
Mediating Effect of Sleep Quality
As Figure 3 presents, after adding three indirect paths that shared sleep quality as a potential mediator and adjustment for control variables, Model 5i still had a good fit to the data (RMSEA = 0.027, CFI = 0.947, TLI = 0.932; Table 1). The 3-year cross-lagged effects of depressive symptoms on subsequent cognition (β = −0.037, p < 0.01) and prior cognition on subsequent depressive symptoms (β = −0.435, p < 0.001) were significantly reduced in size compared with those in Model 4i. The indirect effect of prior cognition on subsequent depressive symptoms via sleep quality was significant (effect size = −0.004, p < 0.05), lower prior cognitive function predicted worse subsequent sleep quality (higher score) (β = −0.026, p < 0.001), and worse prior sleep quality predicted higher amounts of subsequent depressive symptoms (β = 0.138, p < 0.01). The effect size of the longitudinal mediation was computed with MacKinnon’s formula for calculating the mediated percentage, which is the indirect effect divided by the total effect. However, this indirect effect size only accounted for 3.96% (−0.004/-0.101) of the total effects demonstrated in Model 4i.
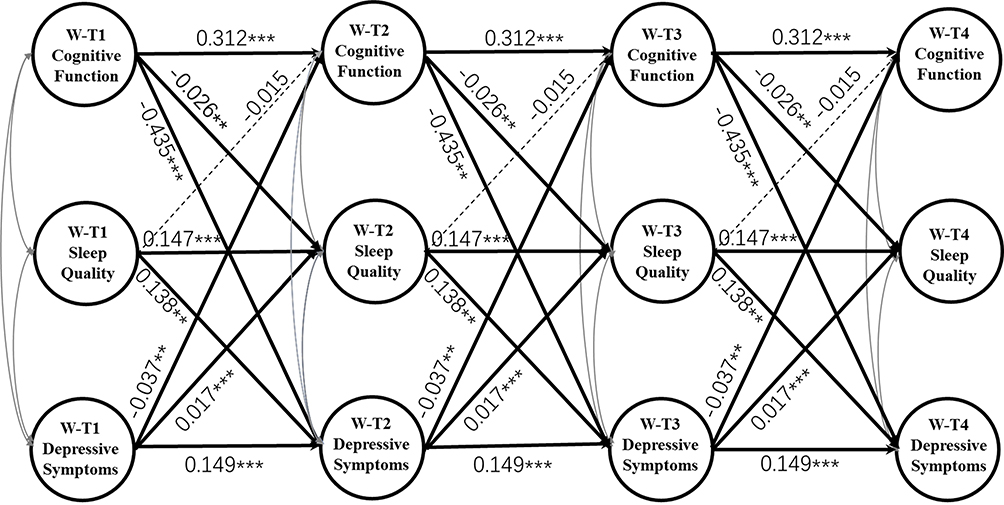 |
Figure 3 Mediating effects of Within Sleep Quality on the reciprocal relationship between Within Depressive Symptoms and Within Cognitive Function. W-T1 represents within-person variable in 2008; W-T2 represents within-person variable in 2011; W-T3 represents within-person variable in 2014; W-T4 represents within-person variable in 2018. Correlations among the three variables on each occasion and control variables are not shown to enhance clarity. Unstandardized regression coefficients are presented. ***p < 0.001, **p < 0.01. |
Discussion
As far as we know, this is the first 10-year large-scale cohort study on the prospective relationship between cognition, depression, and sleep quality in China. Our findings not only strengthen the assertion that depressive symptoms have an adverse effect on cognitive function, but also show that cognitive dysfunction may exacerbate depression, forming a “vicious circle” that further damages over time Cognition. Finally, the indirect effect of cognition on depression through sleep quality was statistically significant, suggesting a mechanism that cognition can affect depression via its impact on sleep quality.
Most previous studies have found an association between cognition and depression.9–12 Some studies found that previous cognition was a predictor of follow-up depression,14,24–27 and some other studies showed depressive symptoms preceded cognitive decline.20–22 However, the directional relationship between them remains ambiguous.99 Our study found that previous cognitive function was negatively associated with subsequent depressive symptoms; prior depressive symptoms were also negatively but marginally associated with subsequent cognitive function. Our study demonstrates there is a negative bidirectional causality between cognitive function and depression symptoms though exploring a nationally representative longitudinal dataset. This result contributes to some of the previous research which indicates that the interactions between depression and cognitive impairment can be bidirectional making it difficult to distinguish causality.100
The bidirectional cognition–depression relationship over time remained significant after accounting for demographic (age, gender), socioeconomic status (education), lifestyles (physical exercise, smoking, and drinking), interpersonal relationships (social activity, marital status, and living arrangement), and daily living activity covariates. It indicates that the reciprocal cognition–depression relationship is not explained by these variables. This finding is especially important because previous studies have shown that cognition/depression has significant associations with these risk factors,101,102 in particular educational levels.103 Our analysis rules out the third-variable effects caused by these covariates.
The bidirectional causal relationship between cognitive function and depressive symptoms could be explained by the cognitive theory of depression. It posits that people’s thoughts, inferences, attitudes, and explanations, as well as the way they process and recall information, were associated with their risk for depression.104 The relationship between biased cognitive processing and depressive disorder involves three mechanisms: the inhibitory process and defects of working memory, the rumination to negative emotions and events, and the inefficiency in regulating negative emotions.104 Somatic symptoms of depression such as fatigue or attention deficits are also early indicators of cognitive decline.20
It is worth noting that we only tested one possible mechanism of the reciprocal relationship between depression and cognition, and we found that the mediating effect of sleep quality, although statistically significant, can only explain a small portion of the direct effect. Therefore, we cannot determine whether this reciprocal effect over time is mainly caused by depression and cognition per se, or by their effects on potential psychosomatic processes, such as worsened sleep quality, or other mechanisms. Previous research also notices that the process of reciprocal cognition-depression relationship might involve a “mediator chain” that includes many psychosomatic markers, such as cerebrovascular risk factors,107 ruminations,106 perceived stress and sleep quality.105 The mediating effect of sleep quality found in this study may be just one of many steps between cognition and depression. Further research is needed to address this issue.
Several limitations of this study should be noted. First, a prerequisite for causal inferences in CLPM is that all possible false sources should be excluded. We have controlled a limited number of important covariates, but some unmeasured covariates, such as physical health status,100 have not been adjusted. Second, Due to data collection limitations, sleep quality in this study might be underreported because this study only used a self-report question to assess sleep quality. Sleep quality is a complex construct to evaluate empirically, and yet self-reported subjective sleep quality is commonly used in studies as their only measurement. Further studies should include both subjective and objective measures when examining sleep quality in older adults.108 Third, the five-item version of the depressive symptoms scale in this study was a crude measurement and contains only 5 items about symptoms of depression. However, these five items represent the most important aspects of depressive symptoms and have been used in many previous studies.77–80
Conclusion
In summary, by adopting 10-year cross-lagged longitudinal data from the CLHLS demonstrated in Chinese OAs, we found that there was a negative bidirectional causality relationship between cognitive function and depressive symptoms, and the prospective cognition-depression relationship was partially mediated by sleep quality. Our results indicate lower cognitive function cause higher subsequent depressive symptoms partly through the worsening of sleep quality. Both depression and cognitive degeneration are major mental health challenges of contemporary Chinese OAs, and both are accompanied by sleep disturbance. Considering the reciprocal relationship between them, multidisciplinary interventions that try to relieve depression, maintain or delay the progress of cognitive degradation, or related risk factors, such as sleep quality, may contribute to the cognitive and mental health of OAs. More studies are needed to reveal the underlying pathways between depression and cognition to interrupt the possible vicious cycle between depression and cognitive degeneration.
Data Sharing Statement
All the datasets can be accessed at the Peking University Open Research Data after being authorized.
Disclosure
The authors report no conflicts of interest in this work.
References
1. Moreira PS, Santos N, Castanho T, et al. Longitudinal measurement invariance of memory performance and executive functioning in healthy aging. PLoS One. 2018;13(9):e0204012. doi:10.1371/journal.pone.0204012
2. Beard JR, Officer A, De Carvalho IA, et al. The World report on ageing and health: a policy framework for healthy ageing. Lancet. 2016;387(10033):2145–2154. doi:10.1016/S0140-6736(15)00516-4
3. Zhang W, Tang F, Chen Y, Silverstein M, Liu S, Dong XQ. Education, activity engagement, and cognitive function in US Chinese older adults. J Am Geriatr Soc. 2019;67(S3):S525–S531. doi:10.1111/jgs.15560
4. Petersen RC, Smith GE, Waring SC, Ivnik RJ, Tangalos EG, Kokmen E. Mild cognitive impairment: clinical characterization and outcome. Arch Neurol. 1999;56(3):303–308. doi:10.1001/archneur.56.3.303
5. Roberts R, Knopman DS. Classification and epidemiology of MCI. Clin Geriatr Med. 2013;29(4):753–772. doi:10.1016/j.cger.2013.07.003
6. Petersen RC. Mild cognitive impairment. Contin Lifelong Learn Neurol. 2016;22(2, Dementia):404–418. doi:10.1212/CON.0000000000000313
7. Petersen RC. Clinical practice. mild cognitive impairment. N Engl J Med. 2011;364(23):2227–2234. doi:10.1056/NEJMcp0910237
8. Xue J, Li J, Liang J, Chen S. The prevalence of mild cognitive impairment in China: a systematic review. Aging Dis. 2018;9(4):706–715. doi:10.14336/AD.2017.0928
9. Deary IJ, Weiss A, Batty GD. Intelligence and personality as predictors of illness and death: how researchers in differential psychology and chronic disease epidemiology are collaborating to understand and address health inequalities. Psychol Sci Public Interes Suppl. 2010;11(2):53–79. doi:10.1177/1529100610387081
10. Emerson E, Einfeld S, Stancliffe RJ. The mental health of young children with intellectual disabilities or borderline intellectual functioning. Soc Psychiatry Psychiatr Epidemiol. 2010;45(5):579–587. doi:10.1007/s00127-009-0100-y
11. Chong SA, Subramaniam M, Lee IM, et al. Academic attainment: a predictor of psychiatric disorders? Soc Psychiatry Psychiatr Epidemiol. 2009;44(11):999–1004. doi:10.1007/s00127-009-0027-3
12. Jansson JA, Eklund M. How the inner world is reflected in relation to perceived ward atmosphere among patients with psychosis. Soc Psychiatry Psychiatr Epidemiol. 2002;37(11):519–526. doi:10.1007/s00127-002-0584-1
13. Der G, Batty GD, Deary IJ. The association between IQ in adolescence and a range of health outcomes at 40 in the 1979 US National Longitudinal Study of Youth. Intelligence. 2009;37(6):573–580. doi:10.1016/j.intell.2008.12.002
14. Koenen KC, Moffitt TE, Roberts AL, et al. Childhood IQ and adult mental disorders: a test of the cognitive reserve hypothesis. Am J Psychiatry. 2009;166(1):50–57. doi:10.1176/appi.ajp.2008.08030343
15. Upmark M, Lundberg I, Sadigh J, Allebeck P, Bigert C. Psychosocial characteristics in young men as predictors of early disability pension with a psychiatric diagnosis. Soc Psychiatry Psychiatr Epidemiol. 1999;34(10):533–540. doi:10.1007/s001270050172
16. Fergusson DM, Horwood LJ, Ridder EM. Show me the child at seven II: Childhood intelligence and later outcomes in adolescence and young adulthood. J Child Psychol Psychiatry Allied Discip. 2005;46(8):850–858. doi:10.1111/j.1469-7610.2005.01472.x
17. Kunik ME, Champagne L, Harper RG, Chacko RC. Cognitive functioning in elderly depressed patients with and without psychosis. Int J Geriatr Psychiatry. 1994;9(11):871–874. doi:10.1002/gps.930091103
18. Andersson L, Allebeck P, Gustafsson JE, Gunnell D. Association of IQ scores and school achievement with suicide in a 40-year follow-up of a Swedish cohort. Acta Psychiatr Scand. 2008;118(2):99–105. doi:10.1111/j.1600-0447.2008.01171.x
19. Gunnell D, Harbord R, Singleton N, Jenkins R, Lewis G. Is low IQ associated with an increased risk of developing suicidal thoughts? A cohort study based on an 18-month follow-up of the national psychiatric morbidity survey. Soc Psychiatry Psychiatr Epidemiol. 2009;44(1):34–38. doi:10.1007/s00127-008-0404-3
20. Paterniti S, Verdier-Taillefer MH, Dufouil C, Alpérovitch A. Depressive symptoms and cognitive decline in elderly people: longitudinal study. Br J Psychiatry. 2002;181(5):406–410. doi:10.1192/bjp.181.5.406
21. Yaffe K, Blackwell T, Gore R, Sands L, Reus V, Browner WS. Depressive symptoms and cognitive decline in nondemented elderly women: a Prospective Study. Arch Gen Psychiatry. 1999;56(5):425–430. doi:10.1001/archpsyc.56.5.425
22. Riddle M, Potter GG, McQuoid DR, Steffens DC, Beyer JL, Taylor WD. Longitudinal cognitive outcomes of clinical phenotypes of late-life depression. Am J Geriatr Psychiatry. 2017;25(10):1123–1134. doi:10.1016/j.jagp.2017.03.016
23. Beaujean AA, Parker S, Qiu X. The relationship between cognitive ability and depression: a longitudinal data analysis. Soc Psychiatry Psychiatr Epidemiol. 2013;48(12):1983–1992. doi:10.1007/s00127-013-0668-0
24. David AS, Zammit S, Lewis G, Dalman C, Allebeck P. Impairments in cognition across the spectrum of psychiatric disorders: evidence from a Swedish conscript cohort. Schizophr Bull. 2008;34(6):1035–1041. doi:10.1093/schbul/sbn028
25. Hammar Å, Årdal G. Cognitive functioning in major depression - A summary. Front Hum Neurosci. 2009;3(SEP). doi:10.3389/neuro.09.026.2009
26. Zammit S, Allebeck P, David AS, et al. A longitudinal study of Premorbid IQ score and risk of developing schizophrenia, bipolar disorder, severe depression, and other nonaffective psychoses. Arch Gen Psychiatry. 2004;61(4):354–360. doi:10.1001/archpsyc.61.4.354
27. Petkus A, Filoteo J, Schiehser D, Gomez M, Petzinger G. Worse cognitive performance predicts increased anxiety and depressive symptoms in patients with Parkinson’s disease: a bidirectional analysis. Neuropsychology. 2019;33(1):35–46. doi:10.1037/neu0000498
28. Dufouil C, Fuhrer R, Dartigues JF, Alpérovitch A. Longitudinal analysis of the association between depressive symptomatology and cognitive deterioration. Am J Epidemiol. 1996;144(7):634–641. doi:10.1093/oxfordjournals.aje.a008974
29. Pålsson K, Jaenson TGT. Plant products used as mosquito repellents in Guinea Bissau, West Africa. Acta Trop. 1999;72(1):39–52. doi:10.1016/S0001-706X(98)00083-7
30. Ballesio A, Lombardo C. Commentary: the relationship between sleep complaints, depression, and executive functions on older adults. Front Psychol. 2016;7(NOV). doi:10.3389/fpsyg.2016.01870
31. Rayward A, Duncan M, Brown W, Plotnikoff R, Burton N. A cross-sectional cluster analysis of the combined association of physical activity and sleep with sociodemographic and health characteristics in mid-aged and older adults. Maturitas. 2017;102:56–61. doi:10.1016/j.maturitas.2017.05.013
32. Tempesta D, Socci V, De Gennaro L, Ferrara M. Sleep and emotional processing. Sleep Med Rev. 2018;40:183–195. doi:10.1016/j.smrv.2017.12.005
33. Zhi TF, Sun XM, Li SJ, et al. Associations of sleep duration and sleep quality with life satisfaction in elderly Chinese: the mediating role of depression. Arch Gerontol Geriatr. 2016;65:211–217. doi:10.1016/j.archger.2016.03.023
34. Hirshkowitz M, Whiton K, Albert SM, et al. National Sleep Foundation’s sleep time duration recommendations: methodology and results summary. Sleep Heal. 2015;1(1):40–43. doi:10.1016/j.sleh.2014.12.010
35. Becker NB, Jesus SND, Viseu JN, Stobäus CD, Guerreiro M, Domingues RB. Depression and quality of life in older adults: mediation effect of sleep quality. Int J Clin Health Psychol. 2018;18(1):8. doi:10.1016/j.ijchp.2017.10.002
36. Devore EE, Grodstein F, Duffy JF, Stampfer MJ, Czeisler CA, Schernhammer ES. Sleep duration in midlife and later life in relation to cognition. J Am Geriatr Soc. 2014;62(6):1073–1081. doi:10.1111/jgs.12790
37. Saint Martin M, Sforza E, Barthélémy JC, Thomas-Anterion C, Roche F. Does subjective sleep affect cognitive function in healthy elderly subjects? The Proof cohort. Sleep Med. 2012;13(9):1146–1152. doi:10.1016/j.sleep.2012.06.021
38. Bastien CH, Fortier-Brochu É, Rioux I, Ḿelanie L, Daley M, Morin CM. Cognitive performance and sleep quality in the elderly suffering from chronic insomnia: relationship between objective and subjective measures. J Psychosom Res. 2003;54(1):39–49. doi:10.1016/S0022-3999(02)00544-5
39. Kronholm E, Sallinen M, Suutama T, Sulkava R, Era P, Partonen T. Self-reported sleep duration and cognitive functioning in the general population. J Sleep Res. 2009;18(4):436–446. doi:10.1111/j.1365-2869.2009.00765.x
40. Lucey BP. It’s complicated: the relationship between sleep and Alzheimer’s disease in humans. Neurobiol Dis. 2020;144:105031. doi:10.1016/j.nbd.2020.105031
41. Spira AP, Gamaldo AA, An Y, et al. Self-reported sleep and β-Amyloid deposition in community-dwelling older adults. JAMA Neurol. 2013;70(12):1537–1543. doi:10.1001/jamaneurol.2013.4258
42. Carvalho DZ, St Louis EK, Knopman DS, et al. Association of excessive daytime sleepiness with longitudinal β-Amyloid accumulation in elderly persons without dementia. JAMA Neurol. 2018;75(6):672–680. doi:10.1001/jamaneurol.2018.0049
43. Branger P, Arenaza-Urquijo EM, Tomadesso C, et al. Relationships between sleep quality and brain volume, metabolism, and amyloid deposition in late adulthood. Neurobiol Aging. 2016;41:107–114. doi:10.1016/j.neurobiolaging.2016.02.009
44. Brown BM, Rainey-Smith SR, Villemagne VL, et al. The relationship between sleep quality and brain amyloid burden. Sleep. 2016;39(5):1063–1068. doi:10.5665/sleep.5756
45. Sprecher KE, Koscik RL, Carlsson CM, et al. Poor sleep is associated with CSF biomarkers of amyloid pathology in cognitively normal adults. Neurology. 2017;89(5):445–453. doi:10.1212/WNL.0000000000004171
46. Sprecher KE, Bendlin BB, Racine AM, et al. Amyloid burden is associated with self-reported sleep in nondemented late middle-aged adults. Neurobiol Aging. 2015;36(9):2568–2576. doi:10.1016/j.neurobiolaging.2015.05.004
47. Vaou OE, Lin SH, Branson C, Auerbach S. Sleep and dementia. Curr Sleep Med Rep. 2018;4(2):134–142. doi:10.1007/s40675-018-0112-9
48. Lim ASP, Kowgier M, Yu L, Buchman AS, Bennett DA. Sleep fragmentation and the risk of incident Alzheimer’s disease and cognitive decline in older persons. Sleep. 2013;36(7):1027–1032. doi:10.5665/sleep.2802
49. Xie L, Kang H, Xu Q, et al. Sleep drives metabolite clearance from the adult brain. Science (80-). 2013;342(6156):373–377. doi:10.1126/science.1241224
50. Ju YES, Zangrilli MA, Finn MB, Fagan AM, Holtzman DM. Obstructive sleep apnea treatment, slow wave activity, and amyloid-β. Ann Neurol. 2019;85(2):291–295. doi:10.1002/ana.25408
51. Winer JR, Mander BA, Helfrich RF, et al. Sleep as a potential biomarker of tau and -amyloid burden in the human brain. J Neurosci. 2019;39(32):6315–6324. doi:10.1523/JNEUROSCI.0503-19.2019
52. Guan Q, Hu X, Ma N, et al. Sleep quality, depression, and cognitive function in non-demented older adults. J Alzheimer’s Dis. 2020;76(4):1637–1650. doi:10.3233/JAD-190990
53. Koffel E, Watson D. The two-factor structure of sleep complaints and its relation to depression and anxiety. J Abnorm Psychol. 2009;118(1):183–194. doi:10.1037/a0013945
54. Komada Y, Nomura T, Kusumi M, et al. Correlations among insomnia symptoms, sleep medication use and depressive symptoms. Psychiatry Clin Neurosci. 2011;65(1):20–29. doi:10.1111/j.1440-1819.2010.02154.x
55. Li Y, Hao Y, Fan F, Zhang B. The role of microbiome in insomnia, circadian disturbance and depression. Front Psychiatry. 2018;9:669. doi:10.3389/fpsyt.2018.00669
56. Kahn RS, Keefe RSE. Schizophrenia is a cognitive illness: time for a change in focus. JAMA Psychiatry. 2013;70(10):1107–1112. doi:10.1001/jamapsychiatry.2013.155
57. Vargas I, Vgontzas AN, Abelson JL, Faghih RT, Morales KH, Perlis ML. Altered ultradian cortisol rhythmicity as a potential neurobiologic substrate for chronic insomnia. Sleep Med Rev. 2018;41:234–243. doi:10.1016/j.smrv.2018.03.003
58. Holsboer F. The corticosteroid receptor hypothesis of depression. Neuropsychopharmacology. 2000;23(5):477–501. doi:10.1016/S0893-133X(00)00159-7
59. Qin D, Li Z, Li Z, et al. Chronic glucocorticoid exposure induces depression-like phenotype in rhesus macaque (Macaca Mulatta). Front Neurosci. 2019;13:188. doi:10.3389/fnins.2019.00188
60. Ellis JG, Perlis ML, Bastien CH, Gardani M, Espie CA. The natural history of insomnia: acute insomnia and first-onset depression. Sleep. 2014;37(1):97–106. doi:10.5665/sleep.3316
61. Perlis ML, Smith LJ, Lyness JM, et al. Insomnia as a risk factor for onset of depression in the elderly. Behav Sleep Med. 2010;4(2):104–113. doi:10.1207/s15402010bsm0402_3
62. Riemann D, Krone LB, Wulff K, Nissen C. Sleep, insomnia, and depression. Neuropsychopharmacology. 2020;45(1):74–89. doi:10.1038/s41386-019-0411-y
63. Poole L, Jackowska M. The epidemiology of depressive symptoms and poor sleep: findings from the English Longitudinal Study of Ageing (ELSA). Int J Behav Med. 2017;25(2):151–161.
64. Valdés-Tovar M, Estrada-Reyes R, Solís-Chagoyán H, et al. Circadian modulation of neuroplasticity by melatonin: a target in the treatment of depression. Br J Pharmacol. 2018;175(16):3200–3208. doi:10.1111/bph.14197
65. Willett J, Singer J, Martin N. The design and analysis of longitudinal studies of development and psychopathology in context: statistical models and methodological recommendations. Dev Psychopathol. 1998;10(2):395–426. doi:10.1017/S0954579498001667
66. Murnane RJ, Willett JB. Methods Matter: Improving Causal Inference in Educational and Social Science Research. Oxford University Press; 2011.
67. Mougias A, Christidi F, Synetou M, Kotrotsou I, Valkimadi P, Politis A. Differential effect of demographics, processing speed, and depression on cognitive function in 755 non-demented community-dwelling elderly individuals. Cogn Behav Neurol. 2019;32(4):236–246. doi:10.1097/WNN.0000000000000211
68. Lee S, Kawachi I, Berkman LF, Grodstein F. Education, other socioeconomic indicators, and cognitive function. Am J Epidemiol. 2003;157(8):712–720. doi:10.1093/aje/kwg042
69. Elwood PC, Gallacher JE, Hopkinson CA, et al. Smoking, drinking, and other life style factors and cognitive function in men in the Caerphilly cohort. J Epidemiol Community Heal. 1999;53(1):9–14. doi:10.1136/jech.53.1.9
70. Hendrickx H, McEwen BS, Ouderaa FVD. Metabolism, mood and cognition in aging: the importance of lifestyle and dietary intervention. Neurobiol Aging. 2005;26(1):1–5. doi:10.1016/j.neurobiolaging.2005.10.005
71. Evans IEM, Llewellyn DJ, Matthews FE, Woods RT, Brayne C, Clare L. Social isolation, cognitive reserve, and cognition in older people with depression and anxiety. Aging Ment Heal. 2019;23(12):1691–1700. doi:10.1080/13607863.2018.1506742
72. Stogmann E, Moser D, Klug S, et al. Activities of daily living and depressive symptoms in patients with subjective cognitive decline, mild cognitive impairment, and Alzheimer’s Disease. J Alzheimer’s Dis. 2016;49(4):1043–1050. doi:10.3233/JAD-150785
73. Zeng Y. Toward deeper research and better policy for healthy aging - using the unique data of Chinese longitudinal healthy longevity survey. China Econ J. 2012;5(2–3):131–149. doi:10.1080/17538963.2013.764677
74. Zeng Y. Healthy longevity in China: demographic, socioeconomic, and psychological dimensions. Springer Science+ Business Media BV; 2008:435.
75. Folstein MF, Folstein SE, McHugh PR. Mini-mental state: a practical method for grading the cognitive state of patients for the clinician. J Psychiatr Res. 1975;12(3):189–198. doi:10.1016/0022-3956(75)90026-6
76. Lagona F, Zhang Z. A missing composite covariate in survival analysis: a case study of the chinese longitudinal health and longevity survey. Stat Med. 2010;29(2):248–261. doi:10.1002/sim.3773
77. Zeng Y, Vaupel JW. Association of late childbearing with healthy longevity among the oldest-old in China. Popul Stud (NY). 2004;58(1):37–53. doi:10.1080/0032472032000175437
78. Zeng Y, Chen H, Shi X, et al. Health consequences of familial longevity influence among the Chinese elderly. J Gerontol - Ser a Biol Sci Med Sci. 2013;68(4):473–482. doi:10.1093/gerona/gls203
79. Feng Q, Son J, Zeng Y. Prevalence and correlates of successful ageing: a comparative study between China and South Korea. Eur J Ageing. 2014;12(2):83–94.
80. Shen K, Zhang B, Feng Q. Association between tea consumption and depressive symptom among Chinese older adults. BMC Geriatr. 2019;19(1):1–8. doi:10.1186/s12877-019-1259-z
81. Nunnally J. Psychometric Theory. McGraw-Hill; 1967.
82. Dereli M, Kahraman T. Validity and reliability of the Turkish version of single-item Sleep Quality Scale in healthy adults. Sleep Med. 2021;88:197–203. doi:10.1016/j.sleep.2021.10.032
83. Cappelleri JC, Bushmakin AG, McDermott AM, Sadosky AB, Petrie CD, Martin S. Psychometric properties of a single-item scale to assess sleep quality among individuals with fibromyalgia. Health Qual Life Outcomes. 2009;7(1):1–7. doi:10.1186/1477-7525-7-54
84. Snyder E, Cai B, DeMuro C, Morrison MF, Ball W. A new single-item sleep quality scale: results of psychometric evaluation in patients with chronic primary insomnia and depression. J Clin Sleep Med. 2018;14(11):1849–1857.
85. Atroszko P, Bagińska P, Mokosińska M, Atroszko B. Validity and reliability of single-item self-report measures of general quality of life, general health and sleep quality; 2015.
86. Santini ZI, Jose PE, York Cornwell E, et al. Social disconnectedness, perceived isolation, and symptoms of depression and anxiety among older Americans (NSHAP): a longitudinal mediation analysis. Lancet Public Heal. 2020;5(1):e62–e70. doi:10.1016/S2468-2667(19)30230-0
87. Mund M, Nestler S. Beyond the cross-lagged panel model: next-generation statistical tools for analyzing interdependencies across the life course. Adv Life Course Res. 2019;41:100249. doi:10.1016/j.alcr.2018.10.002
88. Hamaker EL, Kuiper RM, Grasman RPPP. A critique of the cross-lagged panel model. Psychol Methods. 2015;20(1):102–116. doi:10.1037/a0038889
89. Coffman D, MacCallum R. Using parcels to convert path analysis models into latent variable models. Multivariate Behav Res. 2005;40(2):235–259. doi:10.1207/s15327906mbr4002_4
90. Luo J, Wang MC, Ge Y, Chen W, Xu S. Longitudinal invariance analysis of the short grit scale in Chinese young adults. Front Psychol. 2020;11(2):263–270. doi:10.3389/fpsyg.2020.00466
91. Satorra A, Bentler PM. A scaled difference chi-square test statistic for moment structure analysis. Psychometrika. 2001;66(4):507–514. doi:10.1007/BF02296192
92. Cacioppo JT, Hawkley LC, Thisted RA. Perceived social isolation makes me sad: 5-year cross-lagged analyses of loneliness and depressive symptomatology in the Chicago health, aging, and social relations study. Psychol Aging. 2010;25(2):453–463. doi:10.1037/a0017216
93. Muthñn LK, Muthñn BO. Mplus User’s Guide. Seventh. Muthén L, Muthén B, editors. Muthén & Muthén; 2012.
94. Wang J, Wang X. Structural Equation Modeling: Applications Using Mplus. John Wiley; 2019.
95. Hu LT, Bentler PM. Cutoff criteria for fit indexes in covariance structure analysis: conventional criteria versus new alternatives. Struct Equ Model. 1999;6(1):1–55. doi:10.1080/10705519909540118
96. Newsom JT. Longitudinal Structural Equation Modeling. Guilford Press; 2015.
97. Cheung GW, Rensvold RB. Evaluating goodness-of-fit indexes for testing measurement invariance. Struct Equ Model. 2002;9(2):233–255. doi:10.1207/S15328007SEM0902_5
98. Little TD. Longitudinal Structural Equation Modeling. Guilford Press; 2013.
99. Jorm AF. Is depression a risk factor for dementia or cognitive decline? Gerontology. 2000;46(4):219–227. doi:10.1159/000022163
100. Wang S, Blazer DG. Depression and cognition in the elderly. Annu Rev Clin Psychol. 2015;11:331–360. doi:10.1146/annurev-clinpsy-032814-112828
101. Plassman BL, Williams JW, Burke JR, Holsinger T, Benjamin S. Systematic review: factors associated with risk for and possible prevention of cognitive decline in later life. Ann Intern Med. 2010;153:182–193. doi:10.7326/0003-4819-153-3-201008030-00258
102. Sözeri-Varma G. Depression in the elderly: clinical features and risk factors. Aging Dis. 2012;3(6):465.
103. Cano-López I, Aliño M, Duque A, et al. Educational level as a protective factor against the influence of depressive symptoms on cognition in older adults: implications for functional Independence during a 10-year follow-up. Int Psychogeriatrics. 2021;33(8):813–825. doi:10.1017/S1041610221000272
104. Gotlib IH, Joormann J. Cognition and depression: current status and future directions. Ann Rev Clin Psychol. 2010;6:285–312. doi:10.1146/annurev.clinpsy121208131305
105. Lamis DA, Hirsch JK, Pugh KC, et al. Perceived cognitive deficits and depressive symptoms in patients with multiple sclerosis: perceived stress and sleep quality as mediators. Mult Scler Relat Disord. 2018;25:150–155. doi:10.1016/j.msard.2018.07.019
106. Demeyer I, De lissnyder E, Koster EHW, De Raedt R. Rumination mediates the relationship between impaired cognitive control for emotional information and depressive symptoms: a prospective study in remitted depressed adults. Behav Res Ther. 2012;50(5):292–297. doi:10.1016/j.brat.2012.02.012
107. Sheline YI, Barch DM, Garcia K, et al. Cognitive function in late life depression: relationships to depression severity, cerebrovascular risk factors and processing speed. Biol Psychiatry. 2006;60(1):58–65. doi:10.1016/j.biopsych.2005.09.019
108. Landry GJ, Best JR, Liu-Ambrose T. Measuring sleep quality in older adults: a comparison using subjective and objective methods. Front Aging Neurosci. 2015;7(SEP):166. doi:10.3389/fnagi.2015.00166
 © 2022 The Author(s). This work is published and licensed by Dove Medical Press Limited. The
full terms of this license are available at https://www.dovepress.com/terms
and incorporate the Creative Commons Attribution
- Non Commercial (unported, 3.0) License.
By accessing the work you hereby accept the Terms. Non-commercial uses of the work are permitted
without any further permission from Dove Medical Press Limited, provided the work is properly
attributed. For permission for commercial use of this work, please see paragraphs 4.2 and 5 of our Terms.
© 2022 The Author(s). This work is published and licensed by Dove Medical Press Limited. The
full terms of this license are available at https://www.dovepress.com/terms
and incorporate the Creative Commons Attribution
- Non Commercial (unported, 3.0) License.
By accessing the work you hereby accept the Terms. Non-commercial uses of the work are permitted
without any further permission from Dove Medical Press Limited, provided the work is properly
attributed. For permission for commercial use of this work, please see paragraphs 4.2 and 5 of our Terms.