Back to Journals » Nature and Science of Sleep » Volume 14
Sleep-Induced Hypoxia under Flight Conditions: Implications and Countermeasures for Long-Haul Flight Crews and Passengers
Authors Elmenhorst EM ![]() , Rooney D
, Rooney D ![]() , Benderoth S, Wittkowski M, Wenzel J, Aeschbach D
, Benderoth S, Wittkowski M, Wenzel J, Aeschbach D
Received 14 September 2021
Accepted for publication 22 December 2021
Published 11 February 2022 Volume 2022:14 Pages 193—205
DOI https://doi.org/10.2147/NSS.S339196
Checked for plagiarism Yes
Review by Single anonymous peer review
Peer reviewer comments 2
Editor who approved publication: Prof. Dr. Ahmed BaHammam
Eva-Maria Elmenhorst,1,2 Daniel Rooney,1 Sibylle Benderoth,1 Martin Wittkowski,1 Juergen Wenzel,1 Daniel Aeschbach1,3,4
1Department of Sleep and Human Factors Research, Institute of Aerospace Medicine, German Aerospace Center (DLR), Cologne, 51170, Germany; 2Institute for Occupational and Social Medicine, Medical Faculty, RWTH Aachen University, Aachen, 52074, Germany; 3Institute of Experimental Epileptology and Cognition Research, University of Bonn Medical Center, Bonn, 53127, Germany; 4Division of Sleep Medicine, Harvard Medical School, Boston, MA, 02115, USA
Correspondence: Eva-Maria Elmenhorst, Department of Sleep and Human Factors Research, Institute of Aerospace Medicine, German Aerospace Center (DLR), Cologne, 51170, Germany, Tel +49 2213 601 4735, Fax +49 2213 68323, Email [email protected]
Purpose: Recuperation during sleep on board of commercial long-haul flights is a safety issue of utmost importance for flight crews working extended duty periods. We intended to explore how sleep and blood oxygenation (in wake versus sleep) are affected by the conditions in an airliner at cruising altitude.
Methods: Healthy participants’ sleep was compared between 4-h sleep opportunities in the sleep laboratory (n = 23; sleep lab, ie, 53 m above sea level) and in an altitude chamber (n = 20; flight level, ie, 753 hPa, corresponding to 2438 m above sea level). A subgroup of 12 participants underwent three additional conditions in the altitude chamber: 1) 4-h sleep at ground level, 2) 4-h sleep at flight level with oxygen partial pressure equivalent to ground level, 3) 4-h monitored wakefulness at flight level. Sleep structure and blood oxygenation were analysed with mixed ANOVAs.
Results: Total sleep time at flight level compared to in the sleep laboratory was shorter (Δ mean ± standard error − 11.1 ± 4.2 min) and included less N3 sleep (Δ − 17.6 ± 5.4 min), while blood oxygenation was decreased. Participants spent 69.7% (± 8.3%) of the sleep period time but only 13.2% (± 3.0%) of monitored wakefulness in a hypoxic state (< 90% oxygen saturation). Oxygen enrichment of the chamber prevented oxygen desaturation.
Conclusion: Sleep – but not wakefulness – under flight conditions induces hypobaric hypoxia which may contribute to impaired sleep. The results caution against the assumption of equivalent crew recovery in-flight and on the ground but hold promise for oxygen enrichment as a countermeasure. The present results have implications for flight safety and possible long-term consequences for health in crews.
Keywords: polysomnography, oxygen saturation, EEG sleep power spectra, altitude, air travel, oxygen enrichment
A Letter to the Editor has been published for this article
Introduction
With the steady increase in number and duration of long-haul flights, crews’ on-board sleep, recovery, and performance are an important topic for safety. The current European regulations limit the maximum flight duty period to 13 hours during daytime and 11 hours during nighttime (Commission Regulation (EU) Nr. 83/2014). The schedule of many long-distance flights exceeds these limitations so that additional crewmembers are required for operation. Thus, adequate recuperation for off-duty crewmembers must be granted on board.
Sleep is the key for safe operations as it lays the basis for high cognitive performance and vigilance, whereas extended time awake can increase crew fatigue risk.1,2 From mountaineering investigations, it is known that the environmental conditions at high altitudes cause fragmented and disturbed sleep.3,4 Flight crews have reported short and disrupted inflight sleep periods.5,6 At cruising altitude a commercial airplane is required to have a minimum barometric pressure of 753 hPa inside the pressurized cabin (equivalent to an altitude of 2438 m).7 At this altitude, the oxygen partial pressure is lower and corresponds to 158 hPa8 (21% O2 * 753 hPa = 158 hPa = 118 mmHg) instead of 213 hPa at sea level (15°C, dry). This altitude is defined as the lower limit of moderate altitude (2438–4572 m).9 Healthy persons partly compensate reduced oxygen availability by increasing depth and rate of breathing as well as by increasing cardiac output. In awake healthy persons, these mechanisms counteract and partly prevent typical effects of hypobaric hypoxia up to an altitude of 3048 m (region of complete compensation).10 The effectiveness of these mechanisms shows, however, high inter-individual variability with respect to physiological reactions11 as well as cognitive and physical performance.9 Respiratory disturbances such as periodic breathing have been reported to occur during sleep at higher altitude.12 These respiratory patterns may negatively impact sleep efficiency through frequent arousals, but there have been studies that did not find a relation to sleep fragmentation.13 At high altitudes periodic breathing seems to intensify with acclimatization, possibly reversing or preventing further oxygen desaturation,3 while arousals may decrease at the same time.14 At moderate altitudes, the picture is controversial, with some studies that did15,16 and others that did not13 observe respiratory disturbances.
In addition to the decreased pressure, the air in the cabin is dry and the inflight noise is considerable. Taken together, problems that may arise due to on-board conditions include hypobaric hypoxia, dehydration and dry mucosae, and noise stress,17,18 which may all have a negative impact on sleep.
In the present study, conditions in a crew-rest unit of an airliner at cruising altitude were simulated in an altitude chamber on the ground to investigate their impact on healthy individuals. We hypothesized that 1) sleep quality and oxygen saturation would be negatively affected when compared to sleep in the sleep laboratory, and that 2) oxygen enrichment of the cabin air to a partial pressure equivalent to sea level would restore blood oxygenation.
Materials and Methods
All participants signed informed consent according to the Declaration of Helsinki and were remunerated for participation. The study was approved by the Ethics Committee of the North Rhine Medical Board. The Ethics Committee of the North Rhine Medical Board is an independent review board that is responsible for our studies since the German Aerospace Center does not have an institutional review board.
Results from two studies, performed at the Institute of Aerospace Medicine of the German Aerospace Center, are reported. A flowchart provides an overview of participants and protocol (Figure 1).
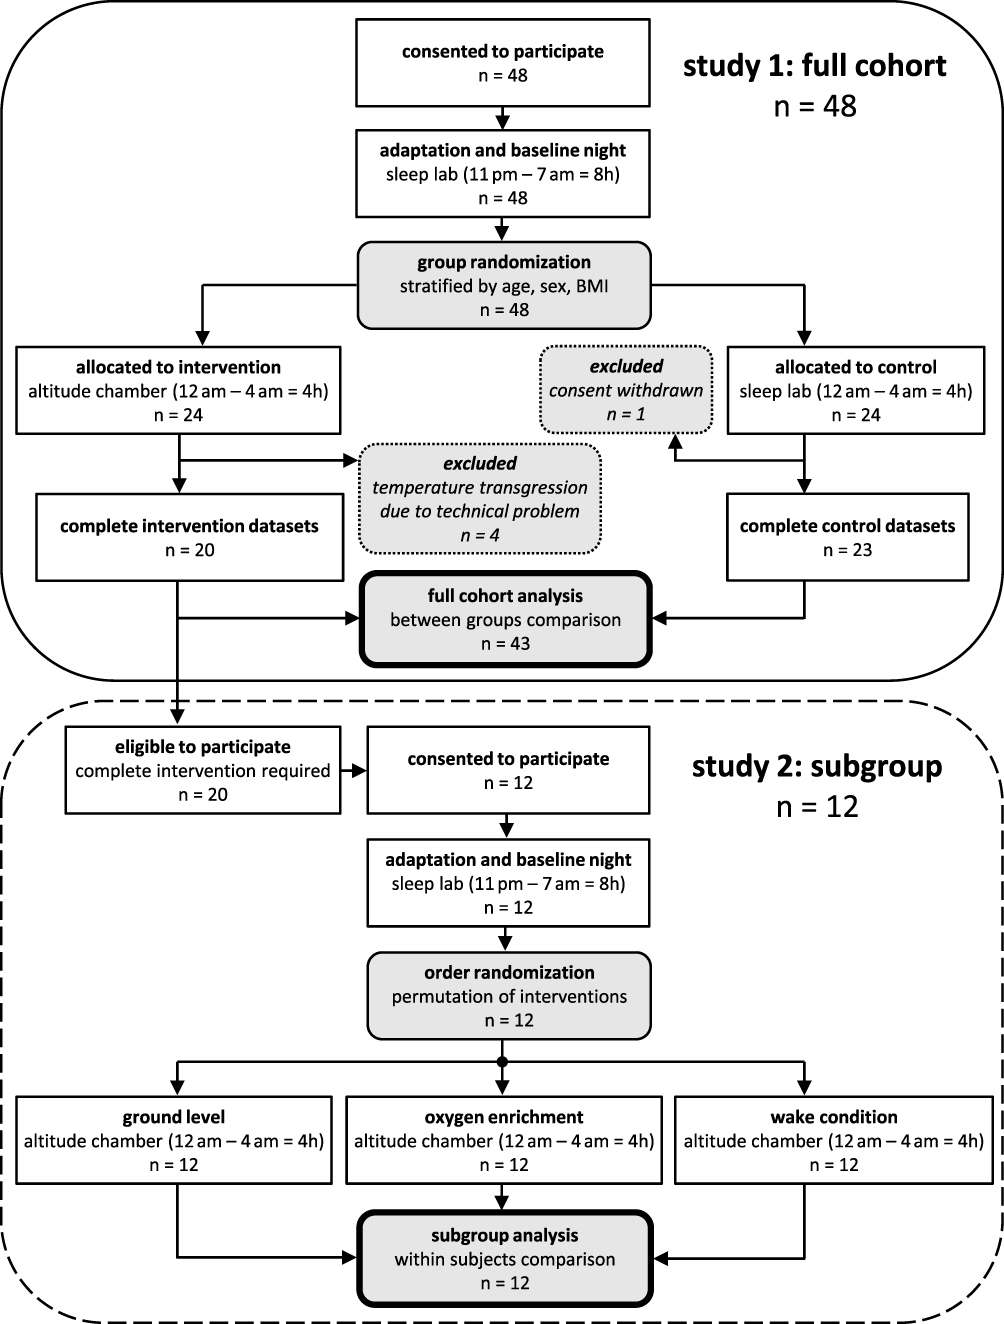 |
Figure 1 Study flow detailing participants and protocol. |
Participants
Study 1: Questionnaires, medical history, physical examination, blood and urine tests, and electrocardiography were used in a multi-level screening process to exclude applicants with physical, psychological, intrinsic sleep or circadian disorders. Forty-eight subjects between 18 and 40 years of age were included and randomly assigned to two groups stratified by age, gender, and BMI. One group was exposed to the experimental condition (flight level), the other served as control (sleep lab). Four data sets of the experimental group had to be excluded due to high temperatures caused by technical problems in the altitude chamber which might have disturbed sleep, leaving data of 20 participants (10 female, mean age 26.1 years ± 4.5 SD, BMI 23.4 ± 2.3 SD). One participant of the control group withdrew consent before the end of the study, resulting in 23 datasets (9 female, mean age 26.4 years ± 5.8 SD, BMI 24.3 ± 2.7 SD).
Study 2: A subgroup of 12 participants (6 female, mean age 26.2 years ± 5.1 SD, BMI 23.9 ± 1.8 SD) was randomly selected from the 20 participants of the experimental group of study 1 to undergo a second set of interventions.
Setting and Procedures
Study 1: Participants stayed under controlled conditions in the laboratory. First, participants underwent two adaptation nights followed by one baseline night (11:00 pm to 07:00 am). During the adaptation nights, participants had the opportunity to adapt to the laboratory environment and polysomnographic equipment. The first adaptation night also served to screen out preexisting sleep pathologies (sleep apnea). After the baseline night, participants were examined in three different sleep restriction/deprivation conditions which were scheduled in counterbalanced fashion (for methodological details see19,20). Each sleep restriction/deprivation regimen was followed by two 8-h recovery nights (11:00 pm to 07:00 am) except for the first recovery night after total sleep deprivation (09:00 pm to 07:00 am) which provided a 10-h sleep opportunity. The three regimens consisted of: i) Total sleep deprivation – participants stayed awake for 38 h from 07:00 am to 09:00 pm the next day. ii) Sleep restriction and alcohol – participants drank alcohol during daytime and were scheduled to sleep from 00:00 am to 04:00 am either in the sleep lab or in the altitude chamber (as detailed under iii). iii) Sleep restriction – participants had a sleep opportunity of 4 h from 00:00 am to 04:00 am either in the sleep lab or in the altitude chamber (flight level). This sleep restriction data (iii) was included in the present analyses comprising the following two experimental conditions:
- Flight level: the experimental group slept in an altitude chamber furnished as a four-bed crew-rest unit under atmospheric conditions equivalent to an airliner cabin at cruising altitude. Accordingly, ambient pressure was maintained at 753 hPa corresponding to 2438 m altitude, and in-flight noise at 70 dB(A) (replayed from a recording during a commercial flight from Cologne to Cairo in a crew-rest unit of an Airbus A340-300).
- Sleep lab: the control group slept in the sleep laboratory in private bed rooms under normobaric (53 m altitude) conditions and in quiet (<30 dB(A)).
Study 2: After one adaptation night and one baseline night in the sleep laboratory with 8 hours sleep opportunity each (11:00 pm to 07:00 am), participants underwent three different experimental conditions (counterbalanced) in the crew-rest unit of the altitude chamber from 00:00 am to 04:00 am.
- Ground level: 4-h sleep opportunity under normobaric (pressure = 982.8 ± 0.2 hPa SD) as well as normoxic conditions (21% oxygen content).
- Oxygen enrichment: 4-h sleep opportunity at decreased ambient pressure (753 hPa) but with increased oxygen fraction (27.8%) to maintain a partial pressure of oxygen equivalent to ground level (209 hPa).
- Wake condition: 4-h recumbent monitored wakefulness under hypobaric (753 hPa) conditions equivalent to an airliner cabin at cruising altitude.
Two recovery nights were provided between the experimental conditions. Participants spent the first recovery night at home (09:00 pm to 07:00 am), with bedtime and rise time verified by wrist actigraphy (ZAK, Marktheidenfeld), and the second recovery night in the sleep laboratory (11:00 pm to 07:00 am). Adaptation, baseline, and recovery nights in the sleep lab further ensured that participants strictly adhered to the scheduled sleep times and did not incur a sleep deficit prior to the experimental conditions in the altitude chamber. Facilities and recording devices were identical with study 1. In all conditions, the inflight noise of 70 dB(A) was played back like in study 1. We used a short pressurize/depressurize sham manoeuvre at the start of all conditions to guarantee successful blinding of participants with respect to the ambient pressure of the conditions. They were also blind to the oxygen content of conditions.
Polysomnography (PSG)
Study 1: Participants’ sleep was recorded using electroencephalography (EEG: C3, F3, O1, and C4, F4, O2, referenced to A2 and A1 respectively), electrooculography, submental electromyography, and one-lead electrocardiography according to the international 10–20 system. Signals were filtered (high-pass: time constant, 2.2 s for EEG and EOG; 0.04 s for EMG; low-pass: Butterworth, 12 dB/octave; −6 dB at 70 Hz for EEG, EOG, and EMG) and digitized with a 12-bit resolution, a 1024-Hz sampling, and 256-Hz storage rate. Sleep stages were scored in 30-s epochs and arousals were marked according to conventional criteria21 by one trained technician. Digitized EEG signals from C3/A2 or C4/A1 (same derivation was used for all nights of each participant; chosen with respect to signal quality; high-pass filter, time constant 4 s; low-pass filter, Butterworth, 36 dB/octave, filter of 6th rank; −6 dB at 70 Hz) were subjected to fast Fourier transformation (FFT) using 4-s epochs (Hanning window, no averaging) with 3-s shift. Epochs with high-frequency and/or low-frequency artifacts, usually arising from body movements, were excluded automatically based on deviations from a moving median. Whole night power spectra were visually inspected for further artifact detection and exclusion. PSG data from two participants of study 1 (one of the experimental and control group each) had to be excluded due to artifacts. Signal quality of additional 12 nights was insufficient for FFT analyses (6 participants from sleep lab and altitude chamber each were excluded).
Study 2: Due to technical problems (inadvertent change in the high-pass filter settings of the EEG), PSG data from study 2 could not be used for comparisons with study 1 and were discarded from the present analysis.
Self-Reported Sleep Quality and Sleepiness
Study 1: In the morning, shortly after awakening, participants evaluated their sleep episode with digital 100 mm long visual analogue scales regarding sleep depth (anchors: sound versus shallow), calmness of sleep (anchors: calm versus restless), and recuperation during sleep (anchors: high versus low). At 9:00 am, they rated their sleepiness on the Karolinska Sleepiness Scale (KSS22).
Study 2: Self-ratings were not available.
Blood Oxygen Saturation
Study 1 and 2: Blood oxygen saturation (SpO2) was recorded with a fingertip sensor which was integrated in our sleep recording device (PD3, DLR) and was used for all analyses of oxygen saturation. For continuous online-monitoring an additional sensor (fingertip sensor PalmSAT® 2500 Series, Nonin) was used.
Statistics
We analysed the effect of the different conditions on sleep structure, sleep EEG spectral power density, SpO2, and heart rate using random subject mixed models (SAS version 9.4):
Study 1: Sleep structure (total sleep time (TST), sleep efficiency, sleep onset latency (SOL), WASO, and N1, N2, N3, REM sleep in minutes per sleep period time (SPT)), number of awakenings and arousals, and self-reported sleep depth, calmness, and recuperation during sleep as well as sleepiness were analysed with factor group (flight level, control group), and baseline sleep in the sleep lab as covariate. We defined awakenings as transition from a sleep stage (N1, N2, N3, and REM) to wake during SPT. In order to approach normal distribution, SOL (ie, elapsed time until first occurrence of N2) was log-transformed prior to analyses. Log-transformed EEG power spectra in non-REM (N2 and N3) and REM sleep were analysed with factor group and corresponding data from the first four hours of baseline sleep in the sleep lab as covariate. Alpha-inflation due to multiple comparisons was accounted for using the Benjamini Hochberg method. Analyses of SpO2 and heart rate were performed on means per TST, SOL, and per sleep stage (wake, N1, N2, N3, and REM sleep within the SPT) with factor group. N = 18 contributed to the analyses of SpO2 of the flight level group due to data loss in the altitude chamber. We defined desaturation events as transitions from above to below 90% SpO2 and from above to below 85% SpO2. These calculations were based on 1,440 10-s averages of 1-s SpO2 values (4 h = 14,400 s). Consequently, a continuously alternating pattern between values above and below 90% SpO2 would have resulted in a maximum number of 720 desaturation events.
Study 2: SpO2 and heart rate were each analysed with factor condition (ground level, flight level (study 1 data of the subgroup), oxygen enrichment, recumbent wakefulness) using Tukey-Kramer correction for multiple comparisons.
Significance level was assumed at α < 0.05. If not otherwise mentioned values are given as mean ± standard error (SE).
Results
Sleep Quantity and Quality
Study 1: Sleep quantity and quality were significantly impaired in the flight level group in the altitude chamber compared to the control group in the sleep lab (Table 1). In the flight level group, TST was shorter by 11.1 min, sleep efficiency was lower by 12.4%, and N1, N3, and REM were reduced by 4.3, 17.6, and 20.1 min, respectively, while N2 was increased by 31.1 min. Number of awakenings was higher and number of arousals lower in the flight level group compared to the control group.
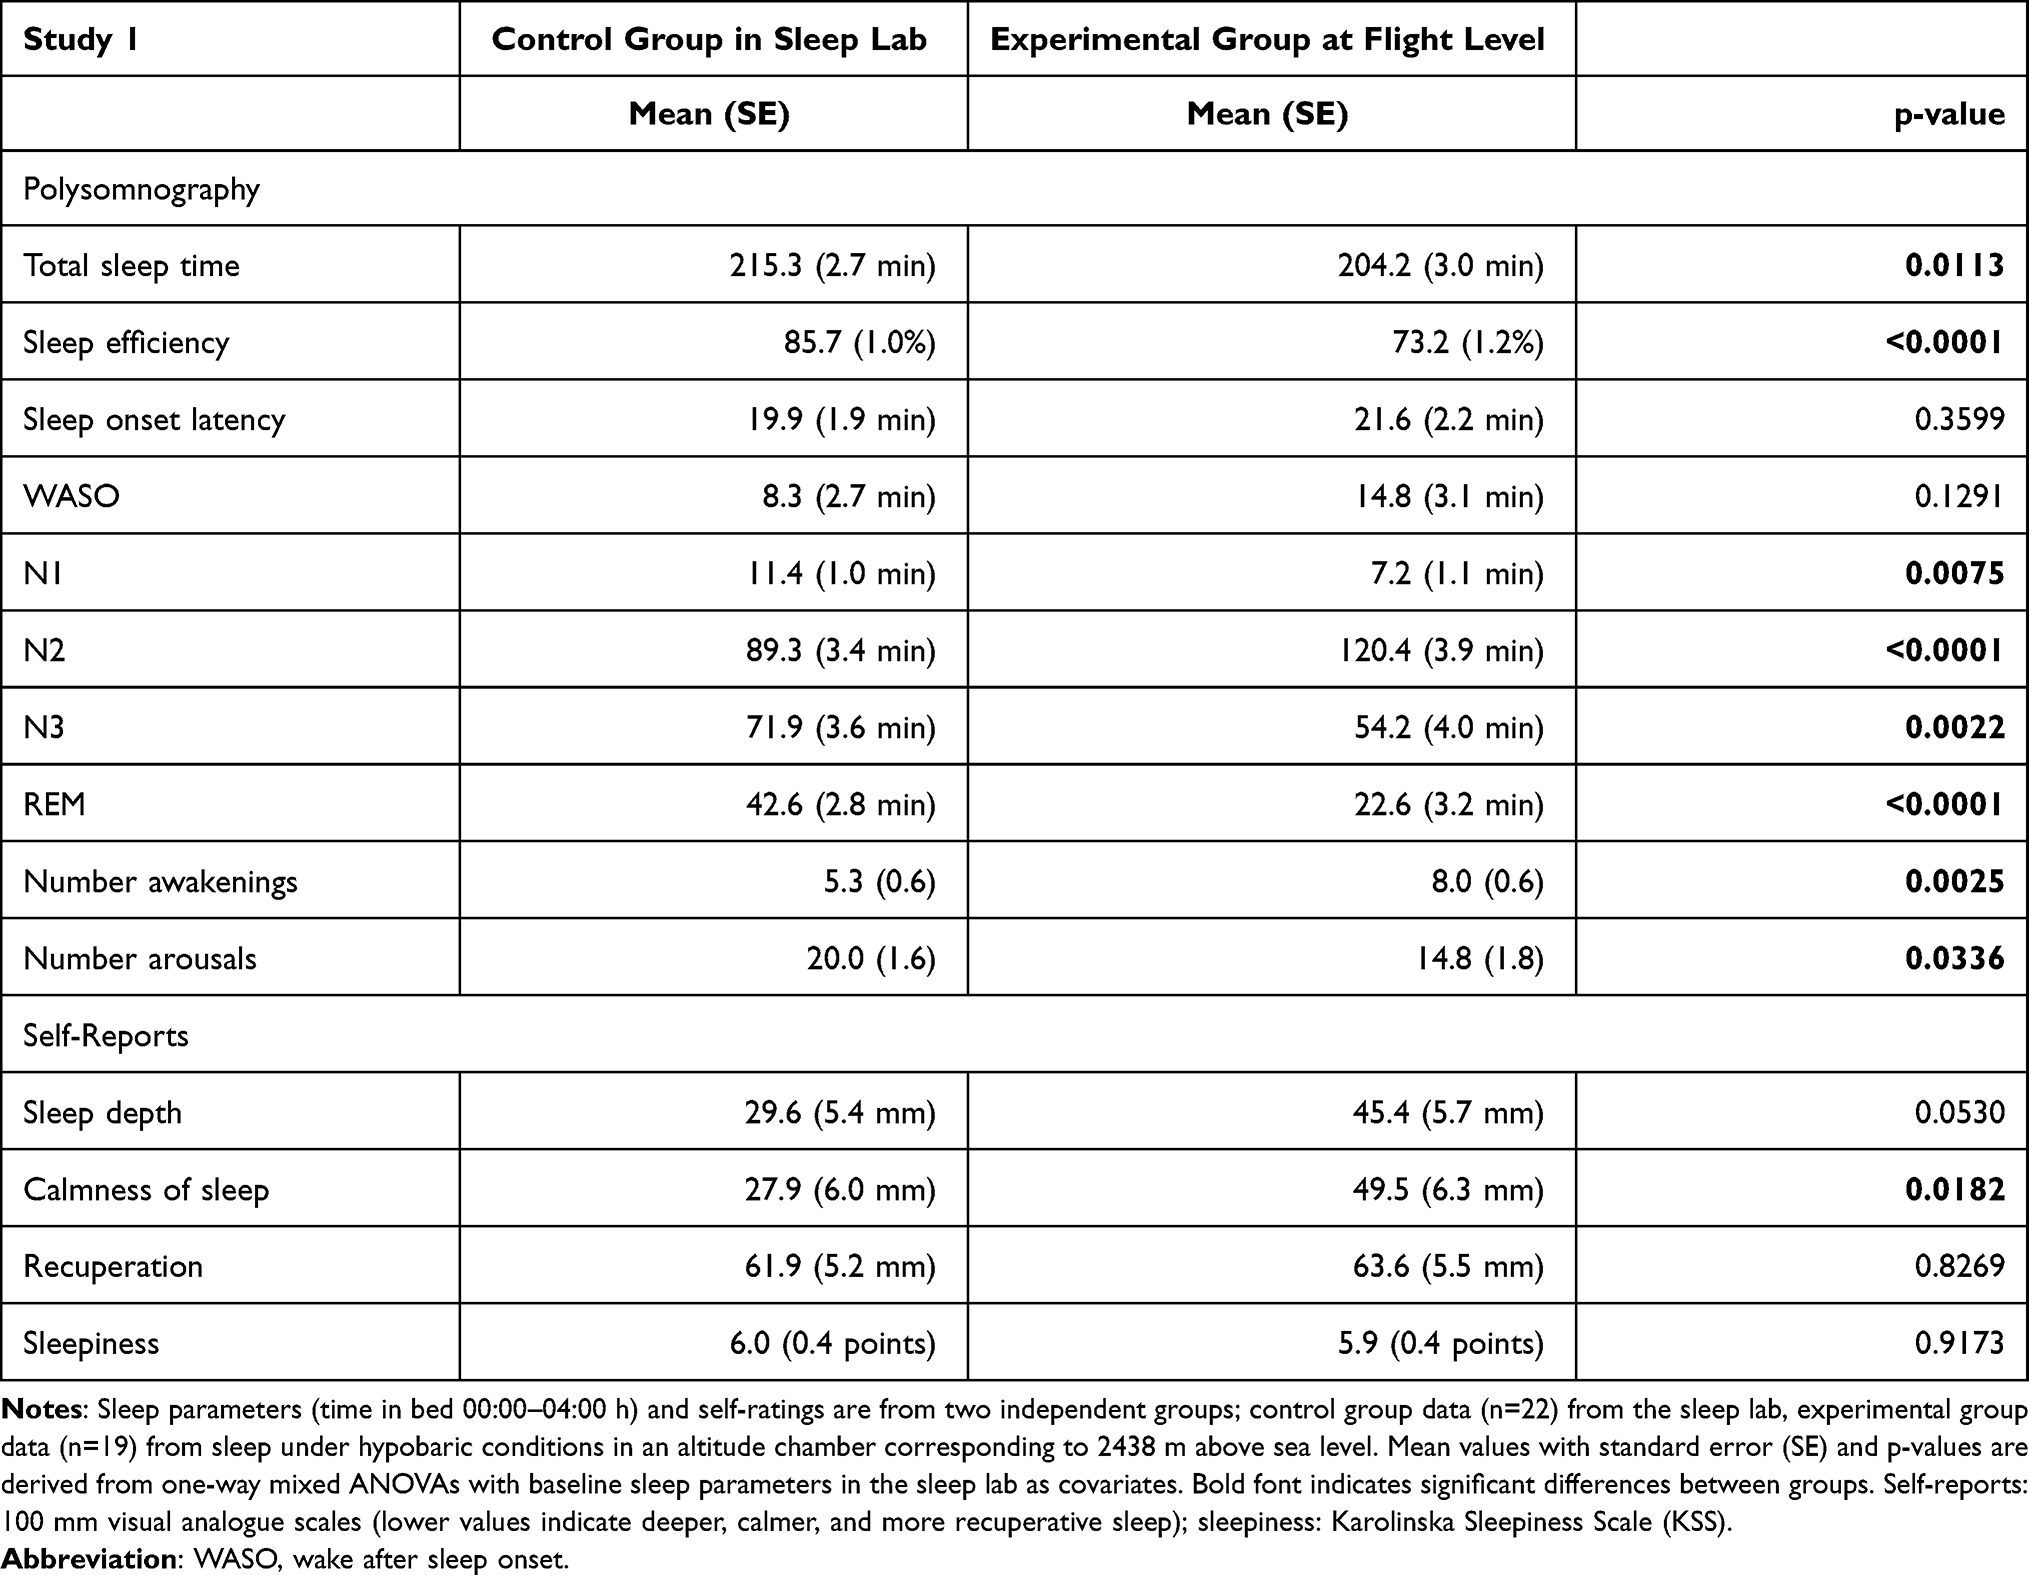 |
Table 1 Impairment of Sleep Quantity and Quality During Simulated Inflight Sleep |
The flight level group showed an increase in EEG power density for frequencies >15 Hz in NREM sleep (Figure 2 upper panel). There were no significant differences in EEG spectra during REM sleep between the two groups (Figure 2 lower panel).
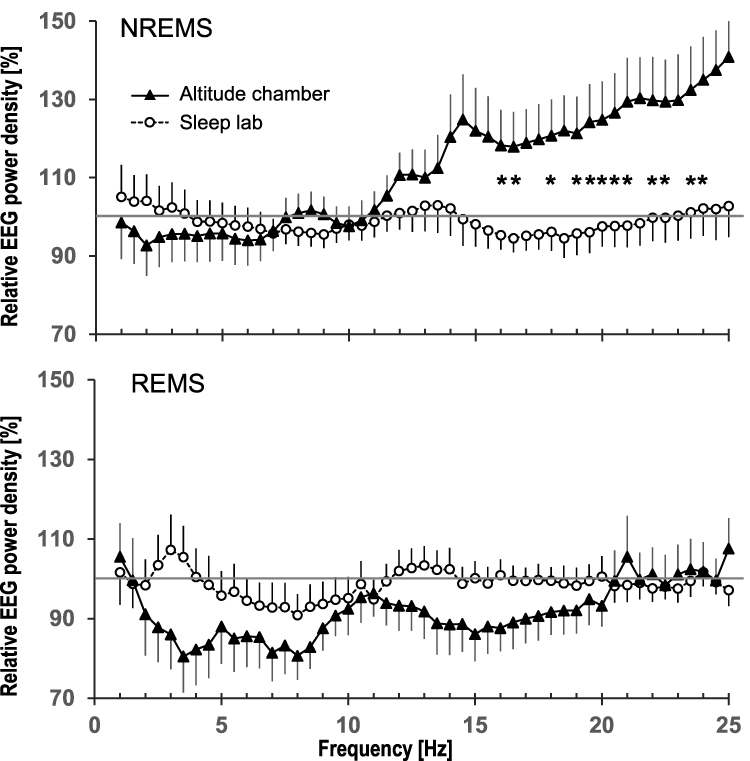 |
Figure 2 Relative sleep EEG power spectra comparing the in-flight group to the control group in the sleep lab (mean and standard error). Data are from two independent groups recorded during 4-h sleep episodes (00:00 am - 04:00 am) in an altitude chamber at simulated flight level (ie, atmospheric pressure corresponding to 2438 m above sea level; n=13; black triangles) and in the sleep lab (53 m; n=16, open circles). Power spectra of each individual were referenced to his/her first 4 h of baseline sleep in the sleep lab (gray line at 100%) and then averaged within groups. Significant differences between groups are derived from one-way mixed ANOVAs with baseline EEG power spectra in the sleep lab as covariates (Benjamini Hochberg adjusted) and are indicated with stars (*). The lowest frequency bin was not included in the analyses due to the vulnerability to low frequency artifacts. Upper panel: EEG power spectra in NREM sleep (N2 + N3). Lower panel: EEG power spectra in REM sleep. |
Participants rated their sleep as less calm and on trend niveau as less deep in the flight level group compared to the control group (Table 1). The recuperative value of sleep was rather low and sleepiness high, but ratings were not different between groups.
Oxygen Saturation and Heart Rate
Study 1: SpO2 was lower (p < 0.0001) and heart rate was higher (p < 0.0003) in the experimental group at flight level (88.1% ± 0.5%, 74.4 bpm ± 1.9 bpm) than in the control group in the sleep lab (96.0% ± 0.1%, 63.7 bpm ± 1.9 bpm) during TST. At flight level, mean SpO2 levels were significantly lower than in the sleep lab in each sleep stage as well as during the SOL, and – except for the latter – fell below the threshold defining hypoxia (ie, 90% SpO2, Figure 3, upper panel). SpO2 was higher during SOL (90.4% ± 0.4%) than during stages N1-3, REM, and also higher than during wakefulness within SPT (all p < 0.0001). Participants in the flight level group spent 74.5% ± 7.5% of TST below 90% SpO2 and 5.3% ± 2.0% of TST below 85% SpO2 compared to 0.7% ± 0.4% of TST below 90% and 0.1% ± 0.1% below 85% of TST in the control group. Figure 3 (lower panel) details the corresponding values for the different sleep stages. Oxygen desaturations were rather stable during the 4-h TIB as indicated by the low mean standard deviation of SpO2 (1.8% ± 0.2%) and the presence of relatively few distinct desaturation events (52.8 ± 11.1 events below 90% SpO2, 25.0 ± 8.8 events below 85% SpO2) in the flight level group. For each participant, the temporal distribution throughout the night during which SpO2 dropped below 90% and below 85% is displayed in Figure S1.
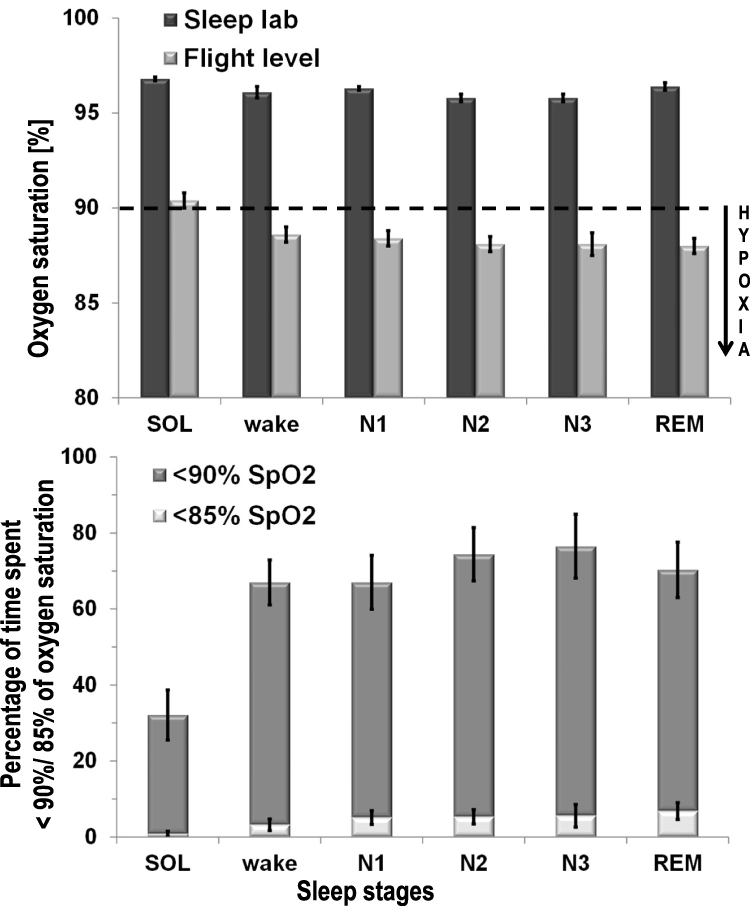 |
Figure 3 Comparison of blood oxygenation between the in-flight group and the control group (sleep lab). Data are from two independent groups recorded during 4-h sleep episodes (00:00 am – 04:00 am) in an altitude chamber at simulated flight level (ie, atmospheric pressure corresponding to 2438 m above sea level; n=18) and in the sleep lab (53 m; n=23). Upper panel: oxygen saturation during different sleep stages (mean and standard error). Lower panel: percentage of time (mean and standard error) that participants spent in a hypoxic state (ie, below 90% of oxygen saturation). |
Study 2: Sleeping at flight level was associated with a reduction in SpO2 below the 90%-hypoxia threshold. This reduced SpO2 was lower than in the ground, the recumbent wakefulness, and the oxygen enrichment condition (Figure 4, upper panel). During recumbent wakefulness mean SpO2 was reduced compared to ground level (p < 0.0001). At flight level, participants spent 69.7% (± 8.3%) of SPT in a state of hypobaric hypoxia, and 6.2% (± 2.7%) even below 85% SpO2. During recumbent wakefulness, they spent only 13.2% (± 3.0%) of time below 90% SpO2 and 0.6% (± 0.3%) of time below 85% SpO2 (Figure 4, lower panel). Oxygen enrichment restored SpO2 to the levels measured at ground level (p = 0.6).
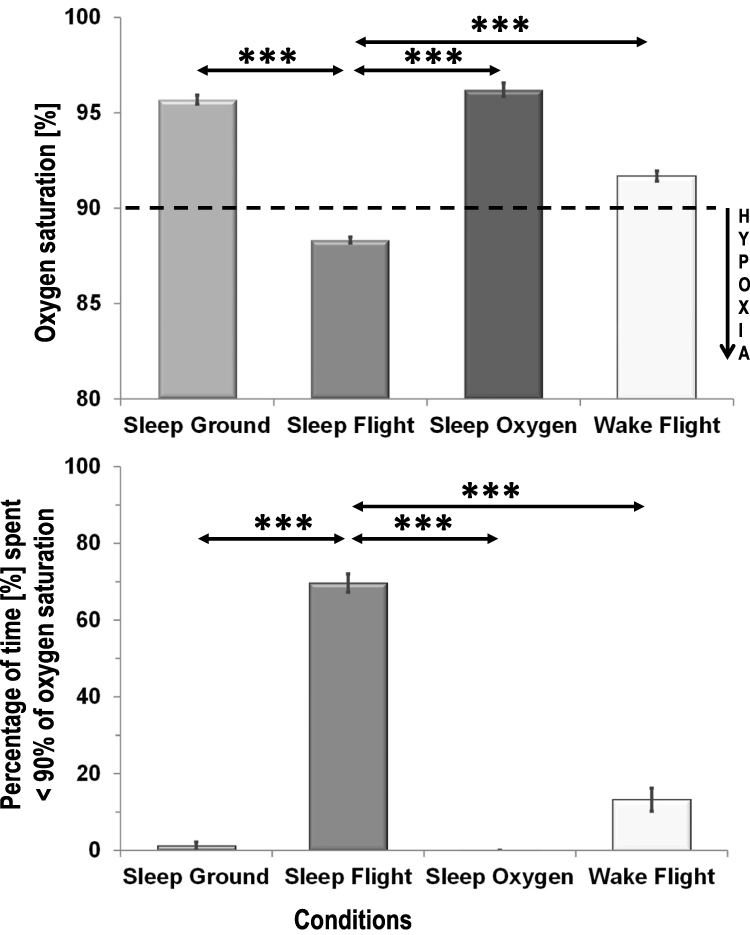 |
Figure 4 Blood oxygenation under the four conditions sleep at ground level, sleep at flight level, sleep under oxygen enrichment at flight level and recumbent wakefulness at flight level. Upper panel: mixed model analysis of oxygen saturation (mean and standard error) comparing the four conditions. Significant differences to flight level are displayed (Tukey-Kramer adjustment for multiple comparisons); *** p< 0.001. For clarity of presentation significant differences between recumbent wakefulness and sleep at ground level (p< 0.0001), and recumbent wakefulness and sleep under oxygen enrichment (p< 0.0001) are not displayed. The hypoxia threshold of 90% oxygen saturation is displayed as broken line. Simulated flight level corresponds to 2438 m above sea level. Lower panel: percentage of time (mean and standard error) that participants spent in a hypoxic state (ie, below 90% of oxygen saturation) during different conditions. *** p<0.001. |
Heart rate was highest during recumbent wakefulness (81.4 bpm ± 3.2 bpm) and therewith higher than at ground level (67.6 bpm ± 2.5 bpm, p < 0.0001) and during oxygen enrichment (67.6 bpm ± 2.7 bpm, p < 0.0001), but not different from the flight level condition during SPT (76.2 bpm ± 2.5 bpm, p = 0.1375). During SPT at flight level, heart rate was elevated in comparison to ground level (p = 0.0048) and to the oxygen enrichment condition (p = 0.0106).
Discussion
During long-haul flights crews’ off-duty times are scheduled to allow for sleep and recovery, aiming at reducing the risk of crew fatigue. However, evidence as to whether or not the on-board conditions permit good-quality sleep is still scarce. In the present studies, sleep, blood oxygenation, and heart rate were compared between simulated in-flight conditions (decreased atmospheric pressure, noise, confined space) and the typical conditions in the private bedroom of a sleep laboratory. A sleep opportunity of four hours during the circadian night was chosen to match inflight sleep opportunities realistically.23,24
Sleep quantity as well as sleep quality were reduced as indicated by a significant decrease in TST, in sleep efficiency, deep sleep (N3) and REM sleep – the latter two considered as most important for recovery25 – and by a significant increase in WASO, and light sleep (N2). Subjectively, sleep was perceived as less calm and less deep. Interestingly, sleepiness in the next morning was high, but not higher than after sleeping in the sleep lab. The high degree of sleep restriction seems to be the main contributing factor to the self-perceived sleepiness. In the present experiment, the sleep structure alterations were accompanied by considerable blood oxygen desaturation and elevation in heart rate which were both prevented by oxygen enrichment of the cabin air to a partial pressure that equalled ground level.
During sleep under flight conditions mean SpO2 was 88% and therewith even below the clinical hypoxia threshold of 90%, whereas it remained in the normal range26 in the ground condition. Under flight conditions participants’ SpO2 stayed for 75% of TST below 90%, and for 5% of TST below 85%. The 90% SpO2 threshold represents a hypoxia definition that is used in many clinical guidelines.27 It has been shown that the mortality risk is increased in emergency admissions when SpO2 ranges between 86% and 89% in comparison to 90% or higher28, and that postoperative patient outcome is negatively affected by desaturations below that threshold.29 The 85% SpO2 is important as it corresponds to the threshold below which supplemental on-board oxygen is required in diseased passengers.30,31 In severity, the desaturation is comparable to that of obstructive sleep apnea (OSA) patients whose SpO2 has been reported to dip below 87% during 10% of the sleep episode (minimum: 66%).26 Thus, pilots’ recurring exposure to sleep under flight conditions might pose a health risk. SpO2 in response to moderate altitudes differs among studies. Outcomes were between 89.6%32 and 93.8%33 at 2000 m, were approximately 90% at 2500 m,34–36 and 84% at 3000 m.13 Slight differences in sample composition (sex, sample size), design (field, lab, physical exercise, acclimatization), and methodology (actigraphy, PSG) might have contributed to the observed variability. In one of these studies15 on the effects of sleeping at moderate heights (1630 m and 2590 m), the median nocturnal SpO2 was 96% at 490 m and dropped to 90% in the first night at 2590 m, while values dipped below 90% during 36% of the time. The authors also reported signs of acclimatization from the first to the second night at 2590 m as indicated by slightly higher SpO2 in the latter. The study was conducted in a crossover design such that half of the participants had two nights at 1630 m before spending two nights at 2590 m. Thus, acclimatization effects might explain the slightly higher SpO2 values in comparison to our study. This comparison suggests that single overnight flights may pose a higher risk for travelers than a stay for a few days in the mountains at the same altitude.
An increase in heart rate, both during sleep and recumbent wakefulness at flight level, indicates that the observed oxygen desaturation posed stress on the cardiovascular system. An increase in heart rate together with an increase in frequency and depth of breath reflect a known response mechanism in the presence of reduced oxygen partial pressure in the atmosphere.
Similar changes in sleep structure have been reported previously for male pilots in-flight, however without information about SpO2 or heart rate.6 While there are numerous studies reporting sleep fragmentation at altitudes above 3000 m,13,37–39 only few investigations have been concerned with lower altitudes. In the latter studies, small or no sleep alterations have been observed.13,15,32,34,37 In the above-mentioned field study on sleep at moderate altitudes (2590 m and 1630 m) a decrease in EEG slow-wave activity in non-REM sleep was found32 as well as a decrease in slow-wave sleep at 2590 m both in comparison to 490 m.26 In our study the decrease in slow-wave sleep duration was accompanied by a slight, but non-significant, decrease in EEG power density for low frequencies. In addition, we found a marked increase at frequencies >15 Hz in NREM but not in REM sleep. This observation seems unlikely to be an EMG artifact given that Brunner and colleagues40 found typical EMG events to affect high EEG frequencies in both NREM and REM sleep. Interestingly, Stadelmann and colleagues16 have reported an association between respiratory events such as central apnea at moderate altitude and an increase of power in high frequencies in N2 sleep of healthy adults. Moreover, a large study recently found that EEG beta power (15–20 Hz) increased with OSA severity.41 These findings together with the present results imply that events such as respiratory disturbances or oxygen desaturations induce a cortically aroused state which is reflected in the higher EEG frequencies.
Our results are at variance with the findings by Muhm and colleagues35 who examined male volunteers sleeping at simulated 2438 m altitude in a crew-rest mock-up and did not observe differences in visually scored sleep structure despite decreases in SpO2. Two factors might mainly account for the different study outcomes: in Muhm and colleagues’ investigations 1) participants were not adapted to the measuring equipment during the ground condition (“first-night effect”), and 2) participants had quite low SpO2 during ground condition (92.3% ± 0.2%), in both cases minimizing a potential difference between flight and ground condition in comparison to the present study. During recumbent wakefulness under flight conditions, in our study, SpO2 was significantly reduced in comparison to ground level values which confirms previous results from healthy adults acutely exposed to moderate altitude (2086 m).42 However, during recumbent wakefulness SpO2 remained above the hypoxia threshold. Thus, we conclude that the presence of sleep is an important exacerbating factor of hypoxemia which in turn may contribute to the in-flight sleep impairment. The latter is in line with studies simulating 2000 m and 4500 m altitude in normobaric chambers showing sleep impairments due to hypoxia.32,33,43 We found prolonged oxygen desaturation events per night without impact on number of arousals, but a small increase in number of awakenings indicating a minor role of respiratory disturbances. In a field study conducted at 4559 m altitude sleep fragmentation was attributed to the degree of hypoxemia rather than the periodic breathing.14 Our study presents PSG evidence in women and men that sleep quality and quantity under flight conditions might be reduced for crew members due to decreases in SpO2. Although the current studies were designed with the typical situation of long-haul air crews in mind, the results are important for passengers as well, in particular for those who are at higher risk due to obesity, OSA, or chronic obstructive pulmonary disease (COPD).44
Oxygen enrichment of the altitude chamber – despite the reduced atmospheric pressure – restored SpO2 and heart rate to levels which were recorded in the sleep laboratory or in the ground condition. Therefore, oxygen enrichment of cabin air seems an effective countermeasure for hypoxia and possibly for sleep impairment and other health risks in crew and passengers. Moreover, it may represent an alternative to efforts by aircraft manufacturers to increase the cabin pressure of airliners.
Limitations
Our investigations were restricted to the simulation of only one flight level in a pressure chamber, representing the maximum cabin altitude allowed by international regulations (8000 feet). In-flight field experiments of different altitudes would be valuable to understand the impact of flight conditions on sleep, SpO2 and recovery to an increased extent.
We provided a 4-h sleep opportunity during participants’ circadian nadir. Even stronger effects on sleep quantity and quality are to be expected when in-flight sleep is scheduled at adverse circadian times (eg, late afternoon).
We investigated only healthy young participants. Stronger effects may be expected in risk groups, eg, patients with OSA or COPD, and older people.
In our study, we intended to recreate an ecologically valid environment for sleep aboard an aircraft including the confinement of space and the inflight noise. These factors, however, might have interacted with hypobaric hypoxia in aggravating fashion such that the single contribution of hypoxia to the observed sleep disturbances remains to be delineated.
Conclusions
We conclude that sleeping under flight-level conditions of 753 hPa pressure induces hypobaric hypoxia which in turn seems to impair sleep. Hypoxia can be reversed with oxygen enrichment of cabin air. Concerning flight safety, recovery time on ground may not be translated one to one into recovery time during flight. Hypobaric hypoxia is of concern in several respects: 1) Long-term health effects for crews are unknown and a concern especially with regard to the cardiovascular system. 2) In cases of emergency, off-duty crew will have to cope with after-effects of sleep inertia in addition to the effects of hypoxia. Ernsting45 stated that even in the wake state the mild degree of hypoxia induced by 2438 m altitude should be avoided because of its impairing effects on learning and on efficient handling of novel and complex conditions which combine with faster buildup of fatigue at cruising altitude. 3) With the rising age of travelers, who may suffer from multiple conditions, medical complications on board are likely to increase. This might especially be of concern for travelers who are obese, have lung diseases or sleep apnea,46 and – paradoxically – it might affect passengers traveling business class more than passengers in economy class given that the former is more conducive to sleep.47
Acknowledgments
We are deeply grateful for the subjects’ dedication to participate in the study and for the help of our colleagues at the German Aerospace Center for the data collection. This work was part of the DLR projects FIT (supported by the DLR Aeronautics Program) and STELLA (supported by the German Ministry for Economic Affairs and Energy (BMWi): 20Y0907B).
Disclosure
The authors report no conflicts of interest in this work.
References
1. Vejvoda M, Elmenhorst EM, Pennig S, et al. Significance of time awake for predicting pilots’ fatigue on short-haul flights: implications for flight duty time regulations. J Sleep Res. 2014;23(5):564–567. doi:10.1111/jsr.12186
2. Sallinen M, Van Dijk H, Aeschbach D, Maij A, Akerstedt T. A large-scale European Union study of aircrew fatigue during long night and disruptive duties. Aerosp Med Hum Perform. 2020;91(8):628–635. doi:10.3357/AMHP.5561.2020
3. Windsor JS, Rodway GW. Sleep disturbance at altitude. Curr Opin Pulm Med. 2012;18(6):554–560. doi:10.1097/MCP.0b013e328359129f
4. Ainslie PN, Lucas SJ, Burgess KR. Breathing and sleep at high altitude. Respir Physiol Neurobiol. 2013;188(3):233–256. doi:10.1016/j.resp.2013.05.020
5. Signal TL, Gale J, Gander PH. Sleep measurement in flight crew: comparing actigraphic and subjective estimates to polysomnography. Aviat Space Environ Med. 2005;76(11):1058–1063.
6. Signal TL, Gander PH, van den Berg MJ, Graeber RC. In-flight sleep of flight crew during a 7-hour rest break: implications for research and flight safety. Sleep. 2013;36(1):109–115. doi:10.5665/sleep.2312
7. Aerospace Medical A, Aviation Safety C, Civil Aviation S. Cabin cruising altitudes for regular transport aircraft. Aviat Space Environ Med. 2008;79(4):433–439. doi:10.3357/ASEM.2272.2008
8. Cottrell JJ. Altitude exposures during aircraft flight. Flying higher. Chest. 1988;93(1):81–84. doi:10.1378/chest.93.1.81
9. Petrassi FA, Hodkinson PD, Walters PL, Gaydos SJ. Hypoxic hypoxia at moderate altitudes: review of the state of the science. Aviat Space Environ Med. 2012;83(10):975–984. doi:10.3357/ASEM.3315.2012
10. Rainford D, Gradwell DP, Ernsting J. Ernsting’s Aviation Medicine.
11. Brundrett G. Sickness at high altitude: a literature review. J R Soc Promot Health. 2002;122(1):14–20. doi:10.1177/146642400212200109
12. Bloch KE, Buenzli JC, Latshang TD, Ulrich S. Sleep at high altitude: guesses and facts. J Appl Physiol. 2015;119(12):1466–1480. doi:10.1152/japplphysiol.00448.2015
13. Mizuno K, Asano K, Okudaira N. Sleep and respiration under acute hypobaric hypoxia. Jpn J Physiol. 1993;43(2):161–175. doi:10.2170/jjphysiol.43.161
14. Nussbaumer-Ochsner Y, Ursprung J, Siebenmann C, Maggiorini M, Bloch KE. Effect of short-term acclimatization to high altitude on sleep and nocturnal breathing. Sleep. 2012;35(3):419–423. doi:10.5665/sleep.1708
15. Latshang TD, Lo Cascio CM, Stowhas AC, et al. Are nocturnal breathing, sleep, and cognitive performance impaired at moderate altitude (1630–2590 m)? Sleep. 2013;36(12):1969–1976. doi:10.5665/sleep.3242
16. Stadelmann K, Latshang TD, Tarokh L, et al. Sleep respiratory disturbances and arousals at moderate altitude have overlapping electroencephalogram spectral signatures. J Sleep Res. 2014;23(4):463–468. doi:10.1111/jsr.12131
17. Muhm JM, Rock PB, McMullin DL, et al. Effect of aircraft-cabin altitude on passenger discomfort. N Engl J Med. 2007;357(1):18–27. doi:10.1056/NEJMoa062770
18. Hinninghofen H, Enck P. Passenger well-being in airplanes. Auton Neurosci. 2006;129(1–2):80–85. doi:10.1016/j.autneu.2006.07.018
19. Elmenhorst EM, Elmenhorst D, Benderoth S, Kroll T, Bauer A, Aeschbach D. Cognitive impairments by alcohol and sleep deprivation indicate trait characteristics and a potential role for adenosine A1 receptors. Proc Natl Acad Sci U S A. 2018;115(31):8009–8014. doi:10.1073/pnas.1803770115
20. Benderoth S, Hormann HJ, Schiessl C, Elmenhorst EM. Reliability and Validity of a 3-minute Psychomotor Vigilance Task (PVT) in assessing sensitivity to sleep loss and alcohol: fitness for duty in aviation and transportation. Sleep. 2021;44(11). doi:10.1093/sleep/zsab151
21. Iber C; American Academy of Sleep Medicine. The AASM Manual for the Scoring of Sleep and Associated Events: Rules, Terminology, and Technical Specifications. Westchester, IL: American Academy of Sleep Medicine; 2007.
22. Akerstedt T, Gillberg M. Subjective and objective sleepiness in the active individual. Int J Neurosci. 1990;52(1–2):29–37. doi:10.3109/00207459008994241
23. Gander PH, Signal TL, van den Berg MJ, Mulrine HM, Jay SM, Jim Mangie C. In-flight sleep, pilot fatigue and psychomotor vigilance task performance on ultra-long range versus long range flights. J Sleep Res. 2013;22(6):697–706. doi:10.1111/jsr.12071
24. van den Berg MJ, Signal TL, Mulrine HM, Smith AA, Gander PH, Serfontein W. Monitoring and managing cabin crew sleep and fatigue during an ultra-long range trip. Aerosp Med Hum Perform. 2015;86(8):705–713. doi:10.3357/AMHP.4268.2015
25. Brown RE, Basheer R, McKenna JT, Strecker RE, McCarley RW. Control of sleep and wakefulness. Physiol Rev. 2012;92(3):1087–1187. doi:10.1152/physrev.00032.2011
26. Gries RE, Brooks LJ. Normal oxyhemoglobin saturation during sleep. How low does it go? Chest. 1996;110(6):1489–1492. doi:10.1378/chest.110.6.1489
27. O’Driscoll BR, Howard LS, Earis J, Mak V; British Thoracic Society Emergency Oxygen Guideline G, Group BTSEOGD. BTS guideline for oxygen use in adults in healthcare and emergency settings. Thorax. 2017;72(Suppl1):ii1–ii90. doi:10.1136/thoraxjnl-2016-209729
28. Goodacre S, Turner J, Nicholl J. Prediction of mortality among emergency medical admissions. Emerg Med J. 2006;23(5):372–375. doi:10.1136/emj.2005.028522
29. Rostin P, Teja BJ, Friedrich S, et al. The association of early postoperative desaturation in the operating theatre with hospital discharge to a skilled nursing or long-term care facility. Anaesthesia. 2019;74(4):457–467. doi:10.1111/anae.14517
30. Ali M, Smith IE, Gulati A, Shneerson JM. Hypoxic challenge assessment in individuals with obstructive sleep apnea. Sleep Med. 2011;12(2):158–162. doi:10.1016/j.sleep.2010.06.009
31. British Thoracic Society Standards of Care C. Managing passengers with respiratory disease planning air travel: British Thoracic Society recommendations. Thorax. 2002;57(4):289–304. doi:10.1136/thorax.57.4.289
32. Hoshikawa M, Uchida S, Sugo T, Kumai Y, Hanai Y, Kawahara T. Changes in sleep quality of athletes under normobaric hypoxia equivalent to 2000-m altitude: a polysomnographic study. J Appl Physiol. 2007;103(6):2005–2011. doi:10.1152/japplphysiol.00315.2007
33. Hoshikawa M, Uchida S, Osawa T, et al. Effects of five nights under normobaric hypoxia on sleep quality. Med Sci Sports Exerc. 2015;47(7):1512–1518. doi:10.1249/MSS.0000000000000569
34. Stadelmann K, Latshang TD, Lo Cascio CM, et al. Quantitative changes in the sleep EEG at moderate altitude (1630 m and 2590 m). PLoS One. 2013;8(10):e76945. doi:10.1371/journal.pone.0076945
35. Muhm JM, Signal TL, Rock PB, et al. Sleep at simulated 2438 m: effects on oxygenation, sleep quality, and postsleep performance. Aviat Space Environ Med. 2009;80(8):691–697. doi:10.3357/ASEM.2327.2009
36. Staab JE, Muza SR, Fulco CS, Andrew SP, Beidleman BA. Impact of 2 days of staging at 2500–4300 m on sleep quality and quantity following subsequent exposure to 4300 m. Physiol Rep. 2021;9(21):e15063. doi:10.14814/phy2.15063
37. Johnson PL, Edwards N, Burgess KR, Sullivan CE. Sleep architecture changes during a trek from 1400 to 5000 m in the Nepal Himalaya. J Sleep Res. 2010;19(1 Pt 2):148–156. doi:10.1111/j.1365-2869.2009.00745.x
38. Beaumont M, Goldenberg F, Lejeune D, Marotte H, Harf A, Lofaso F. Effect of zolpidem on sleep and ventilatory patterns at simulated altitude of 4000 meters. Am J Respir Crit Care Med. 1996;153(6 Pt 1):1864–1869. doi:10.1164/ajrccm.153.6.8665047
39. Beaumont M, Batejat D, Pierard C, et al. Zaleplon and zolpidem objectively alleviate sleep disturbances in mountaineers at a 3613 meter altitude. Sleep. 2007;30(11):1527–1533. doi:10.1093/sleep/30.11.1527
40. Brunner DP, Vasko RC, Detka CS, Monahan JP, Reynolds CF
41. Kang JM, Cho SE, Na KS, Kang SG. Spectral power analysis of sleep electroencephalography in subjects with different severities of obstructive sleep apnea and healthy controls. Nat Sci Sleep. 2021;13:477–486. doi:10.2147/NSS.S295742
42. Wiseman RL, Kelly PT, Swanney MP, McNamara KP, Beckert L. Hypoxemia in healthy subjects at moderate altitude. Aviat Space Environ Med. 2013;84(1):22–26. doi:10.3357/ASEM.3366.2013
43. de Aquino Lemos V, Antunes HK, Dos Santos RV, Lira FS, Tufik S, de Mello MT. High altitude exposure impairs sleep patterns, mood, and cognitive functions. Psychophysiology. 2012;49(9):1298–1306. doi:10.1111/j.1469-8986.2012.01411.x
44. Rooney D, Herkenrath S, Priegnitz C, et al. Choosing an adequate test to determine fitness for air travel in obese individuals. Chest. 2019;156(5):926–932. doi:10.1016/j.chest.2019.07.022
45. Ernsting J. Prevention of hypoxia–acceptable compromises. Aviat Space Environ Med. 1978;49(3):495–502.
46. Nussbaumer-Ochsner Y, Schuepfer N, Ulrich S, Bloch KE. Exacerbation of sleep apnoea by frequent central events in patients with the obstructive sleep apnoea syndrome at altitude: a randomised trial. Thorax. 2010;65(5):429–435. doi:10.1136/thx.2009.125849
47. Aeschbach D, Cajochen C, Tobler I, Dijk DJ, Borbely AA. Sleep in a sitting position: effect of triazolam on sleep stages and EEG power spectra. Psychopharmacology. 1994;114(2):209–214. doi:10.1007/BF02244838
 © 2022 The Author(s). This work is published and licensed by Dove Medical Press Limited. The
full terms of this license are available at https://www.dovepress.com/terms
and incorporate the Creative Commons Attribution
- Non Commercial (unported, 3.0) License.
By accessing the work you hereby accept the Terms. Non-commercial uses of the work are permitted
without any further permission from Dove Medical Press Limited, provided the work is properly
attributed. For permission for commercial use of this work, please see paragraphs 4.2 and 5 of our Terms.
© 2022 The Author(s). This work is published and licensed by Dove Medical Press Limited. The
full terms of this license are available at https://www.dovepress.com/terms
and incorporate the Creative Commons Attribution
- Non Commercial (unported, 3.0) License.
By accessing the work you hereby accept the Terms. Non-commercial uses of the work are permitted
without any further permission from Dove Medical Press Limited, provided the work is properly
attributed. For permission for commercial use of this work, please see paragraphs 4.2 and 5 of our Terms.