Back to Journals » Nature and Science of Sleep » Volume 15
Sleep Architecture and Sleep EEG Alterations are Associated with Impaired Cognition Under Sleep Restriction
Authors Mao T, Chai Y, Guo B, Quan P ![]() , Rao H
, Rao H
Received 17 May 2023
Accepted for publication 6 October 2023
Published 12 October 2023 Volume 2023:15 Pages 823—838
DOI https://doi.org/10.2147/NSS.S420650
Checked for plagiarism Yes
Review by Single anonymous peer review
Peer reviewer comments 3
Editor who approved publication: Dr Sarah L Appleton
Tianxin Mao,1,2 Ya Chai,3 Bowen Guo,1 Peng Quan,3,4 Hengyi Rao1,3,5
1Center for Magnetic Resonance Imaging Research & Key Laboratory of Brain-Machine Intelligence for Information Behavior (Ministry of Education and Shanghai), School of Business and Management, Shanghai International Studies University, Shanghai, People’s Republic of China; 2School of Psychology, South China Normal University, Guangzhou, People’s Republic of China; 3Center for Functional Neuroimaging, Department of Neurology, University of Pennsylvania, Philadelphia, PA, USA; 4Research Center for Quality of Life and Applied Psychology, Guangdong Medical University, Dongguan, People’s Republic of China; 5Division of Sleep and Chronobiology, Department of Psychiatry, University of Pennsylvania, Philadelphia, PA, USA
Correspondence: Hengyi Rao, Center for Functional Neuroimaging & Department of Neurology, University of Pennsylvania Perelman School of Medicine, Room D502, Richards Medical Research Building, 3700 Hamilton Walk, Philadelphia, PA, 19104-4202, USA, Email [email protected]
Purpose: Many studies have investigated the cognitive, emotional, and other impairments caused by sleep restriction. However, few studies have explored the relationship between cognitive performance and changes in sleep structure and electroencephalography (EEG) during sleep. The present study aimed to examine whether changes in sleep structure and EEG can account for cognitive impairment caused by sleep restriction.
Patients and Methods: Sixteen young adults spent five consecutive nights (adaptation 9h, baseline 8h, 1st restriction 6h, 2nd restriction 6h, and recovery 10h) in a sleep laboratory, with polysomnography recordings taken during sleep. Throughout waking periods in each condition, participants completed the psychomotor vigilance test (PVT), which measures vigilant attention, and the Go/No-Go task, which measures inhibition control.
Results: The results showed that sleep restriction significantly decreased the proportion of N1 and N2 sleep, increased the proportion of N3 sleep, and reduced the time spent awake after sleep onset (WASO) and sleep onset latency. Poorer performance on the PVT and Go/No Go task was associated with longer WASO, a larger proportion of N3 sleep, and a smaller proportion of N2 sleep. Additionally, the power spectral density of delta waves significantly increased after sleep restriction, and this increase predicted a decrease in vigilance and inhibition control the next day.
Conclusion: These findings suggest that sleep architecture and EEG signatures may partially explain cognitive impairment caused by sleep restriction.
Keywords: sleep restriction, sleep architecture, sleep EEG, vigilance, inhibition control
Introduction
Previous studies have demonstrated the adverse effects of partial sleep deprivation, also known as sleep restriction (SR), on cognitive performance.1–3 However, few studies have explored the effects of SR on neural activity during sleep. Earlier studies have found a reduction in N1, N2, and REM sleep, but no significant effect on slow-wave sleep (SWS) on nights of sleep deprivation.4–6 In recent years, similar results have been found in multiple SR studies.7–12 Overall, the majority of SR studies have shown decreased N1 and N2 sleep, reduced proportion of REM sleep, increased proportion of SWS, decreased sleep onset latency (SOL), and increased electroencephalogram (EEG) spectrum power in the low-frequency range.13 However, one study showed a decrease in all sleep stages and SOL after SR.14 The discrepancies may be due to different durations of SR, restrictions of different sleep periods, or different levels of experimental control. A survey in the elderly found that the lower the proportion of REM sleep and the higher the proportion of N1 sleep, the worse the executive function and attention performance.15 To date, few studies have examined the relationship between sleep architecture and cognitive behavior in adults.
In addition to changes in sleep architecture, partial sleep deprivation (SR) can also alter sleep EEG. For instance, participants who were deprived of 4, 6, or 8 hours of sleep for 14 consecutive nights showed significant differences in their δ wave power on the first SR night among the three conditions. However, these differences did not reach statistical significance on the 14th SR night.11 A study on the relationship between slow wave sleep and cognitive tasks in insomniac patients found that lower levels of slow wave were associated with poorer task performance, but this relationship was not observed in the healthy population.16 Moreover, higher spindle amplitude has been linked to better fluid intelligence in adolescents,17 and reduced spindle activity after SR may be associated with reduced cognitive functioning such as executive function, working memory, and processing speed.18 However, it is still unclear whether changes in sleep EEG bands after SR are related to changes in behavior.
Importantly, few studies have explored the mechanism behind the cognitive deficits induced by SR from the perspective of sleep architecture and sleep EEG. Therefore, this study aims to investigate changes in sleep architecture and sleep EEG under SR and to explore the effects of these changes on cognitive functions such as vigilant attention (basic cognitive function) and inhibitory control (higher cognitive function) using a rigorous experimental design.
Materials and Methods
Experimental Design
This study employed a single-factor within-subject experimental design. Participants spent five consecutive nights in the laboratory, where the first night was an adaptation night to provide a sleep opportunity of 9 hours to familiarize themselves with the sleeping environment and eliminate sleep debt. The second night was considered as a baseline night with a sleep opportunity of 8 hours. The third and fourth nights were considered as two SR nights (6 hours in bed). The fifth night was considered as a recovery night. Data from the first night were only used to screen for sleep disorders, and only data from the second to fourth nights were included in the analysis. Some other data from the study have been published in earlier articles.19 The participants arrived at the laboratory three hours before bedtime every night for PSG setup and to complete cognitive tasks and questionnaires, including PVT, Go/No Go task, and KSS. They were permitted to leave the laboratory for a few hours each day to avoid monotony,13 but the use of mobile phones, pads, and other electronic devices was not allowed during the experiment. In the afternoons, they were required to return to the laboratory to complete the same tasks and questionnaires.
Participants
A total of 16 subjects (9 males, mean age 19.81 ± 1.22 years) were included in the experiment. The inclusion criteria were healthy individuals with no history of illness or psychological problems, affective disorder, irregular sleep schedule, substance addiction, recent travel, shift work, napping habit, sleep duration less than 7h or more than 9h, poor vision, and BMI between 19 and 25. Screening questionnaires included the Morning and Evening Questionnaire,20,21 Pittsburgh Sleep Quality Index,22–24 Self-rating Anxiety Scale,25,26 General Health Questionnaire,27,28 and Beck Depression Inventory.29 Telephone and in-person interviews were conducted for further screening. Additionally, one week before the formal experiment, actigraphy and a sleep diary were used to ensure a regular sleep-wake rhythm. The data from actigraphy and sleep logs showed that subjects had a bedtime of 11:41 pm ± 17 min, a waking time of 7:38 am ± 24 min, an average sleep duration of 7.95 ± 0.54 h, and an average sleep quality score of 3.51 ± 0.72 (1 = very poor, 5 = very good). These results confirmed that all subjects had regular sleep habits before the experiment and that both sleep duration and sleep quality were at reasonable levels. In the formal experiment, the average sleep time of baseline night, 1st SR night and 2nd SR night was respectively: 11:40 pm ± 20 min, 11:42 pm ± 18 min, and 11:42 pm ± 13 min, which was basically consistent with the usual sleep time. More detailed demographic information of the participants can be found in our previous study.19 The study was approved by the ethics committee of the School of Psychology at South China Normal University, and all subjects provided informed consent and were compensated after completing the experiment.
Polysomnography
The sleep condition of participants was monitored for five consecutive nights using the Australian Compumedics Greal Series sleep monitoring system. The scalp EEG sites (F3, F4, O1, O2, C3, and C4) were paired with contralateral mastoid reference electrodes (M1, M2) following the 10–20 system.30 The left and right EOG sites (E1 and E2) were referenced to M1 and M2. Additionally, signals such as chin EMG, leg EMG, EKG, nasal/oral airflow, chest and abdominal respiratory effort, and oxygen saturation were recorded. Electrode impedance was maintained at ≤5 KΩ for EEG and ≤10 KΩ for EMG and EKG. A low-pass filter of 35 Hz and a high-pass filter of 0.3 Hz were applied to all signals, and EEG was sampled at a rate of 200 Hz.
Measures
Sleep Architecture
Sleep stages were scored manually in 30-second epochs using RemLogic software, in accordance with the guidelines of the American Academy of Sleep Medicine (AASM) Manual. The study analyzed various sleep parameters, including total time in bed (TIB), total sleep time (TST), sleep efficiency (SE), and the amount of time spent in each sleep stage (NREM stages 1, 2, and 3, and REM sleep). The results also measured the percentage of time spent in each sleep stage (N1 ratio, N2 ratio, N3 ratio, and REM ratio) as a proportion of TST. Furthermore, the study examined SOL, REM latency, and WASO.
Sleep EEG
EEG spectral analysis was performed using Brain Vision Analyzer 2.0 software. Prior to formal analysis, PSG signals are pre-processed, including normalization, calibration, detrending, and equalization.31,32 Then, the Delta wave (0.5–4.5Hz), Theta wave (4.5–8.5Hz), Alpha wave (8.5–12.5Hz), Sigma wave (12.5–15.5Hz), and Beta wave (15.5–30.5Hz) of all-night sleep EEG were mathematically transformed into a frequency spectrum using the Fast Fourier Transform (FFT) algorithm.33 The analysis was conducted primarily using C3/M2, unless data from C4/M1 was assessed as having fewer artifacts.13 For each epoch, power spectral density estimates were computed using Welch’s modified periodogram method (Hamming window; 0.2-Hz bin resolution).34
Psychomotor Vigilance Test (PVT)
PVT is a widely used and highly sensitive test for assessing vigilant attention in sleep deprivation studies.35,36 During the test, participants are required to respond to a black triangle stimulus on a computer screen by pressing a button immediately after seeing it. The stimulus is presented for 1 second, and the stimulus interval ranges from 2 to 10 seconds. We used median and average reaction times (RT) and number of lapses as indicators of vigilant attention. Subjective alertness was also measured using the Karolinska Sleepiness Scale (KSS), which uses a 9-point Likert scale ranging from 1 (extremely alert) to 9 (extremely sleepy).37
Go/No-Go Task
It is a common paradigm used to measure inhibitory control levels. Participants were presented with a fixation “+” followed by a circle or square stimulus for 500 ms. They were instructed to press the “G” key upon seeing the circle and to refrain from responding upon seeing the square. The task included 120 trials, with 75% Go and 25% No-Go trials. We utilized commission and omission errors and Go trials RT as dependent variables in our analysis.
Data Analysis
We used the PSG analysis software to analyze the data for the entire night across different sleep conditions to obtain the parameters of sleep architecture and sleep EEG. Then, we sorted out all the data using Excel and performed descriptive analysis, paired-samples t-tests, repeated measures analysis of variance (ANOVA), correlation analysis, and regression analysis using SPSS 22.0 and JASP software.
Results
Differences of Sleep Architecture Among Baseline and SR Nights
We analyzed the sleep data using AASM guidelines and obtained sleep architecture parameters. Table 1 presents descriptive statistics for each parameter. Repeated-measures ANOVA was used to analyze the effects of sleep conditions (baseline, 1st SR, 2nd SR) on WASO, SOL, REM latency, and SE. The results showed that WASO was significantly lower during the 1st SR (t(15) = 2.432, p = 0.028, Cohen’s d = 0.608) and 2nd SR (t(15) = 3.026, p = 0.009, Cohen’s d = 0.757) compared to the baseline night. However, there were no significant differences between the two SR nights (p > 0.05). The main effect of sleep on SOL was not significant (p > 0.05), but there was a trend toward significance between the baseline and 2nd SR (p = 0.053). The statistics of REM latency and SE did not differ among sleep conditions (all p > 0.05). See Figure 1 for more detailed results.
 |
Table 1 Characteristics of Sleep Architecture During Different Sleep Nights (N = 16) |
 |
Figure 1 Differences of sleep architecture among baseline and SR nights. Abbreviations: WASO, awake after sleep onset; SE, sleep efficiency; SOL, sleep onset latency; REM latency, REM sleep onset latency; N1/N2/N3/REM sleep, the amount of time spent in NREM stage 1/stage 2/stage 3/stage REM; N1/N2/N3/REM ratio, the percentage of time spent in stage 1/stage 2/stage 3/stage REM. Notes: ***p < 0.001; **p < 0.01; *p < 0.05. |
We conducted repeated measures ANOVA to analyze N1, N2, N3, and REM sleep stages under different sleep conditions. Significant differences were found for N1 (F(2, 30) = 10.943, p < 0.001, η2p = 0.422), N2 (F(2, 30) = 65.915, p < 0.001, η2p = 0.815), N3 (F(2, 30) = 4.929, p = 0.014, η2p = 0.247), and REM sleep (F(2, 30) = 26.999, p < 0.001, η2p = 0.643). Post-hoc paired t-tests revealed that N1 sleep was significantly longer during the baseline night than the 1st SR and 2nd nights [t(15) = 2.333, p < 0.05, Cohen’s d = 0.583; t(15) = 4.365, p < 0.001, Cohen’s d = 1.091], with longer N1 sleep during the 1st SR night than the 2nd SR night (t(15) = 2.798, p = 0.014, Cohen’s d = 0.700). N2 sleep was significantly longer during the baseline night than the 1st SR and 2nd nights [t(15) = 9.098, p < 0.001, Cohen’s d = 2.275; t (15) = 8.351, p < 0.001, Cohen’s d = 2.088]. N3 sleep was significantly longer on the 2nd SR night than on the baseline (t(15) = −2.536, p = 0.023, Cohen’s d = −0.634) or 1st SR night (t(15) = −2.955, p = 0.010, Cohen’s d = −0.739). REM sleep was significantly shorter on both 1st SR night (t(15) = 6.198, p < 0.000, Cohen’s d = 1.549) and 2nd SR night (t(15) = 5.251, p < 0.001, Cohen’s d = 1.313) compared to the baseline night. Results are displayed in Figure 1.
Repeated measures ANOVA was also performed for N1 ratio, N2 ratio, N3 ratio, and REM ratio under different sleep conditions. The results showed that the proportion of N1 stage sleep was significantly different across different sleep conditions (F(2, 30) = 6.799, p = 0.004, η2p = 0.312), with a significantly lower N1 ratio on the 2nd SR night than on the baseline night (t(15) = 3.802, p = 0.002, Cohen’s d = 0.951) and 1st SR night (t(15) = 2.826, p = 0.013, Cohen’s d = 0.707). The N2 ratio showed a main effect of sleep (F (2, 30) = 5.686, p = 0.008, η2p = 0.275), with a significantly higher N2 ratio on the baseline night than the 2nd SR night (t(15) = 2.747, p = 0.015, Cohen’s d = 0.687) and a trend level higher N2 ratio on the baseline night than the 1st SR night (t(15) = 2.128, p = 0.050, Cohen’s d = 0.532). Additionally, there was a significant difference in the N3 ratio among sleep conditions (F (2, 30) = 38.169, p < 0.001, η2p = 0.721), with lower N3 ratio on the baseline night compared with the 1st SR night (t(15) = −5.612, p < 0.001, Cohen’s d = −1.403) and the 2nd SR night (t(15) = −9.236, p < 0.001, Cohen’s d = −2.309). The N3 ratio was significantly lower on the 1st SR night than that on the 2nd SR night (t(15) = −2.934, p = 0.010, Cohen’s d = −0.734). However, no significant differences in the REM ratio were found (p > 0.05), with a marginally significant decrease on the 1st SR night compared with that on the baseline night (t(15) = 1.761, p = 0.099, Cohen’s d = 0.440). See results in Figure 1.
Relationship Between Changes in Sleep Architecture During SR Nights and Cognition After SR Nights
To investigate the mechanism behind the impact of SR on vigilant attention and inhibitory control, we compared differences in sleep architecture and cognitive performance between one or two nights of SR and baseline levels. We then estimated correlations between changes in sleep architecture and cognitive performance and performed regression analysis on variables with significant correlations.
After one night of SR, there was a significant negative correlation between changes in TST and SE and changes in PVT lapse. Regression analysis showed that variations in TST and SE could explain 29.4% and 27.0% of the variance of PVT lapse, respectively [R2 = 0.294, F(1, 14) = 5.822, β=−0.542, p = 0.030; R2 = 0.270, F (1, 14) = 5.172, β= −0.519, p = 0.039]. However, there was a significant positive correlation between changes in WASO and PVT lapse. Regression analysis showed that the variance of WASO could account for 32.7% of the variance of lapse (R2 = 0.327, F(1, 14) = 6.814, β= 0.572, p = 0.021). Meanwhile, there was a significant negative correlation between changes in N2 ratio and omission errors of the Go/No-Go, and the variance of N2 ratio could explain 26.3% of the variance of omission errors (R2 = 0.263, F(1, 14) = 5.005, β= −0.513, p = 0.042). We also found a marginally significant negative correlation between changes in TST and median RT of the PVT (p = 0.099), positive correlation between changes in WASO and median RT of the PVT, and Go RT of the Go/No-Go (p = 0.059, p = 0.056), and negative correlation between changes in WASO and KSS value (p = 0.069). Results are shown in Table 2 and Figure 2.
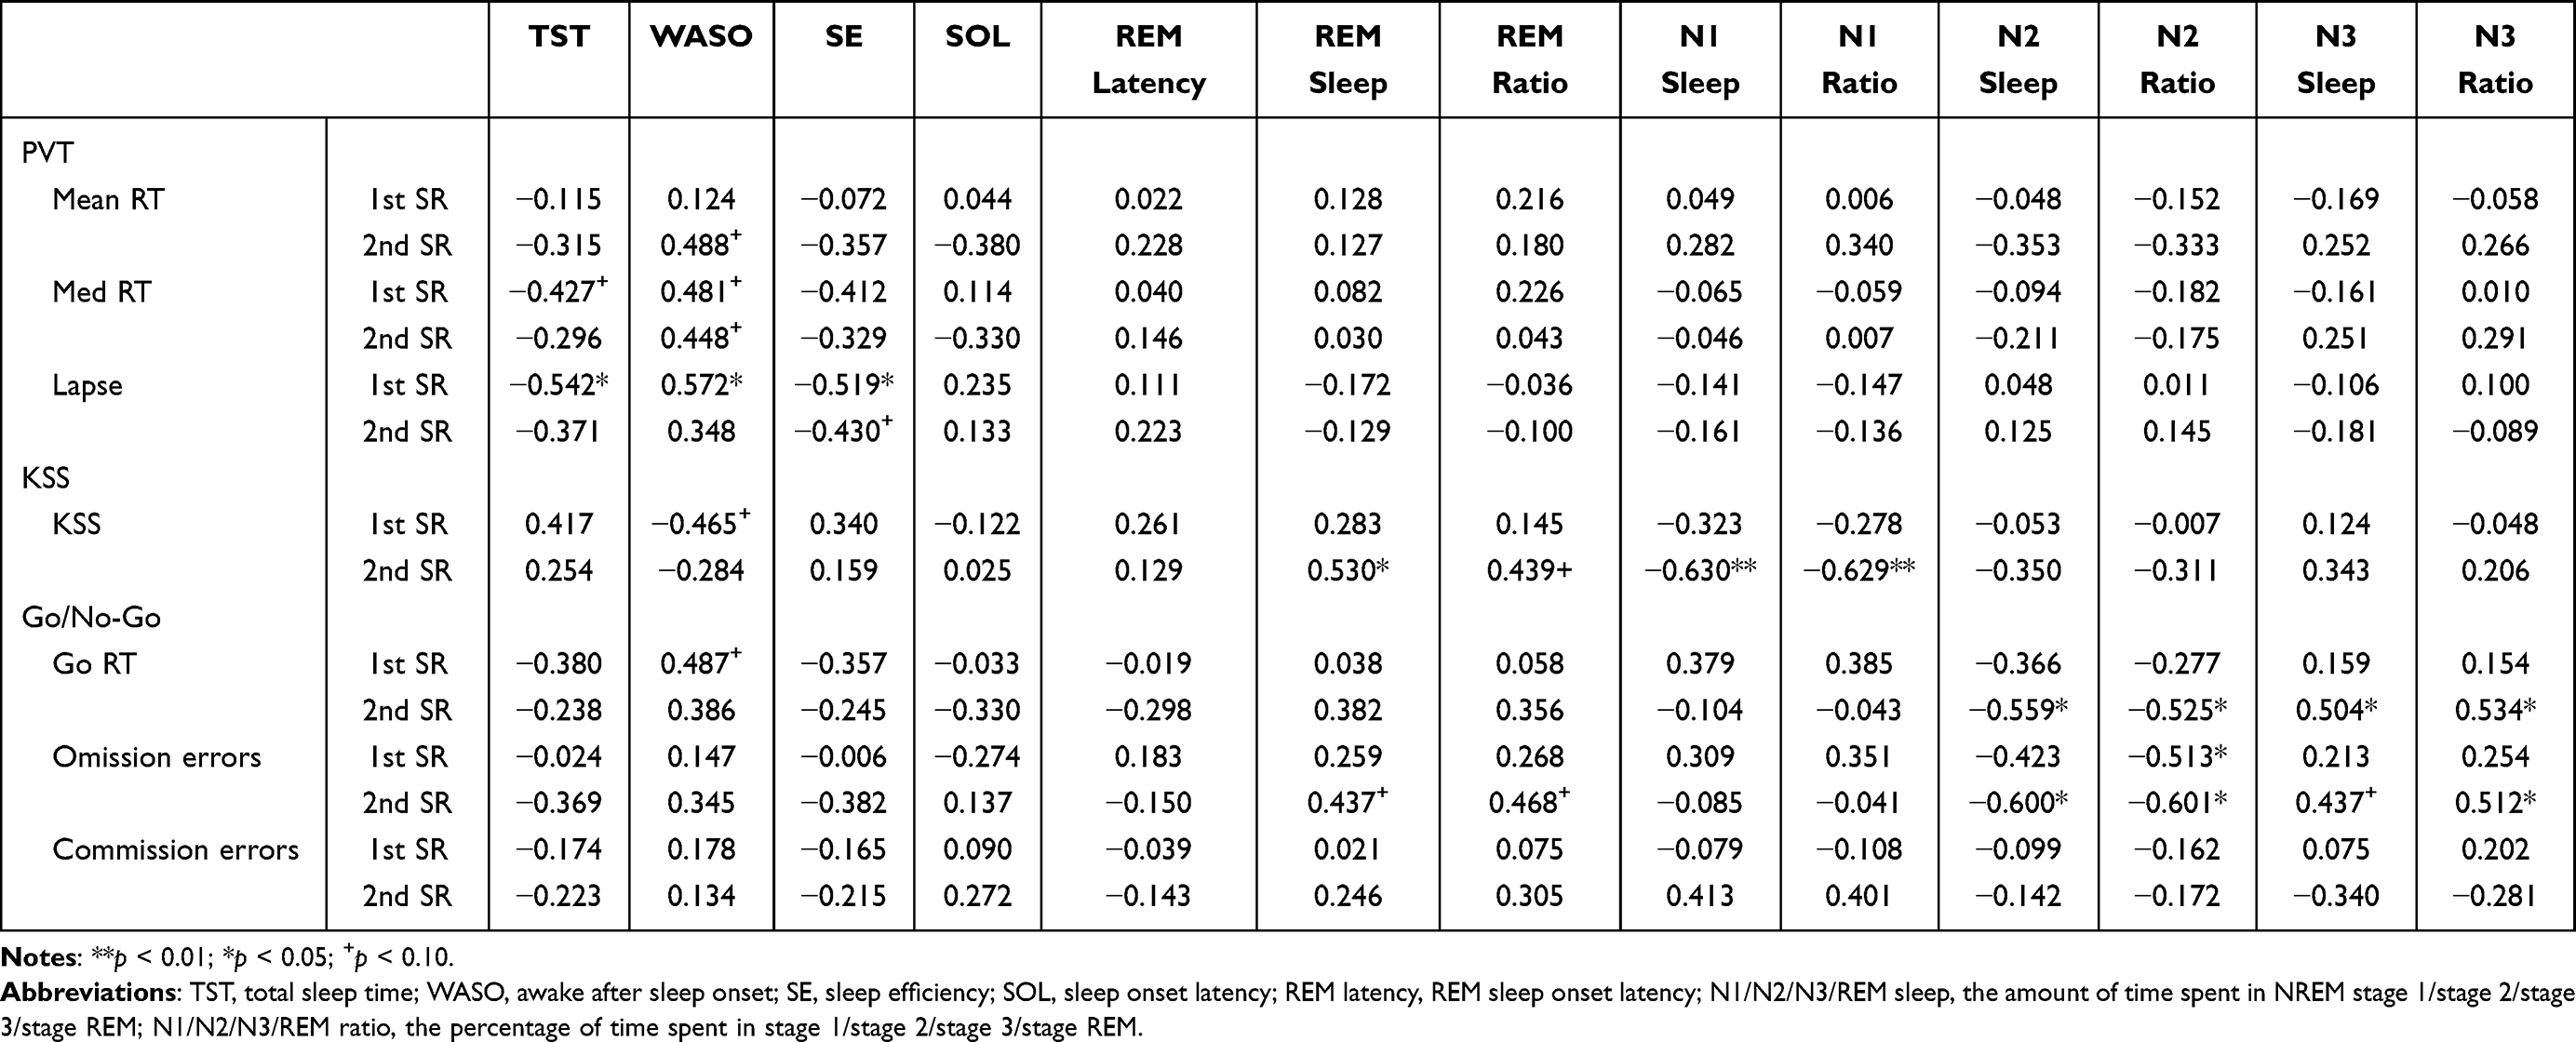 |
Table 2 Relationship Between Changes in Sleep Architecture During SR Nights and Cognition After SR Nights |
 |
Figure 2 Scatter plots of the relationship between changes in sleep architecture during 1st SR nights and changes in cognition after 1st SR night. The relationship between (A) Δ SE and Δ lapse; (B) Δ TST and Δ lapse; (C) Δ WASO and Δ lapse; (D) Δ N2 ratio and Δ omission errors. Abbreviations: SE, sleep efficiency; TST, total sleep time; WASO, awake after sleep onset; N2 ratio, the percentage of time spent in stage 2. |
After two nights of SR, we found significant correlations between sleep measures and performance outcomes. Specifically, changes in REM sleep were positively correlated with the KSS score. Regression analysis revealed that the length of REM sleep could explain 28.1% of the variance in KSS (R2 = 0.281, F(1, 14) = 5.465, β= 0.530, p = 0.035). In contrast, both N1 sleep and N1 ratio were negatively correlated with KSS, with regression analysis indicating that the variation of N1 sleep and N1 ratio could explain 39.7% (R2 = 0.397, F(1, 14) = 9.222, β= −0.630, p = 0.009) and 39.5% (R2 = 0.395, F(1, 14) = 9.156, β= −0.629, p = 0.009) of the variance in KSS, respectively. Additionally, N2 sleep and N2 ratio were negatively correlated with Go RT and omission errors in the Go/No-Go task. Regression analysis showed that the variation of N2 sleep and N2 ratio could explain 31.2% and 27.6% of the variance in Go RT [(R2 = 0.312, F(1, 14) = 6.363, β= −0.559, p = 0.024); (R2 = 0.276, F (1, 14) = 5.337, β = −0.525, p = 0.037)] and 35.9% and 36.1% of the variance in omission errors [(R2 = 0.359, F(1, 14) = 7.858, β = 0.600, p = 0.014); (R2 = 0.361, F (1, 14) = 7.896, β = 0.601, p = 0.014)], respectively. On the other hand, N3 sleep and N3 ratio were positively correlated with Go RT, and the variation of N3 sleep and N3 ratio could explain 25.4% and 28.5% of the variance in RT, respectively [(R2 = 0.254, F(1, 14) = 4.755, β= 0.504, p = 0.047); (R2 = 0.285, F(1, 14) = 5.577, β= 0.534, p = 0.033)]. There was also a significant positive correlation between N3 ratio and omission errors, with the variance of N3 ratio explaining 26.2% of the variance in omission errors (R2 = 0.262, F(1, 14) = 4.972, β= 0.512, p = 0.043). Moreover, there was a marginally significant positive correlation between WASO and mean RT and median RT of PVT, respectively (p = 0.055, p = 0.082). There was also a marginally significant negative correlation between SE and PVT lapses (p = 0.096). In addition, we found marginally significant positive correlations between N3 sleep and omission errors (p = 0.091), and between REM ratio and KSS (p = 0.089). Finally, both REM sleep and REM ratio were marginally significantly positively correlated with omission errors (p = 0.091, p = 0.068). Results are shown in Table 2 and Figure 3.
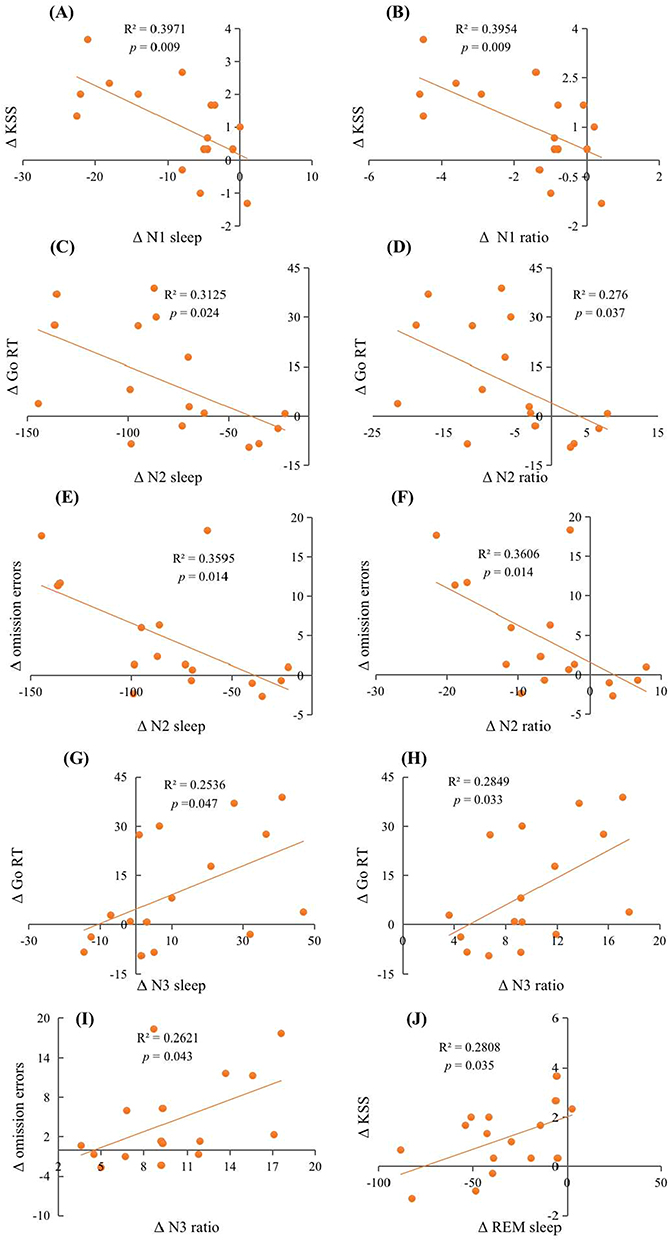 |
Figure 3 Scatter plots of the relationship between changes in sleep architecture during 2nd SR nights and changes in cognition after 2nd SR nights. The relationship between (A) Δ N1 sleep and Δ KSS; (B) Δ N1 sleep and Δ KSS; (C) Δ N2 sleep and Δ Go RT; (D) Δ N2 ratio and Δ Go RT; (E) Δ N2 sleep and Δ omission errors; (F) Δ N2 ratio and Δ omission errors; (G) Δ N3 sleep and Δ Go RT; (H) Δ N3 ratio and Δ Go RT; (I) Δ N3 ratio and Δ omission errors; (J) Δ REM sleep and Δ KSS. Abbreviations: N1/N2/N3/REM sleep, the amount of time spent in NREM stage 1/stage 2/stage 3/stage REM; N1/N2/N3 ratio, the percentage of time spent in stage 1/stage 2/stage 3. |
Differences of Sleep EEG Power Density Among Baseline and SR Nights
Repeated measures ANOVA showed that there were significant differences in delta wave power density among different sleep conditions (during the whole night of baseline, 1st SR, 2nd SR; F (2, 30) = 4.441, p = 0.020, η2p = 0.228). Paired sample t-test further showed that the power density of delta at baseline was significantly lower than that after 1st SR (t(15) = −2.491, p = 0.025, Cohen’s d = −0.623) and 2nd SR (t(15) = −2.748, p = 0.015, Cohen’s d = −0.687), while no significant differences were found between 1st SR and 2nd SR (p > 0.05). Similarly, the differences in theta wave power density among different sleep conditions showed a trend toward significance (F(2, 30) = 2.832, p = 0.075, η2p = 0.159). The power density of theta wave at baseline was significantly lower than that after 1st SR (p < 0.05), and marginally significantly lower than that after 2nd SR (t(15) = −1.890, p = 0.078, Cohen’s d = −0.473), while there were no significant differences between 1st SR and 2nd SR (p > 0.05). See results in Figure 4.
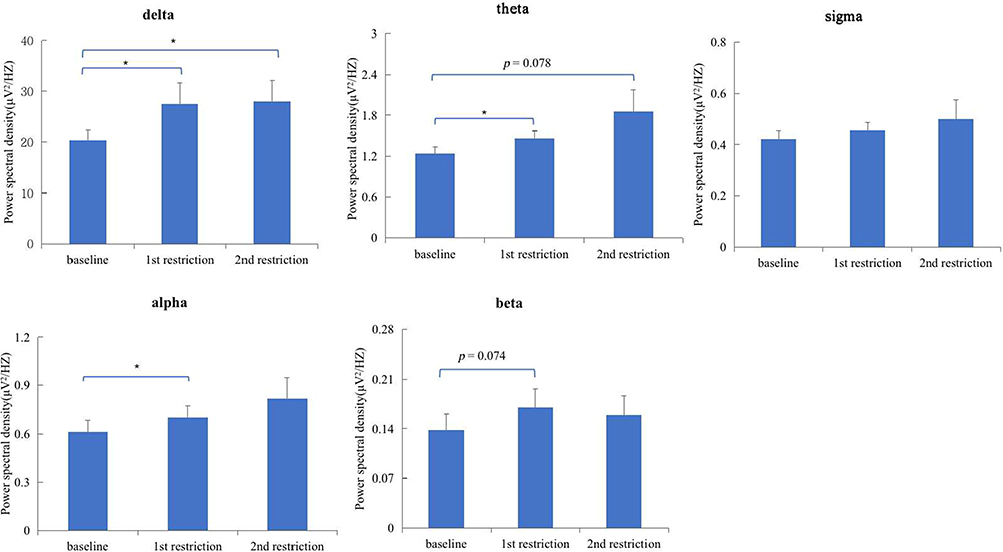 |
Figure 4 Differences of sleep EEG power density among baseline and SR nights. Note: *p < 0.05. |
There were no significant differences in alpha wave power density among different sleep conditions (p > 0.05). The power density of alpha wave at baseline was significantly lower than that after 1st SR (t(15) = −2.157, p = 0.048, Cohen’s d = −0.539). Similarly, there were no significant differences in sigma or beta (all p > 0.05) wave power density among different sleep conditions. Nevertheless, the power density of beta wave at baseline was marginally significantly lower than that after 1st SR (p = 0.074). Results are shown in Figure 4.
Relationship Between Changes in Sleep EEG Power Density During SR Nights and Cognition After SR Nights
To investigate how SR affects cognition through sleep EEG power density, we compared baseline levels of sleep EEG power density and cognitive performance with those after one or two nights of SR. We then examined correlations between changes in sleep EEG power density and cognitive performance and conducted regression analysis on variables with significant correlations.
After one night of SR, we found that the change in delta wave power density had a significant positive correlation with the change in mean and median RT in the PVT but a significant negative correlation with the change in KSS value. Regression analysis revealed that the variation in delta wave power density could explain 41.5% of the variation in mean RT (R2 = 0.415, F(1, 14) = 9.943, β = 0.644, p = 0.007), 51.7% in median RT (R2 = 0.517, F(1, 14) = 14.979, β = 0.719, p = 0.002), and 28.7% in KSS (R2 = 0.287, F(1, 14) = 5.642, β = −0.536, p = 0.032). The change in theta wave power density had a significant negative correlation with the change in KSS, with an explanation of 28.7% (R2 = 0.287, F(1, 14) = 5.622, β = −0.535, p = 0.033). The change in alpha wave power density had a significant negative correlation with the change in KSS and a significant positive correlation with the change in Go/No-Go omission errors. The variation in alpha wave power density could explain 36.3% of the variation in KSS (R2 = 0.363, F(1, 14) = 7.975, β = −0.602, p = 0.014) and 39.8% of the variation in omission errors (R2 = 0.398, F(1, 14) = 9.242, β = 0.631, p = 0.009). Additionally, the change in alpha wave power spectral density had a marginally significant positive correlation with the change in mean and median RT of the PVT (p = 0.051; p = 0.059). The changes in delta wave and theta wave power density had marginally significant positive correlations with the changes in omission errors (p = 0.075; p = 0.054). Results are shown in Table 3 and Figure 5. Then, we performed Shapiro–Wilk normality tests for the power spectral densities of various different waves.38 It was found that the power spectral density of the delta wave did not conform to the normal distribution (p < 0.05). We performed the square root transformation of the normal distribution and then performed the regression analysis again. Regression analysis revealed that the variation in delta wave power density could explain 30.8% of the variation in mean RT (R2 = 0.308, F(1, 14) = 5.794, β = 0.555, p = 0.032), 42.7% in median RT (R2 = 0.427, F(1, 14) = 9.700, β = 0.654, p = 0.008), and 28.0% in KSS (R2 = 0.280, F(1, 14) = 5.045, β = −0.529, p = 0.043), which is basically consistent with the results before the normal transformation (all ps < 0.05).
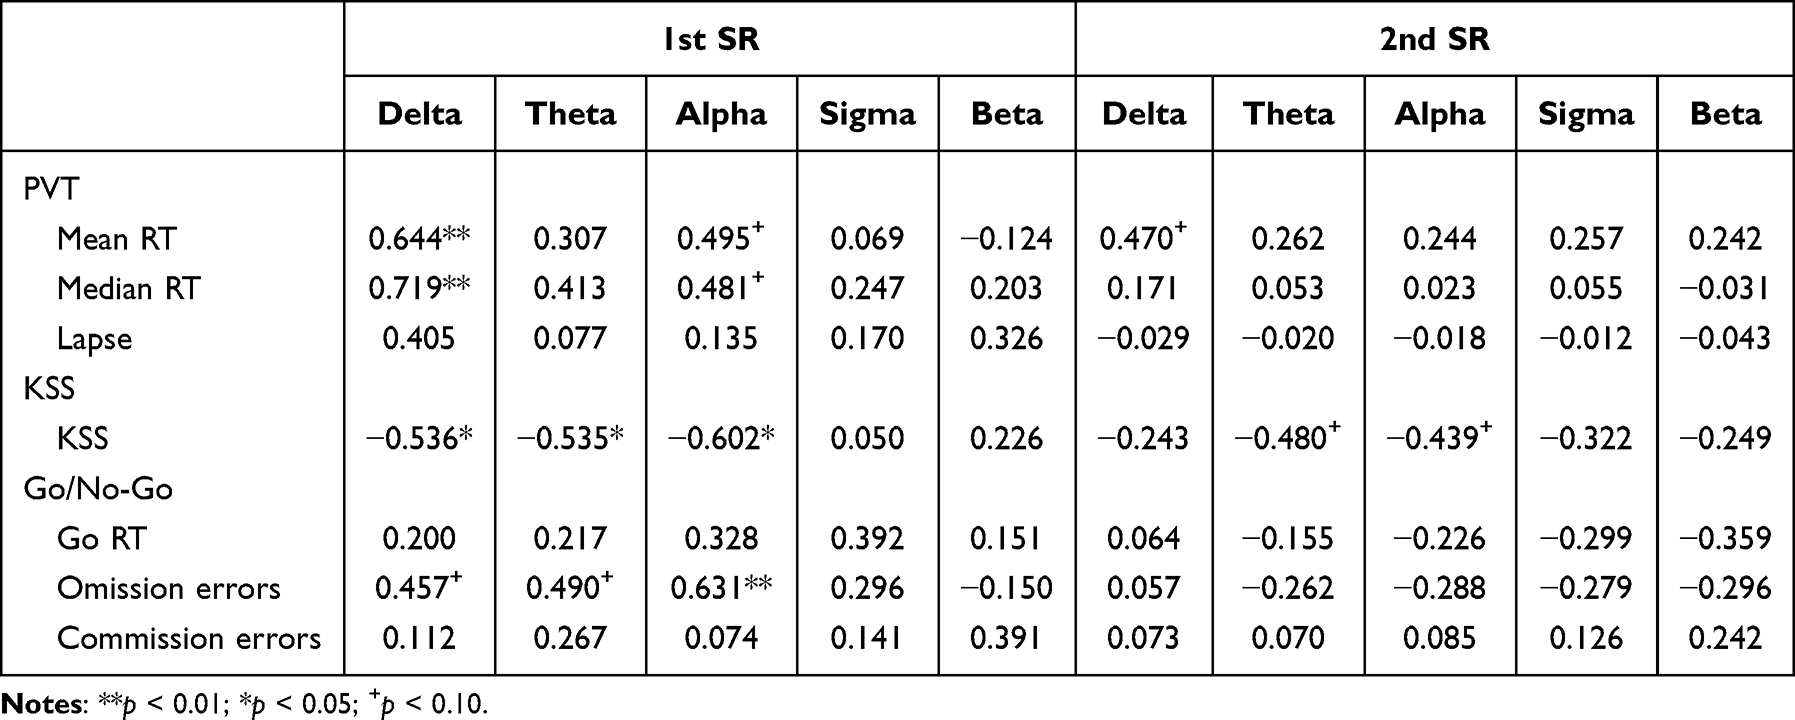 |
Table 3 Relationship Between Changes in Sleep EEG Power Density During SR Nights and Cognition After SR Nights |
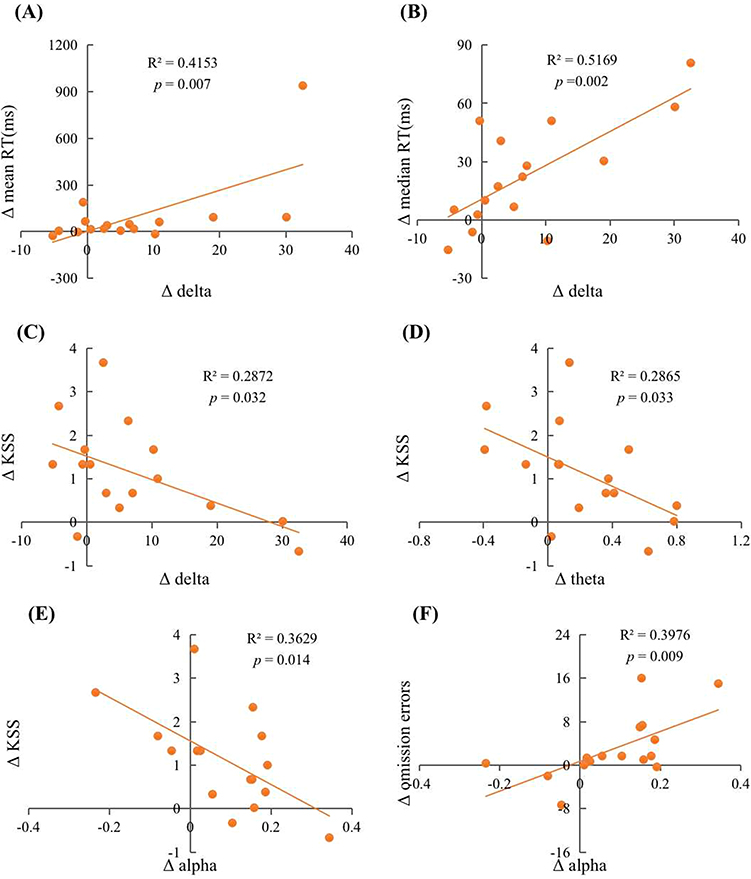 |
Figure 5 Scatter plots of the relationship between changes in sleep EEG power density during 1st SR night and changes in cognition after 1st SR night. The relationship between (A) Δ delta and Δ mean RT; (B) Δ delta and Δ median RT; (C) Δ delta and Δ KSS; (D) Δ theta and Δ KSS; (E) Δ alpha and Δ KSS; (F) Δ alpha and Δ omission errors. |
After two nights of SR, we found a significant positive correlation between changes in power spectral density of delta waves and changes in mean RT of PVT. Specifically, the variation in delta wave power density accounted for 22.1% of the variance in mean RT (R2 = 0.221, F(1, 14) = 3.973, β = 0.470, p = 0.066). Additionally, we observed marginally significant negative correlations between changes in power spectral density of theta and alpha waves and changes in KSS. The variation in power spectral density of theta and alpha waves explained 23.0% (R2 = 0.230, F(1, 14) = 4.192, β = −0.480, p = 0.060) and 19.3% (R2 = 0.193, F(1, 14) = 3.341, β = −0.489, p = 0.089) of the variance in KSS, respectively. See detailed results in Table 3 and Figure 6. Then, we also performed Shapiro–Wilk normality tests for the power spectral densities of various different waves.38 It was found that the power spectral density of all the waves did not conform to the normal distribution (p < 0.05). We performed the square root transformation of the normal distribution and then performed the regression analysis again. Results found that the variation in delta wave power density accounted for 22.4% of the variance in mean RT (R2 = 0.224, F(1, 14) = 4.047, β = 0.474, p = 0.064), and the variation in power spectral density of theta and alpha waves explained 22.4% (R2 = 0.224, F(1, 14) = 4.045, β = −0.473, p = 0.064) and 17.7% (R2 = 0.177, F(1, 14) = 3.009, β = −0.421, p = 0.105) of the variance in KSS, respectively. These results are basically consistent with the results before the normal transformation.
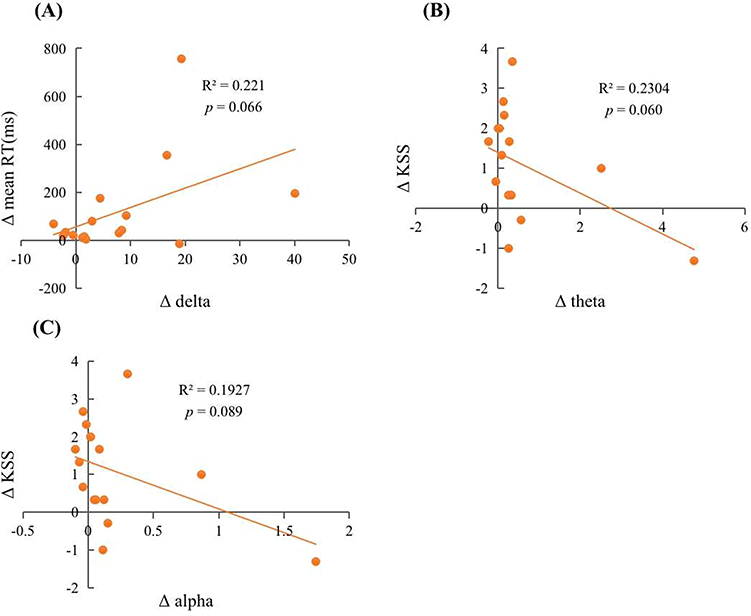 |
Figure 6 Scatter plots of the relationship between changes in sleep EEG power density during 2nd SR nights and changes in cognition after 2nd SR nights. The relationship between (A) Δ delta and Δ mean RT; (B) Δ theta and Δ KSS; (C) Δ alpha and Δ KSS. |
Discussion
Differences of Sleep Architecture Among Baseline and SR Nights
Our study found that longer periods of SR were associated with a decrease in N1, N2, and REM sleep stages, which is consistent with previous research.39 However, we also found an increase in N3 sleep stage, which suggests a compensatory mechanism. Additionally, we observed a decrease in WASO and an increase in SE with longer periods of SR and a gradual increase in SE and a gradual decrease in SOL and REM latency as the duration of SR increased. These findings are consistent with prior studies showing shorter N1, N2, REM, and WASO, but higher SE during SR.13 However, one study found only minor changes in sleep architecture during 14 days of SR.11
Relationship Between Changes in Sleep Architecture During SR Nights and Cognition After SR Nights
We found that sleep restriction-induced change in TST, WASO, SE, REM, REM ratio, N3, N3 ratio, N2, and N2 ratio is associated with cognition. Specifically, poorer vigilant attention was associated with shorter TST, longer WASO, and lower SE, while impaired inhibitory control was associated with longer REM and N3, higher REM ratio and N3 ratio, shorter N2, and lower N2 ratio. The relationship between sleep architecture and cognitive performance was inconsistent with a previous study that reported poorer executive function and attention performance being associated with lower REM ratio and higher N1 ratio, with no significant correlation between N2 ratio, SWS, and cognitive performance.15 Differences in the age of study participants and the duration of sleep deprivation could explain the inconsistency. Blackwell et al found that physiological indicators of sleep were slower than behavioral performances during wakefulness to respond to long-term SR, which may explain the moderate correlation between changes.15
Differences of Sleep EEG Power Density Among Baseline and SR Nights
Delta wave power density significantly increased during the first and second nights of SR compared to baseline, consistent with prior research.9,40 Moreover, the power density of delta waves increased slightly during the first few nights of SR and remained stable during the next few nights of SR.6,11
Theta and alpha wave power density significantly increased on the first night of SR, with a trend towards significance on the second night. Previous studies found that after total sleep deprivation, there was a significant increase in theta and alpha wave activity,41,42 with more alpha activity in the left frontal lobe in the sleep-deprived group.43 In another study of total sleep deprivation in women, alpha wave activity dropped, and theta wave activity increased during resting state, while theta wave activity appeared to decline during task state.44 The inconsistencies might be due to differences in the duration of SR or EEG measurement.
Sigma waves are a characteristic feature of N2 sleep and play a crucial role in cognitive function.45,46 Greater sleep spindle activity is generally associated with better cognitive performance.18 However, in our study, we found no significant differences in the spectral density of the sigma band under various sleep conditions. This contradicts earlier studies which showed decreased sigma activity after two or four consecutive nights of 4-hour SR.5,6 One possible explanation for this discrepancy is that the 6-hour sleep limit in our study may not have been sufficient for spindles to provide cognitive protection. For instance, a study on SR in adolescents revealed that four consecutive nights of SR (9, 8, 7, 6, or 5 hours, respectively) did not affect sigma activity.
Relationship Between Changes in Sleep EEG Power Density During SR Nights and Cognition After SR Nights
After the first night of SR, we observed a significant positive correlation between changes in delta waves and the mean and median RT of the PVT. These results suggest that an increase in delta waves following SR could lead to slower responses. This finding is consistent with previous studies demonstrating that an increase in SWS after sleep deprivation is linked to reduced alertness.47 In addition, we observed a positive correlation between the increase in alpha wave power density and omission errors in the Go/No-Go. This association may be due to individual differences among participants or caused by reduced sleep time due to sleep restriction. For example, previous research has shown that patients with insomnia have impaired inhibitory control, and insomnia duration is an important factor affecting the abnormal theta rhythm and alpha rhythm of patients, and the abnormal rhythm of patients with insomnia duration of more than 3 years is particularly obvious.48
However, after two nights of SR, the correlation between delta wave change and the mean RT of PVT change is weakened, and the correlation between theta and alpha and KSS is also weakened. There are two possible reasons for the difference in the degree of correlation between changes in sleep EEG and changes in cognitive tasks after the first and second night of sleep restriction. Firstly, on the first night of sleep restriction, the reduction of sleep duration may cause significant changes in the mean value of sleep EEG throughout the whole night, as well as cognitive performance on the next day, while on the second night of sleep restriction, the changes in sleep EEG may not be as significant as on the first night. Besides, an additional uncertainty factor of daylight time is added (there may be adaptation or other confounding variables involved). These combined factors may cause the predictive power of sleep EEG to gradually weaken. Second, EEG parameters may vary between individuals and at different nights within individuals. Sleep EEG parameters may be correlated with behavioral parameters to some extent, but more studies and samples are needed to verify this correlation in the future.49,50 For instance, a study found no significant association between changes in driving performance and changes in EEG after total sleep deprivation,42 suggesting that individual differences in EEG parameters may not be useful in predicting driving performance on the road.
These findings suggest that sleep EEG and cognitive performance underwent significant changes after the first night of SR. However, the predictive power of EEG diminished after the second night, possibly due to the influence of other confounding factors. Furthermore, given the variability of fluctuations over time, it may be challenging to detect significant correlations between the two parameters. Moreover, individual differences in EEG parameters may be too significant to predict behavioral parameters accurately.
Limitations and Future Directions
The study has several limitations. Firstly, the two consecutive nights of SR were relatively mild. Future studies could consider increasing the number of nights, as Reynolds et al stated that at least four nights of SR are needed to provide a more reliable estimate of spindle density.51 Secondly, individual differences, which are common in both adults and children,52–54 were not considered and require further research. Thirdly, due to the complexity of sleep experiment operation, the sample size of the experiment is relatively small. Future studies can expand the sample size to further verify the results and conclusions of this study. Moreover, other EEG measurement indicators such as duration and amplitude in different frequency bands are needed to thoroughly discuss, as one study found significant differences in the duration and amplitude of spindles after different durations of SR.18
Conclusion
In summary, sleep restriction impaired cognitive performance (including inhibition control during the Go/No-Go task and vigilant attention during the PVT), and altered sleep architecture and sleep EEG. Poorer performance was associated with longer WASO, a larger proportion of N3 sleep, and a smaller proportion of N2 sleep, as well as increased power spectral density of delta waves. Findings from the present study suggest that changes in sleep architecture and EEG signatures may contribute to cognitive impairment caused by sleep restriction or indicate persisting sleep pressure during subsequent wakefulness.
Acknowledgments
This research was supported in part by grants from the National Natural Science Foundation of China (32200889), Shanghai Post-doctoral Excellence Program (2020367), China Postdoctoral Science Foundation (2021M692150), Shanghai International Studies University Research Projects (2021KFKT012), and South China Normal University. The funders had no role in the study design, data collection and analysis, data interpretation, writing of the manuscript, or the decision to submit the article for publication.
Disclosure
The authors report no conflicts of interest in this work.
References
1. Chua EC, Fang E, Gooley JJ, Lee P-L. Effects of total sleep deprivation on divided attention performance. PLoS One. 2017;12(11):e0187098. doi:10.1371/journal.pone.0187098
2. Van Peer JM, Gladwin TE, Nieuwenhuys A. Effects of threat and sleep deprivation on action tendencies and response inhibition. Emotion. 2019;19(8):1425–1436. doi:10.1037/emo0000533
3. Anderson C, Platten CR. Sleep deprivation lowers inhibition and enhances impulsivity to negative stimuli. Behav Brain Res. 2011;217(2):463–466. doi:10.1016/j.bbr.2010.09.020
4. Carskadon MA, Harvey K, Dement WC. Acute restriction of nocturnal sleep in children. Percept Mot Skills. 1981;53(1):103–112. doi:10.2466/pms.1981.53.1.103
5. Brunner DP, Dijk DJ, Tobler I, Borbely AA. Effect of partial sleep deprivation on sleep stages and EEG power spectra: evidence for non-rem and REM sleep homeostasis. Electroencephalogr Clin Neurophysiol. 1990;75(6):492–499. doi:10.1016/0013-4694(90)90136-8
6. Brunner DP, Dijk DJ, Borbély AA. Repeated partial sleep deprivation progressively changes the EEG during sleep and wakefulness. Sleep. 1993;16(2):100–113. doi:10.1093/sleep/16.2.100
7. Kopasz M, Loessl B, Valerius G, et al. No persisting effect of partial sleep curtailment on cognitive performance and declarative memory recall in adolescents. J Sleep Res. 2010;19:71–79. doi:10.1111/j.1365-2869.2009.00742.x
8. Randazzo AC, Muehlbach MJ, Schweitzer PK, Walsh JK. Cognitive function following acute sleep restriction in children ages 10–14. Sleep. 1998;21(8):861–868. doi:10.1093/sleep/21.8.861
9. Voderholzer U, Piosczyk H, Holz J, et al. Sleep restriction over several days does not affect long term recall of declarative and procedural memories in adolescents. Sleep Med. 2011;12(2):170–178. doi:10.1016/j.sleep.2010.07.017
10. Belenky G, Wesensten NJ, Thorne DR, et al. Patterns of performance degradation and restoration during sleep restriction and subsequent recovery: a sleep dose-response study. J Sleep Res. 2003;12(1):1–12. doi:10.1046/j.1365-2869.2003.00337.x
11. Van Dongen HPA, Maislin G, Mullington JM, Dinges DF. The cumulative cost of additional wakefulness, Dose-response effects on neurobehavioral functions and sleep physiology from chronic sleep restriction and total sleep deprivation. Sleep. 2003;26(2):117–126. doi:10.1093/sleep/26.2.117
12. Banks S, Dinges DF. Behavioral and physiological consequences of sleep restriction. J Clin Sleep Med. 2007;3(05):519–528. doi:10.5664/jcsm.26918
13. Ong JL, Lo JC, Gooley JJ, Chee MWL. EEG changes across multiple nights of sleep restriction and recovery in adolescents: the need for sleep study. Sleep. 2016;39(6):1233–1240. doi:10.5665/sleep.5840
14. Åkerstedt T, Kecklund G, Ingre M, Lekander M, Axelsson J. Sleep homeostasis during repeated sleep restriction and recovery: support from EEG dynamics. Sleep. 2009;32(2):217–222. doi:10.1093/sleep/32.2.217
15. Blackwell T, Yaffe K, Ancoli-Israel S, et al. Associations of sleep architecture and sleep disordered breathing with cognition in older community-dwelling men: the osteoporotic fractures in men sleep study. J Am Geriatr Soc. 2011;59(12):2217–2225. doi:10.1111/j.1532-5415.2011.03731.x
16. Crenshaw MC, Edinger JD. Slow-wave sleep and waking cognitive performance among older adults with and without insomnia complaints. Physiol Behav. 1999;66(3):485–492. doi:10.1016/s0031-9384(98)00316-3
17. Bodizs R, Gombos F, Ujma PP, Kovacs I. Sleep spindling and fluid intelligence across adolescent development: sex matters. Front Hum Neurosci. 2014;8(952):1–11. doi:10.3389/fnhum.2014.00952
18. Reynolds CM, Gradisar M, Coussens S, Short MA. Sleep spindles in adolescence: a comparison across sleep restriction and sleep extension. Sleep Med. 2018;50:166–174. doi:10.1016/j.sleep.2018.05.019
19. Mao T, Dinges D, Deng Y, et al. Impaired vigilant attention partly accounts for inhibition control deficits after total sleep deprivation and partial sleep restriction. Nat Sci Sleep. 2021;13:1545–1560. doi:10.2147/NSS.S314769
20. Horne JA, Ostberg OA. A self-assessment questionnaire to determine morningness-eveningness in human circadian rhythms. Int J Chronobiol. 1976;4(2):97–110.
21. Zhang B, Hao YL, Rong RG. The reliability and validity of Chinese version morningness /eveningness questionnaire. Chin J Behav Med Sci. 2006;15(9):856–858.
22. Buysse DJ, Reynolds CF, Monk TH, Berman SR, Kupfer DJ. The Pittsburgh Sleep Quality Index: a new instrument for psychiatric practice and research. Psychiatry Res. 1989;28(2):193–213. doi:10.1016/0165-1781(89)90047-4
23. Buysse DJ, Reynolds CF, Monk TH, Hoch CC, Yeager AL, Kupfer DJ. Quantification of subjective sleep quality in healthy elderly men and women using the Pittsburgh Sleep Quality Index. J Sleep Res Sleep Med. 1991;14(4):331–338. doi:10.1093/sleep/14.4.331
24. Liu XC, Tang MQ, Hu L, et al. Reliability and validity of the Pittsburgh Sleep Quality Index. Chin J Psychiatry. 1996;29(2):103–107.
25. Zung WWK. A rating instrument for anxiety disorders. Psychosomatics. 1971;12(6):371–379. doi:10.1016/S0033-3182(71)71479-0
26. Wu WY. Self-rating anxiety scale. Shanghai Arch Psychiatry. 1990;2(Suppl 2):44.
27. Goldberg DP. The Detection of Psychiatric Illness by Questionnaire. Oxford: Oxford University Press; 1972:103–107.
28. Li H, Mei JR. Assessing psychological well-being of college student: psychometric properties of GHQ-20. Psychol Dev Educ. 2002;18(1):75–79.
29. Beck AT, Beamesberfer A. Assessment of depression: the depression inventory. Psychol Meas Psychopharmacol. 1974;7:151–169. doi:10.1159/000395074
30. Jasper HCC. Report of the committee on methods of clinical examination in electroencephalography: 1957. Electroencephalogr Clin Neurophysiol. 1958;10:370–375.
31. Campbell IG. EEG recording and analysis for sleep research. Curr Protoc Neurosci. 2009;49(1). doi:10.1002/0471142301.ns1002s49
32. Motamedi-Fakhr S, Moshrefi-Torbati M, Hill M, et al. Signal processing techniques applied to human sleep EEG signals-A review. Biomed Signal Process Control. 2014;10:21–33. doi:10.1016/j.bspc.2013.12.003
33. Cooley JW, Tukey JW. An algorithm for the machine calculation of complex Fourier series. Math Comput. 1965;19(90):297–301. doi:10.2307/2003354
34. Welch PD. The use of the fast Fourier transform for the estimation of power spectra: a method based on time averaging over short, modified periodograms. IEEE T Acoust Speech. 1967;15:70–73. doi:10.1109/TAU.1967.1161901
35. Lim J, Dinges DF. Sleep deprivation and vigilant attention. Ann N Y Acad Sci. 2008;1129(1):305–322. doi:10.1196/annals.1417.002
36. Dinges DF, Powell JW. Microcomputer analyses of performance on a portable, simple visual RT task during sustained operations. Behav Res Methods Instrum Comput. 1985;17(6):652–655. doi:10.3758/BF03200977
37. Horne JA, Burley CV. We know when we are sleepy: subjective versus objective measurements of moderate sleepiness in healthy adults. Biol Psychol. 2010;83(3):266–268. doi:10.1016/j.biopsycho.2009.12.011
38. Razali NM, Wah YB. Power comparisons of Shapiro-Wilk, Kolmogorov-Smirnov, Lilliefors and Anderson-Darling Tests. J Stat Mod Anal. 2011;2(1):21–33.
39. Cvirn MA, Dorrian J, Smith BP, Jay SM, Vincent GE, Ferguson SA. The sleep architecture of Australian volunteer firefighters during a multi-day simulated wildfire suppression: impact of sleep restriction and temperature. Accid Anal Prev. 2017;99:389–394. doi:10.1016/j.aap.2015.11.013
40. Hoedlmoser K, Griessenberger H, Fellinger R, et al. Event-related activity and phase locking during a psychomotor vigilance task over the course of sleep deprivation. J Sleep Res. 2011;20(3):377–385. doi:10.1111/j.1365-2869.2010.00892.x
41. Olbrich E, Landolt HP, Achermann P. Effect of prolonged wakefulness on electroencephalographic oscillatory activity during sleep. J Sleep Res. 2014;23(3):255–262. doi:10.1111/jsr.12123
42. Perrier J, Jongen S, Vuurman E, Bocca ML, Ramaekers JG, Vermeeren A. Driving performance and EEG fluctuations during on-the-road driving following sleep deprivation. Biol Psychol. 2016;121:1–11. doi:10.1016/j.biopsycho.2016.09.010
43. Zhang J, Lau EY, Hsiao JH. Sleep deprivation compromises resting-state emotional regulatory processes: an EEG study. J Sleep Res. 2018;28(1–8):e12671. doi:10.1111/jsr.12671
44. Corsi-Cabrera M, Sanchez AI, del-Rio-Portilla Y, Villanueva Y, Pérez-Garci E. Effect of 38 h of total sleep deprivation on the waking EEG in women: sex differences. Int J Psychophysiol. 2003;50(3):213–224. doi:10.1016/S0167-8760(03)00168-5
45. Fogel SM, Nader R, Cote KA, Smith CT. Sleep spindles and learning potential. Behav Neurosci. 2007;121(1):1–10. doi:10.1111/j.1365-2869.2006.00522.x
46. Fogel SM, Smith CT. The function of the sleep spindle: a physiological index of intelligence and a mechanism for sleep-dependent memory consolidation. Neurosci Biobehav Rev. 2011;35(5):1154–1165. doi:10.1016/j.neubiorev.2010.12.003
47. Angelina M. Chronically Increased Sleep Pressure: Electrophysiological Correlates and Behavioral Consequences [doctoral dissertation]. The University of Zurich, Faculty of Arts; 2017.
48. Zhao WR. The Impaired Inhibitory Control of Insomnia Disorder: Evidence from Stop Signal Task and Resting-state EEG Rhythms [master’s thesis]. Southwest University; 2017.
49. Akerstedt T, Ingre M, Kecklund G, et al. Reaction of sleepiness indicators to partial sleep deprivation, time of day and time on task in a driving simulator--the DROWSI project. J Sleep Res. 2010;19(2):298–309. doi:10.1111/j.1365-2869.2009.00796.x
50. Simon M, Schmidt EA, Kincses WE, et al. EEG alpha spindle measures as indicators of driver fatigue under real traffic conditions. Clin Neurophysiol. 2011;122(6):1168–1178. doi:10.1016/j.clinph.2010.10.044
51. Reynolds CM, Gradisar M, Short MA. Reliability of sleep spindle measurements in adolescents: how many nights are necessary? J Sleep Res. 2019;28(1):1–5. doi:10.1111/jsr.12698
52. Finelli LA, Baumann H, Borbély AA, Achermann P. Dual electroencephalogram markers of human sleep homeostasis: correlation between theta activity in waking and slow-wave activity in sleep. Neuroscience. 2000;101(3):0–529. doi:10.1016/s0306-4522(00)00409-7
53. Rusterholz T, Durr R, Achermann P. Inter-individual differences in the dynamics of sleep homeostasis. Sleep. 2010;33(4):491–498. doi:10.1093/sleep/33.4.491
54. Lassonde JM, Rusterholz T, Kurth S, Schumacher AM, Achermann P, Lebourgeois MK. Sleep physiology in toddlers: effects of missing a nap on subsequent night sleep. Neurobiol Sleep Circadian Rhythms. 2016;1(1):19–26. doi:10.1016/j.nbscr.2016.08.001
 © 2023 The Author(s). This work is published and licensed by Dove Medical Press Limited. The
full terms of this license are available at https://www.dovepress.com/terms
and incorporate the Creative Commons Attribution
- Non Commercial (unported, 3.0) License.
By accessing the work you hereby accept the Terms. Non-commercial uses of the work are permitted
without any further permission from Dove Medical Press Limited, provided the work is properly
attributed. For permission for commercial use of this work, please see paragraphs 4.2 and 5 of our Terms.
© 2023 The Author(s). This work is published and licensed by Dove Medical Press Limited. The
full terms of this license are available at https://www.dovepress.com/terms
and incorporate the Creative Commons Attribution
- Non Commercial (unported, 3.0) License.
By accessing the work you hereby accept the Terms. Non-commercial uses of the work are permitted
without any further permission from Dove Medical Press Limited, provided the work is properly
attributed. For permission for commercial use of this work, please see paragraphs 4.2 and 5 of our Terms.