
Back to Journals » Breast Cancer: Targets and Therapy » Volume 18
SLC2A9-Mediated Uric Acid Homeostasis Modulates Apoptosis in TNBC
Authors Chen P, Xu J, Liang Y, Mu J  , Feng W, Liu J, Li B
Received 3 March 2026
Accepted for publication 16 June 2026
Published 22 June 2026 Volume 2026:18 606599
DOI https://doi.org/10.2147/BCTT.S606599
Checked for plagiarism Yes
Review by Single anonymous peer review
Peer reviewer comments 5
Editor who approved publication: Professor Pranela Rameshwar
Peng Chen, Jiapeng Xu, Yulong Liang, Jinghui Mu, Wenjing Feng, Jiaming Liu, Bolun Li
Department of Thyroid, Breast and Hernia Surgery, Third Hospital of Hebei Medical University, Shijiazhuang, Hebei, People’s Republic of China
Correspondence: Jiapeng Xu, Department of Thyroid, Breast and Hernia Surgery, Third Hospital of Hebei Medical University, No. 139 Ziqiang Road, Qiaoxi District, Shijiazhuang, Hebei Province, People’s Republic of China, Email [email protected]
Objective: To investigate the biological function of SLC2A9 in triple-negative breast cancer (TNBC) and its molecular mechanism of influencing TNBC cells by regulating uric acid (UA) metabolism.
Methods: Bioinformatics analysis was performed to screen genes intersecting TNBC and UA metabolism pathways. TNBC cell lines were cultured in vitro, followed by the establishment of SLC2A9 overexpression and knockdown models. Subsequently, the levels of intracellular and extracellular UA were quantified. Cell proliferation, apoptosis, migration, and invasion capabilities were assessed using CCK-8, plate cloning, flow cytometry apoptosis analysis, scratch assay, and Transwell assays. Western blot analysis evaluated the expression of apoptosis-related proteins and UA metabolism proteins.
Results: SLC2A9 was significantly downregulated in TNBC tissues and most cell lines. SLC2A9 overexpression inhibited TNBC cell proliferation, migration, and invasion while promoting apoptosis. It also increased extracellular UA secretion and reduced intracellular UA accumulation. Conversely, SLC2A9 knockdown or probenecid treatment reversed these phenotypes. SLC2A9 exerts its effects by upregulating XDH, downregulating ABCG2, and modulating mitochondrial apoptosis pathway protein expression.
Conclusion: SLC2A9 regulates the malignant phenotype of TNBC by altering the levels of UA inside and outside the cell. Its anticancer activity depends on UA transport function, making it a promising prognostic biomarker and novel metabolic therapeutic target for TNBC.
Keywords: TNBC, SLC2A9, uric acid metabolism, apoptosis, urate transporters
Introduction
Breast cancer is the most common malignant tumor among women worldwide, and triple-negative breast cancer (TNBC) represents the most aggressive subtype, accounting for approximately 20% of all breast cancer cases.1 TNBC lacks expression of estrogen receptor (ER), progesterone receptor (PR), and human epidermal growth factor receptor 2 (HER2), resulting in poor patient prognosis.2,3 Metabolic reprogramming is a core characteristic of tumor cells. TNBC cells highly depend on glycolytic effects to sustain rapid proliferation, accompanied by abnormal activation of pathways such as purine metabolism.4,5 Uric acid (UA), the end product of purine metabolism, primarily exists in the body as urate. UA provides antioxidant protection against cellular oxidative stress while simultaneously inducing inflammatory responses. Intracellular UA accumulation helps tumor cells resist oxidative damage in the microenvironment, whereas activated inflammation promotes tumorigenesis and metastasis. Elevated serum UA levels resulting from overproduction or impaired excretion increase the risk of colorectal cancer, breast cancer, and other malignancies.6,7 However, the regulatory mechanisms of UA metabolism in TNBC cells and their association with tumor phenotypes remain unclear.
The reabsorption and secretion of UA are regulated by multiple transporters. Notably, solute carrier family 2 member 9 (SLC2A9) and ATP-binding cassette subfamily G member 2 (ABCG2) have been reported to play crucial roles in serum UA regulation.8 SLC2A9, a transmembrane transporter also known as glucose transporter 9 (GLUT9), participates in cellular glucose uptake while also functioning as a UA transporter to regulate renal and intracellular UA transport and homeostasis. Studies confirm that GLUT9 serves as a high-capacity UA transporter in both humans and rodents, and its absence alters UA homeostasis.9–12 Functional studies of SLC2A9 in oncology remain limited. Han et al found that overexpression of SLC2A9 in hepatocellular carcinoma cells suppressed proliferation,12 while Nie et al demonstrated that intracellular-extracellular UA balance in endothelial cells is regulated by UA transporters.13 However, its biological function in TNBC and its association with UA metabolism remain unreported. Significantly, dysfunction of SLC2A9 - a key UA transporter - may disrupt intracellular-extracellular UA homeostasis, thereby modulating the tumor microenvironment and influencing the phenotype and apoptosis of TNBC. Furthermore, ABCG2 was initially identified as a breast cancer membrane-associated protein. Tumors expressing ABCG2 exhibit drug-resistant phenotypes, and SLC2A9 shows a positive correlation with ABCG2. Their synergistic effects in TNBC may reprogram UA metabolism.14,15
Based on this, this study systematically investigated the expression characteristics of UA metabolism pathways in TNBC by integrating the Gene Ontology (GO) database and the Gene Expression Omnibus (GEO) database. It elucidated the molecular mechanisms by which UA metabolism regulates TNBC cell function and apoptosis, revealing the pivotal role of SLC2A9 in the TNBC- UA metabolism pathway. This research provides new theoretical support for identifying prognostic biomarkers in TNBC.
Materials and Methods
Acquisition of Gene Sets and Differential Expression Analysis
Transcriptome dataset GSE264108 from TNBC patients (n=7) and healthy donors (n=7) was obtained from the GEO database (https://www.ncbi.nlm.nih.gov/geo/). Differentially expressed genes (DEGs) were identified using the limma package (version 3.5.0) in R, with differential expression analysis performed via the DESeq2 package. Screening criteria were set as |log2FoldChange| ≥ 1 and p-value < 0.05. Genes associated with the uric acid metabolism pathway (GO:0046415) were obtained from the GO database (http://geneontology.org). This pathway defines biochemical reactions involving UA (2,6,8-trioxopurine), the final purine metabolism product involved in biological regulation. Perform PCA analysis on the dataset using the FactoMineR package (version 2.4) and visualize the results with the factorextra package (version 1.0.7). A Venn diagram analysis identified candidate genes shared between the differentially expressed genes from GSE264108 and the UA metabolism pathway genes. The differentially expressed genes were visualized using the online platform https://www.bioinformatics.com.cn/. Subsequently, the expression levels of the candidate genes were validated using the GEO gene sets GSE267442 and GSE280897.
Cell Culture and Transfection
TNBC cell lines SUM149PT, SUM159PT, DU4475, MDAMB468, HCC1937, and non-TNBC cell line MCF10A were purchased from Wuhan procell Life Sciences Technology Co., Ltd (Item No. CL-0740, CL-0622, CL-0719, CL-0290, CL-0093, CL-0525). SUM149PT and MDAMB468 cells were cultured in DMEM medium (C2701, Beyotime) supplemented with 10% FBS (A5256701, Gibco) and 1% penicillin-streptomycin dual antibiotic (C0222, Beyotime); SUM159PT, DU4475, and HCC1937 cells were cultured in RPMI 1640 (C2721, Beyotime) supplemented with 10% FBS and 1% penicillin-streptomycin; MCF10A cells were maintained in specialized medium (CM-0525, DMEM + 5% FBS + 20 ng/mL EGF + 0.5 μg/mL hydrocortisone + 10 μg/mL insulin + 1% NEAA + 1% P/S, Procell). Cells were grown at 37°C in 5% CO2.
SUM149PT and SUM159PT cells were harvested during the exponential growth phase. Seed cells (1×10⁶ cells/well) into six-well plates and culture overnight. Prepare Lipo 3000 transfection reagent (L3000075, Thermo Fisher) complexes with siRNA sequences or overexpression plasmids in serum-free medium. Add complexes uniformly to cells and culture for 48 hours. SUM149PT cells were divided into a vector group and an oe-SLC2A9 group; SUM159PT cells were divided into four groups: si-NC, si-SLC2A9-1, si-SLC2A9-2, and si-SLC2A9-3. siRNA and overexpression plasmid sequences are detailed in Table S1.
CCK-8 Assay
Cells from each group were seeded at a density of 5×10³ cells/well in a 96-well plate and cultured overnight. 10 μL of CCK-8 solution (C0041, Beyotime) were added to each well, and incubated for 4 h. Absorbance was measured at 450 nm to calculate cell viability. Probenecid (HY-B0545, MedChemExpress), an inhibitor of UA transporters, was added to cells. The vector group and oe-SLC2A9 group of SUM149PT cells were treated with 10 μM Probenecid for 4 h, followed by the same experimental procedures as above.
Plate Clone Formation Assay
Seed cells at a density of 300 cells/well in a 6-well plate. Change the medium every two days and culture for 10 days. Subsequently, remove the medium, wash the cells with PBS, add 1 mL of 4% paraformaldehyde (P395744, Aladdin) for 30 min, followed by incubation with 0.5% crystal violet solution (C0121, Beyotime) for 20 min. After incubation, cells were washed with PBS and air-dried. Cell colony counts were quantified using ImageJ 1.4.6A software.
Flow Cytometry for Detecting Cell Apoptosis
After trypsin digestion, cells were resuspended following centrifugation at 1200×g for 3 min. Apoptosis was assessed using an apoptosis detection kit (40302ES60, Yeasen). The procedure is as follows: Resuspend the digested cells in Binding Buffer. Add 5 μL Annexin V-FITC and 10 μL PI staining solution, then incubate at room temperature in the dark for 15 min. After incubation, resuspend cells in an appropriate amount of Binding Buffer and analyze via flow cytometry to quantitatively detect apoptosis. Calculate the proportion of apoptotic cells using FlowJo software (version 10.8.1).
Cell Scratch Assay
Mark three parallel lines on the bottom of a 6-well plate in advance. Seed 1×10⁶ cells per well and culture until fully confluent. Use the pipette tip to create a uniform scratch perpendicular to the pre-marked lines on the cell monolayer. Wash away cell debris with PBS, then add fresh medium. Capture images of the same field of view immediately after scratching (0 hours) and at 48 hours. Use ImageJ software to measure the scratch area and calculate cell migration rate.
Cell Transwell Assay
Mix Matrigel with serum-free medium at a 1:8 ratio. Add 50 μL of the mixture to the Transwell upper chamber and incubate until solidified. Digest cells with trypsin, resuspend in serum-free medium, and add 100 μL of cell suspension (approximately 1×10⁵ cells) to the upper chamber. Add the corresponding medium containing FBS to the lower chamber and incubate for 24 h. After incubation, cells were washed with PBS, fixed with cell fixative for 30 min, then incubated with 0.5% crystal violet (C0121, Beyotime) for 30 min. Five random fields of view were photographed, and invasive cells were quantified using ImageJ software.
Cell UA Level Detection
UA levels in culture medium (secreted) and cell lysate supernatant (intracellular) were measured using the Uric Acid Detection Kit (S0232S, Beyotime). Specifically, secreted UA was detected directly from the culture medium, while intracellular UA required adding the kit’s lysis buffer, centrifuging, and collecting the supernatant. Prepare the Amplex Red reaction working solution according to the instructions and measure the absorbance at 570 nm.
qRT-PCR Assay
qRT-PCR was used to detect the mRNA expression levels of SLC2A9 in five TNBC cell lines and MCF10A. Cells were digested and resuspended, and total RNA was extracted using Beyozol reagent (R0011, Beyotime). Reverse transcription was performed using a reverse transcription kit (D7168L; Beyotime) to convert RNA into cDNA. Quantitative PCR was performed using SYBR Green Fluorescent Quantitative PCR Premix (G3326, Servicebio). Cycling conditions were: 30s pre-denaturation at 95°C, followed by 40 cycles (95°C for 5s + 60°C for 30s). Relative mRNA expression levels were calculated using the 2−ΔΔCt method, with GAPDH as the internal reference gene. Primer sequences are detailed in Tables S1 and S2.
Detection of Intracellular ROS Levels
The DCFH-DA fluorescent probe (ID31309, Solarbio, China) to detect intracellular ROS levels. SUM149PT and SUM159PT cells, which had been treated according to their respective groups, were seeded into 6-well plates. After 48 h, the culture medium was discarded, and serum-free medium containing DCFH-DA at a final concentration of 10 μM was added. The cells were incubated at 37°C in the dark for 20 min. After incubation, the cells were washed three times with PBS, and the fluorescence intensity in the FL1 channel was measured using a flow cytometer. The mean fluorescence intensity was analyzed using FlowJo software.
JC-1 Assay
The JC-1 fluorescent probe (C2006, Beyotime, China) was used to detect mitochondrial membrane potential. Treated cells were seeded in culture dishes; after 48 h, JC-1 working solution was added, and the cells were incubated at 37°C in the dark for 20 min. The supernatant was discarded, and the cells were washed twice with JC-1 buffer. Images were acquired using a laser confocal microscope (A1RHD25, Nikon Precision (Shanghai), China). The ratio of red to green fluorescence intensity was quantified using ImageJ software.
Western Blot Assay
After cell digestion, add cell lysis buffer (P0013, Beyotime) and incubate on ice for 30 min. Centrifuge to collect the supernatant. Determine protein concentration using the BCA assay kit (E-BC-K318-M, E-Bioscience). Proteins were separated by 10% SDS-PAGE gel electrophoresis at 120V for 90 min and transferred to PVDF membranes. Membranes were blocked in 5% skim milk for 2 h, then incubated overnight at 4°C with the corresponding primary antibody. After three washes with TBST, the membrane was incubated with the secondary antibody for 1 h. Images were developed using Enhanced Chemiluminescence Reagent (BL523A, Biosharp) and captured via a gel imaging system (SCG-W5000, Servicebio). Band grayscale values were recorded using ImageJ software. Antibody details are listed in Table S3.
Statistical Analysis
Graphing and data analysis were performed using ImageJ 1.4.6A, GraphPad Prism 9.0, and Adobe Illustrator 2020. All experiments were performed with a sample size of n = 3 biologically independent replicates. Comparisons between two groups were conducted using a two-tailed Student’s t-test, while comparisons among multiple groups were performed using one-way analysis of variance (ANOVA) followed by Dunnett’s test. Data are presented as mean ± SEM, with p < 0.05 considered statistically significant.
Results
SLC2A9 May Be a Key Target Influencing UA Metabolism Pathways in TNBC
To elucidate transcriptional differences between TNBC and normal breast tissue, principal component analysis (PCA) was first performed on the GSE264108 dataset. The TNBC and Control groups exhibited distinct clustering trends along principal components, indicating significant differences in transcriptional expression profiles between the two groups (Figure 1A). Ultimately, we identified and screened 1175 DEGs, generating heatmaps and volcano plots. Cross-referencing UA metabolism pathway genes with the identified TNBC DEGs yielded an overlapping gene, SLC2A9 (Figure 1F). Analysis revealed that SLC2A9 expression is downregulated in TNBC (Figure 1B and C). KEGG and GO enrichment analyses revealed that TNBC DEGs were predominantly enriched in apoptosis signaling pathways and tumor metabolic reprogramming pathways, including apoptotic mitochondrial changes, regulation of extrinsic apoptotic signaling, apoptosis - multiple species, and granule lumen. This suggests that TNBC is closely associated with cell proliferation/apoptosis regulation and metabolic reprogramming (Figure 1D and E). Subsequent validation in the GSE267442 and GSE280897 datasets confirmed that SLC2A9 is significantly downregulated in TNBC, further substantiating its critical role in TNBC metabolism (Figure 1G).
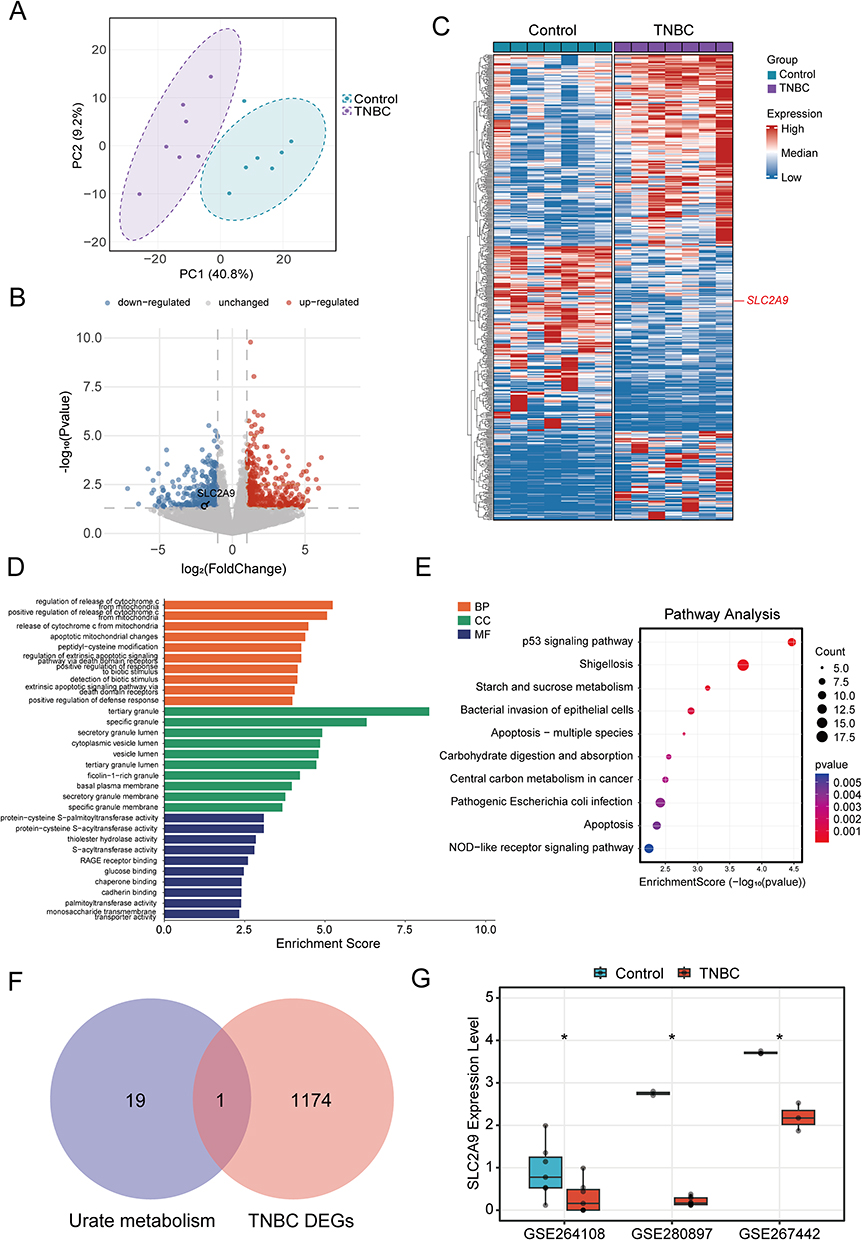 |
Figure 1 Differential Transcriptome Analysis of TNBC and Screening and Validation of SLC2A9. (A) Principal component analysis (PCA) of transcriptomic data from TNBC patients and healthy controls in the GSE264108 dataset. (B) Volcano plot of TNBC DEGs. Red dots represent upregulated genes, blue dots represent downregulated genes, and gray dots represent genes with no significant expression changes. (C) Heatmap of TNBC DEGs. (D) GO functional enrichment of DEGs. (E) KEGG pathway enrichment of DEGs. (F) Intersection of uric acid metabolism pathways and TNBC DEGs. (G) Validation of SLC2A9 expression across three independent clinical datasets (GSE264108, GSE280897, GSE267442). *: P < 0.05. |
SLC2A9 Expression in TNBC Cells
Based on analysis of the Cancer Cell Line Encyclopedia (https://sites.broadinstitute.org/ccle), we measured the relative expression levels of SLC2A9 in multiple TNBC cell lines using Western blotting (WB) and real-time quantitative PCR (RT-qPCR), with human normal mammary epithelial cells MCF 10A as the reference. We found that SLC2A9 was downregulated in most TNBC cells, such as SUM149PT and DU4475. In contrast, SUM159PT cells exhibited significantly higher expression levels than other TNBC cells (Figure 2A and B). Based on this, we established an overexpression model in SUM149PT cells and a knockdown model in SUM159PT cells. RT-qPCR validated the successful establishment of both models (Figure S1).
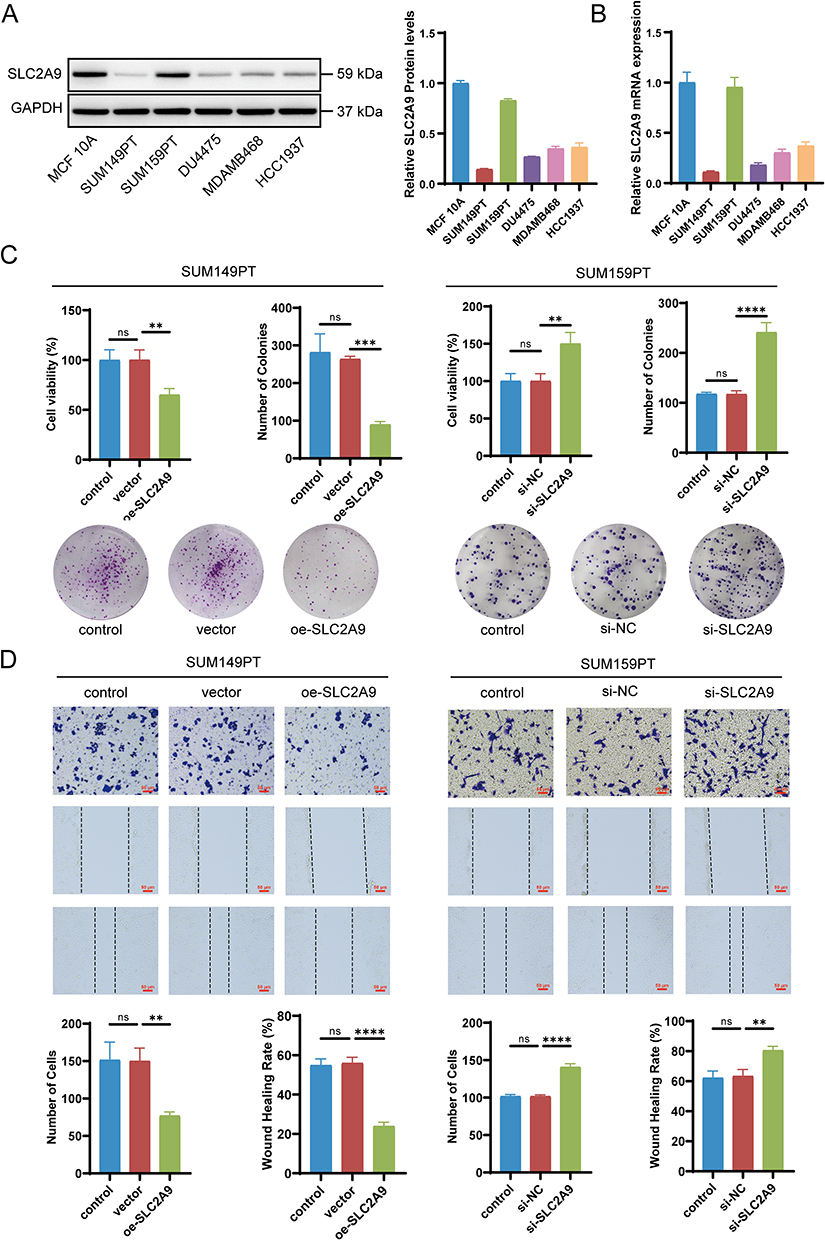 |
Figure 2 Expression of SLC2A9 in Breast Cell Lines and Its Functional Regulation of TNBC. (A) Western blot analysis of SLC2A9 protein expression in the normal human breast cell line MCF-10A and TNBC cell lines (SUM149PT, SUM159PT, DU4475, MDAMB468, HCC1937), with GAPDH as the internal control (n=3). (B) mRNA expression of SLC2A9 in the above cell lines (n=3). (C) CCK-8 assay and colony formation assay to assess TNBC cell proliferation and colony formation by SLC2A9 (n=3). (D) Cell scratch assay and Transwell assay evaluating the migratory ability of SUM149PT and SUM159PT cells with SLC2A9 overexpression or knockdown (n=3). **: P < 0.01, ***: P < 0.001, ****: P < 0.0001, ns: P > 0.05. |
SLC2A9 Negatively Regulates Proliferation, Invasion, and Migration in TNBC Cells
Figure 2C and D clearly demonstrates the regulatory role of SLC2A9 in TNBC cell proliferation, invasion, and migration. In SUM149PT cells, compared to the control and vector groups, oe-SLC2A9 significantly reduced cell viability and colony formation numbers (P<0.01), indicating marked inhibition of cell proliferation. Concurrently, the number of migrating cells and scratch healing rates were significantly downregulated (P<0.01), reflecting substantially diminished invasive and migratory capabilities. Conversely, in SUM159PT cells, compared to control and si-NC groups, si-SLC2A9 significantly increased cell viability and colony formation (P<0.01), while migration cell counts and wound healing rates also markedly rose (P<0.01). These results indicate that SLC2A9 expression levels are negatively correlated with the invasive and migratory phenotypes of TNBC cells. Overexpression of SLC2A9 suppresses TNBC cell activity and behavior, while knockdown enhances their progression.
SLC2A9 Regulates Apoptosis and UA Homeostasis in TNBC Cells
Flow cytometry apoptosis assays revealed that oe-SLC2A9 significantly increased apoptosis rates in SUM149PT cells (P<0.0001); while knocking down si-SLC2A9 in SUM159PT cells markedly decreased apoptosis (P<0.01) (Figure 3A). As SLC2A9 is a key UA transporter gene, regulating UA transport-related genes may influence intracellular and extracellular UA transport functions. Using a kit, we measured intracellular and extracellular UA levels in both cell lines. In SUM149PT cells, the oe-SLC2A9 group exhibited significantly elevated UA secretion levels (P<0.001) and significantly reduced intracellular UA levels (P<0.01) In SUM159PT cells, the si-SLC2A9 group exhibited significantly reduced extracellular UA levels (P<0.05) and significantly increased intracellular UA levels (P<0.05) (Figure 3B), consistent with the trend observed by Han et al in hepatocellular carcinoma cells.12 These findings demonstrate SLC2A9’s role in promoting apoptosis in TNBC cells and confirm its function as a UA transporter. SLC2A9 may suppress malignant phenotypes by increasing extracellular UA secretion, reducing intracellular UA accumulation, and thereby altering the tumor microenvironment.
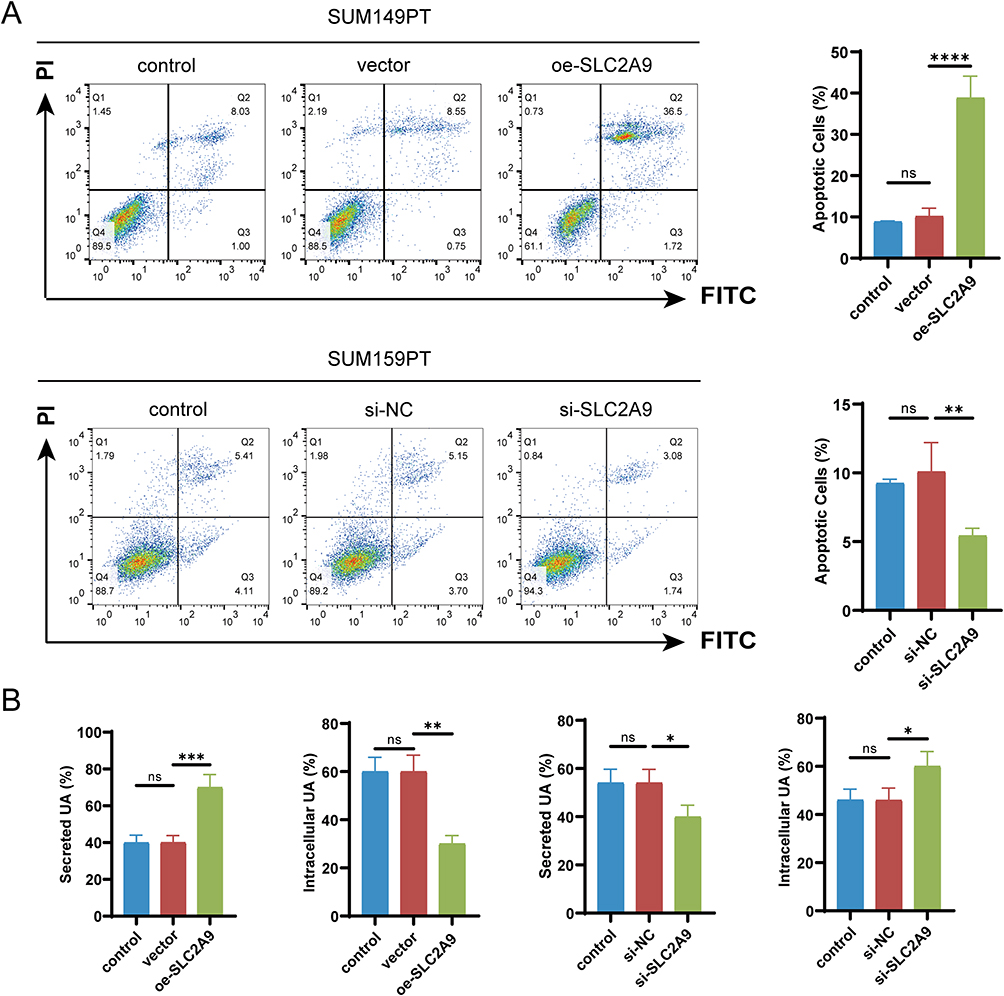 |
Figure 3 SLC2A9 Regulates Apoptosis and UA Homeostasis in TNBC Cells. (A) Flow cytometry analysis of cell apoptosis in SUM149PT and SUM159PT cells with SLC2A9 overexpression or knockdown (n=3). (B) Detection of intracellular and secreted UA levels in SUM149PT and SUM159PT cells with SLC2A9 overexpression or knockdown (n=3). *: P < 0.05, **: P < 0.01, ***: P < 0.001, ****: P < 0.0001, ns: P > 0.05. |
SLC2A9 Regulates Intracellular ROS Levels and Mitochondrial Membrane Potential in TNBC Cells
To investigate the effects of SLC2A9 on oxidative stress and mitochondrial function in triple-negative breast cancer cells, we conducted experiments in SUM149PT and SUM159PT cells. Flow cytometry results showed that in SUM149PT cells, the mean fluorescence intensity in the oe-SLC2A9 group was significantly higher than that in the control and vector groups (P < 0.0001), suggesting that SLC2A9 overexpression induces elevated intracellular ROS levels; In SUM159PT cells, the ROS fluorescence intensity in the si-SLC2A9 group was significantly lower than that in the control and si-NC groups (P < 0.001), indicating that SLC2A9 silencing reduces intracellular ROS levels (Figure 4A).
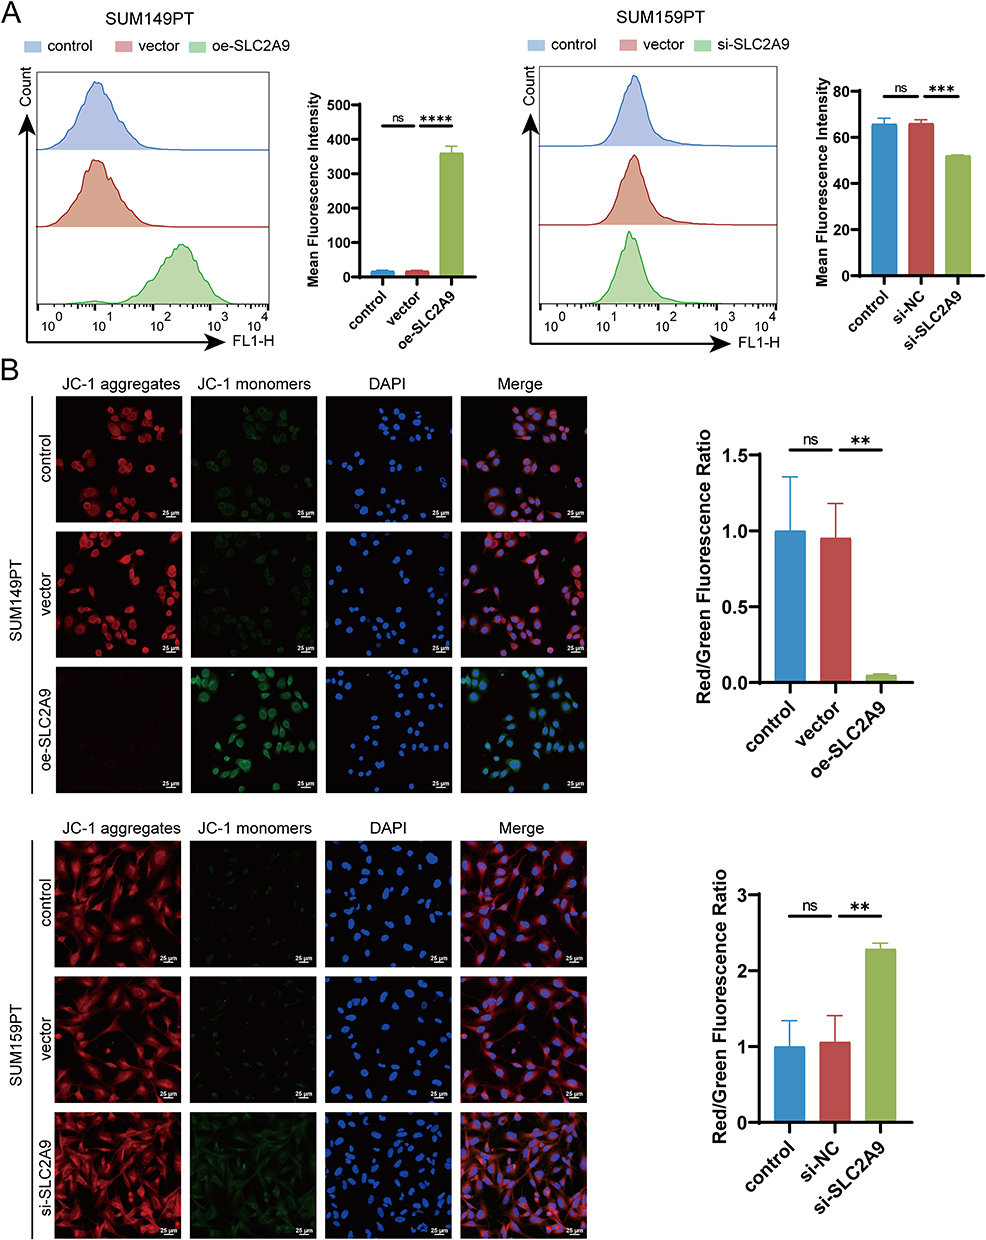 |
Figure 4 SLC2A9 Regulates ROS Levels and Changes in Mitochondrial Membrane Potential in TNBC Cells. (A) Flow cytometry analysis of intracellular ROS fluorescence intensity in SUM149PT and SUM159PT cells (n=3). (B) JC-1 immunofluorescence staining to detect mitochondrial membrane potential (ΔΨm): red fluorescence represents JC-1 polymers (normal mitochondria), green fluorescence represents JC-1 monomers (mitochondrial depolarization damage), and the membrane potential level is quantified by the red/green fluorescence ratio (n=3). **: P < 0.01, ***: P < 0.001, ****: P < 0.0001, ns: P > 0.05. |
JC-1 fluorescence staining results showed that in SUM149PT cells, the red/green fluorescence ratio in the oe-SLC2A9 group was significantly lower than that in the control group (P < 0.01), indicating that the mitochondrial membrane potential in the oe-SLC2A9 group was significantly reduced and the mitochondria were damaged; In SUM159PT cells, the red/green fluorescence ratio in the si-SLC2A9 group was significantly higher than that in the control group (**P < 0.01), indicating that SLC2A9 silencing improves mitochondrial membrane potential (Figure 4B). SLC2A9 can influence mitochondrial oxidative stress and damage by regulating uric acid homeostasis.
SLC2A9 Regulates Apoptosis - Related Proteins and UA Metabolism Pathway Proteins
Western blot analysis revealed that in SUM149PT cells, oe-SLC2A9 significantly increased the expression levels of the apoptosis-executing protein Caspase3 and the pro-apoptotic protein Bax (P<0.001), while the expression of the anti-apoptotic protein Bcl-2 was significantly reduced (P<0.001). In SUM159PT cells, si-SLC2A9 exhibited the opposite trend: Cleaved-Caspase3 and Bax expression were significantly reduced compared to the control group (P<0.0001), while Bcl-2 expression was significantly increased (P<0.0001). No significant differences were observed among the control groups (Figure 5A). This result was consistent with the flow cytometry apoptosis phenotype, confirming the molecular mechanism by which SLC2A9 promotes apoptosis in TNBC cells through regulating core proteins of the apoptosis pathway.
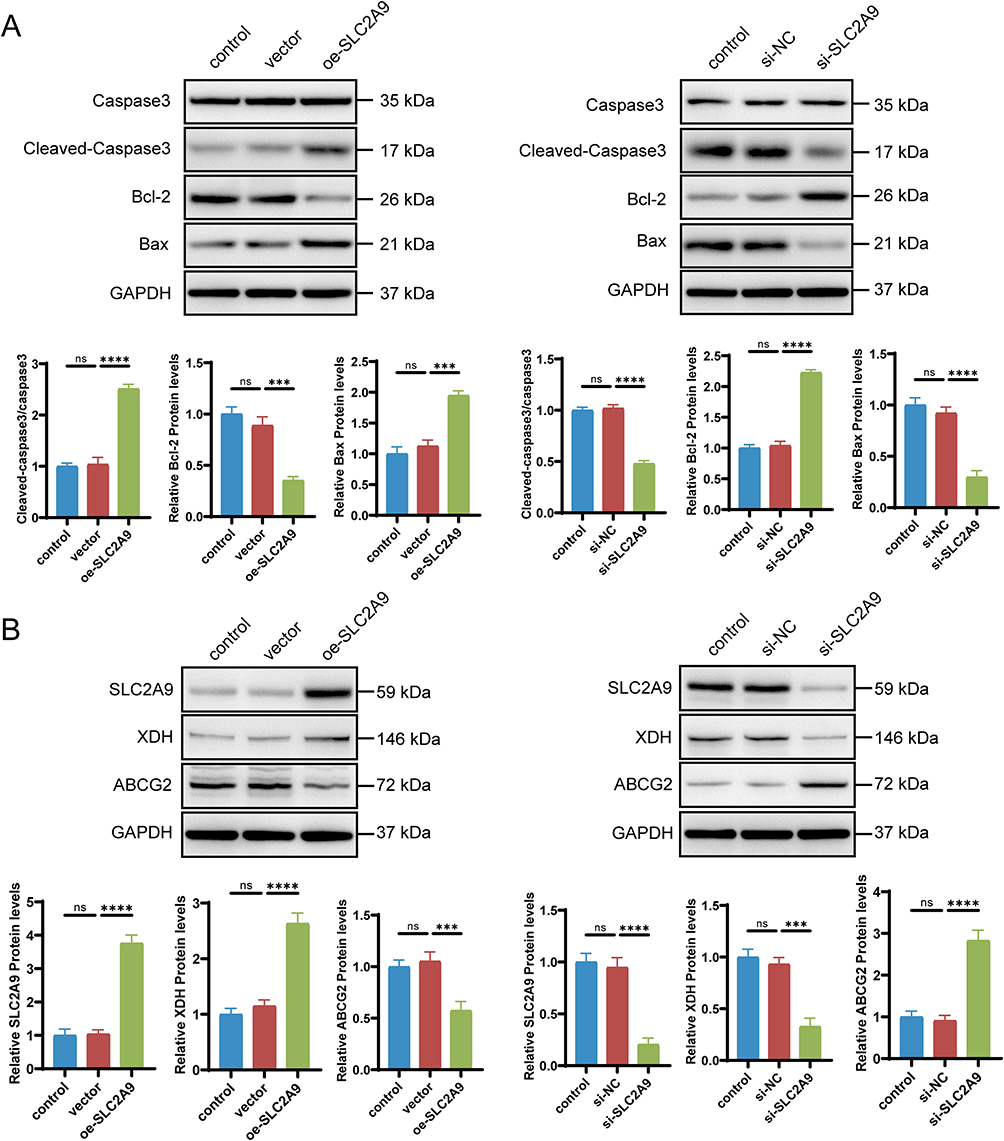 |
Figure 5 SLC2A9 Regulates Apoptosis and UA Metabolism Protein Expression in TNBC Cells. (A) Western blot analysis of the expression of apoptosis-related proteins (Caspase-3, Cleaved-Caspase-3, Bcl-2, Bax) in SUM149PT and SUM159PT cells with SLC2A9 overexpression or knockdown, GAPDH served as the internal reference (n=3). (B) Western blot analysis of the expression of uric acid metabolism‑associated proteins (XDH, ABCG2) in SUM149PT and SUM159PT cells with SLC2A9 overexpression or knockdown; GAPDH served as the internal reference (n=3). ***: P < 0.001, ****: P < 0.0001, ns: P > 0.05. |
Figure 5B further examined the expression of key proteins in the UA pathway. In SUM149PT cells, SLC2A9 overexpression upregulated the expression of xanthine dehydrogenase (XDH), a key enzyme in UA production, while simultaneously reducing the expression level of the breast cancer resistance protein ABCG2 (P<0.001). In SUM159PT cells, SLC2A9 knockdown resulted in significantly reduced XDH expression and markedly elevated ABCG2 expression (P<0.001). These findings suggest that SLC2A9 may counteract metabolic imbalance and suppress TNBC phenotypes by upregulating XDH and downregulating ABCG2 to compensate for intracellular UA loss.
Tumor - Suppressing Effect of SLC2A9 Depends on Its UA Transport Function
To determine whether the tumor-suppressing effect of SLC2A9 depends on its UA transport activity, this study treated cells with probenecid, a UA transport inhibitor and anti-gout medication. In SUM149PT cells, oe-SLC2A9 significantly reduced cell viability compared to the vector group (P<0.01). Adding probenecid to oe-SLC2A9 cells significantly restored cell viability compared to the oe-SLC2A9 group (P<0.05), indicating that probenecid reverses the inhibitory effect of SLC2A9 on cell viability (Figure 6A). UA level detection further validated transport function: after adding probenecid to oe-SLC2A9 cells, intracellular UA significantly increased while extracellular UA significantly decreased (P<0.01), confirming probenecid effectively blocked SLC2A9 UA transport activity (Figure 6B). Flow cytometry apoptosis analysis revealed significantly elevated apoptosis rates in the oe-SLC2A9 group, which were markedly reduced upon probenecid addition compared to the oe-SLC2A9 group (P<0.0001) (Figure 6C and D).
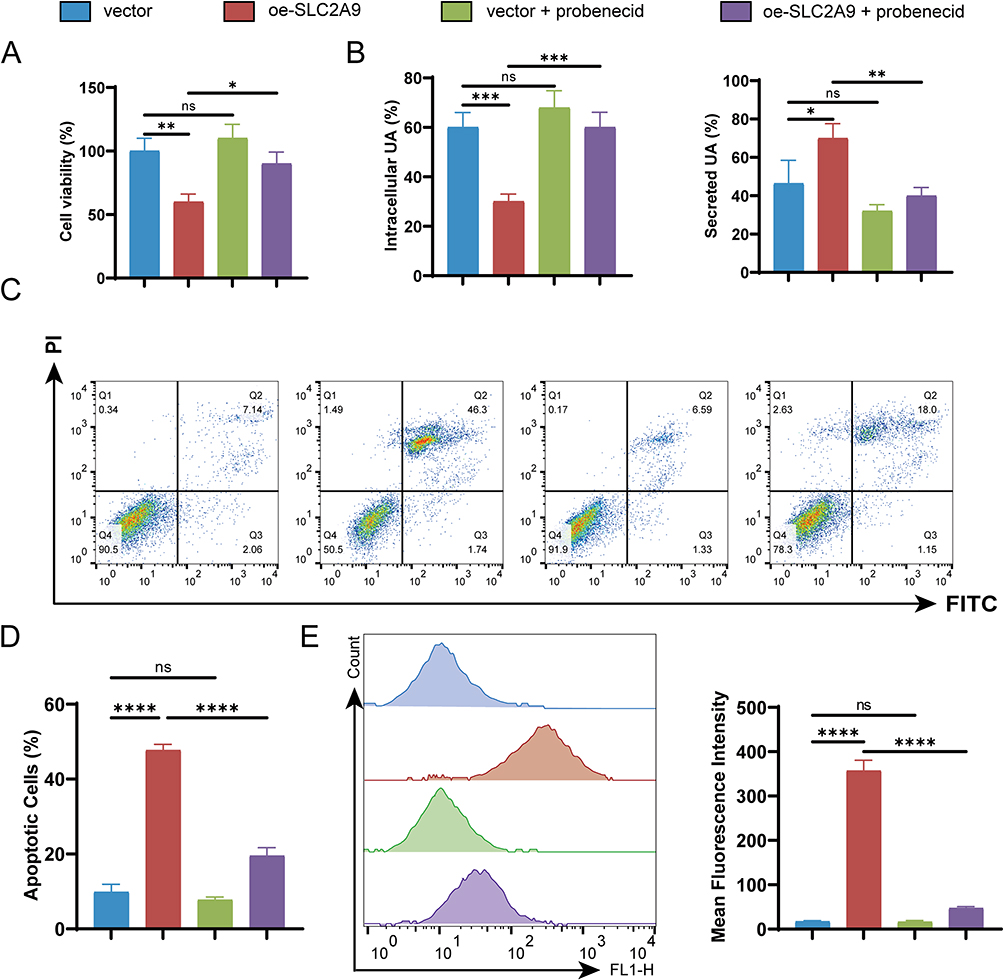 |
Figure 6 Probenecid reverses SLC2A9 overexpression-mediated disruption of uric acid homeostasis, decreased cell viability, and apoptosis activation. (A) CCK-8 assay assessing cell viability in cells overexpressing SUM149PT and treated with probenecid (n=3). (B) Measurement of intracellular uric acid and secreted uric acid in cell culture supernatant (n=3). (C) Flow cytometry analysis of apoptosis rates in cells overexpressing SUM149PT and treated with probenecid. (D) Flow Cytometry Apoptosis Analysis Chart (n=3). (E) Flow cytometry analysis of ROS levels in cells overexpressing SUM149PT and treated with probenecid (n=3). *: P < 0.05, **: P < 0.01, ***: P < 0.001, ****: P < 0.0001, ns: P > 0.05. |
ROS and JC-1 assays also demonstrated that the addition of probenecid to the oe-SLC2A9 group significantly reduced cellular ROS levels and mitochondrial membrane potential (P < 0.05), thereby reversing the damage caused by SLC2A9 overexpression (Figures 6E and 7A). Western blotting further corroborated this finding at the molecular level: SLC2A9, Cleaved-Caspase3, and Bax expression were significantly elevated in the oe-SLC2A9 group, while Bcl-2 expression was markedly reduced. In the oe-SLC2A9+probenecid group, the expression trends of these proteins were reversed (Figure 7B). In summary, the anticancer effect of SLC2A9 may regulate cell viability and apoptosis by influencing UA transport function in TNBC cells.
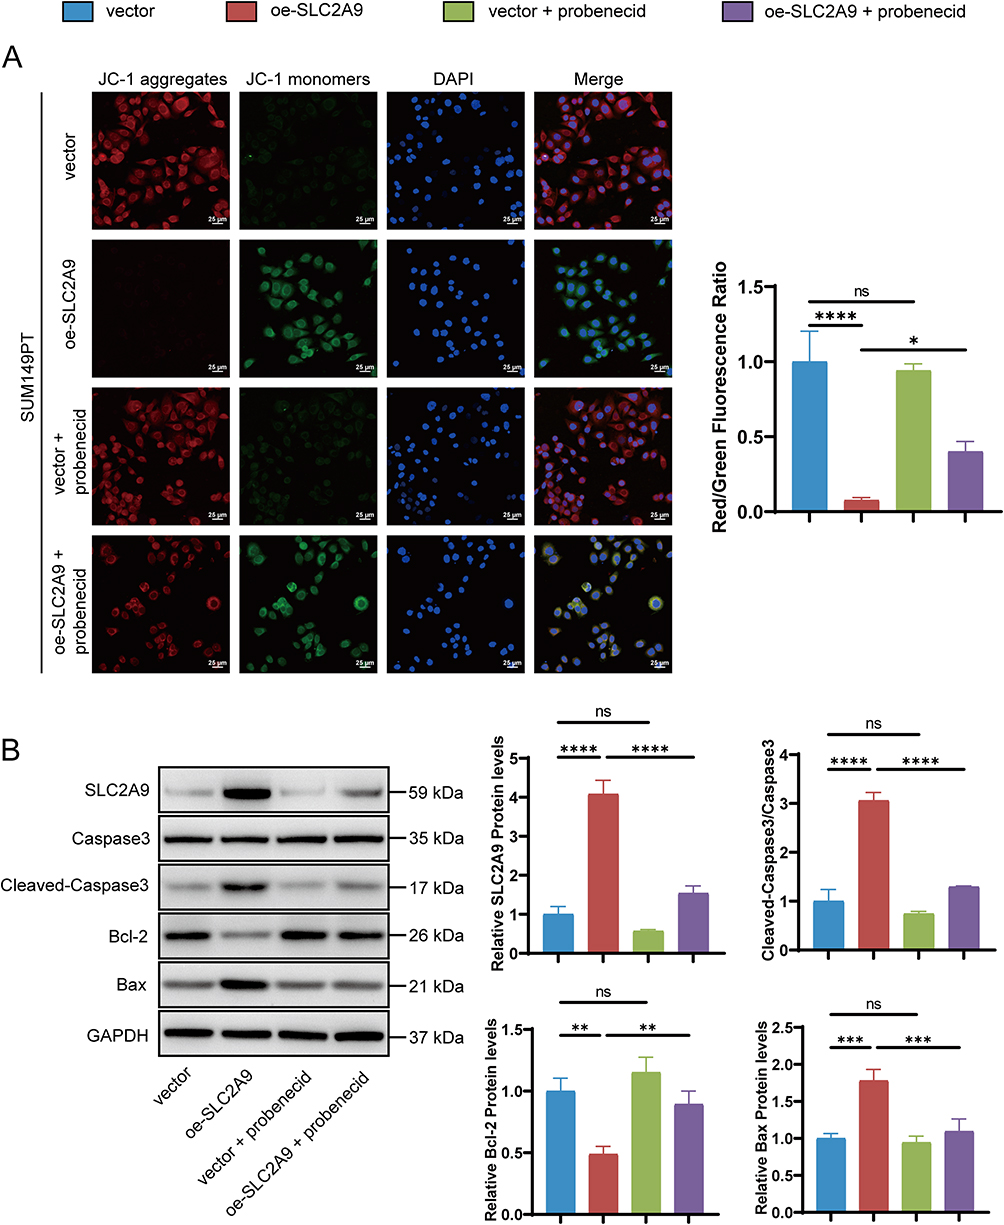 |
Figure 7 Probenecid rescues SLC2A9 overexpression-induced mitochondrial dysfunction and activation of mitochondrial apoptotic pathway in SUM149PT cells. (A) JC-1 Fluorescent Staining for Detecting Mitochondrial Membrane Potential (n=3). (B) Western blot analysis of the expression of apoptosis-related proteins (Caspase-3, Cleaved-Caspase-3, Bcl-2, Bax) in SUM149PT cells after different treatments; GAPDH served as the internal reference (n=3). *: P < 0.05, **: P < 0.01, ***: P < 0.001, ****: P < 0.0001, ns: P > 0.05. |
Discussion
Combining bioinformatic analysis and in vitro cellular experiments, this study systematically elucidates the biological function and underlying molecular mechanism of SLC2A9 in TNBC. Mechanistically, SLC2A9 disturbs intracellular uric acid transport and homeostasis, triggers aberrant oxidative stress, and consequently induces mitochondrial apoptosis of TNBC cells.
The tumor microenvironment is a complex system comprising tumor cells, immune cells, and the extracellular matrix.16 Metabolic reprogramming represents a core feature of malignant tumors, mediated by multiple factors including alterations in oncogenes, tumor suppressor genes, and growth factors.17 Tumor cells may interact with surrounding non-tumor cells through metabolic reprogramming, thereby promoting tumor cell proliferation and survival. In primates, UA is the final product of purine degradation, with approximately 70% excreted via the kidneys.18 Disrupted purine metabolism and UA homeostasis have been demonstrated as key drivers of tumor progression. Previous studies indicate that elevated serum UA correlates closely with increased risks of breast cancer, colorectal cancer, and other malignancies. Cellular oxidative stress manifests as the accumulation of reactive oxygen species, reactive nitrogen species, and other reactive substances exceeding the capacity of antioxidant defenses. While moderate oxidative stress aids in cellular signaling and homeostasis maintenance, excessive oxidative damage may trigger various pathological conditions. Therefore, cells rely on endogenous enzymes or exogenous antioxidants to counteract this stress.19 UA possesses dual redox activity: UA can scavenge ROS, exert antioxidant effects, and mitigate oxidative stress damage. The accumulation of intracellular UA enhances tumor cell survival by reducing oxidative stress damage in the tumor microenvironment. Conversely, insufficient intracellular UA leads to a burst of ROS, disrupting the redox homeostasis.5,6,20,21 However, for TNBC - a highly malignant subtype with limited therapeutic options - the regulatory mechanisms of UA metabolism and its association with tumor phenotypes remain unclear.
Intracellular UA, acting as a potent antioxidant, protects tumor cells from ROS damage under microenvironmental stresses such as hypoxia and inflammation.22,23 Three UA transporters - SLC22A12 (URAT1), SLC2A9 (GLUT9), and ABCG2 (BCRP)—have been reported to play crucial roles in serum UA regulation, with their dysfunction leading to impaired UA transport.8 GLUT9 as a high-capacity urate transporter, has been demonstrated to participate in systemic urate homeostasis regulation in humans and rodents.10,24–27 Concurrently, SLC2A9 expression is significantly downregulated in prostate cancer28 and hepatocellular carcinoma.29 In this study, SLC2A9 exhibited persistent underexpression across multiple TNBC patient datasets and cell lines, suggesting its suppression may confer a selective advantage to TNBC cells (Figure 1G, Figure 2A and B). In addition to environmental compensatory regulation, germline genetic variants may also be key upstream factors contributing to differences in the baseline expression of SLC2A9 and ABCG2 and in baseline uric acid metabolism among different TNBC cell lines. Jisha et al and Chihiro et al confirmed through germline sequencing of 192 clinical samples from Indian TNBC patients and 583 samples from Chinese women that 28.6% of Indian TNBC patients carry pathogenic germline mutations in DNA damage pathways such as BRCA1/2, compared to 7.7% in China.30,31 Such genetic variations can alter the basal transcription levels of uric acid transport-related genes through genomic transcriptional reprogramming, representing a major genetic source of metabolic phenotypic heterogeneity in TNBC. Our study reveals that SLC2A9 overexpression significantly elevates extracellular UA levels while reducing intracellular UA concentrations in TNBC cells, whereas SLC2A9 knockdown leads to intracellular UA accumulation (Figure 3B). This suggests SLC2A9 functions as a “UA efflux pump” in TNBC, enhancing tumor cell apoptosis sensitivity by depleting intracellular antioxidant reserves. Functional assays further demonstrated that SLC2A9 overexpression effectively suppressed TNBC cell proliferation, migration, and invasion (Figure 2C and D).
The mitochondrial apoptosis pathway is a core pathway regulating tumor cell fate. The balance between pro-apoptotic proteins (Bax) and anti-apoptotic proteins (Bcl-2) determines cellular survival status, while Caspase3 activation represents the final critical step in apoptosis execution. Western blot analysis revealed that SLC2A9 promotes TNBC cell apoptosis by activating the mitochondrial apoptosis pathway (Figure 4A). This may occur because SLC2A9 is a direct target gene of p53 (an apoptosis gene), and both are positively correlated in regulating cellular apoptosis.32 Combined with UA detection results, we hypothesize that SLC2A9-mediated intracellular UA depletion may disrupt redox balance in TNBC cells, triggering mitochondrial dysfunction and subsequently initiating apoptosis. This confirms that UA metabolism disorders can regulate mitochondrial apoptosis signaling in tumor cells.33 This effect is not a universal consequence of transporter overexpression, as demonstrated by the reversible nature of this effect upon treatment with the UA transport-specific inhibitor probenecid. In addition to mitochondrial apoptosis, redox dysregulation caused by uric acid imbalance could theoretically induce other forms of cell death, such as ferroptosis and senescence. The sustained elevation of ROS associated with intracellular uric acid depletion can easily lead to mitochondrial damage and lipid peroxidation, thereby initiating the ferroptosis process; DNA replication damage caused by chronic oxidative stress can also induce tumor cell senescence.34,35 This study focuses on mitochondrial damage and apoptotic phenotypes; the regulatory role of SLC2A9 in ferroptosis and senescence requires further investigation.
XDH is a key enzyme in UA biosynthesis, catalyzing the conversion of xanthine to UA.8 Under normal growth conditions, the triple-negative breast cancer (TNBC) cell line MDA-MB-231 does not exhibit detectable XDH/XOR expression.36 Furthermore, according to reports from several years ago, the use of rabbit polyclonal antibodies may result in nonspecific binding to XOR.37 We found that SLC2A9 overexpression upregulates XDH expression. Database analyses of DepMap and CCLE confirmed XDH mRNA expression in all five TNBC cell lines tested. Meanwhile, GEO datasets GSE267442 and GSE280897 showed significantly reduced XDH mRNA levels in TNBC tissues compared to normal controls, consistent with our findings. Such upregulation of XDH may represent a compensatory mechanism to maintain metabolic balance following increased uric acid efflux. In contrast, ABCG2, as the breast cancer resistance protein, is closely associated with TNBC chemotherapy resistance and has been demonstrated to possess UA transport function. We observed a negative correlation between SLC2A9 and ABCG2 expression, suggesting that SLC2A9 may synergistically regulate UA homeostasis and the TNBC resistance phenotype with ABCG2 (Figure 4B). Given that ABCG2 overexpression confers resistance to chemotherapy drugs such as paclitaxel and doxorubicin in breast cancer cells,38 SLC2A9-mediated downregulation of ABCG2 suggests potential value in reversing TNBC drug resistance. This hypothesis warrants further validation through subsequent experiments.
The low expression of SLC2A9 in TNBC tissues and its association with an invasive cellular phenotype suggest its potential as a prognostic biomarker. SLC2A9 can enhance uric acid transport in TNBC cells or selectively promote TNBC cell apoptosis sensitivity. However, this study has certain limitations. The research is primarily based on in vitro cell experiments. Although it has preliminarily elucidated the mechanism of action of SLC2A9, the lack of in vivo models prevents the evaluation of the specific effects of the SLC2A9 - UA metabolism pathway. At the same time, a small sample size can also limit the reliability of the research findings. Future work will include larger clinical cohorts and in vivo animal experiments to further verify the clinical significance and molecular mechanism of SLC2A9 in TNBC progression.
Conclusion
In summary, our study found that in TNBC, the uric acid transporter SLC2A9 inhibits the proliferation and migration of TNBC cells, induces apoptosis by regulating apoptosis-related proteins and intracellular and extracellular uric acid homeostasis, and modulates the uric acid metabolism-related protein XDH and the transporter ABCG2. These findings reveal the regulatory role of SLC2A9 in the progression of TNBC and provide a potential molecular target for therapeutic interventions.
Data Sharing Statement
Data will be made available upon reasonable request to the corresponding author.
Ethical Approval
This study analyzed only publicly available, anonymized human transcriptomic datasets (GSE264108, GSE267442, GSE280897) and did not involve the collection of clinical samples or human intervention experiments. According to Items 1 and 2 of Article 32 of the Measures for the Ethical Review of Life Science and Medical Research Involving Human Subjects (issued by the National Health Commission of China, effective February 18, 2023), research using legally obtained public data and anonymized information data that causes no harm to human subjects, involves no sensitive personal information or commercial interests is exempt from ethical review. Thus, ethical approval from our institutional review board (IRB) was not required for this study.
Author Contributions
All authors made significant contributions to this study. Specifically, Peng Chen was responsible for conceptualization, data curation, formal analysis, and writing the original draft; Jiapeng Xu was responsible for conceptualization, data curation, and funding acquisition; and Yulong Liang was responsible for project administration and supervision. This includes the conception of the study, experimental design, study implementation, data acquisition, and analysis and interpretation, or participation in all of the aforementioned aspects; Jinghui Mu was responsible for investigation and validation; Wenjing Feng was responsible for investigation and writing (review and editing); Jiaming Liu was responsible for methodology and resources; Bolun Li was responsible for software, investigation, and validation. All authors made a significant contribution to the work reported, whether that is in the conception, study design, execution, acquisition of data, analysis and interpretation, or in all these areas; took part in drafting, revising or critically reviewing the article; gave final approval of the version to be published; have agreed on the journal to which the article has been submitted; and agree to be accountable for all aspects of the work.
Funding
The authors disclosed receipt of the following financial support for the research, authorship, and/or publication of this article: This work was supported by a grant from the Special Program for Talent Introduction and Training of the Hebei Provincial Department of Science and Technology.
Disclosure
The authors report no conflicts of interest in this work.
References
1. Chen K, Wu Y, Xu L, Wang C, Xue J. Identification of the metabolic protein ATP5MF as a potential therapeutic target of TNBC. J Transl Med. 2024;22(1):932. doi:10.1186/s12967-024-05692-9
2. Verma A, Singh A, Singh MP, et al. EZH2-H3K27me3 mediated KRT14 upregulation promotes TNBC peritoneal metastasis. Nat Commun. 2022;13(1):7344. doi:10.1038/s41467-022-35059-x
3. Huang M, Zhang Y, Chen Z, et al. Gut microbiota reshapes the TNBC immune microenvironment: emerging immunotherapeutic strategies. Pharmacol Res. 2025;215:107726. doi:10.1016/j.phrs.2025.107726
4. Ren X, Cheng Z, He J, et al. Inhibition of glycolysis-driven immunosuppression with a nano-assembly enhances response to immune checkpoint blockade therapy in triple negative breast cancer. Nat Commun. 2023;14(1):7021. doi:10.1038/s41467-023-42883-2
5. Allegrini S, Garcia-Gil M, Pesi R, Camici M, Tozzi MG. The good, the bad and the new about uric acid in cancer. Cancers. 2022;14(19):4959. doi:10.3390/cancers14194959
6. Fini MA, Elias A, Johnson RJ, Wright RM. Contribution of uric acid to cancer risk, recurrence, and mortality. Clin Transl Med. 2012;1(1):16. doi:10.1186/2001-1326-1-16
7. Li Z, Su Y, Su H, et al. Serum uric acid and its metabolism-a vital factor in the inflammatory transformation of cancer. J Adv Res. 2025.
8. Maiuolo J, Oppedisano F, Gratteri S, Muscoli C, Mollace V. Regulation of uric acid metabolism and excretion. Int J Cardiol. 2016;213:8–17. doi:10.1016/j.ijcard.2015.08.109
9. Caulfield MJ, Munroe PB, O’Neill D, et al. SLC2A9 is a high-capacity urate transporter in humans. PLoS Med. 2008;5(10):e197. doi:10.1371/journal.pmed.0050197
10. Preitner F, Laverriere-Loss A, Metref S, et al. Urate-induced acute renal failure and chronic inflammation in liver-specific Glut9 knockout mice. Am J Physiol Renal Physiol. 2013;305(5):F786–795. doi:10.1152/ajprenal.00083.2013
11. Long W, Panigrahi R, Panwar P, et al. Identification of key residues for urate specific transport in human glucose transporter 9 (hSLC2A9). Sci Rep. 2017;7:41167. doi:10.1038/srep41167
12. Han X, Yang J, Li D, Guo Z. Overexpression of uric acid transporter SLC2A9 inhibits proliferation of hepatocellular carcinoma cells. Oncol Res. 2019;27(5):533–540. doi:10.3727/096504018X15199489058224
13. Nie Q, Liu M, Zhang Z, Zhang X, Wang C, Song G. The effects of hyperuricemia on endothelial cells are mediated via GLUT9 and the JAK2/STAT3 pathway. Mol Biol Rep. 2021;48(12):8023–8032. doi:10.1007/s11033-021-06840-w
14. Kalalinia F, Elahian F, Mosaffa F, Behravan J. Celecoxib up regulates the expression of drug efflux transporter ABCG2 in breast cancer cell lines. Iran J Pharm Res World. 2014;13(4):1393–1401.
15. Huo Q, Yuan J, Zhu T, Li Z, Xie N. A combined bioinformatic and nanoparticle-based study reveal the role of ABCG2 in the drug resistant breast cancer. Recent Patents Anti-Cancer Drug Disc. 2021;16(3):393–406. doi:10.2174/1574892816666210218220531
16. Liu S, Zhang X, Wang W, et al. Metabolic reprogramming and therapeutic resistance in primary and metastatic breast cancer. Mol Cancer. 2024;23(1):261. doi:10.1186/s12943-024-02165-x
17. Nong S, Han X, Xiang Y, et al. Metabolic reprogramming in cancer: mechanisms and therapeutics. MedComm. 2023;4(2):e218. doi:10.1002/mco2.218
18. Vitetta L, Gobe G. Uremia and chronic kidney disease: the role of the gut microflora and therapies with pro- and prebiotics. Mol Nutr Food Res. 2013;57(5):824–832. doi:10.1002/mnfr.201200714
19. Liu H, Jiao Y, Wang PC, et al. Oxidative stress and antioxidant therapeutic mechanisms. Pharmacol Ther. 2026;278:108962.
20. Xue X, Sun Z, Ji X, Lin H, Jing H, Yu Q. Associations between serum uric acid and breast cancer incidence: a systematic review and meta-analysis. Am J Med Sci. 2024;368(6):610–620. doi:10.1016/j.amjms.2024.07.005
21. Zhuang C, Liu Y, Gu R, Du S, Long Y. Prognostic signature of colorectal cancer based on uric acid-related genes. Heliyon. 2023;9(12):e22587. doi:10.1016/j.heliyon.2023.e22587
22. Domínguez-Zambrano E, Pedraza-Chaverri J, López-Santos AL, et al. Association between serum uric acid levels, nutritional and antioxidant status in patients on hemodialysis. Nutrients. 2020;12(9):2600. doi:10.3390/nu12092600
23. Wu W, Dnyanmote AV, Nigam SK. Remote communication through solute carriers and ATP binding cassette drug transporter pathways: an update on the remote sensing and signaling hypothesis. Mol Pharmacol. 2011;79(5):795–805. doi:10.1124/mol.110.070607
24. Matsushita D, Toyoda Y, Lee Y, et al. Structural basis of urate transport by glucose transporter 9. Cell Rep. 2025;44(4):115514. doi:10.1016/j.celrep.2025.115514
25. Ying Y, Zhang Y, Sun J, Chen Y, Wu H. Mechanism of intestinal flora affecting SLC2A9 transport function to promote the formation of hyperuricemia. Heliyon. 2024;10(23):e40597. doi:10.1016/j.heliyon.2024.e40597
26. Auberson M, Stadelmann S, Stoudmann C, et al. SLC2A9 (GLUT9) mediates urate reabsorption in the mouse kidney. Pflugers Archiv. 2018;470(12):1739–1751. doi:10.1007/s00424-018-2190-4
27. Toyoda Y, Cho SK, Tasic V, et al. Identification of a dysfunctional exon-skipping splice variant in GLUT9/SLC2A9 causal for renal hypouricemia type 2. Front Genetics. 2022;13:1048330. doi:10.3389/fgene.2022.1048330
28. Huang H, Song S, Liu W, et al. Expressions of glucose transporter genes are diversely attenuated and significantly associated with prostate cancer progression. Am J Clin Exp Urol. 2023;11(6):578–593.
29. Han L, Jia X, Abuduwaili W, et al. Identification of prognostic miRNA-mRNA regulatory network in the progression of HCV-associated cirrhosis to hepatocellular carcinoma. Transl Cancer Res. 2022;11(10):3657–3673. doi:10.21037/tcr-22-989
30. John J, Bapat A, Gahlaut S, et al. Assessing germline mutational profile and its clinicopathological associations in triple negative breast cancer. Cancer Genetics. 2025;296-297:65–75. doi:10.1016/j.cancergen.2025.06.004
31. Hata C, Nakaoka H, Xiang Y, et al. Germline mutations of multiple breast cancer-related genes are differentially associated with triple-negative breast cancers and prognostic factors. J Human Genetics. 2020;65(7):577–587. doi:10.1038/s10038-020-0729-7
32. Itahana Y, Han R, Barbier S, Lei Z, Rozen S, Itahana K. The uric acid transporter SLC2A9 is a direct target gene of the tumor suppressor p53 contributing to antioxidant defense. Oncogene. 2015;34(14):1799–1810. doi:10.1038/onc.2014.119
33. Deng Y, Liu F, Yang X, Xia Y. The key role of uric acid in oxidative stress, inflammation, fibrosis. Apoptosis Immun Pathogene Atrial Fibrillation Front Cardiovasc Med. 2021;8:641136.
34. Bipasha M, Deepali V, Prabal D, Supriya K, Megha B. Ferroptosis: a mechanism of cell death with potential scope in cancer therapy. Asia-Pac J Clini Oncol. 2025;21(5):465–473. doi:10.1111/ajco.14172
35. Ray SK, Mukherjee S. Exploring replication stress and cellular senescence as key targets in novel cancer therapies. Cancer Genetics. 2025;298-299:78–87. doi:10.1016/j.cancergen.2025.09.002
36. Chapa MG, King RD, Dean ZW, et al. Xanthine oxidoreductase expression is diminished in breast cancer as a response to uric acid mediated chelation of redox active iron. Free Radic Biol Med. 2025;238:329–343. doi:10.1016/j.freeradbiomed.2025.06.019
37. Clare DA, Lecce JG. Copurification of bovine milk xanthine oxidase and immunoglobulin. Arch Biochem Biophys. 1991;286(1):233–237. doi:10.1016/0003-9861(91)90034-G
38. Zhang J, Hu J, Li W, et al. Rapamycin antagonizes BCRP-mediated drug resistance through the PI3K/Akt/mTOR signaling pathway in mPRα-positive breast cancer. Front Oncol. 2021;11:608570. doi:10.3389/fonc.2021.608570
 © 2026 The Author(s). This work is published and licensed by Dove Medical Press Limited. The
full terms of this license are available at https://www.dovepress.com/terms
and incorporate the Creative Commons Attribution
- Non Commercial (unported, 4.0) License.
By accessing the work you hereby accept the Terms. Non-commercial uses of the work are permitted
without any further permission from Dove Medical Press Limited, provided the work is properly
attributed. For permission for commercial use of this work, please see paragraphs 4.2 and 5 of our Terms.
© 2026 The Author(s). This work is published and licensed by Dove Medical Press Limited. The
full terms of this license are available at https://www.dovepress.com/terms
and incorporate the Creative Commons Attribution
- Non Commercial (unported, 4.0) License.
By accessing the work you hereby accept the Terms. Non-commercial uses of the work are permitted
without any further permission from Dove Medical Press Limited, provided the work is properly
attributed. For permission for commercial use of this work, please see paragraphs 4.2 and 5 of our Terms.