")
Back to Journals » International Journal of Chronic Obstructive Pulmonary Disease » Volume 12
Size variation and collapse of emphysema holes at inspiration and expiration CT scan: evaluation with modified length scale method and image co-registration
Authors Oh SY, Lee M , Seo JB , Kim N , Lee SM , Lee JS , Oh YM
Received 12 December 2016
Accepted for publication 13 April 2017
Published 13 July 2017 Volume 2017:12 Pages 2043—2057
DOI https://doi.org/10.2147/COPD.S130081
Checked for plagiarism Yes
Review by Single anonymous peer review
Peer reviewer comments 2
Editor who approved publication: Dr Richard Russell
Sang Young Oh,1,* Minho Lee,1,* Joon Beom Seo,1,* Namkug Kim,1,2,* Sang Min Lee,1 Jae Seung Lee,3 Yeon Mok Oh3
1Department of Radiology, 2Department of Convergence Medicine, 3Department of Pulmonology, University of Ulsan College of Medicine, Asan Medical Center, Seoul, Republic of Korea
*These authors contributed equally to this work
Abstract: A novel approach of size-based emphysema clustering has been developed, and the size variation and collapse of holes in emphysema clusters are evaluated at inspiratory and expiratory computed tomography (CT). Thirty patients were visually evaluated for the size-based emphysema clustering technique and a total of 72 patients were evaluated for analyzing collapse of the emphysema hole in this study. A new approach for the size differentiation of emphysema holes was developed using the length scale, Gaussian low-pass filtering, and iteration approach. Then, the volumetric CT results of the emphysema patients were analyzed using the new method, and deformable registration was carried out between inspiratory and expiratory CT. Blind visual evaluations of EI by two readers had significant correlations with the classification using the size-based emphysema clustering method (r-values of reader 1: 0.186, 0.890, 0.915, and 0.941; reader 2: 0.540, 0.667, 0.919, and 0.942). The results of collapse of emphysema holes using deformable registration were compared with the pulmonary function test (PFT) parameters using the Pearson’s correlation test. The mean extents of low-attenuation area (LAA), E1 (<1.5 mm), E2 (<7 mm), E3 (<15 mm), and E4 (≥15 mm) were 25.9%, 3.0%, 11.4%, 7.6%, and 3.9%, respectively, at the inspiratory CT, and 15.3%, 1.4%, 6.9%, 4.3%, and 2.6%, respectively at the expiratory CT. The extents of LAA, E2, E3, and E4 were found to be significantly correlated with the PFT parameters (r=−0.53, −0.43, −0.48, and −0.25), with forced expiratory volume in 1 second (FEV1; −0.81, −0.62, −0.75, and −0.40), and with diffusing capacity of the lungs for carbon monoxide (cDLco), respectively. The fraction of emphysema that shifted to the smaller subgroup showed a significant correlation with FEV1, cDLco, forced expiratory flow at 25%–75% of forced vital capacity, and residual volume (RV)/total lung capacity (r=0.56, 0.73, 0.40, and −0.58). A detailed assessment of the size variation and collapse of emphysema holes may be useful for understanding the dynamic collapse of emphysema and its functional relation.
Keywords: chronic obstructive pulmonary disease, computed tomography, emphysema size, length scale analysis, quantitative imaging, emphysema size change
Introduction
Emphysema is defined by the American Thoracic Society (ATS) as an abnormal and permanent expansion of air spaces distal to the terminal bronchiole, accompanied by the demolition of their walls and without obvious fibrosis.1,2 The accurate diagnosis and quantification of pulmonary emphysema in vivo are important for understanding the natural history, assessing the extent of the disease, and monitoring therapy.3 Computed tomography (CT) has been reported to be a sensitive technique for validating the presence and severity of emphysema.4,5 It is apparent that the measurement of CT attenuation values can help quantify the extent of emphysema.6 Intensity-based quantification computes all regions of low attenuation (eg, <−950 Hounsfield units [HU], or falling within a given range of attenuations considered emphysematous),7,8 but can be affected by different inspiration levels9 and does not necessarily always reflect the characteristic morphologic variance seen in pulmonary emphysema.
The size and shape of emphysema have individual variability. Assessing the size of emphysema holes may be needed to explain disease progression, in addition to density-based quantification. Before the size-based emphysema clusters are quantified, the power law D needs to be known. The concept of fractal theory was developed to quantitatively present random variations in shape and size seen in natural structure.10 A fractal structure is said to be scale invariant because its properties are free under isotropic transformations. If the structure is formed by similar parts to the whole structure, the scale-free approach can be performed. In other words, fractals are self-similar and thus are characterized by power law functions (D) and a dimension called fractal dimension D.11 To quantify the size of holes in emphysema clusters, several researchers used the slope of the log–log plot of the cumulative frequency-size distributions of % low-attenuation area (%LAA) −950 HU. %LAAs of normal smokers have lower D values compared with nonsmokers, suggesting that the D value could be a sensitive approach for detecting early emphysema.11,12 The D value, however, does not correlate with the macroscopic or microscopic indices of emphysema,13 and is not intuitive to interpretation with a clinical purpose. In addition, change in the holes of emphysema clusters has not been reported during respiration. Image registration is the only problem-solving method that might be used to observe variances in the emphysema holes based on the dissimilarity in respiration.
To overcome this problem, a novel means of measuring and classifying emphysema holes was developed using the length scale and co-registration methods. Using this new method, emphysema clusters were subdivided into four groups and the changes in the size of emphysema clusters between inspiration and expiration CT were assessed. It was hypothesized that the classification of emphysema holes may independently contribute to the obstacle of pulmonary function. In addition, the size change of emphysema holes at inspiratory and expiratory CT was evaluated by combining image co-registration and size evaluation.
Patients and methods
Ethics statement
This study was approved by the Asan Medical Center Institutional Review Board (approval no 2005-0345), and each patient provided written informed consent. The study subjects were selected from the Korean Obstructive Lung Disease (KOLD) cohort.
Study subjects
The study subjects were selected from the KOLD cohort to meet the following criteria:
- patients from the same hospital, with the same type of CT scanner installed;
- patients with available CT and PFT data; and
- no parenchymal abnormality occupying more than one lobe due to another disease.
A total of 72 patients (66 men, 6 women) with an average age of 63.6 years (range 45–79 years) who were enrolled in the KOLD cohort at Asan Medical Center between June 2005 and August 2011 were included randomly in this study. Inclusion criteria for the KOLD cohort are described elsewhere.14 For only 30 of 72 patients visual scoring was carried out by the emphysema size quantification method and clinical validations were performed for all the 72 patients.
CT acquisition
Volumetric CT scans were acquired for all the patients, using 16 multidetector CT scanners (Somatom Sensation 16; Siemens Healthcare, Erlangen, Germany). The CT parameters used in each CT scanner were as follows: 100 effective mAs, 140 kVp, 1 and 0.75 second per rotation pitch, 16×0.75 mm collimation, 0.75 mm slice thickness, and 0.75 mm increments. The patients were scanned during attached full inspiratory and expiratory respiration in the supine position, from the thoracic gate to the lung base. The acquired data were reconstructed using the standard kernel (B30f). The effective dose of the CT protocol was ~11 mSv. Image data were stored in the Digital Imaging and Communications in Medicine format, which is the international standard protocol.
Development of emphysema size quantification approach
Overall procedure
The overall procedure for the emphysema size quantification approach using three-dimensional (3D) volumetric chest CT images is presented in Figure 1. It was assumed that the emphysema lesions would demonstrate an approximately spherical shape. To classify the sizes of the emphysematous regions, 3D volumetric chest CT images were segmented using typical morphological operators such as dilation, erosion, and regional growth.15,16 After creating the lung segmentation mask without major airways, the emphysema mask was extracted at <−950 HU to locate the emphysematous regions that resulted from the dissolved alveolar septum, and then a noise reduction algorithm was used on the emphysema mask.17 Finally, Gaussian filtering using various kernel sizes (large to small) was iteratively applied in a length scale manner.18 For each iteration, the number of pixels of a given density (eg, the global maximum density) was selected and expanded according to the actual size of the emphysematous regions using a morphological dilation operator with half the kernel size. The dilated mask was allowed to be intersected with the emphysema mask and was subtracted from the noise-reduced mask for the next iteration.19 Detailed explanation is provided in the Supplementary material.
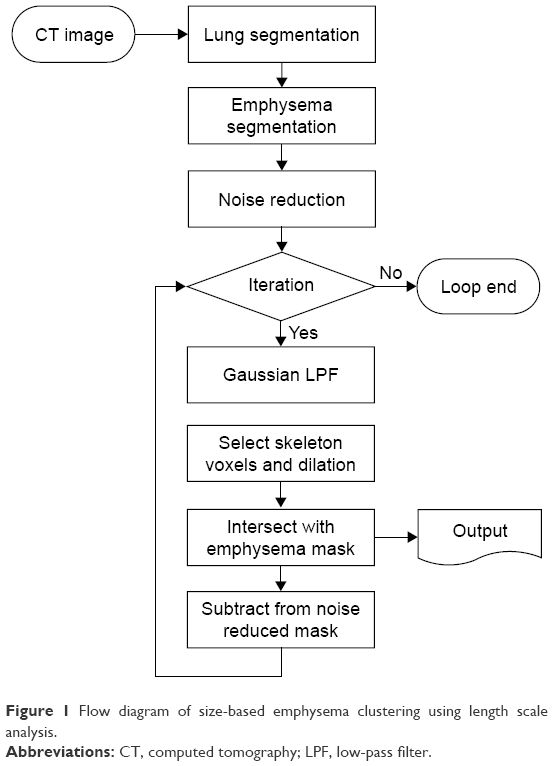 | Figure 1 Flow diagram of size-based emphysema clustering using length scale analysis. |
Lung and emphysema segmentation
A traditional technique of lung segmentation was implemented using in-house software based on the approach developed by Hu et al.15,19 To quantify the size of emphysematous regions, emphysematous regions should be distinguished from the other regions. To enable classification, a LAA mask was applied to voxels with a density <−950 HU, and emphysema indices were assigned to the binary marking of the mask.15
Noise reduction
Noise reduction was carried out to reduce noise on clusters of <2 voxels on the mask of the emphysema index (EI), and accurately distinguish emphysematous regions.19
Gaussian low-pass filtering
The proposed quantification approach was designed to analyze the physical features of emphysema on 3D volumetric chest CT of different length scales.19 Considering the anatomy of the alveolus and the secondary pulmonary lobule, 1.5, 7, and 15 mm were selected as the threshold values for classifying the emphysematous regions consisting of four subregions defined as specific sizes (<1.5, <7, <15, and >15 mm). Areas <1.5 mm were presumed to be noise, alveoli, or small emphysema. Regions between 1.5 and 7 mm were considered as subacinus. Regions with 7–15 mm size were defined as acinus or sublobular, and the regions >15 mm were considered extra-lobular. Furthermore, a Gaussian kernel corresponding to the specific sizes was designed, and then low-pass filtering was applied to the mask with noise reduction. To differentiate the exact size of each emphysematous area, the σ values of a Gaussian kernel were estimated from Equation 1, using a regression method and a sphere of a known size:
| (1) |
where β0 and β1 (0.147 and 0.1038, respectively) are model parameters while σγ is the radius of a sphere and the estimated σ values for the given γ.
Selection of skeleton voxels after Gaussian low-pass filtering and dilation
After the Gaussian low-pass filtering, the voxels without a density variance in the filtered image were defined as skeleton voxels. These skeleton voxels were marked “1” if the density value of the filtered image is the same as the given maximum density, and were marked 0 otherwise. The mask with skeleton voxels was dilated by specific ranges of emphysematous regions. The mask with dilated voxel radii was regarded as a new mask having only a specific range of emphysematous regions. This emphysema mask corresponding to a specific size was crossed with the emphysema mask to preserve EI.
Iterative size-based emphysema differentiation
This intersected mask with emphysema mask was considered an emphysema mask without a specific size. Once an emphysema mask for a specific size was defined, the process of subtracting the dilated mask from the emphysema mask was iterated until all of the kernel sizes, from large to small (>15, <15, <7, and <1.5 mm), were used. Figure 2 shows the results of the application of the described approach to 3D volumetric chest CT images. A pseudo-code (Supplementary material) was utilized for the implementation of the size-based quantification method for emphysema.
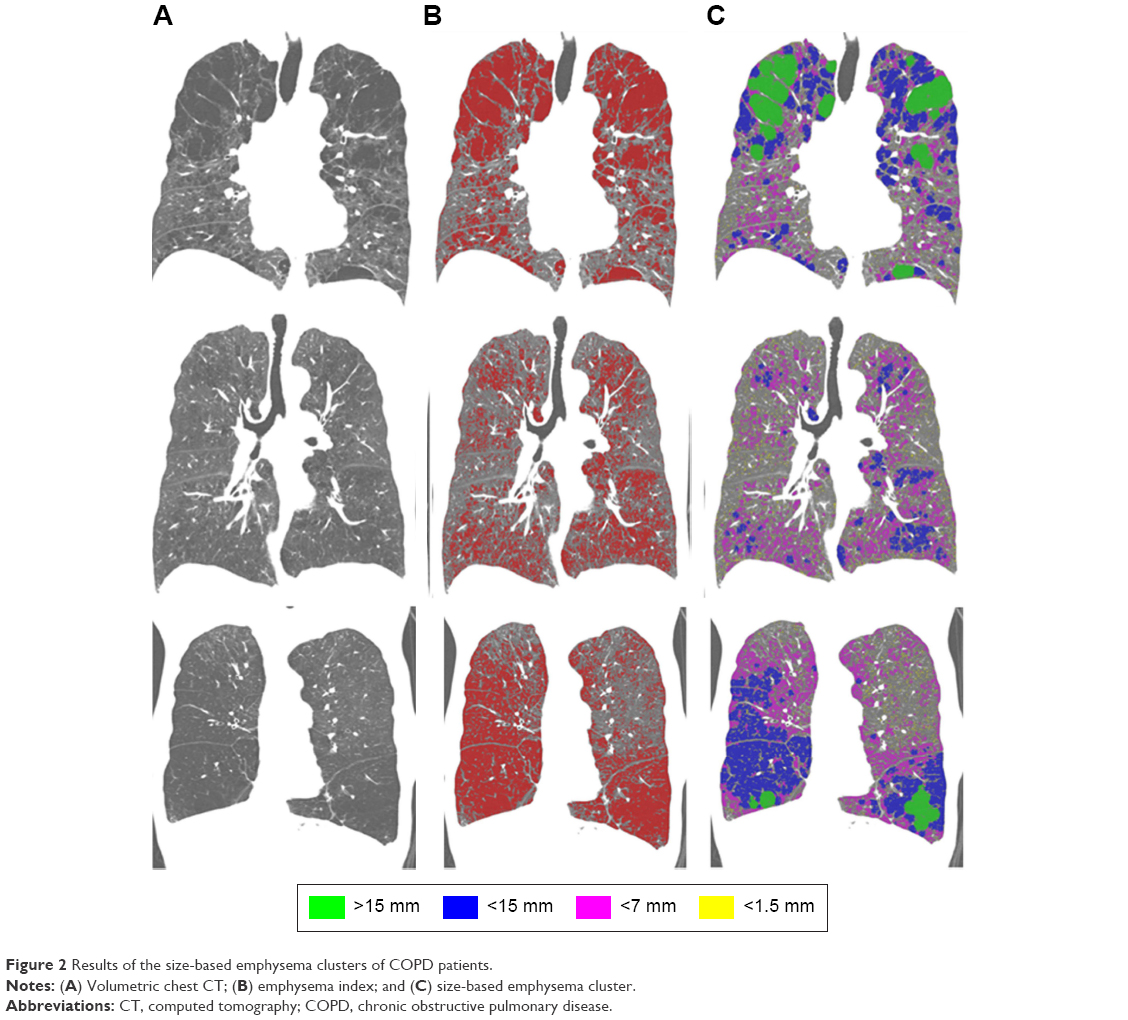 | Figure 2 Results of the size-based emphysema clusters of COPD patients. |
Co-registration between inspiration and expiration CT
Co-registration between inspiratory and expiratory CT was performed using in-house software (AView2010; Coreline Inc, Korea). The inspiratory and expiratory CT were anatomically matched using a deformable registration method. Briefly, after extracting the emphysema cluster by the specific sizes in expiratory CT, we performed the deformation of each region according to the specific sizes (normal, <1.5, <7, <15 and >15 mm) by using co-registration information. The deformed regions were applied to the emphysema holes analysis. The co-registration process is shown in Figure 3.
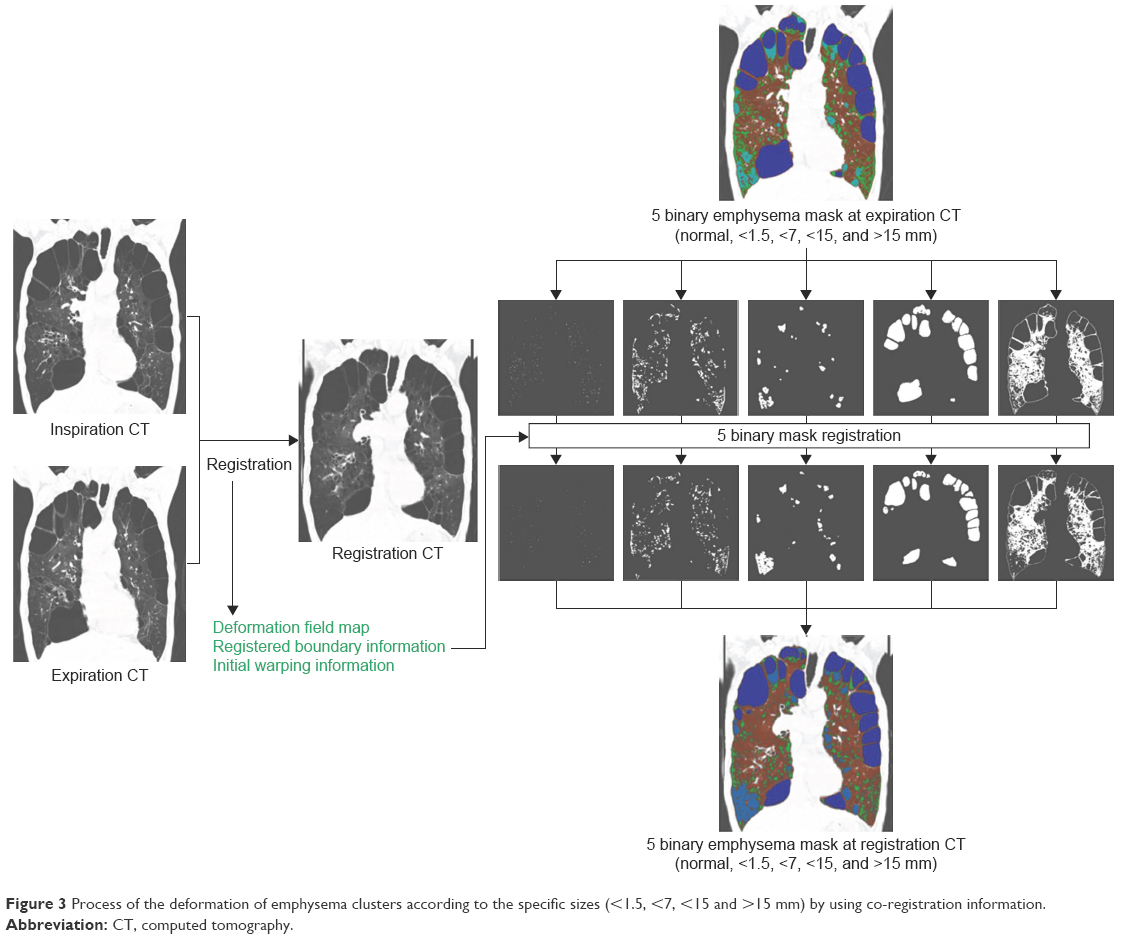 | Figure 3 Process of the deformation of emphysema clusters according to the specific sizes (<1.5, <7, <15 and >15 mm) by using co-registration information. |
Results
Experimental setting
Phantom study
To validate the accuracy of this method by comparing the estimated and actual sizes, an artificial 3D phantom mimicking emphysematous regions was modeled as a bundle of spheres. The accuracy of this method for estimating the phantom sizes of sphere-like emphysema lesions was evaluated. The phantom model was simulated using ITK (Kitware Inc., Clifton Park, NY, USA) and VTK (Kitware Inc.). Pixel spacings of the phantom images were 0.677, 0.677, and 0.700 in the x-, y-, and z-axis directions of the typical pixel spacing used in the CT protocol for chronic obstructive pulmonary disease (COPD) patients, respectively. The phantom models were generated using Equation 2.
|
|
Here, a, b, and c are the numbers of voxels that correspond to the radii of the spheres with specific dimensions. Based on the spherical assumption of the emphysematous region, the same size was used in each direction. For a more realistic verification, the phantom images were designed for three cases of nonattached (apartness), slightly attached (0 mm interval), and strongly attached (2 mm intervals) phantoms.
Volumetric chest CT
For the 30 subjects of this study, emphysema quantification binary mask images, %LAA binary mask images, and volumetric chest CT images were taken. Four images were selected according to each type of anatomical landmark in the image group, and were visually evaluated by two readers (two thoracic radiologists of 5- and 11-year experiences). First, all the captured images were examined excluding emphysema quantitative binary mask images, the distribution (%) of the emphysematous areas was studied with various sizes, and the means and standard deviations (SDs) for each distribution (blind visual evaluation) were calculated. Similarly, using the newly developed method, the mean and SD of the emphysematous region distribution of the emphysema quantitative binary mask images were calculated. From these values, the r- and P-values were calculated for use in Spearman correlation, and were used as a basis for non-blind visual assessment subjectively made by the two readers for all the captured images. For each size, the accuracy was graded based on a 5-point scale. The mean and SD were used as the evaluation factors. In addition, Cohen’s Kappa values were calculated by readers 1 and 2. Finally, the rates of underestimation and overestimation were evaluated using the approach described above.
The developed software was used for classifying the size of the emphysema (Figure 4). It is theoretically possible for the developed method to classify emphysema holes by any size, but simplified criteria for emphysema holes were used considering the previously known anatomic information. Therefore, emphysema holes were divided into four subgroups: E1<1.5 mm, 1.5 mm ≤ E2<7 mm, 7 mm ≤ E3<15 mm, and E4≥15 mm. Each criterion was presumed as follows: <1.5 mm, alveolus; 1.5–7 mm, subacinus; 7–15 mm, acinus; and >15 mm, lobular.20
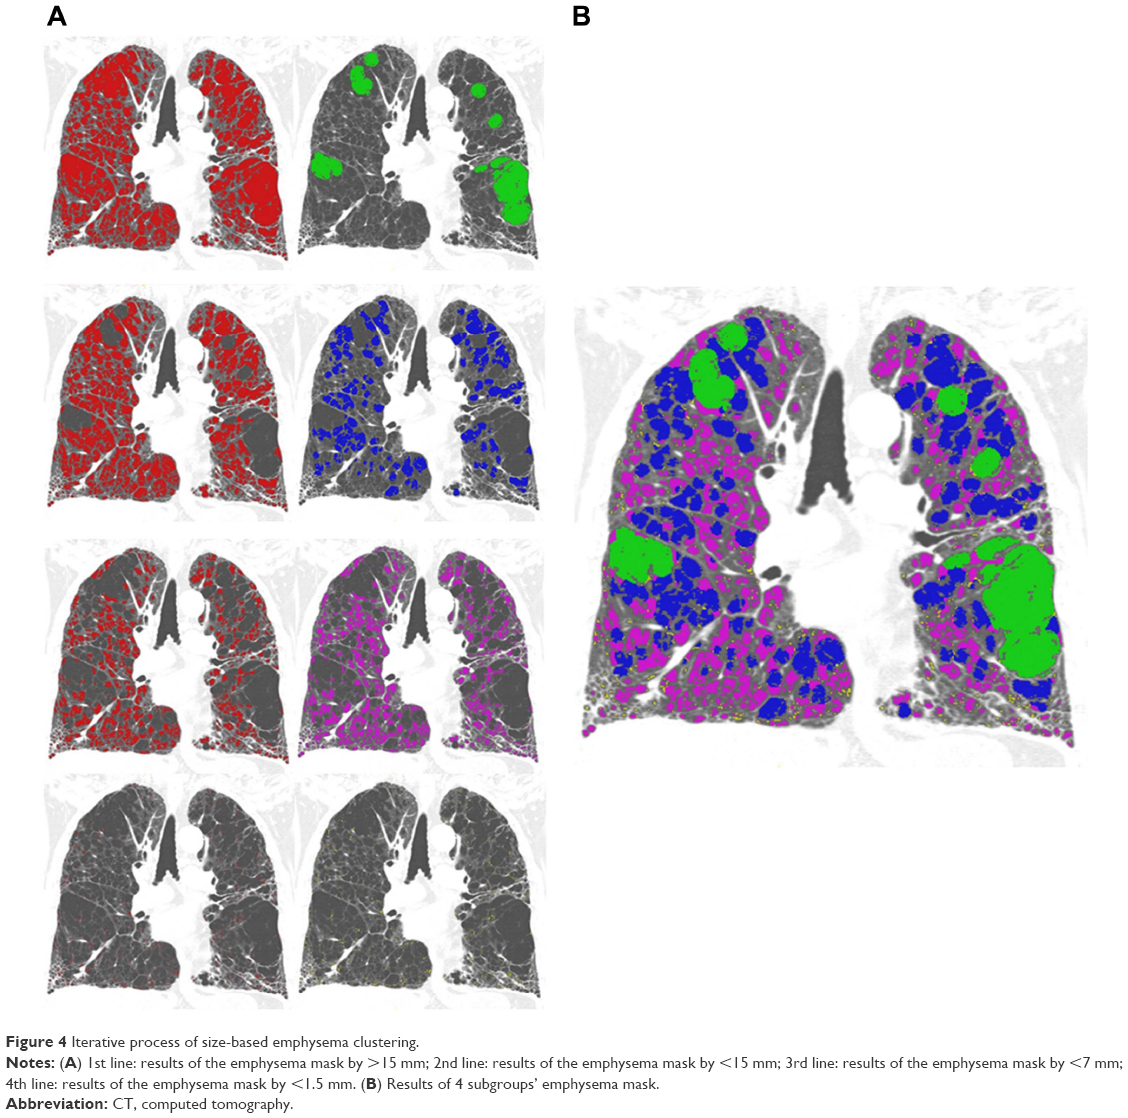 | Figure 4 Iterative process of size-based emphysema clustering. |
Each subgroup’s volume (E1, E2, E3, and E4) and fraction (%E1, %E2, %E3, and %E4), whole-emphysema volume and index (%LAA-950_ins = %LAA <−950 HU in inspiratory CT) were measured in inspiratory CT. The same indices of expiratory CT were measured in the same way.
The collapsibility of each emphysema hole was calculated by Equation 3.
| (3) |

where Ci represents the collapsibility of subgroup i, Ei_ins the volume of subgroup i in inspiratory CT, and Ei_exp the volume of subgroup i in expiratory CT.
In addition, the inspiratory and expiratory co-registered emphysema holes were divided into three components: 1) decreased group – changed smaller subgroups (eg, E3→E2, E1, non-emphysema); 2) no-change group – shifting to the same subgroup (eg, E3→E3); and 3) paradoxically increased group – shifting to a larger subgroup (eg, E3→E4). The size variance of each emphysema hole was assessed.
PFT
All the PFTs were carried out as recommended by ATS/European Respiratory Society. Static lung volumes were measured through body plethysmography (V6200; SensorMedics, San Diego, CA, USA or PFDX; MedGraphics, St Paul, MN, USA).21 The following values were evaluated: forced expiratory volume in 1 second (FEV1), the ratio of FEV1 to forced vital capacity (FVC; FEV1/FVC); and FVC, forced expiratory flow at 25%–75% of FVC (FEF25–75). The diffusing capacity (DLco) was measured according to a single-respiration carbon monoxide uptake (Vmax 22, SensorMedics; PFDX, MedGraphics).22 For the calculation of the RV and total lung capacity (TLC), the reserved expiratory volume was measured immediately after the measurement of the functional residual capacity (FRC), followed by delayed measurements of inspiratory vital capacity. RV was calculated as FRC minus the average of the technically acceptable reserved expiratory volume, and TLC was the sum of the RV and the maximum of the technically acceptable inspiratory vital capacity values. The prediction values of the lung volumes were computed from European Community for Steel and Coal data.23
Statistical analysis
The results were expressed as mean ± SD. Size-based emphysema clustering was correlated with PFT parameters using Pearson’s correlation analysis. Multiple linear regression analysis with backward disappearance was used to assess the contribution of each subgroup quantified lesion (E1%, E2%, E3%, and E4%) to PFT parameters. A P-value <0.05 was considered significant. All the statistical analyses were performed using the commercial statistical application SPSS 21 (SPSS, Inc., Chicago, IL, USA) and Spearman correlation of Matlab (Cohen’s Kappa).
Results of phantom and volumetric chest CT
Phantom study
Figure 5 shows the results of the phantom study. All the spheres were colored according to the size in Figure 5. Table 1 shows the accuracy of the size-based quantification method according to the type of attachment. The spheres did not adhere and were accurately distinguished in the case of slight adhesion, but the diameters of the strongly adhered spheres were under or overestimated. For example, a sphere with 14 mm is estimated to be exact and 12 mm is estimated to 10 mm (underestimation) due to the influence of peripheral sphere. And since spheres with 4, 6, and 8 mm diameters are relatively small, these seem to be united, and are under or overestimated to be 6 mm in size. In the case of complex adhesion, accurate estimation and underestimation were observed due to the different degrees of adhesion between the spheres.
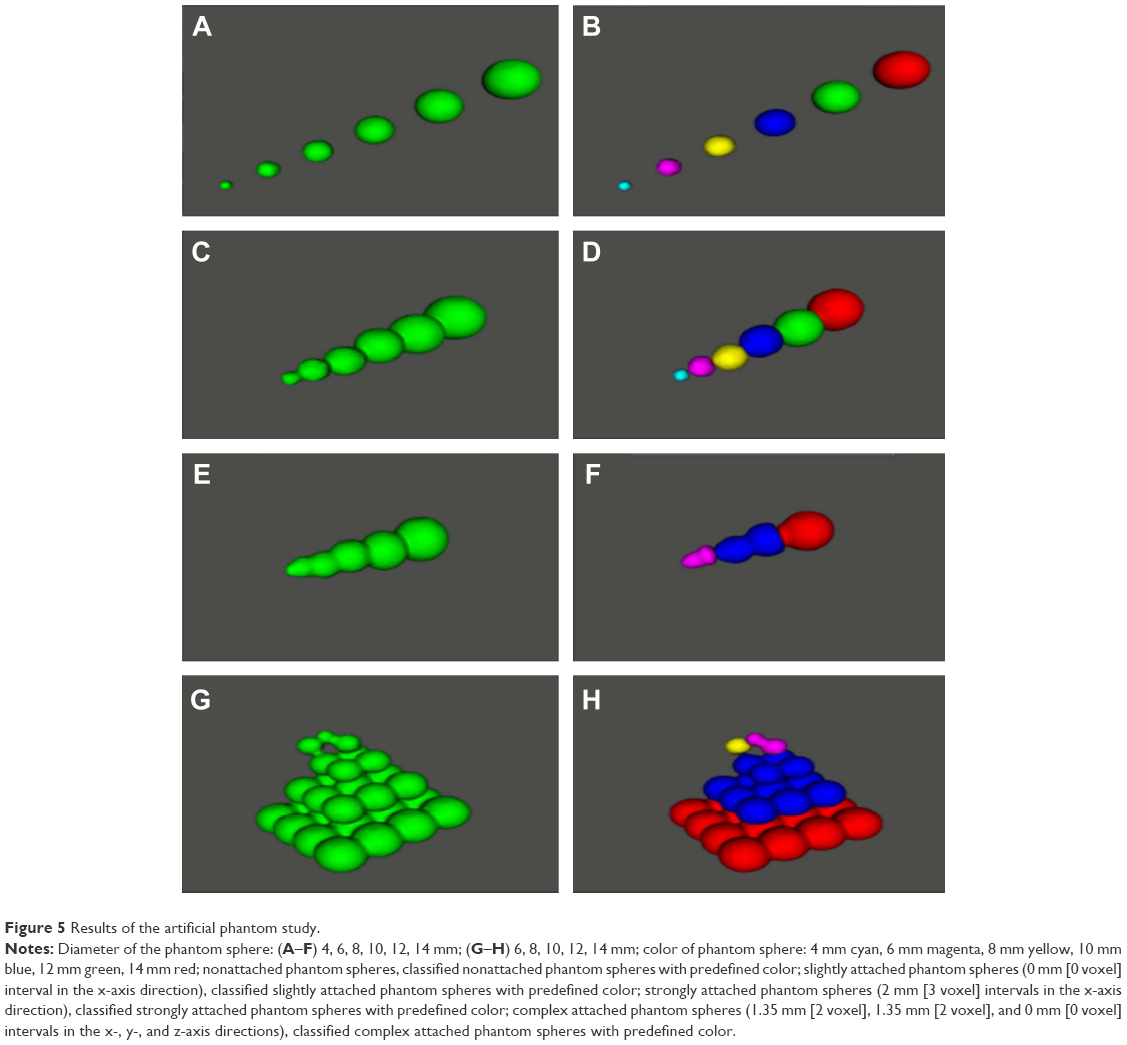 | Figure 5 Results of the artificial phantom study. |
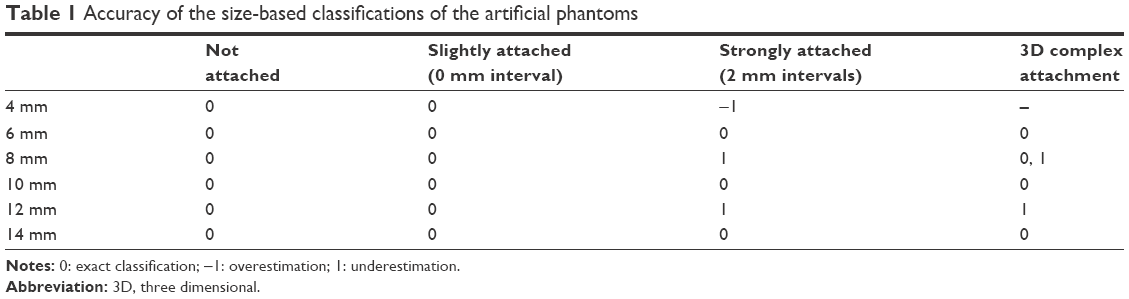 | Table 1 Accuracy of the size-based classifications of the artificial phantoms |
Volumetric chest CT
Table 2 shows the statistical associations between the classified size distributions of the newly developed method and the blind visual scores determined by the two readers. In all sizes of the emphysematous areas, the classification results and visual scores of the newly developed method had significant associations. All the r-values for these correlation studies were >0.5 for all emphysematous sizes, except for reader 1 in the <1.5 mm (r=0.186, P=0.326). The values of Cohen’s Kappa were obtained by readers 1 and 2. The unweighted values of reader 1 were −0.018, −0.013, 0.204, and 0.420 for the specific sizes (<1.5, <7, <15, >15 mm), and the 95% CIs were 0.001–0.407 (<15 mm) and 0.126–0.713 (>15 mm). The 95% CI corresponding to <1.5 mm and <7 mm does not exist. The unweighted values of reader 2 were 0.005, 0.081, 0.698, and 0.547 and the 95% CIs were 0.559–0.838 (<15 mm) and 0.243–0.851 (>15 mm). The 95% CI corresponding to <1.5 mm and <7 mm does not exist. In addition, the two readers visually analyzed the obtained results and probabilities of the overall overestimation and underestimation were 6.35%±3.91% and 6.51%±7.85% (reader 1) and 6.56%±4.30% and 6.56%±6.50% (reader 2), respectively.
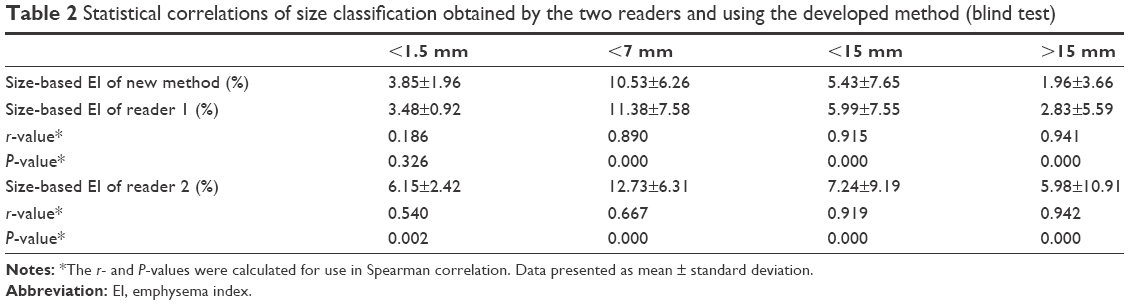 | Table 2 Statistical correlations of size classification obtained by the two readers and using the developed method (blind test) |
Using the novel software, size-based clustering of emphysema from volumetric inspiratory and expiratory CT images was successfully performed for all the patients. Results with the characteristic PFT and CT indices for all the patients are summarized in Tables 3 and 4. The mean values of EI in the inspiratory and expiratory CT (25.4 and 15.0, respectively) and FEV1 (49.4) indicate that the study population in the current study has moderate emphysema with CT, and moderate to severe airflow limitation. The divided subgroup E2 had the largest part of emphysema holes in both inspiration and expiration. E3, E4, and E1 occupied a small portion sequentially.
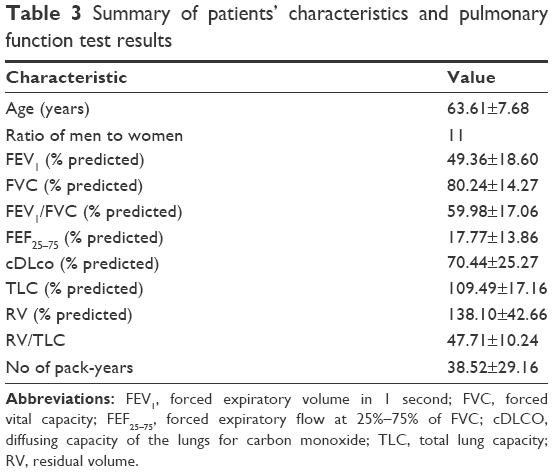 | Table 3 Summary of patients’ characteristics and pulmonary function test results |
 | Table 4 Size distribution in inspiratory and expiratory CT |
The Pearson’s correlation test proved significant negative correlations between the values of the divided subgroup fraction (E2%, E3%, and E4%) and value of PFT (% predicted value of FEV1, FEV1/FVC, FEF25–75, and diffusing capacity of the lungs for carbon monoxide [cDLco]), like the EI (%LAA-950_ins). Subgroup E1% had positive correlation with the values of PFT (cDLco) in the inspiratory CT in a paradoxical manner (Table 5). All the divided subgroup fractions of the expiratory CT (E1_ex%, E2_ex%, E3_ex%, and E4_ex%) had significant negative correlations with the values of PFT (% predicted values of FEV1, FEV1/FVC, FEF25–75, and cDLco), like the EI of the expiratory CT (%LAA-950_exp). Subgroup E3% was more negatively correlated with the values of PFT (r=−0.483, % predicted value of FEV1; −0.523, predicted value of FEF25–75; −0.745, % predicted value of FEV1/FVC; −0.343, % predicted value of cDLco) of the inspiratory CT.
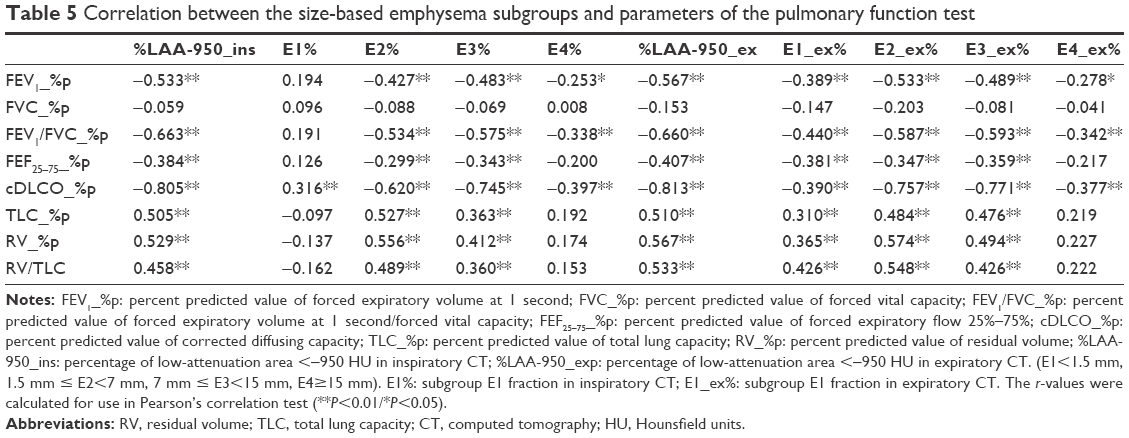 | Table 5 Correlation between the size-based emphysema subgroups and parameters of the pulmonary function test |
For collapse of total emphysema, those of subgroups E1, E2, E3, and E4 were 60.0%, 43.4%, 33.3%, and 19.4%, respectively. The smaller subgroups were more collapsible. After co-registration between inspiratory and expiratory CT, each hole of emphysema was tracked. The changed volumes of all the emphysema holes are summarized in Figure 6. The divided components of each subgroup were compared with PFT parameters. In addition, subgroups regrouping was performed; the summation groups (group of E1, E2, E3, E4/group of E2, E3, E4/group of E1, E2, E3) were validated to find the functionally significant part of the emphysema holes. The correlation between the divided components and PFT parameters is summarized in Table 6. The proportions of the reduced components of E1, E2, and E3 (E1_dec%, E2_dec%, and E3_dec%) were significantly positive correlations with the predicted percentage values of FEV1, FEV1/FVC, and cDLco (all P<0.05). The total proportion of reduced components of subgroups E1, E2, E3, and E4 (sum%_dec_subgroup) had significant correlations with the predicted percentage values of FEV1, FEV1/FVC, FEF25–75, and cDLco (r=0.560, 0.568, 0.402, and 0.733, respectively).
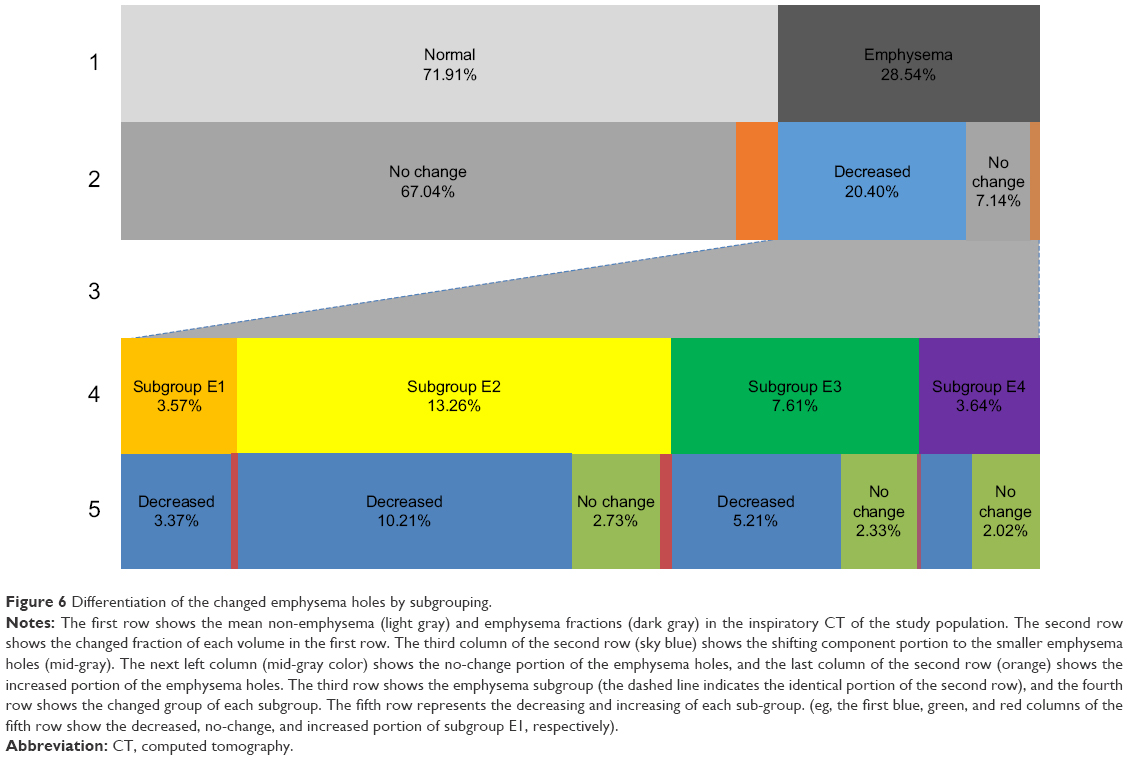 | Figure 6 Differentiation of the changed emphysema holes by subgrouping. |
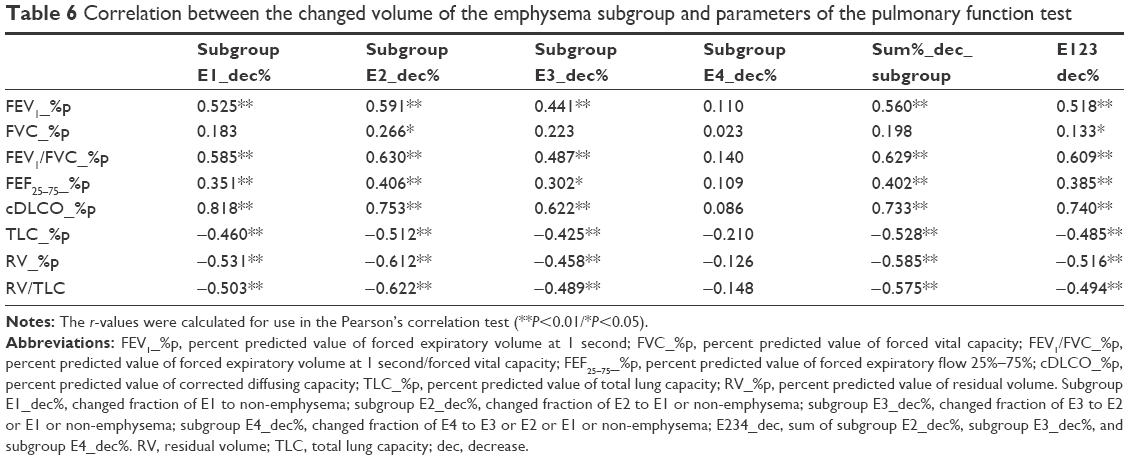 | Table 6 Correlation between the changed volume of the emphysema subgroup and parameters of the pulmonary function test |
The correlation coefficients of these PFT parameters with the total reduced proportion of subgroups E1, E2, and E3 were slightly stronger than the EI of the inspiratory CT (FEF25–75, r=0.385, RV/TLC, −0.494).
Discussion
In this paper, a new size-based emphysema classification method using length scale analysis and size-based emphysema holes analysis related with respiration using co-registration method were proposed. Emphysema quantification method can classify emphysematous regions based on specific sizes, which might affect COPD progression and demonstrate clinical significance. Thus, using this approach, each cluster of LAAs representing emphysematous areas in the volumetric chest CT images can be considered as various anatomical structures, such as alveoli and secondary pulmonary lobules, depending on their sizes. In this approach, length scale analysis using iterative Gaussian low-pass filtering was used to classify complicatedly shaped emphysematous regions according to their sizes. The traditional voxel-based clustering techniques are limited by the partial volume effect of CT scans, noise of emphysema mask, motion artifacts, and the processing time required for emphysematous areas with complex shapes.11,24,25 Previous studies have attempted to quantify emphysematous regions. Gietema et al quantified the relationship between visual scores determined by radiologists and the size of emphysematous regions by analyzing EI values using low attenuation cluster analysis.24,26 Yuan et al quantified the relationship between histology and CT measurements by analyzing EI values using EmphylxJ (custom software designed by the UBC James Hogg Research Center, Vancouver, BC, Canada).25 Tanabe et al also attempted to quantify this relationship by analyzing the variance in quantitative CT measurements.25 Mishima et al quantified emphysema using a comparative analysis of the relationship between the region size of EI (as determined using the 2D Elastic Spring Network Model) and the actual regional size of emphysema.11 However, emphysema was quantified using low-attenuation cluster analysis, which is susceptible to CT noise and could obtain very different radiological insights. The newly developed approach makes it possible to rapidly and strongly classify emphysematous areas based on sizes, with anatomical significance. In order to verify this approach, two types of experimental research were conducted. In the phantom study, this approach showed relatively high accuracy when the emphysematous area was spherical and isolated. However, this approach was demonstrated to underestimate the nonspherical emphysematous areas. This underestimation is probably caused by the blurring of sharp edges by Gaussian low-pass filtering. In the case of the strongly adhered spheres, the proposed approach also underestimated the spherical size due to the physical overlap among the strongly adherent emphysematous areas. In general, readers tend to underestimate small adhered spheres because the volume of an adhered sphere is actually small. Significant correlations and relatively small overall overestimation and underestimation were found between the results of the developed approach and the visual evaluation based on the sized-based EI. This is because the proposed approach is simple, intuitive, and similar to the visual decision. In addition, the Cohen’s Kappa values obtained by readers 1 and 2 are not sufficient, but the statistical correlation values between the size-based EI obtained by the developed approach and the visual evaluation based on the size-based EI are almost significantly associated.
The developed quantification approach was performed in emphysema patients with the smoking or smoke exposure history in the volumetric chest CT. The proposed approach here has several advantages compared with previous studies. Several researchers have addressed the ability of 3D volumetric data to accurately quantify the extent and severity of emphysema.27–29 In previous studies, which compared only a few single inspiratory and expiratory image pairs, misregistrations of the CT slices between inspiration and expiration might have been due to disturbances of the accurate evaluation of airway dysfunction.30 Emphysema hole analysis related with the respiration approach provided size information of emphysema holes and changing sizes related with respiration. It is well known that EI is correlated with pulmonary function impairment. After the subgrouping of emphysema holes, each subgroup showed a correlation difference with the PFT parameters. Subgroups E2, E3, and E4 in inspiratory CT showed a negative correlation with the PFT parameters (FEV1, FEV1/FVC, and DLco), but subgroup E1 showed a paradoxical correlation. These differences were interpreted as follows: subgroup E1 mixed a functionally insignificant emphysema or simple noise presenting low-attenuated areas. Results of the registered emphysema holes strengthen this interpretation. The changed portion of E1 after registration was larger than the other subgroups. As much of the changed portion of E1 belonged to the decreased group (moving to a smaller subgroup – non-emphysema), it was thought that a functionally insignificant or functionally intact emphysema presenting a low-attenuated area would be able to change to non-emphysema in the expiration phase.
The correlation coefficients of the PFT parameters and the subgroups of emphysema holes in the expiratory CT were larger than the subgroups of emphysema holes in the inspiratory CT. This finding is consistent with that of a previous study showing that the extent of emphysema in the expiratory CT was better correlated with the pulmonary function measurement result.31 The decreased component of emphysema holes after co-registration between inspiratory and expiratory CT was shown to be more collapsible in smaller emphysema. It is assumed that the large-emphysema group may have a bigger trapped air portion than the smaller-emphysema group. The fraction of the summation group of E1, E2, and E3 had a slightly and conversely stronger correlation with the PFT parameters (FEV1, FEV1/FVC, and FEF25–75) than the whole EI in inspiratory CT. Especially, the predicted percentage value of FEF25–75 had a conversely stronger correlation with the fraction of the summation group of E1, E2, and E3. In addition, the smaller subgroups were shown to be more collapsible than the larger ones. It is assumed that the larger emphysema holes had a weak contribution to small-airway obstruction.
A previous study that used the concept of fractal geometry showed that the cumulative frequency and size distribution of the low-attenuation lung region can be fitted by a straight line and a slope (D) reflecting the diffusing capacity.11 The slope estimated is similar to power law D using the emphysema quantification method with length scale.26 According to this study, a slope of power law D is correlated to the fractal method. Especially, a slope of power law D is highly correlated to respiration variation.26
These studies have some limitations. The first limitation is the assumption that emphysema regions have an approximately spherical shape. In case of a complex shape of emphysematous region, the size-based EI could be underestimated. Clinical parameters including PFT and 6 minute walks of COPD patients need to be compared with the result of this method. The second limitation is that no subgroup of size results shows a better association with FEV1 than LAA%. However, the purpose of this study is to demonstrate that contribution to airflow limitation is different depending on the size of the hole, rather than developing an index with better correlation than LAA% through size information. The third limitation of this study is that the size thresholds that subdivide the emphysema holes are somewhat arbitrary, although they were based on the anatomical size of lung units. The fourth limitation of this study is the fact that it does not reflect the pathologic correlation with regard to emphysema heterogeneity. Finally, the proportions of men and women were not uniform in this study because the study cohort consisted only of patients with smoking-induced emphysema. To generalize the results of this study, a study with a large number of patients with similar gender proportions and reflecting pathologic correlations must be conducted.
Conclusion
A novel method to assess size and collapse of emphysema holes on CT is developed by using a modified length scale method and image co-registration. Different relative contribution in PFT decline of emphysema holes according to their size was assessed. The extent of collapse of the emphysema holes was also found to be correlated with the PFT parameters. A detailed assessment of the size variation and collapse of emphysema holes might be useful for understanding the dynamic collapse of emphysema and its functional relation.
Acknowledgments
This work was supported partially by the Technological Innovation R&D Program (S2259881) funded by the Small and Medium Business Administration (SMBA, Korea) and by the Industrial Strategic technology development program (10041618) funded By the Ministry of Trade, Industry & Energy (MI, Korea).
The abstract of this paper was presented at the Asian Oceanian Congress of Radiology 2014 conference and was published in the proceedings of the meeting. The abstract was previously available as a poster online at http://www2.convention.co.jp/aocr2014/pdf/scientificpaper.pdf, but has since been removed.
Disclosure
The authors report no conflicts of interest in this work.
References
Snider GL, Kleinerman J, Thurlbeck WM, Bengali ZH. The definition of emphysema. Report of a National Heart, Lung, and Blood Institute, Division of Lung Diseases workshop. Am Rev Respir Dis. 1985;132(1):182–185. | ||
Thurlbeck WM, Muller NL. Emphysema: definition, imaging, and quantification. AJR Am J Roentgenol. 1994;163(5):1017–1025. | ||
Bankier AA, Madani A, Gevenois PA. CT quantification of pulmonary emphysema: assessment of lung structure and function. Crit Rev Comput Tomogr. 2002;43(6):399–417. | ||
Bergin C, Muller N, Nichols DM, et al. The diagnosis of emphysema. A computed tomographic-pathologic correlation. Am Rev Respir Dis. 1986;133(4):541–546. | ||
Muller NL, Staples CA, Miller RR, Abboud RT. “Density mask”: an objective method to quantitate emphysema using computed tomography. Chest. 1988;94(4):782–787. | ||
Lynch DA. Quantitative computed tomography of diffuse lung disease. J Thorac Imaging. 2013;28(5):264–265. | ||
Gevenois PA, de Maertelaer V, De Vuyst P, Zanen J, Yernault JC. Comparison of computed density and macroscopic morphometry in pulmonary emphysema. Am J Respir Crit Care Med. 1995;152(2):653–657. | ||
Gevenois PA, De Vuyst P, de Maertelaer V, et al. Comparison of computed density and microscopic morphometry in pulmonary emphysema. Am J Respir Crit Care Med. 1996;154(1):187–192. | ||
Nishimura K, Murata K, Yamagishi M, et al. Comparison of different computed tomography scanning methods for quantifying emphysema. J Thorac Imaging. 1998;13(3):193–198. | ||
Mandelbrot B. The Fractal Geometry of Nature. W.H. Freeman and Co.,: US; 1982. | ||
Mishima M, Hirai T, Itoh H, et al. Complexity of terminal airspace geometry assessed by lung computed tomography in normal subjects and patients with chronic obstructive pulmonary disease. Proc Natl Acad Sci U S A. 1999;96(16):8829–8834. | ||
Madani A, Van Muylem A, de Maertelaer V, Zanen J, Gevenois PA. Pulmonary emphysema: size distribution of emphysematous spaces on multidetector CT images – comparison with macroscopic and microscopic morphometry. Radiology. 2008;248(3):1036–1041. | ||
Park TS, Lee JS, Seo JB, et al. Study design and outcomes of Korean Obstructive Lung Disease (KOLD) cohort study. Tuberc Respir Dis. 2014;76(4):169–174. | ||
Hu S, Hoffman EA, Reinhardt JM. Automatic lung segmentation for accurate quantitation of volumetric X-ray CT images. IEEE Trans Med Imaging. 2001;20(6):490–498. | ||
van Rikxoort EM, de Hoop B, van de Vorst S, Prokop M, van Ginneken B. Automatic segmentation of pulmonary segments from volumetric chest CT scans. IEEE Trans Med Imaging. 2009;28(4):621–630. | ||
Ginsburg SB, Lynch DA, Bowler RP, Schroeder JD. Automated texture-based quantification of centrilobular nodularity and centrilobular emphysema in chest CT images. Acad Radiol. 2012;19(10):1241–1251. | ||
Vidal Melo MF, Winkler T, Harris RS, Musch G, Greene RE, Venegas JG. Spatial heterogeneity of lung perfusion assessed with (13)N PET as a vascular biomarker in chronic obstructive pulmonary disease. J Nucl Med. 2010;51(1):57–65. | ||
Lee M, Kim N, Lee SM, Seo JB, Oh SY. Size-based emphysema cluster analysis on low attenuation area in 3D volumetric CT: comparison with pulmonary functional test. Medical Imaging 2015: Biomedical Applications in Molecular, Structural, and Functional Imaging conference; February 21, 2015; Orlando, FL. | ||
Webb WR. Thin-section CT of the secondary pulmonary lobule: anatomy and the image – the 2004 Fleischner lecture. Radiology. 2006;239(2):322–338. | ||
Miller MR, Hankinson J, Brusasco V, et al. Standardization of spirometry, 1994 update. American Thoracic Society. Am J Respir Crit Care Med. 1995;152(3):1107–1136. | ||
Rosenberg E. The 1995 update of recommendations for a standard technique for measuring the single-breath carbon monoxide diffusing capacity (transfer factor). Am J Respir Crit Care Med. 1996;154(3 Pt 1):827–828. | ||
Quanjer PH. Standardized lung function testing. Report working party. Bull Eur Physiopathol Respir. 1983;19(Suppl 5):1–95. | ||
Gietema HA, Muller NL, Fauerbach PV, et al. Quantifying the extent of emphysema: factors associated with radiologists’ estimations and quantitative indices of emphysema severity using the ECLIPSE cohort. Acad Radiol. 2011;18(6):661–671. | ||
Tanabe N, Muro S, Sato S, et al. Longitudinal study of spatially heterogeneous emphysema progression in current smokers with chronic obstructive pulmonary disease. PLoS One. 2012;7(9):e44993. | ||
Yuan R, Nagao T, Pare PD, et al. Quantification of lung surface area using computed tomography. Respir Res. 2010;11(1):153. | ||
Hwang J, Lee M, Lee SM, et al. A size-based emphysema severity index: robust to the breath-hold level variations and correlated with clinical parameters. Int J Chron Obstruct Pulmon Dis. 2016;11:1835–1841. | ||
Mergo PJ, Williams WF, Gonzalez-Rothi R, et al. Three-dimensional volumetric assessment of abnormally low attenuation of the lung from routine helical CT: inspiratory and expiratory quantification. AJR Am J Roentgenol. 1998;170(5):1355–1360. | ||
Park KJ, Bergin CJ, Clausen JL. Quantitation of emphysema with three-dimensional CT densitometry: comparison with two-dimensional analysis, visual emphysema scores, and pulmonary function test results. Radiology. 1999;211(2):541–547. | ||
Zaporozhan J, Ley S, Eberhardt R, et al. Paired inspiratory/expiratory volumetric thin-slice CT scan for emphysema analysis: comparison of different quantitative evaluations and pulmonary function test. Chest. 2005;128(5):3212–3220. | ||
Matsuoka S, Kurihara Y, Yagihashi K, Hoshino M, Watanabe N, Nakajima Y. Quantitative assessment of air trapping in chronic obstructive pulmonary disease using inspiratory and expiratory volumetric MDCT. AJR Am J Roentgenol. 2008;190(3):762–769. | ||
Kauczor HU, Hast J, Heussel CP, Schlegel J, Mildenberger P, Thelen M. CT attenuation of paired HRCT scans obtained at full inspiratory/expiratory position: comparison with pulmonary function tests. Eur Radiol. 2002;12(11):2757–2763. |
Supplementary materials
Lung segmentation
The lung segmentation approach without airway including large branches consists of the following steps, which are based on thresholding, binary region growth, and morphological operators. First, a thresholding <−400 HU was applied at the volumetric chest CT to obtain a pulmonary mask with a binary region growing on the lung. By a thresholding <−950 HU, binary region growth on the airway trachea, and dilation with 3 pixels, a large branch airway mask was generated. The large branch airway mask was subtracted from the lung mask, which is the final lung mask without a large branch airway.
Noise reduction
The noise filtering approach was applied based on block matching and resembles the mode filter. The noise reduction algorithm is given by Equations S1 and S2:
|
|

where Nx, Ny, and Nzare the width, height, and depth of the emphysema mask, respectively; E(x, y, z) is the emphysema mask; and T(x, y, z) is the number of voxels, with one in a 2×2×2 block:
|
|
where τx, τy, and τz, are 0 and 1, respectively, and P(x, y, z) is the final noise-reduced mask. The threshold value was empirically calibrated and set to 5.
Gaussian low-pass filtering
The general 3D Gaussian low-pass filtering is shown in Equation S3:
|
|
where gγ(x, y, z) is a 3D Gaussian kernel with radius γ, and σx, σy, and σz are the SDs in the x-, y-, and z-axis directions, respectively. The equation can be further simplified into Equation S4 if it is assumed to be spherical; in other words, when the SDs are the same as σ in Equation S3. Filtering is performed according to Equation S5 based on this assumption:
|
|
|
|
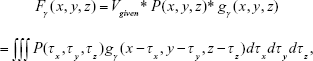
where Fγ(x, y, z) is the resulting image obtained from convolving P(x, y, z) with gγ(x, y, z), Vgiven was specified by a user (eg, maximum density of image P), and P(x, y, z) is the binary masked image for noise reduction.
Selection of skeleton voxels after Gaussian low-pass filtering and dilation
After the Gaussian low-pass filtering, the voxels without a density variance in Fγ(x, y, z) were defined as skeleton voxels. Tse skeleton voxels were marked in the Mγ(x, y, z) mask, as in Equation S6.
|
|
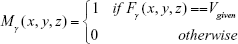
Otherwise, the values of the voxels in Mγ(x, y, z) were set to zero. Mask Mγ(x, y, z) with dilated voxel radii was regarded as a new mask having only a specific range of emphysematous regions. This emphysema mask corresponding to a specific size was crossed with the emphysema mask to preserve EI.
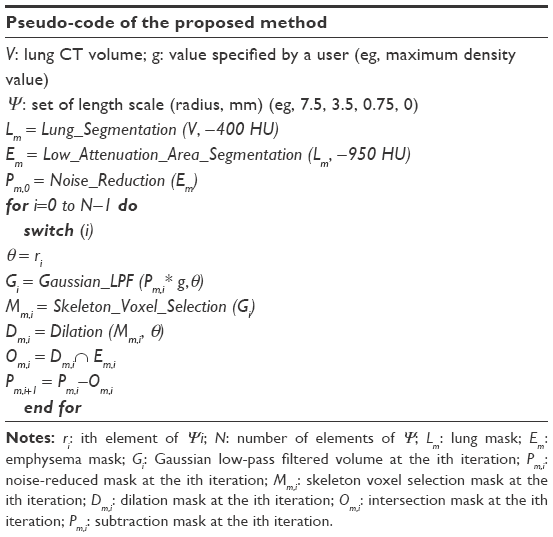 | Notes: ri: ith element of Ψi; N: number of elements of Ψ; Lm: lung mask; Em: emphysema mask; Gi: Gaussian low-pass filtered volume at the ith iteration; Pm,i: noise-reduced mask at the ith iteration; Mm,i: skeleton voxel selection mask at the ith iteration; Dm,i: dilation mask at the ith iteration; Om,i: intersection mask at the ith iteration; Pm,i: subtraction mask at the ith iteration. |
 © 2017 The Author(s). This work is published and licensed by Dove Medical Press Limited. The full terms of this license are available at https://www.dovepress.com/terms.php and incorporate the Creative Commons Attribution - Non Commercial (unported, v3.0) License.
By accessing the work you hereby accept the Terms. Non-commercial uses of the work are permitted without any further permission from Dove Medical Press Limited, provided the work is properly attributed. For permission for commercial use of this work, please see paragraphs 4.2 and 5 of our Terms.
© 2017 The Author(s). This work is published and licensed by Dove Medical Press Limited. The full terms of this license are available at https://www.dovepress.com/terms.php and incorporate the Creative Commons Attribution - Non Commercial (unported, v3.0) License.
By accessing the work you hereby accept the Terms. Non-commercial uses of the work are permitted without any further permission from Dove Medical Press Limited, provided the work is properly attributed. For permission for commercial use of this work, please see paragraphs 4.2 and 5 of our Terms.