Back to Journals » Journal of Inflammation Research » Volume 17
Single-Cell Sequencing Combined with Transcriptome Sequencing Constructs a Predictive Model of Key Genes in Multiple Sclerosis and Explores Molecular Mechanisms Related to Cellular Communication
Authors Hu F ![]() , Zhu Y, Tian J, Xu H, Xue Q
, Zhu Y, Tian J, Xu H, Xue Q
Received 20 October 2023
Accepted for publication 28 December 2023
Published 9 January 2024 Volume 2024:17 Pages 191—210
DOI https://doi.org/10.2147/JIR.S442684
Checked for plagiarism Yes
Review by Single anonymous peer review
Peer reviewer comments 2
Editor who approved publication: Professor Ning Quan
Fangzhou Hu,1,* Yunfei Zhu,1,* Jingluan Tian,1 Hua Xu,1,2 Qun Xue1
1Department of Neurology, The First Affiliated Hospital of Soochow University, Suzhou, Jiangsu, 215000, People’s Republic of China; 2Department of Neurology, Affiliated Jintan Hospital of Jiangsu University, Changzhou Jintan First People’s Hospital, Changzhou, Jiangsu, 215006, People’s Republic of China
*These authors contributed equally to this work
Correspondence: Qun Xue, Email [email protected]
Background: Multiple sclerosis (MS) causes chronic inflammation and demyelination of the central nervous system and comprises a class of neurodegenerative diseases in which interactions between multiple immune cell types mediate the involvement of MS development. However, the early diagnosis and treatment of MS remain challenging.
Methods: Gene expression profiles of MS patients were obtained from the Gene Expression Omnibus (GEO) database. Single-cell and intercellular communication analyses were performed to identify candidate gene sets. Predictive models were constructed using LASSO regression. Relationships between genes and immune cells were analyzed by single sample gene set enrichment analysis (ssGSEA). The molecular mechanisms of key genes were explored using gene enrichment analysis. An miRNA network was constructed to search for target miRNAs related to key genes, and related transcription factors were searched by transcriptional regulation analysis. We utilized the GeneCard database to detect the correlations between disease-regulated genes and key genes. We verified the mRNA expression of 4 key genes by reverse transcription-quantitative PCR (RT‒qPCR).
Results: Monocyte marker genes were selected as candidate gene sets. CD3D, IL2RG, MS4A6A, and NCF2 were found to be the key genes by LASSO regression. We constructed a prediction model with AUC values of 0.7569 and 0.719. The key genes were closely related to immune factors and immune cells. We explored the signaling pathways and molecular mechanisms involving the key genes by gene enrichment analysis. We obtained and visualized the miRNAs associated with the key genes using the miRcode database. We also predicted the transcription factors involved. We used validated key genes in MS patients, several of which were confirmed by RT‒qPCR.
Conclusion: The prediction model constructed with the CD3D, IL2RG, MS4A6A, and NCF2 genes has good diagnostic efficacy and provides new ideas for the diagnosis and treatment of MS.
Keywords: multiple sclerosis, biomarker, peripheral blood, prediction model
Introduction
Multiple sclerosis (MS), an autoimmune disease, comprises a group of inflammatory demyelinating and neurodegenerative diseases involving the central nervous system (CNS). The main pathological feature is white matter demyelination in the CNS, while perivascular inflammation, oligodendrocyte cell death, axonal injury, and neurodegeneration are other prominent neuropathological features,1 which can involve the periventricular white matter, optic nerves, spinal cord, brainstem, and cerebellum. MS is a nontraumatic disabling disease that greatly affects the younger population, and the disabilities that result may eventually develop into permanent ones.2–6 Reports have shown that a combination of factors contribute to the development of MS, including environmental, genetic, and epigenetic variables, such as Epstein‒Barr virus (EBV) infection, smoking, obesity, low vitamin D levels, and HLA-DRB1*15:01.7
Approximately 2.5 million people are affected by MS worldwide.5,8 The prevalence of MS is increasing from year to year, and the incidence is steadily rising. The pathogenesis and clinical course of the disease are variable and unpredictable. The majority of patients (approximately 80–85%) have an initial onset of clinically isolated syndrome (CIS) or a relapsing-remitting (RR) course. Patients with CIS who have demyelinating lesions on MRI have a 60–80% risk of developing MS; RRMS tends to manifest as acute exacerbation episodes, followed by complete or partial recovery, with stabilization of the disease between relapses. The majority of patients (50–60%) develop a secondary progressive MS (SPMS) course 10–15 years2 after the onset of RRMS and require assisted ambulation. Of patients with primary progressive MS (PPMS). 10–15% have a slow and consistently worsening course, usually including progressive myelopathy without significant relapses, which is common in older males.5,6,9 One study showed that in 2016, there were 18,932 deaths due to MS (95% UI 16,577 to 21,033) and 1,151,478 DALYs (968,605 to 1,345,776) worldwide due to MS.10
The conventional wisdom is that MS is primarily driven by T cells.11 However, according to later studies, mechanisms such as B lymphocytes, inflammation-associated oxidative bursts in activated microglia and macrophages, mitochondrial injury, and subsequent energy depletion12,13 are also involved, and together they contribute to the tissue damage of MS, leading to focal and diffuse demyelination and neurodegenerative lesions of the CNS.14,15 MS is a lifelong disease, and most patients usually use disease-modifying therapy (DMT) during periods of remission.
Due to its variable course, MS is unpredictable and complex. Its high rates of disability and mortality also indicate the need for specific biomarkers for successful identification, early diagnosis, prediction of disease progression, and development of new treatments and drugs. However, the diagnosis of multiple sclerosis is challenging, with up to 20% of patients misdiagnosed.16 There appears to be a lack of relatively complete systems for the diagnosis of MS. The diagnosis is primarily made by MRI (Magnetic resonance imaging) on the basis of clinical symptoms, which are determined by neurologic signs and symptoms, supplemented by dissemination in space (DIS) and dissemination in time (DIT) on imaging. However, this only applies to patients presenting with typical CIS symptoms. In addition, oligoclonal bands (OCBs) in the cerebrospinal fluid can aid in the diagnosis when the MRI findings do not meet the diagnostic criteria. Intrathecal synthesis of immunoglobulin G is much more prevalent in MS than in other inflammatory and paraneoplastic disorders, but it is difficult to detect with conventional laboratory techniques, so its clinical use is limited. Many less invasive assays have recently emerged, such as plasma expression of the biomarkers neurofilament light chain and microRNA. However, most of them lack specificity; thus, they are not included in the diagnostic criteria.17
Differential expression analysis helps us to look at the differences in gene expression in different samples and identify associations between the genes to be studied and the phenotype. Commonly used gene expression data come from gene chips (microarray) or high-throughput sequencing.18,19 After identifying the differentially expressed genes, a wide variety of subsequent analyses can be performed, which can lead to the discovery of new networks of relationships and help us to study the functions and roles of these genes.
Single-cell sequencing is an advanced technology that has developed rapidly in recent years. Not only can it detect nucleotide and gene alterations at the single-cell level, but researchers can also use single-cell RNA-seq (scRNA-seq) to reveal new cell types in the nervous, immune,20 and hematopoietic systems, as well as new insights into the evolution of cancer clones.21 LASSO is a regression-based approach that allows for the use of a large number of covariates in the model and has the unique feature of penalizing the absolute values of the regression coefficients.22 A number of studies have utilized LASSO regression models to construct predictive or prognostic models, which have been well applied in a variety of diseases.23–27
miRNAs play various roles in the regulation of cell growth and development processes. By carrying genetic information, mRNA can guide protein synthesis. Complex regulatory relationships exist between miRNAs and mRNAs. By constructing mRNA‒miRNA networks, it has become possible to screen the potential molecular pathways that regulate the key genes involved in diseases.28,29
Therefore, we applied bioinformatics techniques to analyze genes in subpopulations of single-cell data cells. Characterized genes were identified, and predictive models were constructed by LASSO regression. Key genes were analyzed for their relationships with immune infiltration, signaling pathways, and transcriptional regulation and were subsequently experimentally validated. These findings may provide potential targets for MS.
Methods
Briefly, this study started from single-cell analysis, and a disease prediction model was constructed by identifying key genes through LASSO regression. Then, immune infiltration and functional enrichment analysis, miRNA network construction, regulatory network analysis of key genes, and drug-gene interactions were performed (Figure 1).
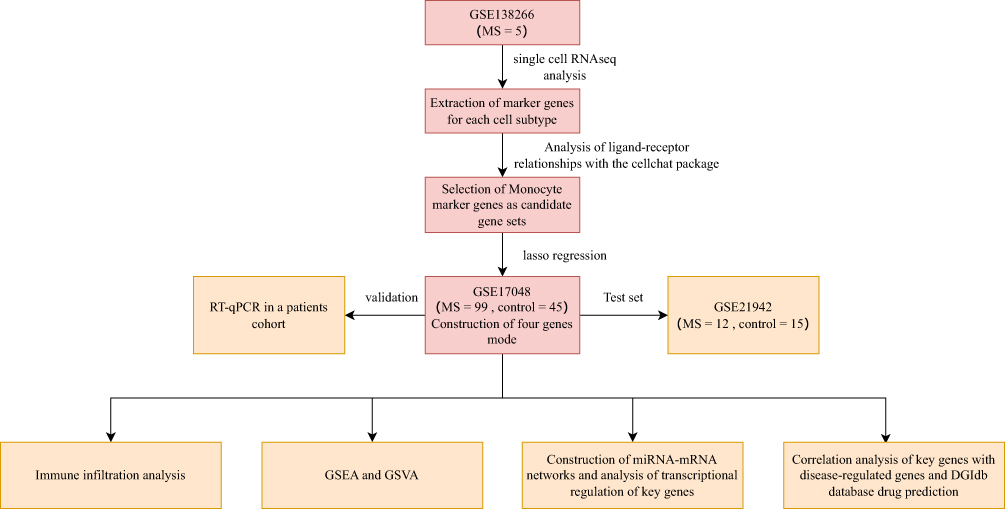 |
Figure 1 Workflow of the study. |
Patient Recruitment and Clinical Data Collection
During the experimental period, six MS patients and four NMO (neuromyelitis optica) patients were recruited for peripheral blood collection at the First Affiliated Hospital of Soochow University. All patients underwent a definitive diagnosis. In addition, we obtained peripheral blood from 6 healthy volunteers as controls. The study protocol was approved by the Ethics Committee of the First Affiliated Hospital of Soochow University and complied with the Declaration of Helsinki. All the subjects were required to provide written informed consent.
Data Access
Data files of GSE138266, which is a single-cell dataset, were downloaded from the NCBI GEO public database (https://www.ncbi.nlm.nih.gov/geo/) and contain data for 5 samples with full expression profiles. The Series Matrix File of GSE17048 was downloaded from GEO, annotated file GPL6947. A total of 144 patients had expression profile data, including 45 normal controls and 99 MS disease patients. The Series Matrix File of GSE21942 was also downloaded from GEO, and the annotated file was GPL570, with expression profiles of 29 patients, including 15 normal controls and 14 MS disease patients.
Single-Cell Analysis
The Seurat package was used to read the expression profiles, and genes with low expression were screened out according to the criteria of “nFeature RNA > 50 and percent.mt < 10”. The data were then normalized, homogenized, and analyzed by PCA. The optimal PC number was obtained using ElbowPlot. We then performed TSNE analysis to determine the positional relationship between each cluster and annotated the clusters using the celldex package, which was used to discover certain cells that were important for disease development. The logfc.threshold parameter of FindAllMarkers was set to 1 to extract marker genes for each cell subtype from the single-cell expression profiles. Using |avg log2FC| > 1 and p val adj < 0.05 as the screening criteria, we obtained marker genes specific to each cell subtype. Specific parameters and criteria are described in the Supplementary Methods Section.
Ligand‒Receptor Interaction Analysis (CellChat)
CellChat is able to quantitatively infer and analyze intercellular communication in single-cell data to infer its biological significance. CellChat requires two user inputs: the gene expression data of a cell and a user-assigned cell label (label-based mode) or a low-dimensional representation of the single-cell data (label-free mode). For the latter, CellChat constructs a shared neighbor graph based on cell‒cell distances in the low-dimensional or pseudotime trajectory space to automatically group cells. Here, our input data are normalized single-cell expression profiles, and the cell information is the cell subtypes derived from single-cell analysis, which quantifies the closeness of interactions in terms of the intensity (weights) and number (counts) of interactions between cells, thus demonstrating cell-related interactions. Ultimately, the goal was to observe the degree of activity and impact of each cell type in MS. Specific parameters and criteria can be found in the Supplementary Methods Section.
Predictive Model Construction
After establishing single-cell marker genes based on the above method, we constructed a prediction model for MS using LASSO regression. The risk score formula for each patient was constructed after incorporating the expression values of specific genes. Meanwhile, through LASSO regression analysis, we obtained the estimated regression coefficient, and through weighting calculation, we calculated the score of each patient based on the risk score formula. Regarding the predictive accuracy of the model in this study, we utilized ROC curve analysis. The detailed steps involved in constructing and validating the predictive model are described in the Supplementary Methods.
Immunoinfiltration Analysis
ssGSEA is a method commonly used for immune cell infiltration analysis that estimates the relative enrichment of a particular gene set (immune cell gene set) in each sample by comparing the gene expression data of that gene set to that sample. In immune cell infiltration analysis, we can use ssGSEA to estimate the relative abundances of different immune cell types in each sample. The ”corrplot” package was used to analyze immune cell interactions and their effects, and the ”vioplot” package was used to map the relative abundance of immune cells, which also evaluates the effects of genes on immune infiltration. The immune cell contents obtained by the methods described above, combined with gene expression, were analyzed by Pearson’s correlation analysis, and differences were found to be statistically significant at P < 0.05.
GSEA (Gene Set Enrichment Analysis)
GSEA uses an input gene expression matrix to rank all the genes of a categorized sample based on the multiplicity of differences. Depending on whether the genes under the gene set are enriched at the top or the bottom of the sorted list, it shows whether the gene set is upregulated or downregulated. In this study, the number of substitutions was set to 1000, and the type of substitution was phenotype. The final GSEA results demonstrate the difference in signaling pathways between the high-expression group and the low-expression group, which helps to explore the molecular mechanisms of the core genes in the two groups of samples.
GSVA (Gene Set Variance Analysis)
GSVA is a nonparametric unsupervised method. By unsupervised classification of samples, the expression matrix of genes among different samples can be transformed into an expression matrix of gene sets among samples, and then the gene sets of interest are evaluated and scored to obtain an enrichment score to evaluate whether different metabolic pathways are enriched among different samples and determine their biological functions. In this study, gene sets were downloaded from the Molecular Signatures Database, and the potential biological function changes of different samples were evaluated based on the composite score of each gene set derived from the GSVA algorithm. Detailed explanations of GSEA and GSVA are provided in the Supplementary Methods Section.
miRNA Network Construction
miRNAs (microRNAs) are single-stranded small-molecule RNAs of approximately 21–23 bases in size that can regulate gene expression by directing the RNA-induced silencing complex (RISC) to degrade mRNAs or hinder their translation by base-pairing with mRNAs of target genes. We analyzed whether there are miRNA sequences in key genes that can regulate the degradation or transcription of related genes. The miRNAs related to the key genes were obtained from the miRcode database, while the visualization of the miRNA network was performed using Cytoscape software.
Regulatory Network Analysis of Key Genes
Rcis Target identifies overexpressed (enriched) transcription factor binding motifs (TFBS) in a gene list. In this study, we used the R package “RcisTarget” to identify transcription factor (TF) binding motifs that were overexpressed in the gene list. NES depends on the total number of motifs in the database. On the basis of obtaining the motifs annotated by the source data, we inferred further annotated files, which were constructed based on motif similarity and gene sequences. Based on the recovery curve of the gene set against the motif ordering, we calculated the area under the curve (AUC) for each motif–motif set pair and thus estimated the overexpression of the motifs on the gene set. Finally, the NES of each motif was obtained by calculating the AUC distribution of all motifs in the gene set.
Drug–Gene Interaction Databases
DGIdb (Drug–Gene Interaction database) is a database of drug targets and genomes and drug–gene interactions. DGIdb can provide information on the associations of genes with their known or potential drugs and thus predict potential drugs or molecular compounds that interact with key genes.
Statistical Analysis
All statistical analyses were performed using R language (version 4.2.2), and P < 0.05 was considered statistically significant.
RT‑qPCR
- RNA extraction. Total RNA from the peripheral blood of 6 MS patients, 4 NMO patients, and 6 normal controls was extracted by applying VeZol Reagent (Vazyme, R411). A 250 µL sample was taken and added to 750 µL of lysate. After a series of operations according to the instructions, 21 µL of RNase-free water was added. One microliter was taken for concentration determination with a Thermo Fisher NanoDrop One.
- cDNA synthesis. Total RNA was synthesized into cDNA according to the instructions provided for HiScript III RT SuperMix for qPCR (+gDNA wiper) (Vazyme, R323).
- RT‒qPCR. Amplification was performed using Taq Pro Universal SYBR qPCR Master Mix (Vazyme, Q712) on an ABI StepOne Plus real-time quantitative polymerase chain reaction machine. The total reaction system used to prepare the reaction solution was 10 µL, including 5.0 µL 2× Taq Pro Universal SYBR qPCR Master Mix, 0.25 µL forward primer (10 µM), 0.25 µL reverse primer (10 µM), 1 µL template DNA/cDNA and 3.5 µL ddH2O. Primers were as described in Table 1. After predenaturation at 95 °C for 30 seconds, 40 cycles of the reaction were carried out, followed by recording of the melting curve. Relative expression was calculated by the 2−ΔΔCt method. Differences in gene expression between the two groups were analyzed by t-test. P < 0.05 was considered statistically significant.
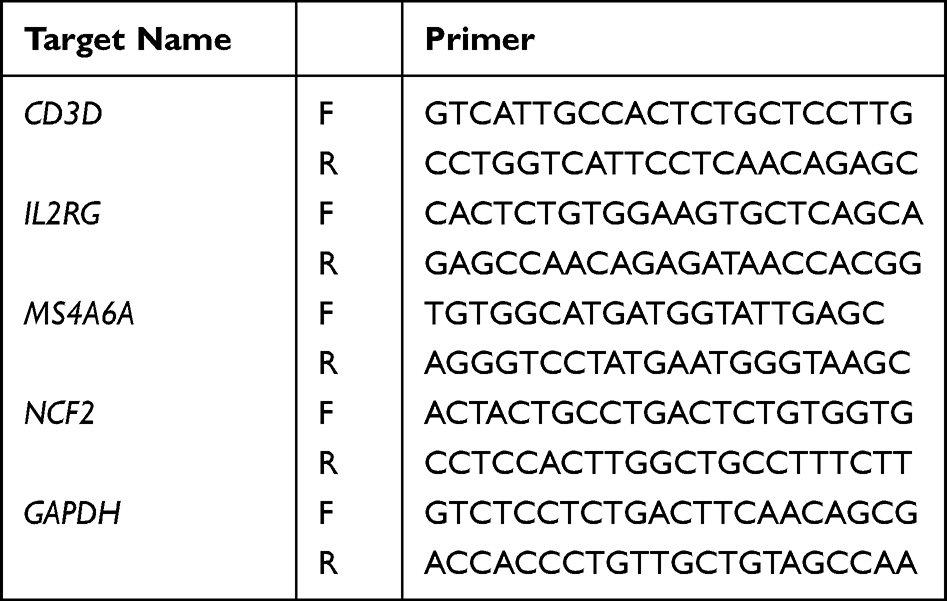 |
Table 1 Primer Information |
Results
Single-Cell Level Analysis in scRNA-Seq Data
Single-cell data for GSE138266 were downloaded from GEO. This study was carried out to first screen the data samples by nFeature RNA and nCount RNA (nFeature RNA > 50 and percent.mt 10) (Figure 2A and B). The ten genes with the highest standard deviations were then identified (Figure C). In this study, the batch effect between samples was found to be insignificant by PCA downscaling analysis (Figure 2D), and the optimal PC number was obtained using ElbowPlot: 11 (Figure 2E). Finally, a total of 24 subgroups were obtained by TSNE analysis (Figure 2F).
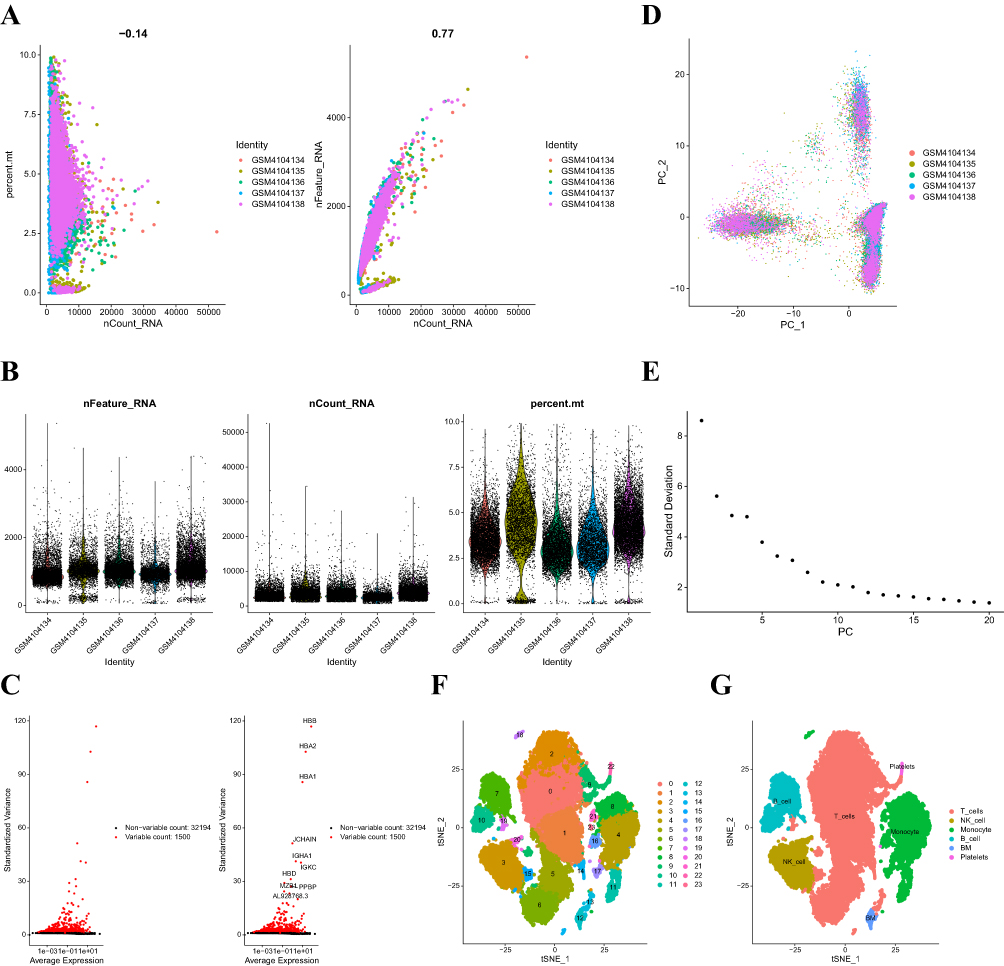 |
Figure 2 (A) The graph on the left shows the relationship between cell sequencing depth and mitochondrial content. The graph on the right shows the relationship between sequencing depth and gene count. The two are positively correlated. (B) Single-cell quality control showing the cell count, gene count, and sequencing depth for each sample. (C) Characteristic variance plots for genes that differ significantly between cells. (D) PCA is shown as well as the distribution of PCs, with dots representing cells and colors representing samples. (E) Ranking plot of variance for each PC. (F) Cells were categorized into 24 clusters by the tSNE algorithm based on the important components available in PCA. (G) Cellular annotation profiles of the 24 clusters, which were annotated into 6 cell types: T cells, NK cells, monocytes, B cells, BM and platelets. |
Single-Cell Data Cell Subpopulation Annotation
The R program SingleR was used in this study to annotate each subtype, and 24 clusters were assigned to the six cell types: T cells, NK cells, monocytes, B cells, BMs, and platelets (Figure 2G). We then used the FindAllMarkers program (cellMarkers in Supplementary Materials) to retrieve the marker genes unique to each cell subtype from the single-cell data.
Analysis of Intercellular Communication
Using the CellChat package, we examined ligand‒receptor connections to identify features in single-cell expression profiles. We found that Monocyte -> T_cells, Monocyte -> NK_cell, and Monocyte -> B_cell interacted with LGALS9–CD45 with high interaction scores (Figure 3A). Ultimately, our statistical analysis revealed that monocytes and B cells may interact with other cells more closely (Figure 3B). As a result, we ultimately selected monocyte marker genes as the candidate gene set. Detailed results of the single-cell and intercellular communication analyses can be found in Supplementary Materials net_lr.
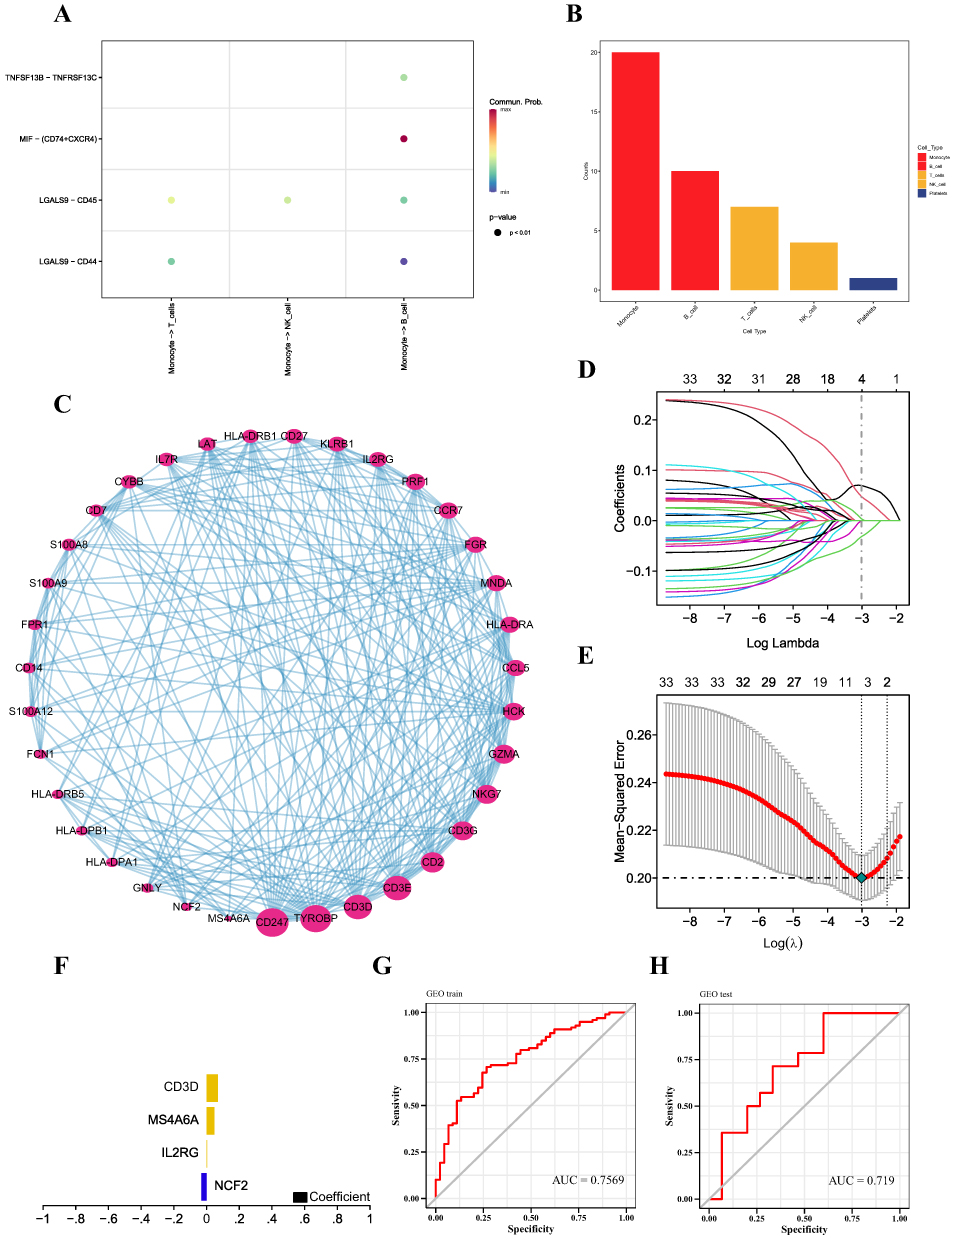 |
Figure 3 (A) Bubble diagram of receptor and ligand information between cells. (B) Comparison of the total numbers of interactions of communication networks between cells. Decreasing from left to right, the strongest being Monocyte. (C) Protein interaction networks based on the GeneMANIA database were visualized by Cytoscape software. (D) Distribution of LASSO coefficients for differentially expressed genes. (E) Tenfold cross-validation of tuning parameter selection in LASSO models. (F) Histogram of LASSO coefficients for the four key genes. (G and H) Predictive efficacy of the training and validation sets. |
Construction and Verification of the MS Diagnostic Model
We obtained the protein interactions of monocyte marker genes from the STRING database. The marker genes of monocytes were classified into clusters by MCODE analysis, and we followed up the clusters with the highest scores and visualized them using Cytoscape (Figure 3C). We downloaded the GSE17048 dataset associated with MS from the GEO database as a training set, which included expression profiling data from a total of 144 patients, with a control group (n=45) and a disease group (n=99). The validation set for this study was the GSE21942 dataset. The feature screening process used LASSO regression to determine the marker genes of the clusters with the highest MCODE scores. The findings demonstrated that a total of four genes were found to be feature genes by LASSO regression; these genes were then utilized as important genes in the next analysis and to build the prediction model (Figure 3D–F). The model equation was as follows:  . With an AUC of 0.7569, the results demonstrated the strong diagnostic efficiency of the prediction model built using the four genes (Figure 3G). The diagnostic model was further validated using an external dataset; the results demonstrated the model’s good stability, with the validation set’s AUC measuring 0.719 (Figure 3H). Information on the performance metrics of the predictive model is detailed in Table S1. To gain additional insight into the functions of these four genes, the expression of these genes was detected in whole-blood samples from MS patients using RT‒qPCR. When comparing the whole blood from MS patients to that from healthy controls, it was discovered that NCF2 was dramatically downregulated, whereas CD3D and MS4A6A were significantly upregulated (Figure 4). CD3D, IL2RG and MS4A6A showed significant upregulation when compared with the group of NMO patients. These results imply that these four hub genes can be utilized as trustworthy biomarkers for MS diagnosis, even though the sample size may be limited, and that the diagnostic prediction model developed in this work can effectively discriminate MS patients from healthy controls and NMO patients. The expression profiles of the essential genes in T cells, NK cells, monocytes, B cells, BM, and platelets were visualized after we examined the expression levels of the key genes in individual cells (Figure 5A and B).
 |
Figure 4 Differential expression analysis of CD3D, L2RG, MS4A6A and NCF2 in MS patient whole blood using RT‒qPCR assay. *P < 0.05, **P < 0.01, ***P < 0.001. Abbreviations: HC, healthy control; MS, multiple sclerosis; NMO, neuromyelitis optica. |
 |
Figure 5 (A and B) Expression profiles of the key genes in cells. (C) Relative percentages of 22 immune cell subpopulations. (D) Pearson correlation between the 22 immune cell subpopulations; blue indicates a positive correlation, and red indicates a positive correlation. (E) Differences in immune cell content between control and disease samples. *P < 0.05, **P < 0.01, ***P < 0.001. |
Immunoinfiltration Analysis of Key Genes
Fibroblasts, immune cells, extracellular matrix, different growth factors, inflammatory agents, and unique physicochemical characteristics, among other factors, make up the majority of the microenvironment. The microenvironment has a major impact on a disease’s diagnosis, prognosis, and responsiveness to clinical treatment. An immune cell correlation heatmap was constructed, and the distribution of immune infiltration levels was determined (Figure 5C and D). When compared to samples from the normal group, the MS group’s T-cell CD4 memory resting levels were observably higher (Figure 5E). After conducting additional research, we discovered that there was a strong correlation between a number of important genes and immune cells (Figure 6A–D). We also examined the relationships between the four important genes and other immunological variables, such as chemokines, receptors, immunostimulatory factors, and immunosuppressive factors. According to these findings, the major genes were crucial for the immunological microenvironment and were strongly correlated with the degree of immune cell infiltration (Figure 6E–I).
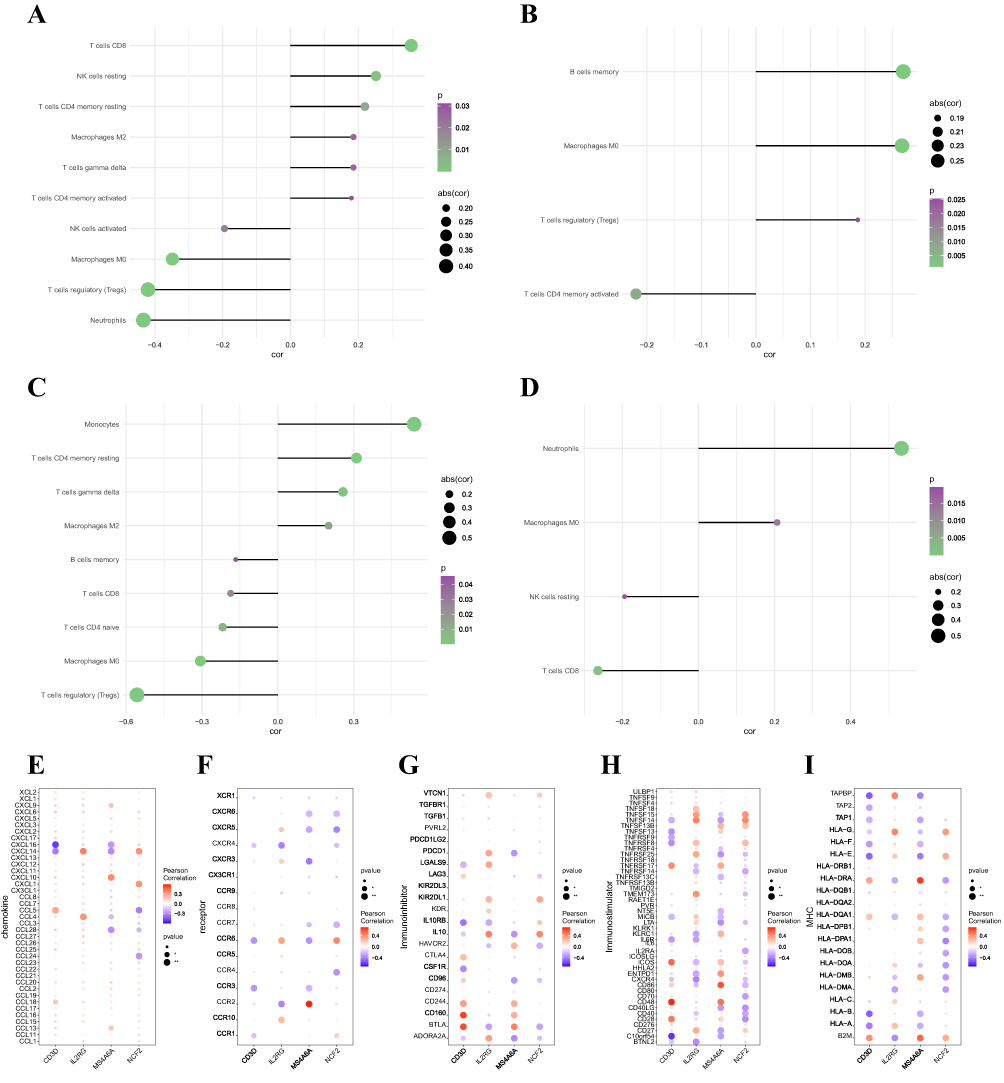 |
Figure 6 (A) Correlation between cibersort and CD3D expression. (B) Correlation between cibersort and IL2RG expression. (C) Correlation between cibersort and MS4A6A expression. (D) Correlation between cibersort and NCF2 expression. (E–I) Correlations of key genes with chemokines, immunoinhibitors, immunostimulators, MHC and receptors. *P < 0.05, **P < 0.01. |
Signaling Pathways Involving the Key Genes
The specific signaling pathways associated with the four key genes were then examined to identify potential molecular processes by which the key genes influence the course of MS. GSEA results showed that CD3D was enriched in the signaling pathways INSULIN_SIGNALING_PATHWAY, DNA_REPLICATION, and MAPK_SIGNALING_PATHWAY (Figure 7A); IL2RG was enriched in signaling pathways such as VEGF_SIGNALING_PATHWAY, P53_SIGNALING_PATHWAY, and NOTCH_SIGNALING_PATHWAY (Figure 7B); MS4A6A was enriched in signaling pathways such as WNT_SIGNALING_ PATHWAY, JAK_STAT_SIGNALING_PATHWAY, GLUTATHIONE_METABOLISM and other signaling pathways (Figure 7C); NCF2 was enriched in CELL_CYCLE, ALLOGRAFT_REJECTION, STARCH_AND_SUCROSE_ METABOLISM and other signaling pathways (Figure 7D); in addition, GSVA analysis showed that high expression of CD3D was enriched in OXIDATIVE_PHOSPHORYLATION, MYC_TARGETS_V1 and other signaling pathways (Figure 7E); high expression of IL2RG was enriched in ANGIOGENESIS, P53_ PATHWAY and other signaling pathways (Figure 7F); high expression of MS4A6A was enriched in MYC_TARGETS_V1, BILE_ACID_METABOLISM and other signaling pathways (Figure 7G); high expression of NCF2 was enriched in IL6_JAK_STAT3_SIGNALING, G2M_CHECKPOINT and other signaling pathways (Figure 7H). These results indicate that the expression of these key genes might affect how MS progresses via these channels.
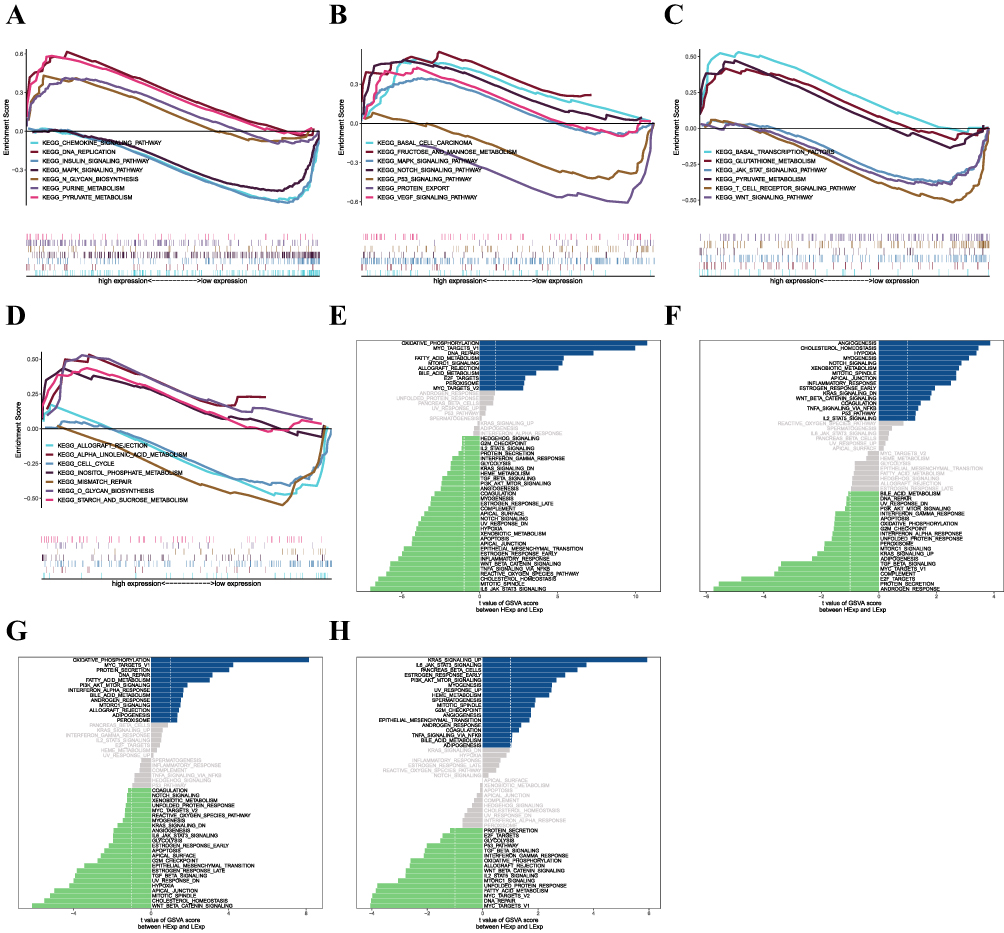 |
Figure 7 (A–D) Key genes involved in the GO and KEGG signaling pathways, as well as pathway regulation and genes involved. Panels a-d show CD3D, IL2RG, MS4A6A, and NCF2, respectively. (E–H) GSVA analysis of key genes. Signaling pathways involved in high levels of gene expression are shown in blue, green indicates signaling pathways involved in low levels of gene expression, and the background gene set is a hallmark. Figures e-h show CD3D, IL2RG, MS4A6A, and NCF2, respectively. |
miRNA Regulatory Networks
We used the miRcode database for miRNA target prediction for four important genes to build an miRNA‒mRNA network. Cytoscape was used to visualize the results, which included 70 important gene-associated target miRNAs with 123 connection pairs (Figure 8A).
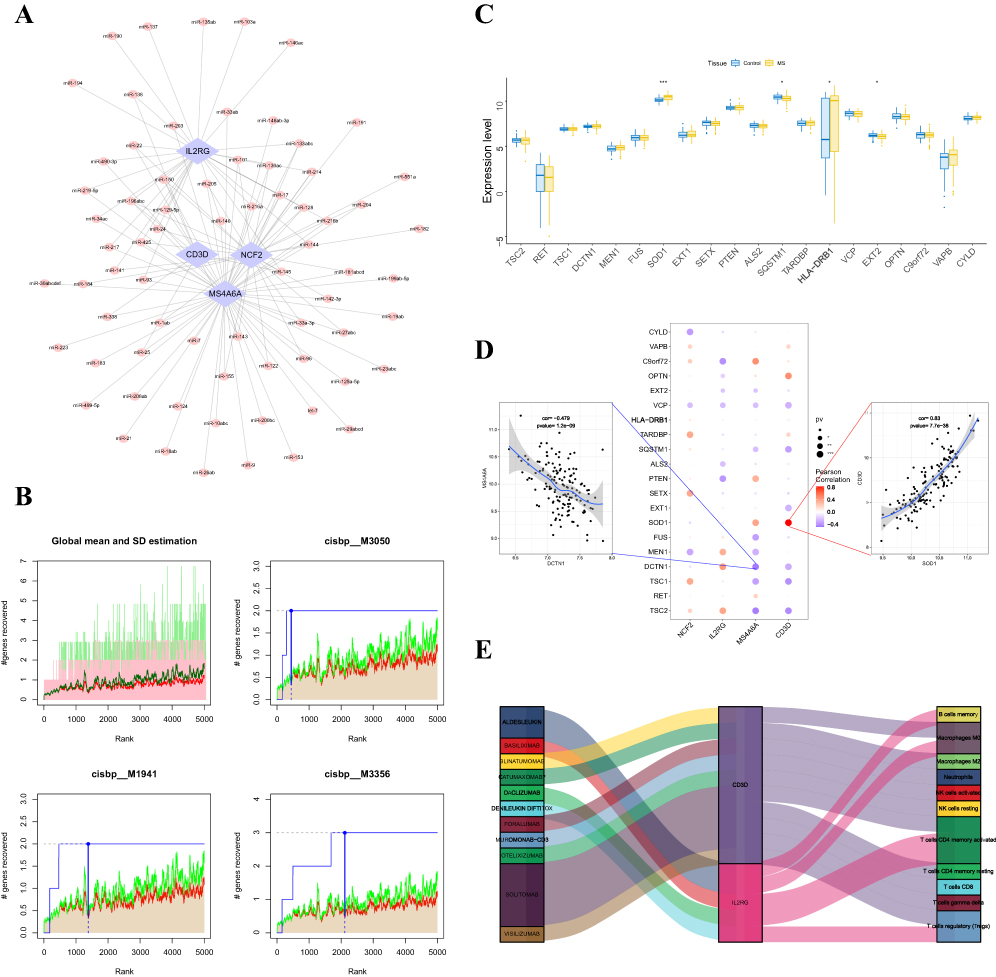 |
Figure 8 (A) The miRNA network of the key genes; light blue indicates mRNAs, and pink indicates miRNAs. (B) The figure shows the base sequence with a higher AUC, where the red line is the mean of the recovery curve for each motif, the green line is the mean+standard deviation, and the blue line is the recovery curve for the current motif. The maximum distance point between the current motif and the green curve is (mean+SD). (C) Differences in the expression profiles of disease-regulated genes; blue indicates control patients, yellow indicates patients with MS. (D) Pearson correlation analysis of key genes with disease genes; blue indicates a negative correlation, and red indicates a positive correlation. (E) Potential therapeutic drugs to target the key genes. *P < 0.05, **P < 0.01, ***P < 0.001. |
Analysis of Key Gene-Related Transcriptional Regulation
Using the four key genes as the basis for our investigation, we discovered that they were controlled by several transcription factors and other shared pathways. Consequently, enrichment analysis was carried out utilizing cumulative recovery curves for these transcription factors. A selection study of significant genes and motif–TF annotation revealed that cisbp__M3050 was the motif with the greatest normalized enrichment score (NES: 7.82). Each of the important gene-enriched motifs and the matching transcription factors are displayed (Figure 8B).
Correlation of Key Genes with Disease-Regulating Genes
Using the GeneCards database (https://www.genecards.org/), we were able to identify the genes associated with disease regulation in MS. After examining the expression levels of the top 20 genes based on their relevance scores, we discovered that there were differences in SOD1, SQSTM1, HLA-DRB1, and EXT2 expression between the two patient groups (Figure 8C). Furthermore, strong correlations were observed between the expression levels of disease-regulated genes and four important genes (Figure 8D), with CD3D and SOD1 being significantly positively correlated (r=0.83) and MS4A6A and DCTN1 being significantly negatively correlated (r= −0.479).
Drug Predictions
DGIdb was used to analyze drugs that may interact with the four key genes (NCF2, IL2RG, MS4A6A, and CD3D). DGIdb analysis revealed that 11 drugs interacted with IL2RG and CD3D, which may help to develop new targets for therapy (Figure 8E).
Discussion
MS is an acquired disabling disease in young people30,31 and is increasingly being diagnosed in children and adolescents.32 MS is also an autoimmune disease, the etiology of which is unclear, but a variety of immune cells are involved, primarily autoreactive CD4+ T cells; there is also recent evidence that B cells and monocytes are involved.33–38 Among them, monocytes and T cells are also recognized as initiators of MS inflammation.39,40 Upregulation of the expression levels of monocyte markers such as CD40, CD86, and HLA-DR3 and inflammatory cytokines such as interleukin-12 (IL-12) can lead to the stimulation and sustained activation of inflammatory T helper type 1 (Th1) cells and T helper 17 (Th17) cells, which are key drivers of inflammation during MS.41 Therefore, strategies involving targeting these immune cells, a variety of lymphocyte blockers, B-cell-targeted therapies, and monoclonal antibodies have been used to treat MS.31,42–44 However, due to the lack of valuable biomarkers and the confusion with many similar diseases, the subsequent phase of the disease’s treatment may be impacted by an unsatisfactory MS diagnosis.
The objective of this investigation was to identify potential MS diagnostic biomarkers and investigate the impact of immune infiltration on the disease course. Therefore, we first used the single-cell dataset GSE13826 of MS to analyze and screen the marker genes in each type of cell and then performed ligand‒receptor interaction analysis to observe the degree of activity and impact of each type of cell in the context of the disease. Finally, we chose the marker genes of monocytes as the candidate gene set. Subsequently, the GSE17048 dataset was selected as the training set, and four genes, CD3D, MS4A6A, IL2RG and NCF2, were found to be diagnostic for MS through the LASSO model and AUCs. The prediction model constructed from these four genes was verified to have good diagnostic efficacy through the GSE21942 dataset.
The TCR/CD3 complex, which is crucial for T-cell antigen recognition and signaling, is formed by the combination of the protein products encoded by the CD3D, CD3E, CD3G, and CD3Z genes.45–49 CD3D also has its own specific function in thymocyte differentiation. Without a functioning TCR/CD3 complex, thymocytes cannot differentiate properly.50 IL2RG is a gene encoding the IL2 gamma receptor IL2Rγ, which mediates proliferative signaling through the JAK/Stat pathway.51 IL-2Rγ is a receptor for not only IL-2 but also IL-4, IL-7, IL-15, and IL-21 and regulates T cells, B cells, and NK cells.52 MS4A6A is a member of the transmembrane 4A gene family and may be involved in signaling. MS4A6A has been implicated in cortical and hippocampal atrophy,53 aging and the development of neurodegenerative diseases. MS4A6A is involved in neurological disorders such as Alzheimer’s disease,54 Parkinson’s disease55 and gliomas.56 Neutrophil cytosolic factor 2 (NCF2) is one of the five NADPH oxidase components responsible for superoxide production. NCF2 has been demonstrated in an increasing number of studies to be a useful biomarker for several illnesses, such as acute myocardial infarction (AMI),57 chronic granulomatous disease (CGD),58 systemic lupus erythematosus (SLE),59 and hepatocellular carcinoma (HCC).60
The immune microenvironment contains complex cell populations. The four key genes we identified in this study have also been reported to correlate with the immune microenvironment in many other reports. CD3D is strongly associated with immune-related pathways and is related to lymphocyte infiltration and immune checkpoints. The association of CD3D with immune infiltration and immunotherapy has been reported in a variety of cancer types, including breast cancer,61 muscle-invasive bladder cancer (MIBC),62 gastric cancer,49 squamous cell carcinoma of the head and neck,46 and ovarian cancer.63 Moreover, in uveal melanoma, CD3D expression was associated with methylation. There were significant correlations between CD3D and four key immune cells, including follicular helper T cells, activated NK cells, gamma delta T cells, and CD8+ T cells, during the development of this tumor.64 However, in most tumors, CD3D manifests as a clinical indicator suggesting a good prognosis; the lower the CD3D expression is, the worse the prognosis.47,49,65 We speculate that this association may be related to the depletion of immune cells. However, in autoimmune diseases such as MS, there are many inflammatory lesions that cause inflammation-associated oxidative bursts, and oxidative stress promotes tissue damage. During inflammation and tissue damage, cells activate transcription factors that upregulate antioxidant proteins such as superoxide dismutase (SOD).66 One study showed that mitochondrial lipid peroxidation levels were significantly higher in MS patients than in controls, and mitochondrial SOD1 protein expression was significantly upregulated.67 We found that the expression levels of SOD1, SQSTM1, HLA-DRB1, and EXT2, genes related to the disease regulation of MS in the GeneCards database (https://www.genecards.org/), differed between the two groups of patients. Our results showed that the gene expression levels of CD3D and SOD1 were significantly upregulated in MS patients, and the two were positively correlated (r=0.83), but the mechanism of their relationship and how the SOD1 gene and protein levels are associated remain to be investigated. In gliomas, MS4A6A has a unique expression profile in macrophages in the immune microenvironment, showing hypomethylation and overexpression at both the transcriptional and protein levels, effects that correlate with reduced overall survival (OS).56 Our study showed that MS4A6A was overexpressed in MS patients and significantly negatively correlated with DCTN1 (r= −0.479). Mutations in DCTN1 are often recognized as etiological factors in amyotrophic lateral sclerosis (ALS) and frontotemporal dementia (FTD).68 Although MS, FTD and ALS share common features of neurodegeneration, the DCTN1 gene has still been reported to possibly not affect MS neurodegeneration. Therefore, perhaps this certain link between MS4A6A and DCTN1 exists, but whether and how exactly it affects MS progression and the types of lesions produced deserve further exploration.69 In addition, IL2RG in ovarian cancer63 and melanoma70 and NCF2 in hepatocellular carcinoma60 have been shown to be potential prognostic factors and indicators of immune infiltration.
In subsequent key gene immune infiltration analyses, we used CIBERSORT (Cell-type Identification By Estimating Relative Subsets Of RNA Transcripts) to detect the distribution of immune infiltration levels and constructed immune cell correlation heatmaps that showed significantly higher levels of resting CD4 memory T cells in the disease group samples. These findings also confirmed that CD4+ T cells play a pivotal role in MS. All four hub genes were suggested to be significantly associated with a variety of immune cells. For example, CD3D and NCF2 were both significantly correlated with CD8 T cells and neutrophils, CD3D was significantly positively correlated with CD8 T cells and negatively correlated with neutrophils, and NCF2 showed the opposite association; MS4A6A showed significant positive correlations with monocytes and resting memory CD4 T cells. IL2RG showed a significant positive correlation with B-cell memory and a significant negative correlation with T-cell CD4 memory activation, but they were all associated with M0 macrophages. MS4A6A was negatively correlated with M0 macrophages, and IL2RG showed the opposite association. Several genes, such as CD3D, MS4A6A, and IL2RG, showed some correlation with regulatory T cells (Tregs), with CD3D and MS4A6A being negatively correlated with Tregs and IL2RG being positively correlated with Tregs. Our findings indicate that these four key genes are actively involved in the immune-inflammatory response and are associated with a wide range of important immune cells, which may play a role in the development of MS and confirm that MS is a multicellular-influenced disease.
In our results, the analysis of the relationships between the key genes and immune checkpoints and immune modulators revealed that each of the 11 chemokines and receptors showed significant correlations with the four key genes, including chemokines such as CXCL9, CXCL16, CXCL14, CXCL10, CXCL1, CCL5, CCL4, CCL28, CCL24, CCL18 and CCL13 and chemokine receptors such as CXCR6, CXCR5, CXCR4, CXCR3, CCR7, CCR6, CCR4, CCR3, CCR2, CCR10, and CCR1. These checkpoint and modulator proteins are closely related to MS and can indirectly influence disease progression and activity. Chemokines are considered biomarkers of disease activity in MS patients. Their aberrant concentrations in peripheral blood, cerebrospinal fluid, and lesions in the central nervous systems of MS patients are correlated with the disease’s activity and clinical characteristics. Many DMTs also improve the course of the disease by adjusting chemokine concentrations to normal levels.71 The serum level of CXCL16 can reflect disease activity in MS and may be a new biomarker and potential predictor of MS disease activity.72 Serum CCL5 chemokine levels have also been recognized as an emerging biomarker for MS. CCL5 plays a role in the etiology of MS and may stimulate the acute-phase recruitment of inflammatory cells.73 Elevated IL-8, IL-12, IL-17, CCL3, and CXCL10 cerebrospinal fluid levels can also indicate active disease.74 However, we also found that CCL24, CCL28, and CXCL14 are all less reported in MS, but we believe that their roles should not be overlooked. CCL24, a chemokine secreted by immune cells and epithelial cells, plays a role in systemic sclerosis (SSc) by promoting the transport of immune cells and the activation of profibrotic cells.75 Blockade of CCL28 was reported to inhibit tumor growth in pancreatic cancer through tumor cell-intrinsic and extrinsic mechanisms.76 CXCL14 plays important roles in the infiltration of immune cells involved in cancer, the immune response, and epithelial cell proliferation and migration. It may play opposite roles in different cancers but is still a promising target for cancer immunotherapy.77 Therefore, our future goal is to assess the specific roles of these chemokines in MS.
We analyzed the correlations between key genes and immunosuppressive and immunostimulatory factors. The results showed that 16 inhibitory and 31 stimulatory factors were significantly correlated with the key genes we identified, including a variety of costimulatory signals, such as the PD-1, BTLA, CTLA-4, ICOS, CD40, and CD28/B7 signaling pathways. Clinical and pathologic findings in humans have shown that CD40L and CD40 are involved in MS. In people with RRMS, inhibiting CD40L is safe and well tolerated.78 PD-1 signaling contributes to CNS illnesses such as brain tumors, Alzheimer’s disease, ischemic stroke, spinal cord injury, MS, cognitive function, and pain. It accomplishes this by inhibiting the CNS immune response through resident microglia and infiltrating peripheral immune cells.79 In particular, it plays a key role in MS by inducing neuroprotective responses and inhibiting T-cell activation and neurodegeneration.80 ICOS is also involved in both MS and EAE pathologies and is considered a marker of disease severity, progression and prognosis. Intervention in the ICOS/ICOSL pathway at different stages of disease development can influence disease progression in different directions.81 All of these signaling pathways are inextricably linked to MS, confirming that the four key genes we identified are importantly linked to MS. Meanwhile, IL-10,82,83 BTLA,84 TNFSF14,85 ADOR2A,86 ICOS,81 and CD8687 were associated with all 4 key genes and were all reported to play roles in the pathogenesis of probable MS. These results support the possibility that we can target the four key genes, CD3D, IL2RG, MS4A6A, and NCF2 to influence their upstream or downstream MS-associated immune factors to achieve therapeutic effects, providing a new idea for intervention therapy for MS. In addition, we showed that TNFRSF17 is a noteworthy immunostimulatory factor that is associated with several key genes. TNFRSF17 is mainly expressed on the surfaces of mature B cells and plasma cells and plays important roles in the maturation and autoimmune response of B cells.88 There are well-established B-cell therapies for MS, such as rituximab and ocrelizumab.89 Perhaps new targeted B-cell drugs can be developed against TNFRSF17 in autoimmune diseases such as MS.
A highly polymorphic set of genes known as MHC is largely responsible for the immune system’s regular operation. Studies have shown that class II risk alleles predominate in the hereditary risk of MS, whereas class I alleles primarily drive protective signaling.90 In particular, HLA-DRB5*0101-HLA-DRB1*1501-HLA-DQA1*0102-HLA-DQB1*0602 haplotypes (hereafter DR2) in the MHC class II region dominate the genetic contribution to MS risk.91 Our results show that some MHC alleles, including HLA-G, HLA-E, HLA-DRA, HLA-DQA1, and B2M, were significantly associated with all four of the key genes we identified, which could provide a new focus for the future diagnosis and treatment of MS.
We then examined the particular signaling pathways connected to the four key genes to uncover the underlying biological mechanisms of MS progression. GSEA pathway enrichment analysis showed that CD3D was enriched in the MAPK signaling pathway, which is associated with cell proliferation, stress, inflammation, differentiation, transformation, and apoptosis; IL2RG was enriched in the VEGF signaling pathway, which plays important roles in vasculogenesis and angiogenesis; MS4A6A is enriched in the JAK_STAT signaling pathway, which is involved in many important biological processes, such as cell growth, differentiation, apoptosis, and immune regulation; and NCF2 is enriched in the cell cycle. In addition, GSVA showed that high expression of CD3D was enriched in oxidative phosphorylation; high expression of IL2RG was enriched in angiogenesis; high expression of MS4A6A was enriched in genes in cell cycle-related pathways (such as MYC_targets_V1); and high expression of NCF2 was enriched in the IL6/JAK2/STAT3 signaling pathway and the cell cycle. Therefore, the results of our study suggest that key genes may influence MS progression through these pathways. Inflammation-related oxidative bursts and immunomodulation play roles in MS.
We also obtained miRNA target predictions associated with the four key genes through bioinformatics analysis, including 70 miRNA key gene-related target miRNAs and 123 relationship pairs, providing new ideas for MS treatment. Meanwhile, our constructed regulatory network of key gene-related transcription factors (TFs) showed that they were coregulated by multiple transcription factors, including cisbp__M3050, the motif with the highest normalized enrichment score. This may be a potential binding site for TFs, and the relevance of this result can be assessed in a future study.
Limitations
Although we identified potential biomarkers associated with MS occurrence and constructed predictive models using biological information technology, our study has some shortcomings and limitations. We did not differentiate between clinical subtypes of MS subtypes, including PPMS, SPMS, RRMS, and RPMS, and lacked CIS cases or more patients with other neurological disorders that constitute a differential diagnosis of MS. We also did not consider factors such as the presence of other health states in patients, which influenced the identification of diagnostic biomarkers in the sample, and our sample lacked clinical follow-up information and was small in size. Finally, the model constructed was only for patients with MS. Therefore, there is a need to further increase the sample size for this study and to conduct more clinical or basic experimental studies to corroborate the accuracy of the model.
Conclusion
In summary, we systematically analyzed the gene expression profiles of 195 blood samples. The cell types that were more valuable in MS were identified by single-cell analysis, which led to the construction of key gene profiles involving multiple important biological pathways in MS. Our prediction model constructed by LASSO regression contained four key genes, including CD3D, IL2RG, MS4A6A, and NCF2, and had AUC values of 0.7569 and 0.719 in the test and validation sets, respectively, compared to healthy controls. These genes, also described for the first time in MS, can be evaluated in blood samples; thus, they are easy to detect and can contribute to the differential diagnosis between MS and NMO. However, there are some limitations that need to be further explored and corrected, such as whether the differences in these four genes can further distinguish MS clinical typing and staging and whether they can be differentiated from other autoimmune diseases of the central nervous system, which will be a focus of future studies.
Supplementary Materials
Additional data and tables related to our findings can be found in the (Supplementary Materials). Any questions or requests for additional supplements can be addressed to our corresponding author.
Data Sharing Statement
The data used for the analysis of this study are publicly available. All data can be found in the NCBI GEO (https://wwwncbinmnihgov/geo/), STRING (https://string-db.org/), GeneCards (https://www.genecards.org/), miRcode (http://www.mircode.org/), DGIdb (https://www.dgidb.org), and Molecular signatures (https://www.gsea-msigdb.org/) databases.
Acknowledgments
We thank all contributors who uploaded usable data to the NCBI GEO, STRING, GeneCards, miRcode, DGIdb, and Molecular signatures databases and the platforms that provide publicly available data.
Funding
This work is supported by grants from the National Natural Science Foundation of China (82371365), the Jiangsu Province Key Research and Development Program (Social Development) (BE2019666), the Natural Science Foundation of Jiangsu Province (BK20211075), the Chen Shen Collaborative Innovation Center, Soochow University (Horizontal Research Project) (H230028), the Changzhou Sci&Tech Program (CJ20220001), and the Changzhou Health and Youth Talent Training Project (CZQM2023029).
Disclosure
We declare that all authors have no conflicts of interest in this work.
References
1. Ransohoff RM, Hafler DA, Lucchinetti CF. Multiple sclerosis—a quiet revolution. Nat Rev Neurol. 2015;11(3):134–142. doi:10.1038/nrneurol.2015.14
2. Dobson R, Giovannoni G. Multiple sclerosis – a review. Eur J Neurol. 2018;26(1):27–40. doi:10.1111/ene.13819
3. Noseworthy JH, Lucchinetti C, Rodriguez M, Weinshenker BG. Multiple sclerosis. N Engl J Med. 2000;343(13):938–952. doi:10.1056/NEJM200009283431307
4. Scalfari A, Neuhaus A, Degenhardt A, et al. The natural history of multiple sclerosis, a geographically based study 10: relapses and long-term disability. Brain. 2010;133(7):1914–1929. doi:10.1093/brain/awq118
5. Antel J, Antel S, Caramanos Z, Arnold DL, Kuhlmann T. Primary progressive multiple sclerosis: part of the MS disease spectrum or separate disease entity? Acta Neuropathol. 2012;123(5):627–638. doi:10.1007/s00401-012-0953-0
6. Noseworthy N, Bass BH, Vandervoort MK, et al. The prevalence of primary Sjögren’s syndrome in a multiple sclerosis population. Ann Neurol. 1989;25(1):95–98. doi:10.1002/ana.410250117
7. Thompson AJ, Baranzini SE, Geurts J, Hemmer B, Ciccarelli O. Multiple sclerosis. Lancet. 2018;391(10130):1622–1636. doi:10.1016/S0140-6736(18)30481-1
8. Brownlee WJ, Hardy TA, Fazekas F, Miller DH. Diagnosis of multiple sclerosis: progress and challenges. Lancet. 2017;389(10076):1336–1346. doi:10.1016/S0140-6736(16)30959-X
9. Yamout B, Alroughani R. Multiple sclerosis. Semin Neurol. 2018;38(02):212–225. doi:10.1055/s-0038-1649502
10. Wallin MT, Culpepper WJ, Nichols E, et al. Global, regional, and national burden of multiple sclerosis 1990–2016: a systematic analysis for the Global Burden of Disease Study 2016. Lancet Neurol. 2019;18(3):269–285. doi:10.1016/S1474-4422(18)30443-5
11. Bar-Or A, Li R. Cellular immunology of relapsing multiple sclerosis: interactions, checks, and balances. Lancet Neurol. 2021;20(6):470–483. doi:10.1016/S1474-4422(21)00063-6
12. Fischer MT, Sharma R, Lim JL, et al. NADPH oxidase expression in active multiple sclerosis lesions in relation to oxidative tissue damage and mitochondrial injury. Brain. 2012;135(3):886–899. doi:10.1093/brain/aws012
13. Campbell GR, Ziabreva I, Reeve AK, et al. Mitochondrial DNA deletions and neurodegeneration in multiple sclerosis. Ann Neurol. 2010;69(3):481–492.
14. Bauer J, Elger CE, Hans VH, et al. Astrocytes are a specific immunological target in Rasmussen’s encephalitis. Ann Neurol. 2007;62(1):67–80. doi:10.1002/ana.21148
15. Amin HC, Hersh CM. Updates and advances in multiple sclerosis neurotherapeutic. Neurodegener Dis Manag. 2023;13(1):47–70. doi:10.2217/nmt-2021-0058
16. Tobin WO. Early diagnosis and treatment are associated with improved outcomes in patients with multiple sclerosis. Neurology. 2021;97(17):799–800. doi:10.1212/WNL.0000000000012738
17. Thouvenot E. Multiple sclerosis biomarkers: helping the diagnosis? Rev Neurol. 2018;174(6):364–371. doi:10.1016/j.neurol.2018.04.002
18. Hephzibah Cathryn R, Udhaya Kumar S, Younes S, Zayed H, George Priya Doss C. A review of bioinformatics tools and web servers in different microarray platforms used in cancer research. Protein Interact Netw. 2022;131:85–164.
19. Udhaya Kumar S, Thirumal Kumar D, Bithia R, et al. Analysis of differentially expressed genes and molecular pathways in familial hypercholesterolemia involved in atherosclerosis: a systematic and bioinformatics approach. Front Genetics;2020;11:11. doi:10.3389/fgene.2020.00011
20. Cao Y, Qiu Y, Tu G, Yang C. Single-cell RNA sequencing in immunology. Curr Genomics. 2020;21(8):564–575. doi:10.2174/1389202921999201020203249
21. Huang X, Liu S, Wu L, Jiang M, Hou Y. High throughput single cell RNA sequencing, bioinformatics analysis and applications. Single Cell Biomed. 2018;2018:33–43.
22. T R. The lasso method for variable selection in the Cox model. Stat Med. 1997;16(4):385–395. doi:10.1002/(SICI)1097-0258(19970228)16:4<385::AID-SIM380>3.0.CO;2-3
23. Chen X, Zhang Q, Zhang Q. Predicting potential biomarkers and immune infiltration characteristics in heart failure. Math Biosci Eng. 2022;19(9):8671–8688. doi:10.3934/mbe.2022402
24. Li Z, Huang B, Yi W, et al. Identification of potential early diagnostic biomarkers of sepsis. J Inflamm Res. 2021;14:621–631. doi:10.2147/JIR.S298604
25. Liu Y, Wu M, Cao J, et al. Identification and verification of a glycolysis-related gene signature for gastric cancer. Ann Translat Med. 2022;10(18):1010. doi:10.21037/atm-22-3980
26. Zhang Y, Xia R, Lv M, et al. Machine-learning algorithm-based prediction of diagnostic gene biomarkers related to immune infiltration in patients with chronic obstructive pulmonary disease. Front Immunol. 2022;13:1.
27. Chen X, Zhang D, Jiang F, et al. Prognostic prediction using a stemness index-related signature in a cohort of gastric cancer. Front Mol Biosci. 2020;7. doi:10.3389/fmolb.2020.570702
28. Shommo G, Apolloni B. A holistic miRNA-mRNA module discovery. Non-Coding RNA Res. 2021;6(4):159–166. doi:10.1016/j.ncrna.2021.09.001
29. Ni W-J, Leng X-M. Dynamic miRNA–mRNA paradigms: new faces of miRNAs. Biochem Biophys Rep. 2015;4:337–341. doi:10.1016/j.bbrep.2015.10.011
30. Macaron G, Ontaneda D. Diagnosis and management of progressive multiple sclerosis. Biomedicines. 2019;7(3):56. doi:10.3390/biomedicines7030056
31. Doshi A, Chataway J. Multiple sclerosis, a treatable disease. Clin Med. 2016;16(Suppl 6):s53–s59. doi:10.7861/clinmedicine.16-6-s53
32. Banwell BL. Multiple sclerosis in children. Mult Scler Relat Disord. 2014;1:427–441.
33. Ajami B, Bennett JL, Krieger C, McNagny KM, Rossi FMV. Infiltrating monocytes trigger EAE progression, but do not contribute to the resident microglia pool. Nat Neurosci. 2011;14(9):1142–1149. doi:10.1038/nn.2887
34. Yamasaki R, Lu H, Butovsky O, et al. Differential roles of microglia and monocytes in the inflamed central nervous system. J Exp Med. 2014;211(8):1533–1549. doi:10.1084/jem.20132477
35. Dendrou CA, Fugger L, Friese MA. Immunopathology of multiple sclerosis. Nat Rev Immunol. 2015;15(9):545–558. doi:10.1038/nri3871
36. Nikbin B, Bonab MM, Khosravi F, Talebian F. Role of B cells in pathogenesis of multiple sclerosis. Neurobiol Mult Scler. 2007;2007:13–42.
37. Adriani M, Nytrova P, Mbogning C, et al. Monocyte NOTCH2 expression predicts IFN-β immunogenicity in multiple sclerosis patients. JCI Insight. 2018;3(11). doi:10.1172/jci.insight.99274
38. Sestito C, Brevé JJP, van Eggermond MCJA, et al. Monocyte-derived tissue transglutaminase in multiple sclerosis patients: reflecting an anti-inflammatory status and function of the cells? J Neuroinflammation. 2017;14(1). doi:10.1186/s12974-017-1035-y
39. Lucchinetti BW, Parisi J, Scheithauer B, Rodriguez M, Lassmann H. Heterogeneity of multiple sclerosis lesions: implications for the pathogenesis of demyelination. Ann Neurol. 2000;47(6):707–717. doi:10.1002/1531-8249(200006)47:6<707::AID-ANA3>3.0.CO;2-Q
40. Bar-Or A. Analyses of all matrix metalloproteinase members in leukocytes emphasize monocytes as major inflammatory mediators in multiple sclerosis. Brain. 2003;126(12):2738–2749. doi:10.1093/brain/awg285
41. Chuluundorj D, Harding SA, Abernethy D, La Flamme AC. Expansion and preferential activation of the CD14+CD16+ monocyte subset during multiple sclerosis. Immunol Cell Biol. 2014;92(6):509–517. doi:10.1038/icb.2014.15
42. Faissner S, Gold R. Efficacy and safety of multiple sclerosis drugs approved since 2018 and future developments. CNS Drugs. 2022;36(8):803–817. doi:10.1007/s40263-022-00939-9
43. de Sèze J, Maillart E, Gueguen A, et al. Anti-CD20 therapies in multiple sclerosis: from pathology to the clinic. Front Immunol. 2023;14. doi:10.3389/fimmu.2023.1004795
44. Elsbernd PM, Carter JL. Using monoclonal antibody therapies for multiple sclerosis: a review. Biologics. 2021;15:255–263.
45. Tian S, Huang P, Gu Y, et al. Systems biology analysis of the effect and mechanism of Qi-Jing-Sheng-Bai granule on leucopenia in mice. Front Pharmacol;2019;10:10. doi:10.3389/fphar.2019.00010
46. Wei Z, Shen Y, Zhou C, Cao Y, Deng H, Shen Z. CD3D: a prognostic biomarker associated with immune infiltration and immunotherapeutic response in head and neck squamous cell carcinoma. Bioengineered. 2022;13(5):13784–13800. doi:10.1080/21655979.2022.2084254
47. Yang Y, Zang Y, Zheng C, et al. CD3D is associated with immune checkpoints and predicts favorable clinical outcome in colon cancer. Immunotherapy. 2020;12(1):25–35. doi:10.2217/imt-2019-0145
48. Riemondy KA, Ransom M, Alderman C, et al. Recovery and analysis of transcriptome subsets from pooled single-cell RNA-seq libraries. Nucleic Acids Res. 2019;47(4):e20–e20. doi:10.1093/nar/gky1204
49. Yuan L, Xu J, Shi Y, et al. CD3D is an independent prognostic factor and correlates with immune infiltration in gastric cancer. Front Oncol. 2022;2022:12.
50. Doucey M-A, Goffin L, Naeher D, et al. CD3δ establishes a functional link between the T cell receptor and CD8. J Biol Chem. 2003;278(5):3257–3264. doi:10.1074/jbc.M208119200
51. Ayars M, O’Sullivan E, Macgregor-Das A, et al. IL2RG, identified as overexpressed by RNA-seq profiling of pancreatic intraepithelial neoplasia, mediates pancreatic cancer growth. Oncotarget. 2017;8(48):83370–83383. doi:10.18632/oncotarget.19848
52. Aliyari Z, Soleimanirad S, Sayyah Melli M, Tayefi Nasrabadi H, Nozad Charoudeh H. IL2rg cytokines enhance umbilical cord blood CD34+ cells differentiation to T cells. Adv Pharm Bull. 2015;5(Suppl 1):615–619. doi:10.15171/apb.2015.083
53. Hollingworth P, Harold D, Sims R, et al. Common variants at ABCA7, MS4A6A/MS4A4E, EPHA1, CD33 and CD2AP are associated with Alzheimer’s disease. Nature Genet. 2011;43(5):429–435. doi:10.1038/ng.803
54. Ma J, Zhang W, Tan L, et al. MS4A6A genotypes are associated with the atrophy rates of Alzheimer’s disease related brain structures. Oncotarget. 2016;7(37):58779–58788. doi:10.18632/oncotarget.9563
55. Fan K, Tang B-S, Wang Y-Q, et al. The GBA, DYRK1A and MS4A6A polymorphisms influence the age at onset of Chinese Parkinson patients. Neurosci Lett. 2016;621:133–136. doi:10.1016/j.neulet.2016.04.014
56. Zhang C, Liu H, Tan Y, et al. MS4A6A is a new prognostic biomarker produced by macrophages in glioma patients. Front Immunol. 2022;13:865020.
57. Wang Y, Zhang X, Duan M, et al. Identification of potential biomarkers associated with acute myocardial infarction by weighted gene coexpression network analysis. Oxid Med Cell Longev. 2021;2021:1–11.
58. Chou J, Hsu JT, Bainter W, Al-Attiyah R, Al-Herz W, Geha RS. A novel mutation in NCF2 associated with autoimmune disease and a solitary late-onset infection. Clin Immunol. 2015;161(2):128–130. doi:10.1016/j.clim.2015.08.003
59. McCarthy MI, Cunninghame Graham DS, Morris DL, et al. Association of NCF2, IKZF1, IRF8, IFIH1, and TYK2 with systemic lupus erythematosus. PLoS Genetics. 2011;7(10):1.
60. Huang N, Zhang J, Kuang S, et al. Role of NCF2 as a potential prognostic factor and immune infiltration indicator in hepatocellular carcinoma. Cancer Med. 2023;12(7):8991–9004. doi:10.1002/cam4.5597
61. Zhu Z, Ye W, Wu X, et al. Comprehensive analysis reveals a prognostic and therapeutic biomarker CD3D in the breast carcinoma microenvironment. Biosci Rep. 2021;41(1). doi:10.1042/BSR20202898
62. Jiang W, Zhu D, Wang C, Zhu Y. An immune relevant signature for predicting prognoses and immunotherapeutic responses in patients with muscle‐invasive bladder cancer (MIBC). Cancer Med. 2020;9(8):2774–2790. doi:10.1002/cam4.2942
63. Li Q, Yang Z, Ling X, et al. Correlation analysis of prognostic gene expression, tumor microenvironment, and tumor-infiltrating immune cells in ovarian cancer. Dis Markers. 2023;2023:1–24.
64. Zhang C, Wu S. Hypomethylation of CD3D promoter induces immune cell infiltration and supports malignant phenotypes in uveal melanoma. THE FASEB Journal. 2023;37(10). doi:10.1096/fj.202300505RR
65. Yang Q, Feng Z, Ding D, Kang C. CD3D and CD247 are the molecular targets of septic shock. Medicine. 2023;102(29):1.
66. Moezzi D, Dong Y, Jain RW, et al. Expression of antioxidant enzymes in lesions of multiple sclerosis and its models. Sci Rep. 2022;12(1). doi:10.1038/s41598-022-16840-w
67. Iñarrea P, Alarcia R, Alava MA, et al. Mitochondrial complex enzyme activities and cytochrome c expression changes in multiple sclerosis. Mol Neurobiol. 2013;49(1):1–9. doi:10.1007/s12035-013-8481-z
68. Chia R, Chiò A, Traynor BJ. Novel genes associated with amyotrophic lateral sclerosis: diagnostic and clinical implications. Lancet Neurol. 2018;17(1):94–102. doi:10.1016/S1474-4422(17)30401-5
69. Münch C, Meyer R, Linke P, et al. The p150 subunit of dynactin (DCTN1) gene in multiple sclerosis. Acta neurol Scand. 2007;116(4):231–234. doi:10.1111/j.1600-0404.2007.00884.x
70. Zhang C, Dang D, Cong L, Sun H, Cong X. Pivotal factors associated with the immunosuppressive tumor microenvironment and melanoma metastasis. Cancer Med. 2021;10(14):4710–4720. doi:10.1002/cam4.3963
71. Ghafouri-Fard S, Honarmand K, Taheri M. A comprehensive review on the role of chemokines in the pathogenesis of multiple sclerosis. Metab Brain Dis. 2021;36(3):375–406. doi:10.1007/s11011-020-00648-6
72. Villoslada P, Holmøy T, Løken-Amsrud KI, et al. Inflammation markers in multiple sclerosis: CXCL16 reflects and may also predict disease activity. PLoS One. 2013;8(9):1.
73. Szczuciński A, Losy J. CCL5, CXCL10 and CXCL11 chemokines in patients with active and stable relapsing-remitting multiple sclerosis. Neuroimmunomodulation. 2011;18(1):67–72. doi:10.1159/000317394
74. Tomioka R, Matsui M. Biomarkers for multiple sclerosis. Internal Medicine. 2014;53(5):361–365. doi:10.2169/internalmedicine.53.1246
75. Levy H, Gluschnaider U, Balbir-Gurman A. The role of CCL24 in systemic sclerosis. Rambam Maimonides Med J. 2023;14(3):e0016. doi:10.5041/RMMJ.10504
76. Yan J, Yuan P, Gui L, et al. CCL28 downregulation attenuates pancreatic cancer progression through tumor cell-intrinsic and -extrinsic mechanisms. Technol Cancer Res Treat. 2021;20:15330338211068958.
77. Gowhari Shabgah A, et al. Chemokine CXCL14; a double-edged sword in cancer development. Int Immunopharmacol. 2021;97:107681.
78. Fadul CE, Mao-Draayer Y, Ryan KA, et al. Safety and immune effects of blocking CD40 ligand in multiple sclerosis. Neurol Neuroimmunol Neuroinflammat. 2021;8(6). doi:10.1212/NXI.0000000000001096
79. Zhao J, Roberts A, Wang Z, Savage J, Ji -R-R. Emerging role of PD-1 in the central nervous system and brain diseases. Neurosci Bull. 2021;37(8):1188–1202. doi:10.1007/s12264-021-00683-y
80. Ibañez-Vega J, Vilchez C, Jimenez K, Guevara C, Burgos PI, Naves R. Cellular and molecular regulation of the programmed death-1/programmed death ligand system and its role in multiple sclerosis and other autoimmune diseases. J Autoimmun. 2021;123:102702.
81. Zhang X, Ge R, Chen H, et al. Follicular helper CD4+ T cells, follicular regulatory CD4+ T cells, and inducible costimulator and their roles in multiple sclerosis and experimental autoimmune encephalomyelitis. Mediators Inflammation. 2021;2021:1–10. doi:10.1155/2021/7393029
82. Xiang W, Xie C, Guan Y. The identification, development and therapeutic potential of IL-10-producing regulatory B cells in multiple sclerosis. J Neuroimmunol. 2021;354:577520.
83. Schönrich G, Abdelaziz MO, Raftery MJ. Epstein-Barr virus, interleukin-10 and multiple sclerosis: a ménage à trois. Front Immunol. 2022;13:1028972.
84. Piancone F, Saresella M, Marventano I, et al. B lymphocytes in multiple sclerosis: bregs and BTLA/CD272 expressing-CD19+ lymphocytes modulate disease severity. Sci Rep. 2016;6(1). doi:10.1038/srep29699
85. Zuccalà M, Barizzone N, Boggio E, et al. Genomic and functional evaluation of TNFSF14 in multiple sclerosis susceptibility. J Genet Genome. 2021;48(6):497–507. doi:10.1016/j.jgg.2021.03.017
86. Safarzadeh E, Jadidi-Niaragh F, Motallebnezhad M, Yousefi M. The role of adenosine and adenosine receptors in the immunopathogenesis of multiple sclerosis. Inflammation Res. 2016;65(7):511–520. doi:10.1007/s00011-016-0936-z
87. Wagner M, Sobczyński M, Karabon L, et al. Polymorphisms in CD28, CTLA-4, CD80 and CD86 genes may influence the risk of multiple sclerosis and its age of onset. J Neuroimmunol. 2015;288:79–86. doi:10.1016/j.jneuroim.2015.09.004
88. Mackay F, Ambrose C. The TNF family members BAFF and April: the growing complexity. Cytokine Growth Factor Rev. 2003;14(3–4):311–324. doi:10.1016/S1359-6101(03)00023-6
89. Melamed E, Lee MW. Multiple sclerosis and cancer: the Ying-Yang effect of disease modifying therapies. Front Immunol. 2020;10. doi:10.3389/fimmu.2019.02954
90. Lysandropoulos AP, Mavroudakis N, Pandolfo M, et al. HLA genotype as a marker of multiple sclerosis prognosis: a pilot study. J Neurol Sci. 2017;375:348–354. doi:10.1016/j.jns.2017.02.019
91. Lincoln MR, Ramagopalan SV, Chao MJ, et al. Epistasis among HLA-DRB1, HLA-DQA1, and HLA-DQB1 loci determines multiple sclerosis susceptibility. Proc Natl Acad Sci U S A. 2009;106(18):7542–7547. doi:10.1073/pnas.0812664106
 © 2024 The Author(s). This work is published and licensed by Dove Medical Press Limited. The
full terms of this license are available at https://www.dovepress.com/terms
and incorporate the Creative Commons Attribution
- Non Commercial (unported, 3.0) License.
By accessing the work you hereby accept the Terms. Non-commercial uses of the work are permitted
without any further permission from Dove Medical Press Limited, provided the work is properly
attributed. For permission for commercial use of this work, please see paragraphs 4.2 and 5 of our Terms.
© 2024 The Author(s). This work is published and licensed by Dove Medical Press Limited. The
full terms of this license are available at https://www.dovepress.com/terms
and incorporate the Creative Commons Attribution
- Non Commercial (unported, 3.0) License.
By accessing the work you hereby accept the Terms. Non-commercial uses of the work are permitted
without any further permission from Dove Medical Press Limited, provided the work is properly
attributed. For permission for commercial use of this work, please see paragraphs 4.2 and 5 of our Terms.
Recommended articles
Identifying Potential Effective Diagnostic and Prognostic Biomarkers in Sepsis by Bioinformatics Analysis and Validation
Huang X, Tan J, Chen X, Zhao L
International Journal of General Medicine 2022, 15:6055-6071
Published Date: 6 July 2022
GBP5 Identifies Immuno-Hot Tumors and Predicts the Therapeutic Response to Immunotherapy in NSCLC
Fan H, Shi Y, Wang H, Li Y, Mei J, Xu J, Liu C
International Journal of General Medicine 2023, 16:1757-1769
Published Date: 10 May 2023
PSMC2 is a Novel Prognostic Biomarker and Predicts Immunotherapeutic Responses: From Pancreatic Cancer to Pan-Cancer
Huang W, Qian Z, Shi Y, Zhang Z, Hou R, Mei J, Xu J, Ding J
Pharmacogenomics and Personalized Medicine 2023, 16:747-758
Published Date: 9 August 2023
Integrated Analysis of Immune Infiltration and Hub Pyroptosis-Related Genes for Multiple Sclerosis
Zhang S, Ma Y, Luo X, Xiao H, Cheng R, Jiang A, Qin X
Journal of Inflammation Research 2023, 16:4043-4059
Published Date: 13 September 2023
TCHH as a Novel Prognostic Biomarker for Patients with Gastric Cancer by Bioinformatics Analysis
Yu F, Zhao LX, Chu S
Clinical and Experimental Gastroenterology 2024, 17:61-74
Published Date: 26 February 2024