")
Back to Journals » Journal of Inflammation Research » Volume 16
Single-Cell RNA Sequencing Reveals Roles of Fibroblasts During Intestinal Injury and Repair in Rats with Severe Acute Pancreatitis
Authors Wang J, Xu C, Xu H, Wang R, Su T, Zhao S
Received 15 September 2023
Accepted for publication 3 December 2023
Published 12 December 2023 Volume 2023:16 Pages 6073—6086
DOI https://doi.org/10.2147/JIR.S436511
Checked for plagiarism Yes
Review by Single anonymous peer review
Peer reviewer comments 4
Editor who approved publication: Dr Tara Strutt
Jing Wang, Changqin Xu, Hongwei Xu, Ruixia Wang, Tong Su, Shulei Zhao
Department of Gastroenterology, Shandong Provincial Hospital Affiliated to Shandong First Medical University, Jinan, 250021, People’s Republic of China
Correspondence: Shulei Zhao, Department of Gastroenterology, Shandong Provincial Hospital Affiliated to Shandong First Medical University, 324 Jingwu Weiqi Road, Jinan, 250021, People’s Republic of China, Email [email protected]
Purpose: To explore the molecular mechanisms of intestinal injury and treatment by analyzing changes in cellular heterogeneity and composition in rat ileal tissue during injury and treatment processes.
Methods: We constructed a rat model of SAP and evaluated treatment with an injected of monoacylglycerol lipase (MAGL) inhibitor (JZL184) solution using three experimental groups: healthy male Sprague-Dawley (SD) rats injected with vehicle (CON), male SD SAP model rats injected with vehicle (SAP), and male SAP rats injected with JZL184. We obtained and prepared a single-cell suspension of ileal tissue of each rat for single-cell transcriptome sequencing.
Results: This project classified changes in cellular heterogeneity and composition in rat ileal tissue during SAP-induced intestinal injury and MAGL treatment. We found that the number of fibroblast clusters was decreased in the SAP group relative to the CON group, and increased after JZL184 treatment. Further analysis of differences in gene expression between cell clusters in each group reveals that fibroblasts had the greatest number of differentially expressed genes. Most notably, expression of genes involved in communication between cells was found to vary during SAP-induced intestinal injury and JZL184 treatment. Among these changes, the degree of difference in expression of genes involved in communication between fibroblasts and other cells was the highest, indicating that fibroblasts in rat ileal tissue affect intestinal injury and repair through cell-to-cell communication. In addition, our results reveal that differentially expressed RNA-binding proteins in fibroblasts may affect their functions in intestinal injury and treatment by affecting the expression of genes regulating communication between cells.
Conclusion: These findings emphasize the importance of understanding the interactions between fibroblasts and other cells in the context of intestinal injury, providing valuable insights for further exploring molecular mechanisms and insight for discovering new treatment targets and strategies.
Keywords: single-cell RNA sequencing, cell heterogeneity, fibroblasts, monoacylglycerol lipase, intestinal injury, RNA-binding protein, severe acute pancreatitis
Introduction
Acute pancreatitis (AP) is an unpredictable and potentially life-threatening disease, with prognoses largely dependent on the development of organ failure and infections. Despite advances in medical management and intensive care, the mortality rate of severe acute pancreatitis (SAP) is still very high.1,2 SAP often results in multi-organ damage. The intestine is one of the most affected organs is SAP, and damage to the intestinal mucosal barrier can further exacerbate AP. The damage to the intestinal mucosal barrier during SAP could be caused by disturbances in microcirculation, an excessive release of inflammatory mediators, injury resulting from ischemia-reperfusion, and the apoptosis of intestinal epithelial cells.
Intestinal tissue exhibits cellular heterogeneity including various structural cells and infiltrating immune cells, which may have different functions in intestinal damage and disease processes.3,4 However, the composition of cellular subsets and their potential functions in SAP-induced intestinal mucosal barrier damage remain unclear. Therefore, it is necessary to comprehensively analyze known or new cell clusters with important functions during intestinal mucosal barrier damage after SAP, reveal their functions and potential interaction mechanisms, and identify effective new therapeutic targets for SAP.
Monoacylglycerol lipase (MAGL), also known as monoglyceride lipase (MGLL) plays an important role in gastrointestinal diseases, and its inhibitors regulate inflammatory responses and intestinal damage. Our previous study found that the MAGL inhibitor JZL184 protected against intestinal mucosal permeability damage in SAP rats.5 However, it is still unclear how MAGL inhibitors affect the composition and function of cellular subsets in intestinal tissue during the process of intestinal mucosal barrier damage caused by AP. Due to the presence of intestinal epithelial cells and large numbers of infiltrating immune cells in the tissue, MAGL inhibitor treatment may have varying effects on different cell types during SAP-induced intestinal injury. Therefore, further exploration of cellular heterogeneity in intestinal tissues before and after MAGL inhibitor treatment may reveal the cellular and molecular mechanisms by which MAGL inhibitors treat SAP intestinal injury, and potentially aid in the advancement of novel therapeutic approaches.
Over the past few years, the utilization of single-cell transcriptome sequencing (scRNA-Seq) technology has gained prominence in research pertaining to disease development and treatment. Indeed, scRNA-Seq has been of great significance for in-depth analysis of the occurrence and development mechanisms of intestinal diseases, including identification of novel treatment targets and development of new treatment plans.6,7 However, no previous study has used scRNA-Seq technology to reveal the functions and potential cell molecular mechanisms of different cellular subsets in intestinal tissue during AP-induced intestinal mucosal damage and drug treatment recovery process.
Materials and Methods
Animals and Ileal Tissue Collection
Male SD rats weighing between 200 and 230 g were obtained from the Experimental Animal Center of Shandong University in Jinan, Shandong, China. The rats were housed in a controlled animal facility at a temperature of 22°C and subjected to a 12-hour light/dark cycle controlled automatically. All animal experiments were conducted in accordance with the guidelines and regulations set by the Shandong Provincial Hospital Committee on Use and Care of Animals, the research was conducted after obtaining approval from the ethics committee (NSFC: No.2022–012). The researchers involved in this study were blinded to specific details regarding the treatments administered to the animals. The protocol for establishing the SAP rat model and conducting the JZL184 treatment experiments followed the method outlined in our previous study (Wang et al, 2022). Twenty-four hours after the surgery, the SD rats were randomly divided into three groups: the Control group (CON), the SAP group (SAP), and the SAP group treated with JZL184 (JZL184). In brief, a micropump was utilized to administer a 3% sodium taurocholate solution into the pancreatic duct at a consistent rate of 0.1 mL/min. The JZL184 group received an intraperitoneal injection of the MAGL inhibitor JZL184 (Cayman Europe, Tallinn, Estonia), which was prepared in a mixture of saline/ethanol/Tween-80 and administered at a dosage of 10 mg/kg. After 24 hours of intervention, the Ileal tissue adjacent to the cecum was collected from rats in each group.
Histopathological Evaluation
The ileal tissues were fixed using a 4% formalin solution and subsequently embedded in paraffin for histological analysis. Thin tissue sections measuring 5 μm were stained using hematoxylin and eosin (HE) in order to visualize the tissue structures. The morphological changes were observed using a light microscope.
Preparation of Single-Cell Suspensions
Newly collected fresh ileal tissue were washed in ice-cold RPMI1640, cut into small pieces (<1 mm) with the sterile scissors on ice. The tissues were dissociated using Collagenase II (Sigma, V900892-100MG), Trypsin (Hyclone, SH30042.01) and DNase I (Sigma, DN25-1G). The single-cell solution obtained was passed through a 70 μM cell strainer (Corning) to remove any large debris. After removing erythrocytes (Solarbio, R1010), the cell count and viability were determined using a fluorescence Cell Analyzer (Countstar® Rigel S2) with AO/PI reagent.
Library Preparation and Sequencing
We followed the Single-cell 3’ whole transcriptome amplification protocol (BD Rhapsody) to generate single-cell cDNA libraries. Successful preparations included the generation of single-cell suspensions, which were then washed three times and counted. The suspensions were loaded onto a cartridge and lysed inside the wells, followed by mRNA capture on cell capture beads according to the manufacturer’s instructions. We retrieved and washed the cell capture beads before performing reverse transcription and treating them with Exonuclease I. The resulting cDNA underwent extension using WTA extension primers and was then purified using SPRIselect magnetic beads (Beckman Coulter). We determined the quantity of PCR products using the Qubit 4.0 with the Qubit dsDNA HS Assay (Q32854). For high-throughput sequencing, we prepared the libraries following the manufacturer’s instructions and applied them to the Illumina Novaseq 6000 system for 150 nt paired-end sequencing.
Retrieval and Quality Control of scRNA-Seq Data
The UMI count matrix, which represents the Unique Molecular Identifier (UMI) count for 2 SAP and 3 JZL184 and 3 CON samples, was extracted from the raw sequence data. To facilitate further analyses, the UMI count matrix was transformed into a Seurat object using the R package Seurat version 4.0.4.8 Prior to downstream analyses, the data underwent quality control steps. Cells with UMI counts below 1000 and genes detected in less than 500 cells were considered low-quality and therefore removed. Additionally, cells with mitochondrial-derived UMI counts exceeding 15% were excluded from the analysis. Lastly, genes that were detected in fewer than 5 cells were also removed. After these filtering steps, the resulting filtered UMI count matrix for each sample was used for subsequent analyses.
scRNA-Seq Data Preprocessing
After performing quality control, we applied log normalization to the UMI count matrix. In order to create potential Anchors, we utilized the FindIntegration Anchors function of Seurat, focusing on the top 2000 variable genes. Subsequently, we integrated the data of different samples using the IntegrateData function. With the integrated data matrix, we performed principal component analysis (PCA) to achieve dimensionality reduction. The Elbowplot function in Seurat helped us select the top 50 principal components for downstream analysis. Using the default resolution parameter (res = 0.6), the FindClusters function in Seurat allowed us to identify the main cell clusters. To visualize these clusters, we employed t-distributed stochastic neighbor embedding (tSNE) or uniform manifold approximation and projection (UMAP). To determine the cell type of each cluster, we used the “FindMarkers” function in the Seurat package (v4.0.4) to identify marker genes for each cluster. Additionally, we used ScType tools9 and expanded previously published marker genes of the ileum9–11 to annotate the cell types of each cluster.
Analysis of Differentially Expressed Genes
We used the FindMarkers / FindAllMarkers function from the Seurat package to determine differentially expressed genes (DEGs). Statistical significance was determined using a one-tailed Wilcoxon rank sum test, and p-values were adjusted for multiple testing using the Bonferroni correction. To identify DEGs, we considered genes with an expression difference on a natural log scale of at least 0.5 and a difference of percent of detected cells of at least 0.15, with an adjusted p-value less than 0.05.
Immunohistochemistry
Formalin-fixed, paraffin-embedded tissue sections were subjected to immunostaining using a multiclonal antibody to S100a8 (Abcam, Cambridge, UK, ab288715) at a dilution of 1:4000. The sections were incubated in a wet box at 4°C overnight. Following this, the sections were incubated with a biotinylated secondary antibody (anti-rabbit immunoglobulin) at room temperature for 30 minutes. Subsequently, an avidin-biotin-peroxidase complex was applied to the sections and incubated at room temperature for another 30 minutes. DAB staining was performed, and the staining solution was immediately washed off with tap water upon observing a color change in the section.
RBP Genes Analysis
Firstly, a catalog of 2141 RNA-binding proteins (RBPs) was compiled based on four previous reports.12–15 The UMI count matrix of RBPs was extracted as input for Seurat to perform cell clustering. Differentially activated RBPs were identified using the “FindAllMarkers” function from the Seurat package. Next, differential RBPs were extracted from each cell cluster, and co-expression analysis was conducted. The co-expression associations between the differential RBPs and targeted genes were established using the “grn” algorithm from the SCENIC python workflow (version 0.11.2) with default parameters (http://scenic.aertslab.org). To visualize the networks of the modules containing differential RBPs and their target genes, Cytoscape (v3.9.1) was used (https://cytoscape.org/).
Functional Enrichment Analysis
KOBAS 2.0 was employed to analyze Gene Ontology (GO) terms and KEGG pathways in order to uncover potential functional implications of genes.16 The enrichment of each term or pathway was assessed using the Hypergeometric test, and the Benjamini-Hochberg FDR controlling procedure was used to control for multiple testing.
Cell–Cell Communication
We utilized CellChat17 (v1.0.0) to infer cell-cell interactions based on the expression of known ligand-receptor pairs in different cell types. In order to investigate potential perturbed or induced cell-cell communication networks in intervertebral disc degeneration, we followed the official workflow and loaded the normalized counts into CellChat. We then applied various preprocessing functions including identifyOverExpressedGenes, identifyOverExpressedInteractions, and projectData, using the default parameters. For our analysis, we used the precompiled human Protein-protein Interactions as a priori network information, serving as the database. In the main analyses, we employed the core functions computeCommunProb, computeCommunProbPathway, and aggregateNet with the standard parameters and fixed randomization seeds.To identify the senders and receivers in the network, we applied the netAnalysis_signallingRole function on the netP data slot.
DERBPs of Bulk RNA-Seq Data
DERBPs from bulk RNA-seq of SAP vs Con and MAGL (JZL1840) vs SAP from our previous study.5
Real-Time Quantitative Reverse Transcription Validation of DERBPs
To verify the expression levels of the differentially expressed RNA-binding proteins (DERBPs) identified from the RNA-seq analysis, we conducted real-time quantitative reverse transcription PCR (RT-qPCR). GAPDH served as the reference gene for normalization. The RT-qPCR was carried out under the following conditions: initial denaturation at 95°C for 5 minutes, followed by 40 cycles of denaturation at 95°C for 15 seconds, and annealing/extension at 60°C for 30 seconds. Each sample was subjected to three technical replicates to ensure accuracy. For the specific primer sequences used in these experiments, please refer to Table S1.
Other Statistical Analysis
The clustering based on Euclidean distance was performed using the pheatmap package in R. You can find more information about the package at https://cran.r-project.org/web/packages/pheatmap/index.html. For comparisons between two groups of replicates, the speckle package (version 0.0.3) in R was utilized according to Phipson et al.18 We employed the Student’s t-test to assess the statistical significance between two groups.
Availability of the Raw RNA-Seq Data
The raw RNA-seq data analyzed in this research are available under GEO series accession number GSE244963.
Results
Construction of Single-Cell Transcriptomic Atlas and Identification of Cell Clusters in Rat Ileal Tissue
The ileal tissues of CON, SAP, and JZL184 group rats were isolated, dissociated, and digested into single-cell suspensions (Figure 1A). To validate the success of the modeling, we performed HE staining on the collected pancreatic and jejunal tissues. HE staining results showed that the control group did not exhibit any pancreatic or mucosal injury, while the SAP group showed signs of injury in the pancreas and intestines. However, when SAP rats were treated with JZL184, the morphological changes in their pancreatic and intestinal tissues were less severe compared to the SAP group (Figure 1B and C). scRNA-Seq and analysis were performed after rigorous data quality control, and transcriptome data of 44,571 cells originating from the ileal tissue were obtained (Figure 1D). Based on the gene expression data of these cells, we conducted cell clustering analysis and identified 24 cell clusters (Figure 1D). By consulting literatures and databases, we used marker genes to annotate the 24 cell clusters obtained, yielding cells in one of 11 cell groups: B cells, dendritic cells, endothelial cells, fibroblasts, goblet cells, mast cells, macrophages, Paneth cells, smooth muscle cells, T cells, and Tuft cells (Figures 1D and S1A). Clusters specifically expressed known marker genes for each annotated cell group (Figure S1B).
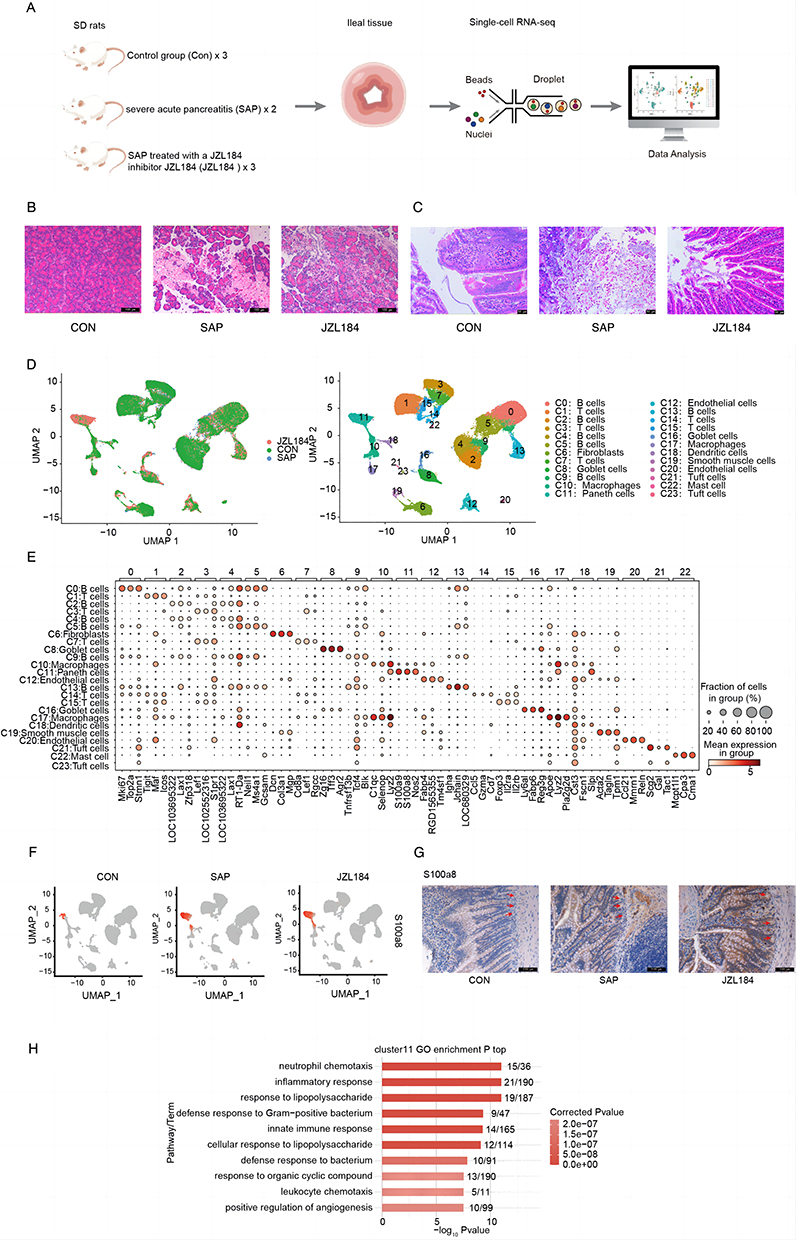 |
Figure 1 Cell heterogeneity of intestinal tissues from rats with severe acute pancreatitis. (A) Schematic diagram of scRNA seq data processing. (B) Representative HE-stained images of pancreatic sections in each group (original magnification, ×200). (C) Representative HE-stained images of ileal sections in each group (original magnification, ×200). (D) UMAP plot of composite single-cell transcriptomic profiles from all 9 samples. Colors indicate cell clusters along with annotations. (E) Dot plots showing the expression of top3 representative genes annotated by cell types in each cell type. (F) Violin plot of S100a8 in each cell type split by different sample groups. (G) Representative images of immunohistochemical staining for the cluster 11 marker S100a8 (red arrows) in CON-SAP-JZL184 (original magnification×200; scale bar=100μm). (H) Bar plot showing the most enriched GO biological process results of cluster 11. |
Based on the expression levels of all marker genes for each cell cluster, correlation analysis between clusters revealed higher correlations between cell clusters identified as the same subtype (Figure S1C), confirming the reliability of cluster identification. In addition, different cell clusters of the same cell subtype express certain cluster-specific marker genes (Figure 1E).
According to the description, we particularly focused on Paneth cells in the cell subgroup cluster 11 and found that they were specifically overexpressed in S100a8 in the CON-SAP-JZL184 group. Further immunohistochemistry results also showed that S100a8 gradually increased in CON-SAP-JZL184, confirming the reliability of our identification of cluster 11 (Figure 1F and G).
To clarify the potential biological functions of these cell clusters, we extracted their marker genes and performed Gene Ontology (GO) functional analysis. We observed that the marker genes of various cell clusters are enriched for different functional pathways; for example, in clusters representing different T cell subsets (C7, C14, C1, C15, and C3) marker genes were involved in T cell differentiation, cell surface receptor signaling, T cell receptor signaling, and other pathways (Figure S1D).
As a characteristic cell of the intestine, we evaluated GO functional analysis results of C11 (Paneth cells) marker genes in more detail. We found that the top 10 pathways enriched for marker genes of Paneth cells includes neutrophil chemotaxis, inflammatory response, response to lipopolysaccharide, defense response to Gram-positive bacteria, innate immune response, response to lipopolysaccharide, defense response to bacteria, and other immune-related pathways (Figure 1H).
Changes of Cell Clusters in Rat Ileal Tissue During SAP-Induced Intestinal Injury and JZL184 Treatment
Using information about the source of single cells, we constructed single-cell atlases of the ileal tissue of rats in CON, SAP, and JZL184 groups. The overall composition of the cell atlas was similar across each group (Figure 2A). Based on the actual number of cells in each cluster of three groups, we calculated expected numbers of cells for each cluster. Next, we performed enrichment analysis of cell clusters in each group by dividing the observed number of cells by the expected number of cells. The enrichment scores of cell clusters for CON, SAP, and JZL184 groups were significantly different, and those of certain clusters, such as C6 (fibroblasts) and C10 (macrophages), first decreased and then increased in CON-SAP-JZL184 groups (Figure 2B). We further analyzed the proportion of cells from different samples each cluster and found that cluster compositions varied among groups and individuals (Figure S2A). We also calculated the proportion of cells in each cell cluster for the three groups and found that the proportions of certain cell clusters, such as C6 (fibroblasts) and C10 (macrophages), decreased first and then increased in CON-SAP-JZL184 groups; whereas, the proportion of C13 gradually increased and the proportion of C14 cluster gradually decreased (Figure 2C).
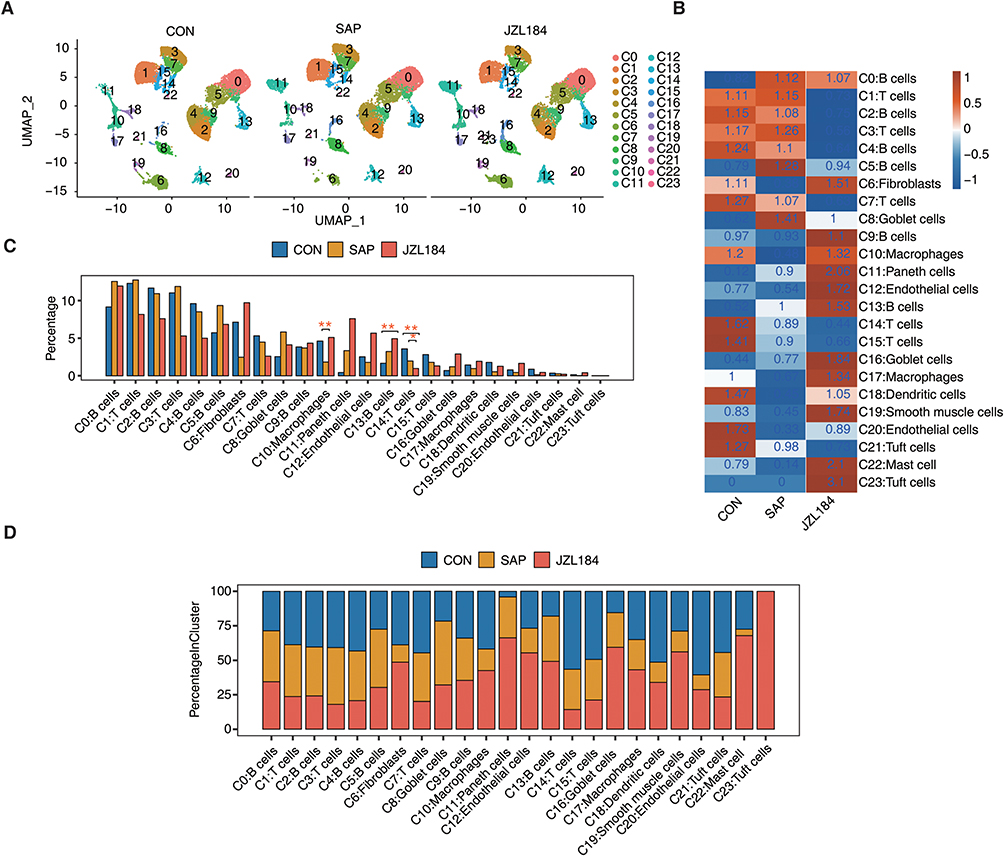 |
Figure 2 Changes of cell heterogeneity in intestinal tissues during intestinal injury and repair of rats with severe acute pancreatitis. (A) UMAP plot of composite single-cell transcriptomic profiles from all samples from JZL184 and CON and SAP. Colors indicate cell clusters. (B) Tissue prevalence of cell clusters estimated by Ro/e score. (C) Bar plot comparing the proportions of cell populations of cell clusters within each sample group. The speckle R package calculated the P-value (version: 0.0.3). *P ≤ 0.05, **≤ 0.01. (D) Stacked bar plot showing the relative proportions of cell populations from JZL184, CON, and SAP in each cell type. |
By utilizing the ratios of cell numbers for each cell cluster in different groups to total cell numbers for inter-sample correlation analysis, we found that the sample correlation coefficient between CON and SAP groups was higher compared with that between SAP and JZL184 groups; moreover, we observed significant differences in the proportions of C6 (fibroblasts) and C10 (macrophages) between CON and SAP groups, as well as SAP and JZL184L groups (Figure S2B and C). Further calculations of the relative enrichment of each cell cluster between CON and SAP groups, and SAP and JZL184 group showed that C6 (fibroblasts) and C10 (macrophages) in the SAP group were enriched compared with the CON group, while those in the JZL184 group were enriched compared with the SAP group (Figure S2D and E). We also statistically analyzed the proportions of cells from different groups for each cell cluster and found that proportions of C6 (fibroblasts) and C10 (macrophages) first decreased and then increased in CON-SAP-JZL184 groups (Figure 2D). To maintain intestinal epithelium homeostasis, the continuous renewal of epithelial cells is crucial for resisting excessive stimuli that may damage the integrity of intestinal structures.
SAP-Induced Intestinal Injury and Differential Gene Expression Analysis of Cell Clusters in Rat Ileal Tissue During JZL184 Treatment
We counted numbers of DEGs by analyzing differences between cell clusters in CON and SAP groups, and between SAP and JZL184 groups. We found that numbers of upregulated and downregulated genes were relatively high for C6 (fibroblasts), C10 (macrophages), C11, and C12 in both comparisons (Figure 3A). We further conducted GO functional analysis of DEGs and found that upregulated genes in C13, C12, C6, C11, C10, C19, C16, and C2 between SAP and CON groups were enriched for negative regulation of apoptotic process pathways (Figure 3B), while downregulated genes in C16, C2, C4, C1, C15, C3, C7, C13, C9, C14, C5, C12, and C6 were enriched for positive regulation of transcription pathways (Figure 3C). In our comparison of JZL184 and SAP groups, upregulated genes in C10, C12, C6, C11, and C17 were enriched for cellular response to lipopolysaccharide, response to lipopolysaccharide, and response to drug pathways (Figure S3A); whereas, downregulated genes in subgroups C10, C16, C11, and C6 were enriched for immune response pathways (Figure S3B).
 |
Figure 3 Analysis of DEGs in difference cell population from intestinal tissues during intestinal injury and repair of rats with severe acute pancreatitis. (A) Dot plot shows the number of up-regulation and down-regulation between the two groups. (B) Gene ontology enrichment analysis of biological processes of up-regulation between SAP and CON. Top 3 terms were selected for each cluster and heatmap shows the enrichment q-value of these terms (scaled by column). (C) Gene ontology enrichment analysis of biological processes of down-regulation between SAP and CON. Top 3 terms were selected for each cluster and heatmap shows the enrichment q-value of these terms (scaled by column). (D) Bar plot showing the most enriched GO biological process results of up-regulation of cluster 6 between SAP and CON. (E) Bar plot showing the most enriched GO biological process results of down-regulation of cluster 6 between SAP and CON. (F) Bar plot showing the most enriched GO biological process results of up-regulation of cluster 6 between JZL184 and SAP. (G) Bar plot showing the most enriched GO biological process results of down-regulation of cluster 6 between JZL184 and SAP. |
Given that C6 (fibroblasts) has the highest number of DEGs among the different group comparisons, we performed a detailed evaluation of our GO functional analysis results for DEGs in this cluster. In our comparison of SAP and CON groups, the top 10 pathways upregulated in C6 (fibroblasts) include multiple pathways related to protein synthesis and RNA processing, such as mRNA processing and protein folding (Figure 3D), while the top 10 pathways downregulated in this cell subset mainly involve extracellular matrix organization, cell adhesion, and positive regulation of cell proliferation (Figure 3E). In our comparison between MAGL and SAP groups, the top 10 pathways upregulated in C6 (fibroblasts) include pathways related to positive regulation and regulation of cell proliferation, as well as wound healing (Figure 3F). In addition, the top 10 pathways downregulated in the C6 subset include pathways related to negative regulation of apoptotic process, wound healing, and cell adhesion (Figure 3G).
Cell Communication Analysis of Different Cell Clusters in Rat Ileal Tissues During SAP-Induced Intestinal Injury and JZL184 Treatment
Given the diverse cellular composition of rat ileal tissues, cells may communicate with each other by expressing different receptors, ligands, and secreted proteins. Based on the expression of genes encoding these cell communication factors in each cell cluster, we used CellChat to analyze communication between different cell clusters. We found that the number and intensity of communication between various cell clusters first decreased and then increased in CON-SAP-JZL184 groups, indicating that SAP induction damages communication in cells while MAGL treatment enhances it (Figure 4A). We also counted the input and output communication of each cell cluster in CON, SAP, and JZL184 groups, and found that C6 (fibroblasts) had high input and output signal strength in all three groups (Figure 4B).
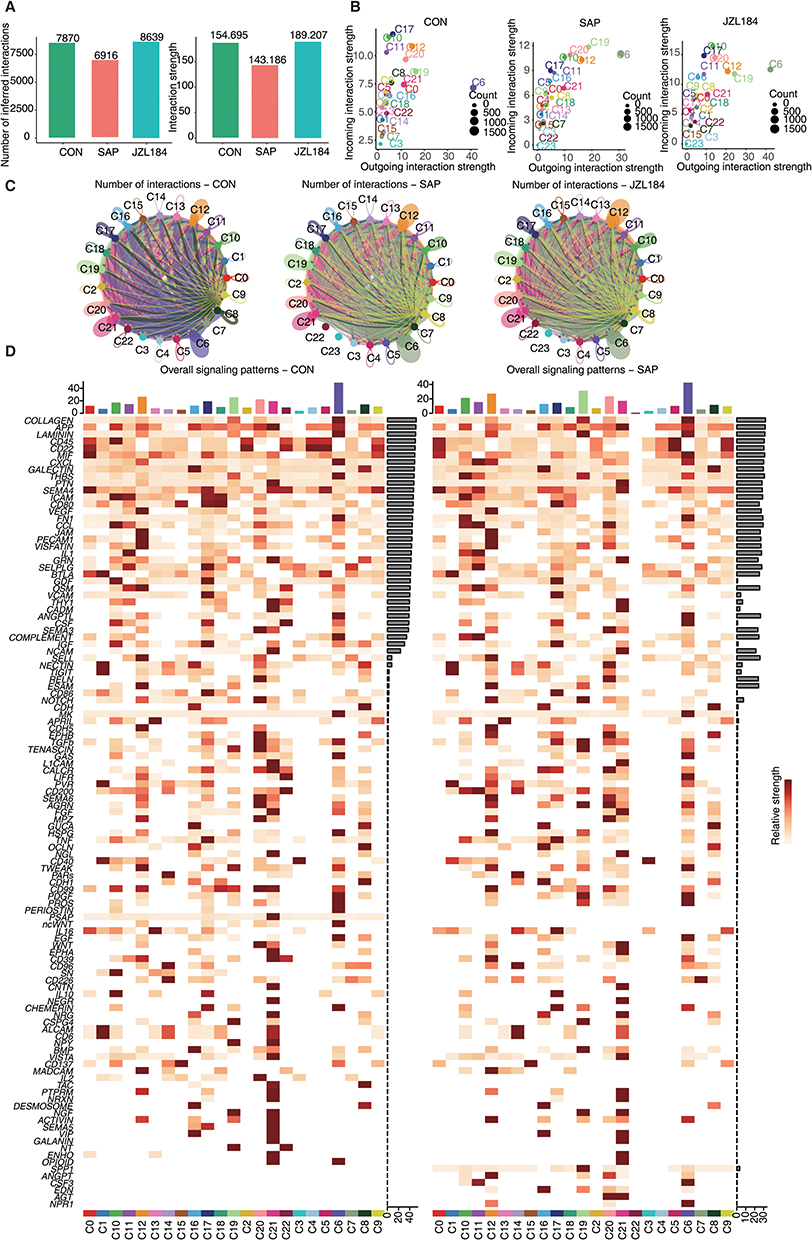 |
Figure 4 Profiling of cell receptor-ligand interactions identified in multiple cells in intestinal tissues during intestinal injury and repair of rats with severe acute pancreatitis. (A) The number and strength of interactions in CON and SAP and JZL184. (B) Scatter chart showing the strength of incoming and outgoing in each group. (C) Comparing the interaction number among Genes expression module of all cell cluster in CON and SAP and JZL184 groups. (D) Signal contribution to outgoing and incoming signaling of all cell cluster in CON and SAP groups. |
We next constructed interaction networks for each cell cluster in CON, SAP, and JZL184 groups, we found that C6 (fibroblasts) had the highest total number of interactions, even the interaction strength among C12 (endothelial cells), C19 (smooth muscle cells), C21 (tuft cells), and C20 (endothelial cells) is also high (Figure 4C). By extracting specific signal pathways for intercellular communication in each cell cluster in CON, SAP, and JZL184 groups, we found that C6 (fibroblasts) had the highest cumulative signal pathway intensity among all cells (Figures 4D and S4A).
We further analyzed changes in intercellular signaling pathways between different cell clusters in CON and SAP groups, and between JZL184 and SAP groups. We found that compared with the CON group, the SAP group had the highest decrease in both cumulative numbers and strength of intercellular interactions output by C6 (fibroblasts); whereas, compared with the SAP group, C6 (fibroblasts) output by the MAGL group had the highest increase in the strength of intercellular interactions (Figure S4B and C).
RNA-Binding Proteins with Differential Gene Expression in Fibroblasts of Rat Ileal Tissue During SAP-Induced Intestinal Injury and JZL184 Treatment are Involved in Regulating Intercellular Interactions
In our previous research, numerous RNA-binding proteins (RBPs) were differentially expressed during SAP-induced intestinal injury and MAGL treatment, indicating they may have important functions.5 Based on this, we evaluated intersections of DEGs with known RBPs in different cell clusters between CON and SAP groups, and between SAP and JZL184 groups. We observed numerous upregulated and downregulated RBP genes in cell clusters (such as C6 and C10) in our comparisons of different groups (Figure S5A–D). Considering that the proportion of C6 (fibroblasts) in rat ileal tissue greatly changed during SAP-induced intestinal injury and MAGL treatment, our results show that differential expression of RBP genes are mostly involved in changes in cell interaction networks. RBPs can affect mRNA stability by binding downstream genes, thereby affecting gene expression. We further explored the correlation between differentially expressed RBPs in C6 and the expression of cell interaction genes. We extracted DEGs of C6 for different group comparisons and intersected them with known RBPs. We found that 383 DEGs in C6 (fibroblasts) were RBP genes (Figure 5A). The intersection of DEGs involved in cell interaction/communication of C6 in SAP versus CON and JZL184 versus SAP comparisons (including ligand and receptor genes revealed 69 differentially expressed ligand and receptor genes) (Figure 5B).
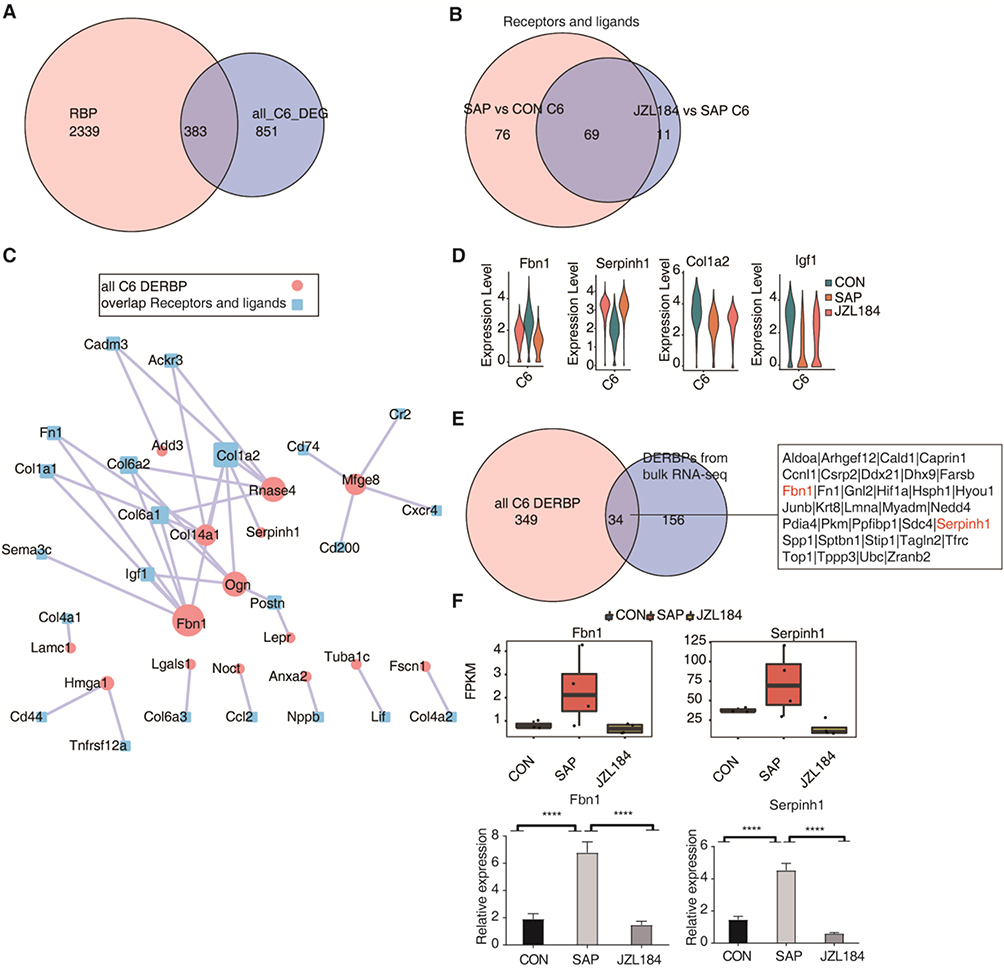 |
Figure 5 Identification of RNA binding protein mediating cell-cell interaction of fibroblasts in intestinal tissues during intestinal injury and repair of rats with severe acute pancreatitis. (A) Venn diagram showing the overlap of DEG of 2141 RBP and cluster 6. (B) Venn diagram shows the overlap of cluster 6 receptor and ligand between the two groups. (C) Cytoscape shows the co-expression networks comprising cluster 6 DERBP. Edges connect RBP-target gene pairs while nodes represent genes. RBP are displayed in larger font size and pink color. Co-expression associations of RBP and target genes were built by the “grn” algorithm from SCENIC. (D) Violin plot of 4 genes in each cell type split by different sample groups. (E). Venn diagram showing DERBP of RNAseq and overlap of DERBP of C6. (F) The boxplot showing the overlap of Fbn1 and Serpinh1 from RNA sequencing and RT-qPCR validation. ****p-value < 0.0001. |
Based on the expression levels of 383 RBPs and 69 differentially expressed ligand and receptor genes in C6 of all groups, expression correlation analysis was performed to screen RBPs and ligand/receptor genes with correlation greater than 40 and construct a regulatory network of these genes in C6. Fbn1, Serpinh1, and other RBPs were found to potentially regulate the expression of Col1a2, Igf1 and other ligand/receptor genes, which may affect cell-cell interactions involving cells in C6 (Figure 5C). In increasing order of CON, SAP, and JZL184, expression levels of Fbn1 first increased and then decreased, expression levels of Serpinh1 first decreased and then increased, and expression levels of Col1a2 and Igf1 first decreased and then increased in C6 (fibroblasts) (Figure 5D).
Finally, the intersection of differentially expressed RBPs in C6 (fibroblasts) and differentially expressed RBPs identified in earlier bulk RNA-seq, 34 RBPs including Fbn1 and Serpinh1 were identified (Figure 5E). Based on bulk RNA-seq data, significant changes in expression levels of these RBPs were observed among different groups. We performed RT-qPCR on Fbn1 and Serpinh1 from RNA-sequencing data. The t-test results showed that they were significantly different in dominance, which was consistent with expectations (Figures 5F and S5E).
Discussion
The mechanisms underlying intestinal mucosal barrier damage after AP are complex,19,20 and various cells such as intestinal epithelial cells and infiltrating macrophages are potentially involved in intestinal damage and repair after AP.3,4 This study provides important insights into the molecular mechanisms of intestinal injury and treatment by analyzing changes in cellular heterogeneity and composition in rat ileal tissue during injury and treatment processes.
After verifying pancreatic and small intestinal damage through HE staining of the pancreas and ileum, we first constructed a single-cell atlas of rat intestinal tissue and identified cell clusters, yielding a total of 24 clusters. We found that different clusters were enriched in marker genes associated with different functional pathways. For example, C11 (exhibiting gene expression characteristic of intestinal Paneth cells) displayed functional pathways enriched in marker genes of multiple immune-related pathways. Paneth cells are specialized secretory cells that play a role in the innate immune system by controlling intestinal bacteria and intestinal homeostasis by secreting antimicrobial factors into the lumen.21 These results indicate that there is rich cell heterogeneity in rat ileum tissue, making analysis of changes in the composition of different cell clusters during SAP-induced intestinal injury and MAGL treatment processes a worthy endeavor.
This project discovered changes in cell heterogeneity and composition in rat ileal tissue during SAP-induced intestinal injury and MAGL treatment. Specifically, we found that numbers of fibroblast and macrophage clusters were decreased in the SAP group relative to the control group, and the number of fibroblast clusters was increased after JZL184 treatment. Fibroblasts promote epithelial cell differentiation and provide a structural framework for epithelial cell regeneration to facilitate this renewal.22 Different subtypes of macrophages play important roles in intestinal inflammation and intestinal homeostasis.23 Collectively, these results indicate that fibroblasts and macrophages have important functions in intestinal injury and treatment, and their mechanisms deserve further exploration.
Analysis of differences in gene expression between various cell clusters in each group reveals that fibroblasts had the greatest number of DEGs. Differences in gene expression were mainly related to injury repair and immune responses, which may affect processes involved in intestinal injury and repair. Integrin-dependent cell adhesion and migration are therapeutic targets for intestinal mucosal injury and repair.24 Moreover, intestinal mucosal wound healing and barrier integrity are key for the treatment of intestinal injuries.25,26 These results suggest that fibroblasts in rat intestinal tissue may participate in processes of intestinal injury and repair by increasing or decreasing the expression of genes related to cell adhesion and wound healing pathways, as observed during SAP-induced intestinal injury and MAGL treatment, respectively.
Analysis of genes involved in cell-to-cell communication reveals that communication between cells during SAP-induced intestinal injury and JZL184 treatment varied. Among them, the degree of difference in expression of genes involved in communication between cells was the highest in fibroblasts, indicating that fibroblasts in rat ileal tissue affect intestinal injury and repair through cell-to-cell communication. Currently, intercellular communication via extracellular vesicles is regarded to play an important role in intestinal diseases.27–29 Previous studies found that fibroblasts participate in important intercellular interactions in kidney injury, skin wound repair, and cancer.30–32 These results suggest that fibroblasts in rat ileal tissue may affect intestinal damage and repair processes through intercellular interactions during SAP-induced intestinal injury and MAGL therapy.
By analyzing expression of RBP genes in fibroblasts and other cell subgroups, as well as genes involved in communication between cells, our results reveal that differentially expressed RBPs in fibroblasts may affect their function in intestinal injury and treatment by affecting the expression of genes important to communication between fibroblasts and other cells. SERPINH1 regulates EMT and gastric cancer metastasis through the Wnt/β-catenin signaling pathway, the IGF-1 pathway plays a role in activation of pulmonary fibroblasts,33 and COL1A2 is an important target for gastrointestinal tumors.34 Therefore, during SAP-induced intestinal injury and MAGL treatment in rats, expression of RBPs such as Fbn1 and Serpinh1 in fibroblasts may affect expression of Col1a2 and Igf1, and through expression of Igf1 and other cell communication-related genes, affect intercellular communication mediated by fibroblasts in ileal tissue, ultimately influencing the progress of intestinal injury and treatment.
One limitation of our approach is that while this study aims to examine the overall transcriptome changes associated with the effects of JZL184, the exact causal relationship between these changes in specific genes or pathways and the development of SAP or the effects of JZL184 is still not completely comprehended. Although these extensive datasets offer a plethora of information, additional research is required to explore the underlying mechanisms by specifically targeting proteins and pathways that potentially play a role in SAP pathogenesis and the effects of JZL184.
In summary, our study reveals the critical role of fibroblasts and their complex interactions with other cells, which may lead to the discovery of new therapeutic targets and strategies. Moreover, our results provide clues for further verifying and revealing the function and mechanism of fibroblasts in intestinal injury and treatment, as well as a reference for discovering new therapeutic targets. Future research should further validate these results, investigate interactions between fibroblasts and other cells during intestinal injury and treatment, and develop more effective treatment strategies.
Data Sharing Statement
Data available within the article or its Supplementary Materials. The sequencing data presented in the study are deposited in the GEO database repository, accession number GSE244963.
Author Contributions
All authors made a significant contribution to the work reported, whether that is in the conception, study design, execution, acquisition of data, analysis and interpretation, or in all these areas; took part in drafting, revising or critically reviewing the article; gave final approval of the version to be published; have agreed on the journal to which the article has been submitted; and agree to be accountable for all aspects of the work.
Funding
Natural Science Foundation of Shandong Province, Grant No: ZR2021MH068 (Jing Wang); National Natural Science Foundation of China, Grant No: 82170650 (Hongwei Xu).
Disclosure
The authors have confirmed that they have no potential conflicts of interest for this work.
References
1. Boxhoorn L, Voermans RP, Bouwense SA, et al. Acute pancreatitis. Lancet. 2020;396(10252):726–734. doi:10.1016/S0140-6736(20)31310-6
2. Gardner TB. Acute Pancreatitis. Ann Intern Med. 2021;174(2):ITC17–ITC32. doi:10.7326/AITC202102160
3. Banerjee A, McKinley ET, von Moltke J, et al. Interpreting heterogeneity in intestinal tuft cell structure and function. J Clin Invest. 2018;128(5):1711–1719. doi:10.1172/JCI120330
4. Viola MF, Boeckxstaens G. Niche-specific functional heterogeneity of intestinal resident macrophages. Gut. 2021;70(7):1383–1395. doi:10.1136/gutjnl-2020-323121
5. Wang J, Xu H, Chen T, et al. Effect of monoacylglycerol lipase inhibition on intestinal permeability of rats with severe acute pancreatitis. Front Pharmacol. 2022;13:869482. doi:10.3389/fphar.2022.869482
6. James KR, Elmentaite R, Teichmann SA, et al. Redefining intestinal immunity with single-cell transcriptomics. Mucosal Immunol. 2022;15(4):531–541. doi:10.1038/s41385-021-00470-y
7. Yan H, Ye Y, Zhao H, et al. Single-cell RNA sequencing for analyzing the intestinal tract in healthy and diseased individuals. Front Cell Dev Biol. 2022;10:915654. doi:10.3389/fcell.2022.915654
8. Butler A, Hoffman P, Smibert P, et al. Integrating single-cell transcriptomic data across different conditions, technologies, and species. Nat Biotechnol. 2018;36(5):411–420. doi:10.1038/nbt.4096
9. Ianevski A, Giri AK, Aittokallio T. Fully-automated and ultra-fast cell-type identification using specific marker combinations from single-cell transcriptomic data. Nat Commun. 2022;13(1):1246. doi:10.1038/s41467-022-28803-w
10. Wang Y, Song W, Wang J, et al. Single-cell transcriptome analysis reveals differential nutrient absorption functions in human intestine. J Exp Med. 2020;217(2):e20191130. doi:10.1084/jem.20191130
11. Li H, Wang X, Wang Y, et al. Cross-species single-cell transcriptomic analysis reveals divergence of cell composition and functions in mammalian ileum epithelium. Cell Regen. 2022;11(1):19. doi:10.1186/s13619-022-00118-7
12. Gerstberger S, Hafner M, Tuschl T. A census of human RNA-binding proteins. Nat Rev Genet. 2014;15(12):829–845. doi:10.1038/nrg3813
13. Castello A, Fischer B, Frese CK, et al. Comprehensive identification of RNA-binding domains in human cells. Mol Cell. 2016;63(4):696–710. doi:10.1016/j.molcel.2016.06.029
14. Hentze MW, Castello A, Schwarzl T, et al. A brave new world of RNA-binding proteins. Nat Rev Mol Cell Biol. 2018;19(5):327–341. doi:10.1038/nrm.2017.130
15. Ali A, Shafarin J, Abu Jabal R, et al. Ferritin heavy chain (FTH1) exerts significant antigrowth effects in breast cancer cells by inhibiting the expression of c-MYC. FEBS Open Bio. 2021;11(11):3101–3114. doi:10.1002/2211-5463.13303
16. Xie C, Mao X, Huang J, et al. KOBAS 2.0: a web server for annotation and identification of enriched pathways and diseases. Nucleic Acids Res. 2011;39(Web Server issue):W316–W322. doi:10.1093/nar/gkr483
17. Jin S, Guerrero-Juarez CF, Zhang L, et al. Inference and analysis of cell-cell communication using CellChat. Nat Commun. 2021;12(1):1088. doi:10.1038/s41467-021-21246-9
18. Phipson B, Sim CB, Porrello ER, et al. propeller: testing for differences in cell type proportions in single cell data. Bioinformatics. 2022;38(20):4720–4726. doi:10.1093/bioinformatics/btac582
19. Ge P, Luo Y, Okoye CS, et al. Intestinal barrier damage, systemic inflammatory response syndrome, and acute lung injury: a troublesome trio for acute pancreatitis. Biomed Pharmacother. 2020;132:110770. doi:10.1016/j.biopha.2020.110770
20. Liu D, Wen L, Wang Z, et al. The mechanism of lung and intestinal injury in acute pancreatitis: a review. Front Med. 2022;9:904078. doi:10.3389/fmed.2022.904078
21. Cray P, Sheahan BJ, Dekaney CM. Secretory sorcery: Paneth cell control of intestinal repair and homeostasis. Cell Mol Gastroenterol Hepatol. 2021;12(4):1239–1250. doi:10.1016/j.jcmgh.2021.06.006
22. Dang H, Harryvan TJ, Hawinkels LJAC. Fibroblast subsets in intestinal homeostasis, carcinogenesis, tumor progression, and metastasis. Cancers. 2021;13(2):183. doi:10.3390/cancers13020183
23. Moreira Lopes TC, Mosser DM, Gonçalves R. Macrophage polarization in intestinal inflammation and gut homeostasis. Inflamm Res. 2020;69(12):1163–1172. doi:10.1007/s00011-020-01398-y
24. Flemming S, Luissint AC, Kusters DHM, et al. Desmocollin-2 promotes intestinal mucosal repair by controlling integrin-dependent cell adhesion and migration. Mol Biol Cell. 2020;31(6):407–418. doi:10.1091/mbc.E19-12-0692
25. Quiros M. Therapeutic opportunities for repair GPCRs during intestinal mucosal wound healing. Trends Mol Med. 2020;26(11):971–974. doi:10.1016/j.molmed.2020.08.011
26. Sommer K, Wiendl M, Müller TM, et al. Intestinal mucosal wound healing and barrier integrity in IBD-crosstalk and trafficking of cellular players. Front Med. 2021;8:643973. doi:10.3389/fmed.2021.643973
27. Al-Ghadban S, Kaissi S, Homaidan FR, et al. Cross-talk between intestinal epithelial cells and immune cells in inflammatory bowel disease. Sci Rep. 2016;6(1):29783. doi:10.1038/srep29783
28. Gaudino SJ, Kumar P. Cross-talk between antigen presenting cells and T cells impacts intestinal homeostasis, bacterial infections, and tumorigenesis. Front Immunol. 2019;10:360. doi:10.3389/fimmu.2019.00360
29. Shen Q, Huang Z, Yao J, et al. Extracellular vesicles-mediated interaction within intestinal microenvironment in inflammatory bowel disease. J Adv Res. 2021;37:221–233. doi:10.1016/j.jare.2021.07.002
30. Schulz MC, Gekle M, Schwerdt G. Epithelial-fibroblast cross talk aggravates the impact of the nephrotoxin ochratoxin A. Biochim Biophys Acta Mol Cell Res. 2019;1866(12):118528. doi:10.1016/j.bbamcr.2019.118528
31. Amiri N, Golin AP, Jalili RB, et al. Roles of cutaneous cell-cell communication in wound healing outcome: an emphasis on keratinocyte-fibroblast crosstalk. Exp Dermatol. 2022;31(4):475–484. doi:10.1111/exd.14516
32. Gardiner JC, Cukierman E. Meaningful connections: interrogating the role of physical fibroblast cell-cell communication in cancer. Adv Cancer Res. 2022;154:141–168. doi:10.1016/bs.acr.2022.01.004
33. Hung CF, Rohani MG, Lee SS, et al. Role of IGF-1 pathway in lung fibroblast activation. Respir Res. 2013;14(1):102. doi:10.1186/1465-9921-14-102
34. Tamilzhalagan S, Rathinam D, Ganesan K. Amplified 7q21-22 gene MCM7 and its intronic miR-25 suppress COL1A2 associated genes to sustain intestinal gastric cancer features. Mol Carcinog. 2017;56(6):1590–1602. doi:10.1002/mc.22614
 © 2023 The Author(s). This work is published and licensed by Dove Medical Press Limited. The full terms of this license are available at https://www.dovepress.com/terms.php and incorporate the Creative Commons Attribution - Non Commercial (unported, v3.0) License.
By accessing the work you hereby accept the Terms. Non-commercial uses of the work are permitted without any further permission from Dove Medical Press Limited, provided the work is properly attributed. For permission for commercial use of this work, please see paragraphs 4.2 and 5 of our Terms.
© 2023 The Author(s). This work is published and licensed by Dove Medical Press Limited. The full terms of this license are available at https://www.dovepress.com/terms.php and incorporate the Creative Commons Attribution - Non Commercial (unported, v3.0) License.
By accessing the work you hereby accept the Terms. Non-commercial uses of the work are permitted without any further permission from Dove Medical Press Limited, provided the work is properly attributed. For permission for commercial use of this work, please see paragraphs 4.2 and 5 of our Terms.