Back to Journals » Journal of Inflammation Research » Volume 18
Single-Cell RNA Sequencing Reveals Microglial Heterogeneity and Functional States After Cerebral Ischemia-Reperfusion Injury
Authors Tang Y ![]() , Zhang Q, Qu Y, Yi L, Li F, Qu C, Shi S, Pan BF, Wen S, Sun R, Pan Y
, Zhang Q, Qu Y, Yi L, Li F, Qu C, Shi S, Pan BF, Wen S, Sun R, Pan Y ![]()
Received 18 May 2025
Accepted for publication 15 November 2025
Published 3 December 2025 Volume 2025:18 Pages 16931—16956
DOI https://doi.org/10.2147/JIR.S539404
Checked for plagiarism Yes
Review by Single anonymous peer review
Peer reviewer comments 2
Editor who approved publication: Dr Adam Bachstetter
Yushi Tang,1,2 Qi Zhang,3 Yewei Qu,1 Lian Yi,1 Fangqin Li,1 Changda Qu,1 Shanshan Shi,1 Byron Fei Pan,1 Shirong Wen,1 Ruohan Sun,1,* Yujun Pan1,*
1Department of Neurology, The First Affiliated Hospital of Harbin Medical University, Harbin, People’s Republic of China; 2Key Laboratory of Hepatosplenic Surgery, Ministry of Education, The First Affiliated Hospital of Harbin Medical University, Harbin, People’s Republic of China; 3Department of Neurology, Heilongjiang Provincial Hospital, Harbin, People’s Republic of China
*These authors contributed equally to this work
Correspondence: Ruohan Sun, Department of Neurology, The First Affiliated Hospital of Harbin Medical University, 23 Youzheng Street, Harbin, 150001, People’s Republic of China, Tel/Fax +86 451 85555774, Email [email protected] Yujun Pan, Department of Neurology, The First Affiliated Hospital of Harbin Medical University, 23 Youzheng Street, Harbin, 150001, People’s Republic of China, Tel/Fax +86 451 85555799, Email [email protected]
Background: Ischemic stroke remains a leading cause of mortality and disability worldwide. Microglia, the resident immune cells of the central nervous system, perform critical roles in immune surveillance, debris clearance, and tissue repair. Analyzing the heterogeneity, activation trajectories, and metabolic states of microglia in ischemic stroke is essential for discovering therapeutic targets.
Methods: We performed single-cell RNA sequencing (scRNA-seq) on brains from ischemic and control rats and identified transcriptionally distinct microglial subpopulations. We conducted differential expression, pathway enrichment, pseudotime analysis, regulatory network inference, and cell-cell communication mapping to characterize functional states, key transcription factors, and intercellular crosstalk underlying microglial responses following cerebral ischemia-reperfusion injury. We used Real-Time Quantitative PCR (RT-qPCR), Western blot, and immunohistochemistry to measure relative RNA and protein expression levels.
Results: We identified seven microglial subclusters with distinct transcriptional signatures. Ischemia-associated clusters exhibited strong activation of inflammatory pathways, increased glycolysis and lipid metabolism, and suppressed TCA cycle and oxidative phosphorylation (OXPHOS), reflecting a shift toward proinflammatory, energy-demanding phenotypes. Pseudotime analysis revealed transitions from homeostatic to pathological states, highlighting potential therapeutic windows. Regulatory network analysis identified activating transcription factor 3 (ATF3) as a central regulator controlling the expression of cholesterol 25-hydroxylase (CH25H) and secreted phosphoprotein 1 (SPP1). Notably, ATF3 overexpression enhanced CH25H expression and selectively increased proinflammatory cytokine production, linking metabolic reprogramming to neuroinflammatory responses. Cell-cell communication analysis further revealed extensive remodeling of interactions with astrocytes, endothelial cells, and fibroblasts, potentially amplifying postischemic neuroinflammation.
Conclusion: Our study demonstrates that cerebral ischemia induces transcriptionally and functionally distinct microglial subpopulations, characterized by metabolic reprogramming and proinflammatory activation. ATF3 serves as a central regulator linking CH25H-mediated metabolic changes to cytokine-driven neuroinflammation, highlighting potential therapeutic targets for modulating microglial responses and mitigating ischemia-induced brain injury.
Keywords: scRNA-seq, microglia, cerebral ischemia-reperfusion injury, heterogeneity, functional states
Introduction
Microglia are the resident immune cells of the brain and play a central role in maintaining cerebral homeostasis. As the first line of immune defense in the central nervous system (CNS), they rapidly sense and respond to changes in the brain microenvironment.1,2 Microglia not only maintain neural homeostasis and clear metabolic byproducts but also regulate neuroimmune processes as pivotal mediators of neuroinflammation.3,4 Growing evidence implicates microglia in the neuroinflammatory responses underlying a broad spectrum of neurological disorders, including Alzheimer’s disease (AD), Parkinson’s disease (PD), amyotrophic lateral sclerosis, brain tumors, and stroke. In response to inflammatory stimuli, microglia undergo rapid phenotypic and functional transformations via complex signal transduction pathways, migrate to sites of injury, and orchestrate the initiation and progression of neuroinflammation through diverse immune mechanisms.5–8
Ischemic stroke is a major cause of permanent neurological impairment and death worldwide, yet effective therapeutic options remain limited.9 Previous studies have shown that following cerebral ischemia-reperfusion injury, microglia are rapidly activated, initiating an early immune response. On the basis of different immune signals, microglia traditionally have been described as polarizing toward either a proinflammatory (M1) or an anti-inflammatory (M2) phenotype. The transition from M1 microglia to M2 microglia has been identified as an effective therapeutic strategy for ischemic stroke.10 However, recent advances in the origins and functions of microglia have challenged the traditional concepts of classical classification.11 In particular, it remains unclear how best to classify microglial subpopulations according to their heterogeneity and the distinct contributions of these subclusters following cerebral ischemia-reperfusion injury. Activated microglia release proinflammatory cytokines that can directly exacerbate neuronal death and disrupt the blood-brain barrier. They also secrete complement components, recognize stressed neurons for removal, and phagocytose damaged cells.12,13 Importantly, microglia exhibit immune-metabolic flexibility. Recent studies have demonstrated that they express key genes involved in diverse metabolic pathways and, under different inflammatory conditions, display distinct metabolic signatures. Modulating the metabolic state of microglia not only reshapes their immune functions but also influences the course and outcome of neuroinflammatory diseases. These observations provide important insights into the mechanisms governing microglial behavior and point to potential therapeutic opportunities.14,15
The advent of single-cell RNA sequencing (scRNA-seq) has greatly expanded our understanding of microglial heterogeneity, uncovering disease-specific subpopulations,16,17 such as disease-associated microglia (DAM) in AD and microglia engaged in the clearance of oxidized phosphatidylcholine in multiple sclerosis.18,19 In this study, we used scRNA-seq to characterize both established and previously unrecognized markers of major brain cell types, thereby providing a more comprehensive view of the molecular and cellular mechanisms underlying cerebral ischemia-reperfusion injury. Through distinct gene expression patterns, we identified ischemic stroke-associated microglia (ISAM) and further revealed their transcriptional dynamics and heterogeneity during post-stroke neuroinflammation. These stroke-associated microglial subpopulations, characterized by their signature genes, immune functions, metabolic states, and regulatory microenvironments, provide new insights into the pathogenesis of ischemic stroke. Accordingly, targeting these microglial populations may represent a highly promising therapeutic strategy for ischemic stroke.
Materials and Methods
Animal
Healthy male Sprague-Dawley (SD) rats weighing 230–260 g were purchased from Liaoning Changsheng Biotechnology Company Limited. Rats were housed in a standard laboratory environment at 21–25 °C with a 12 h light/dark cycle and free access to food and water. All experiments adhered to the Guide for the Care and Use of Laboratory Animals and were approved by the Institutional Animal Care and Use Committee of Harbin Medical University.
Rat Model of Cerebral Ischemia-Reperfusion
The rats were anesthetized via intraperitoneal injection of 3% pentobarbital sodium (40 mg/kg). They were placed on a temperature-controlled heating pad to maintain body temperature at 37 °C. The middle cerebral artery occlusion/reperfusion (MCAO/R) model was established using the modified thread embolism method. The left common carotid artery, external carotid artery, and internal carotid artery were carefully separated by blunt dissection. The thread (Jialing Biotechnology, Cat. No. L3400, Guangzhou, China) was gradually inserted into the distal end of the external carotid artery after excision, and then was slowly advanced in the intracranial direction until resistance was felt, indicating occlusion of the middle cerebral artery. After 2 hours of ischemia, the filament was withdrawn to allow reperfusion for 1 day. The sham group underwent the same anesthesia and surgical procedures but without thread insertion. After full recovery from anesthesia, the success of the cerebral ischemia model was assessed using the modified Zea-Longa neurological deficit score.20
The modified Zea-Longa neurological deficit score: 0, no neurological impairment; 1, inability to fully contract the contralateral forelimb upon tail elevation; 2, spontaneous circling behavior; 3, severe postural leaning; 4, absence of spontaneous locomotion and loss of consciousness. Rats scoring 2–3 were considered successfully modeled and were selected for further experiments.
Single-Cell RNA Sequencing (scRNA-Seq)
The rats were allocated to sham and MCAO/R groups (n = 5 per group). Following perfusion with ice-cold phosphate-buffered saline (PBS), the brain hemispheres were rapidly isolated. The brain tissues were washed three times with Hank’s balanced salt solution (HBSS) and preserved in GEXSCOPE tissue preservation solution (Singleron Biotechnologies, Nanjing, China) until further processing. The brain tissues were diced into 1–2 mm3 pieces, digested in GEXSCOPE tissue dissociation solution (Singleron Biotechnologies, Nanjing, China) at 37 °C for 15 minutes, and filtered through a 40 μm cell strainer (Bel-Art, Flowmi H13680-0040, New Jersey, USA). The cells were subsequently centrifuged, washed with PBS, resuspended in GEXSCOPE red blood cell lysis buffer (Singleron Biotechnologies, Nanjing, China), and incubated at room temperature for 10 minutes. The suspension was then centrifuged and washed with PBS again. The brain tissues from each group were pooled into single-cell suspensions for subsequent experiments.
Single-cell suspensions were loaded into a microfluidic device to capture individual cells and extract RNA, which was then reverse-transcribed into cDNA. The raw data were processed using CeleScope v1.5.2 (Singleron Biotechnologies, Nanjing, China) to generate gene expression profiles. Libraries were quantified using a Qubit 2.0 fluorometer and analyzed for insert size using an Agilent 2100/4200 Bioanalyzer. After ensuring the expected insert size, library concentrations were assessed via RT-qPCR for quality control. Sequencing was performed on an Illumina HiSeq X platform, and the data were stored in the NCBI Gene Expression Omnibus database (GSE199558).
Quality Control, Clustering, and Dimensionality Reduction
Quality control, dimensionality reduction, and clustering analyses were conducted using Scanpy v1.8.1 in a Python 3.7 environment. The data filtering criteria included the following: 1) removal of cells with fewer than 200 genes or within the top 2% for gene counts; 2) exclusion of cells in the top 2% for UMI counts; 3) elimination of cells with a mitochondrial content exceeding 20%; and 4) removal of genes expressed in fewer than 5 cells. The data were normalized on the basis of total counts per cell and log-transformed. The top 2000 highly variable genes were selected with the flavor = “seurat” parameter and analyzed via principal component analysis. The first 20 principal components were used for clustering with the Louvain algorithm and visualized with Uniform Manifold Approximation and Projection (UMAP).
Differentially Expressed Gene Analysis
Differentially expressed genes (DEGs) were identified using Scanpy’s sc.tl.rank_genes_groups() function with the default Wilcoxon rank-sum test. Genes expressed in at least 10% of the cells in either group with |log2 fold change (FC)| > 1 were considered DEGs. The Benjamini-Hochberg correction was applied, and a corrected P < 0.05 was deemed statistically significant.
Functional Enrichment Analysis
Gene Ontology (GO) and Kyoto Encyclopedia of Genes and Genomes (KEGG) pathway analysis of the DEGs were performed using the R package clusterProfiler v3.16.1. The GO pathway analysis included the biological process (BP), cellular component (CC), and molecular function (MF) categories. Pathways with adjusted P < 0.05 were considered significantly enriched and visualized via bar plots. For shared microglial subclusters between the two groups, gene set enrichment analysis (GSEA) was used for pathway enrichment analysis.
Pseudotime Trajectory Analysis
The cell differentiation trajectories of the microglial subtypes were reconstructed using Monocle2 v2.10.0. The top 2000 highly variable genes identified via FindVariableFeatures() in Seurat v3.1.2 were used for dimensionality reduction with DDRTree and trajectory construction. The plot_cell_trajectory() function in Monocle2 was used for visualization.
Transcription Factor Regulatory Network Analysis
The transcription factor regulatory network was constructed using pySCENIC v0.11.0, which is based on single-cell RNA expression matrices and transcription factors from AnimalTFDB. GRNBoost2 was used to predict co-expression networks, CisTarget was applied to eliminate indirect targets and identify binding motifs, and AUCell was used to quantify transcription factor activity in each cell. Regulon activity scores (RASs) were calculated to quantify the activity of transcriptional regulators within individual cells and across clusters, which were visualized as heatmaps. Regulator specificity scores (RSSs) were computed to evaluate the specificity of each regulon across clusters, enabling the identification of cluster-specific transcriptional regulators.
Cell-Cell Communication Analysis
CellPhoneDB v2.1.0 was used to predict ligand-receptor interactions between microglia and other cell types, with 1000 permutations for significance testing. Interaction significance was defined as P < 0.05 and |log2FC| > 1. The results were visualized using heatmap and dot plot representations.
Immunofluorescence
Following euthanasia, the rats were perfused with cold PBS and then 4% paraformaldehyde (PFA) to fix the brain tissues. The tissues were fixed in 4% PFA for 24 hours and dehydrated sequentially in 10%, 20%, and 30% sucrose gradients at 4 °C. Paraffin-embedded tissue sections (5 μm) were deparaffinized, subjected to antigen retrieval, and blocked with 3% hydrogen peroxide and 3% bovine serum albumin (BSA). The sections were stained with IBA1 (Cell Signaling Technology, Cat. No. 17198, Boston, MA, USA), ATF3 (Abcam, Cat. No. ab254268, Cambridge, MA, USA), CH25H (Abcam, Cat. No. ab214295, Cambridge, MA, USA), SPP1 (Proteintech, Cat. No. 22952-1-AP, Wuhan, China), and EGR1 (Proteintech, Cat. No. 22008-1-AP, Wuhan, China) antibodies. Multicolor staining was performed using TSA technology. DAPI was used for nuclear staining, and images were captured using a 3DHISTECH scanner.
HAPI Cell Culture and Experimental Treatments
HAPI Cells (Yaji Biotechnology, Shanghai, China) were cultured in high-glucose DMEM containing 10% FBS and 1% antibiotics under standard conditions (37 °C, 5% CO2, 95% relative humidity). For the oxygen-glucose deprivation/reoxygenation (OGD/R) model, the cells were washed with PBS, cultured in glucose-free medium (Gibco, Cat. No. 11966025, New York, USA), and incubated in a hypoxic environment (1% O2, 95% N2, 5% CO2) at 37 °C for 8 hours. After replacing with the normal culture medium, continue the cultivation for 12 hours before sample collection. ATF3 overexpression plasmids, using PCDNA3.1 as the vector (Genechem), and siRNA were transfected into HAPI cells using Lipofectamine 2000 transfection reagent (Thermo Fisher Scientific, Cat. No. 11668500, Waltham, MA, USA). After 48 h, the cells were harvested for RT-qPCR and Western blot analysis.
Real Time Quantitative PCR (RT-qPCR)
Total RNA was extracted using TRIzol™ reagent (Invitrogen, Cat. No. 15596026, Carlsbad, California, USA) and quantified using a spectrophotometer. cDNA synthesis was performed using a reverse transcription kit (Takara, Cat. No. FSQ-101, Kyoto, Japan). Each RT-qPCR reaction (10 μL) contained cDNA, gene-specific primers, RNase-free water, and SYBR Green Master Mix (Roche, Cat. No. 4913914001, Basel, Switzerland). The reaction conditions included preincubation (95 °C for 30s), amplification cycles (95 °C for 5s, 60 °C for 30s) for 40 cycles, and a melting curve stage (95 °C for 15s, 60 °C for 60s). Actin was used as the reference gene.
The primer sequences are listed in Table 1.
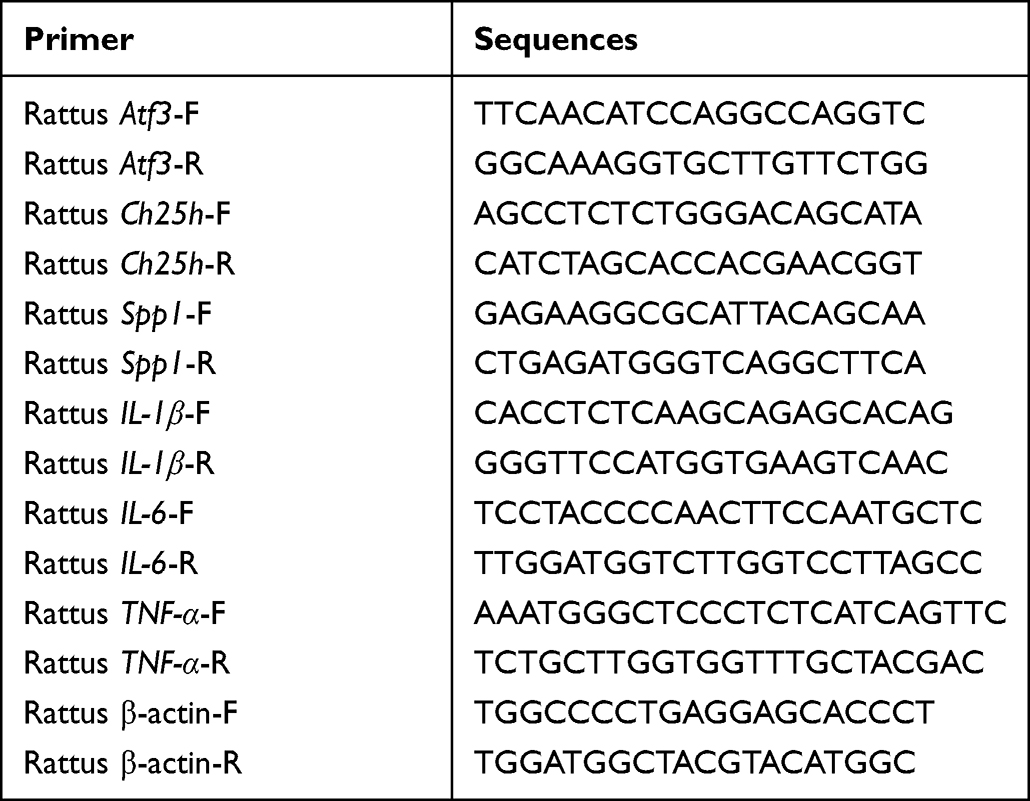 |
Table 1 List of Primer Sequences |
Western Blot
Proteins were extracted using RIPA lysis buffer (Beyotime, Cat. No. P0013B, Shanghai, China) containing protease and phosphatase inhibitors, and protein concentrations were measured using a BCA kit (Beyotime, Cat. No. P0010, Shanghai, China). Protein samples (20 μg) were separated via SDS-PAGE, transferred onto NC membranes, and blocked with 5% skim milk. The membranes were incubated overnight at 4 °C with primary antibodies against β-actin (Abways, Cat. No. AB0035, Shanghai, China), SDHB (Proteintech, Cat. No. 10620-1-AP, Wuhan, China), ATF3 (Abcam, Cat. No. ab254268, Cambridge, MA, USA), CH25H (Immunoway, Cat. No. YN4959, Plano, Texas, USA) and SPP1 (Proteintech, Cat. No. 22952-1-AP, Wuhan, China). After secondary antibody incubation, protein bands were scanned with an Odyssey CLx Imaging System (LI-COR Biosciences, Lincoln, Nebraska, USA) and subsequently analyzed and processed using Image Studio software.
Statistical Analysis
Data analysis was performed using GraphPad Prism 9.0. ANOVA (F-test) was used for multiple-group comparisons, whereas two-group comparisons were performed via two-tailed t tests. Statistical significance was set at P < 0.05. The data are presented as the means ± SDs (ns=no significant, *P < 0.05, **P < 0.01, ***P < 0.001).
Results
Cell Type Identification
To comprehensively investigate the changes in major cell types in the ischemic hemisphere, we utilized scRNA-seq to analyze brain tissue from both the sham group and the MCAO/R group (Figure 1A). In total, 12,609 cells were profiled, including 5316 cells from the sham group and 8688 cells from the MCAO/R group (Figure 1B). Based on differential gene expression profiles, we conducted unsupervised clustering and cell-type annotation, assigning each cell to a distinct cluster. UMAP visualization revealed 14 major cell clusters (Figure 1C), encompassing astrocytes, capillary endothelial cells (CPECs), ependymal cells, oligodendrocytes, neuroblasts, endothelial cells (ECs), fibroblasts, pericytes, B lymphocytes (B Cells), T lymphocytes (T cells), neutrophils, macrophages (MPs), microglia, and plasmacytoid dendritic cells (pDCs). The relative proportions of these cell clusters differed between the two groups (Figure 1D).
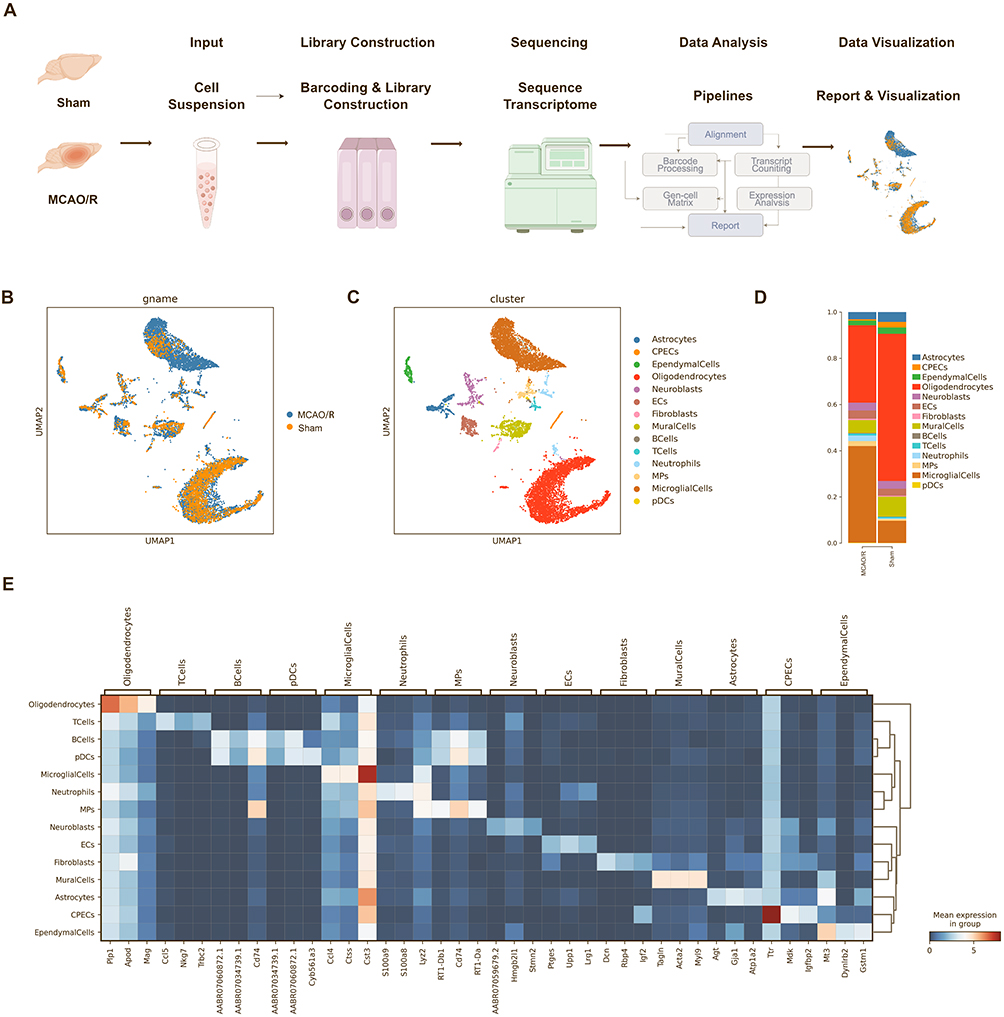 |
Figure 1 Identification of cell types from the ischemic hemisphere in rats after ischemic stroke. (A) Schematic illustration of the experimental design and analysis workflow. (B) UMAP projections of 12,609 transcriptomic profiles from the sham and MCAO/R groups. (C) Unsupervised clustering was used to divide the cells into 14 distinct clusters, represented by different colors. (D) Stacked bar graphs showing the proportions of cell types in the sham and MCAO/R groups. (E) Heatmap depicting the scaled expression of the top three marker genes in each cluster between the sham and MCAO/R groups. |
Additionally, we performed a detailed identification of the marker genes for each cell type and generated heatmaps highlighting the top three markers per cluster (Figure 1E). Consistent with previous studies, we observed an increase in infiltrating macrophages and neutrophils following cerebral ischemia-reperfusion injury, suggesting potential dysfunction of the blood-brain barrier.21 Moreover, the number of microglia was significantly elevated, likely reflecting activation of the neuroinflammatory response triggered by acute ischemic brain injury, which promotes microglial proliferation.22 Collectively, these findings reveal dynamic alterations in the cellular composition of the ischemic hemisphere and provide valuable insights into the mechanisms underlying post-stroke neuroinflammatory responses.
Cerebral Ischemia-Reperfusion Injury Induces Heterogeneous Microglial Clusters
Given the critical role of microglia in the brain, we focused on investigating the heterogeneity of microglia at the single-cell level and categorized them into seven distinct subclusters for further analysis. Based on the molecular characteristics and functions of these subclusters, we defined different microglial states for each (Figure 2A and B). According to the proportion analysis, 90.8% of the microglia in the sham group belonged to the MG1 and MG2, whereas the proportion of MG3 remained largely unchanged between sham and MCAO/R groups. In contrast, the proportion of MG4 significantly increased in the MCAO/R group. The MG5, MG6, and MG7 subclusters emerged specifically following cerebral ischemia-reperfusion injury (Figure 2C). Therefore, we identified the MG4, MG5, MG6, and MG7 as key microglial subclusters during the acute cerebral ischemia-reperfusion injury and further investigated how these subpopulations coordinate adaptive responses to cerebral ischemia-reperfusion injury.
Figure 2 Continued. Figure 2 Identification of seven microglial subclusters via scRNA-seq after ischemic stroke. (A) UMAP projection of microglia from the sham and MCAO/R groups. (B) UMAP plot annotated with seven identified microglial subclusters. (C) Stacked bar plots showing the proportions of each microglial subcluster in sham and MCAO/R groups. (D) Heatmap of marker genes specific to each microglial subcluster across sham and MCAO/R groups. (E) Dot plot of the top three marker genes for each subcluster; dot size represents the percentage of cells expressing the gene, and color indicates scaled average expression. (F) UMAP plots showing expression of selected genes enriched in specific clusters; each dot represents a single cell, with normalized expression projected onto the UMAP.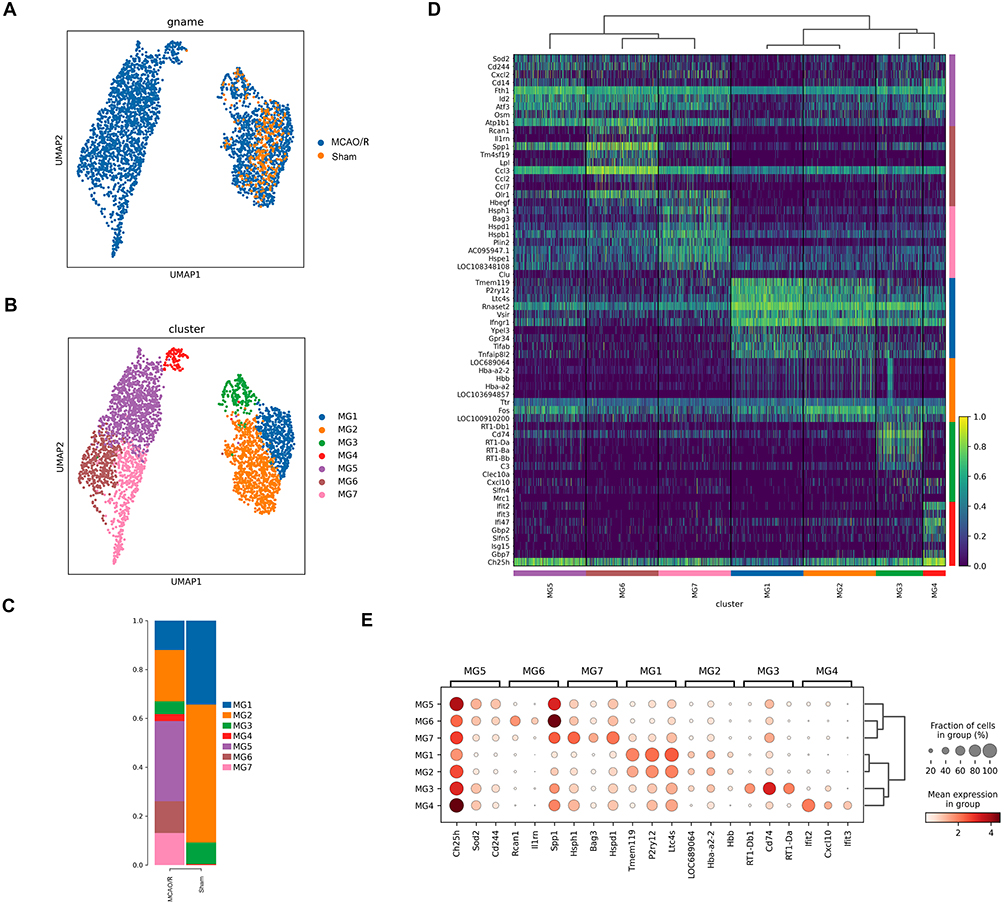
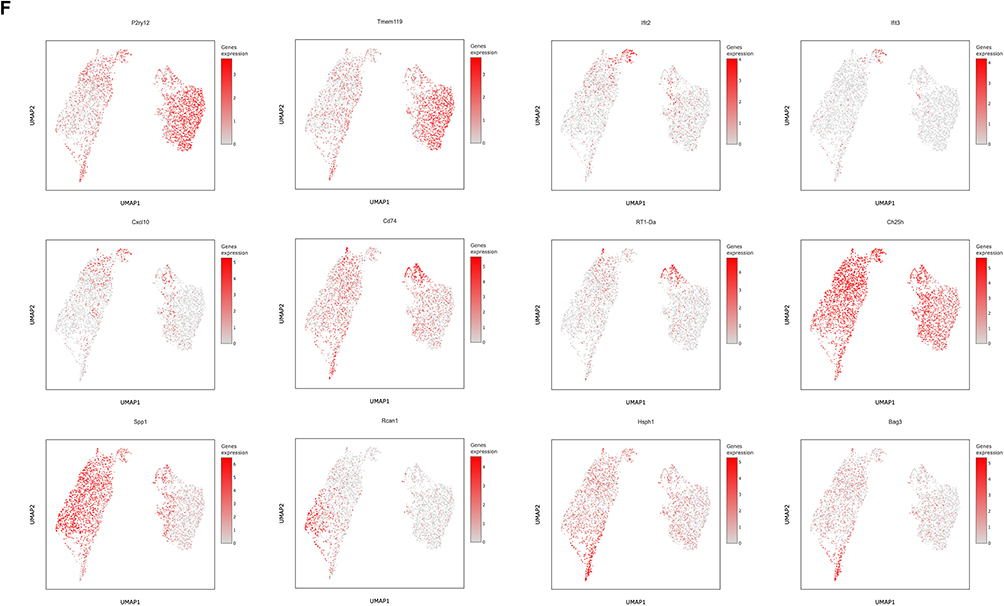
Next, we identified the specific marker genes for each microglial subcluster. The majority of highly expressed genes were subcluster-specific, highlighting the distinct transcriptional profiles of each microglial subpopulation. The top 10 marker genes for each microglial subcluster were identified based on DEGs and presented as heatmaps (Figure 2D and E). We observed that homeostatic microglial genes, including TMEM119, P2RY12, and P2RY13, were highly expressed in the MG1 and MG2 subclusters, indicating that these subclusters likely represent relatively homeostatic microglia with robust immune surveillance functions. In contrast, the MG3 subcluster predominantly expressed genes associated with the major histocompatibility complex (MHC), such as CD74, RT1-D, and RT1-B (Figure 2F).
Furthermore, we observed that the MG4, MG5, MG6, and MG7 subclusters exhibited typical DAM features. MG4 expressed interferon-response-related markers, including IFIT2, IFIT3, and CXCL10, suggesting a potential role in antiviral and immune response following cerebral ischemia-reperfusion injury. Specifically, the MG5 subcluster predominated among microglia during the acute cerebral ischemia-reperfusion injury and was characterized by high expression of marker genes such as CH25H, SOD2, and CD244, which are closely associated with neuroinflammation, tissue repair, and immune response. MG6 was marked by elevated expression of Rcan1, IL1RN, and SPP1, whereas MG7 was enriched in heat shock protein-related genes (HSPH1, HSPD1, BAG3), potentially reflecting cellular stress responses, protein folding, and tissue repair (Figure 2F). Notably, CH25H was highly expressed across all four subclusters, and CH25H and SPP1 were co-expressed particularly in MG4-MG7, with the strongest co-expression in MG5. This finding is significant, as the elevated expression of CH25H may serve as a key marker for post-stroke microglia, implicating these cells in the regulation of immune response and metabolic reprogramming.23,24 SPP1 is also an important marker associated with ischemic cerebral infarction.
Functional Characterization of Microglial Subclusters
We performed GO pathway analysis for the homeostatic microglial subclusters MG1 and MG2 observed that these subclusters exhibited significant immune response functions following cerebral ischemia-reperfusion injury, particularly in regulating cytokine-mediated signaling and inflammatory pathways. Notably, proinflammatory signaling pathways, such as the interleukin 6 (IL-6) signaling pathway, were significantly enriched in MG1 and MG2 in the MCAO/R group. These findings suggest that MG1 and MG2 may exacerbate tissue damage during the acute cerebral ischemia-reperfusion injury by mediating excessive proinflammatory responses and chemotactic signaling, thereby exerting deleterious effects. Functional annotation revealed distinct roles for each microglial subcluster. MG3 was enriched in pathways related to ribosome biogenesis, antigen processing, and presentation, highlighting its central role in immune response. MG4 exhibited characteristics associated with interferon responses, suggesting involvement in antiviral defense. MG5 was primarily associated with neuronal death and stress-response pathways, indicating a potential role in tissue repair following cerebral ischemia-reperfusion injury. MG6 was linked to inflammatory cell chemotaxis, hypoxia responses, and extracellular signal-regulated kinase (ERK) cascade signaling, implicating it in post-stroke inflammation and tissue repair. MG7 was enriched in the transforming growth factor-beta (TGF-β) signaling pathway and wound-healing processes, suggesting a role in tissue regeneration (Figure 3A).
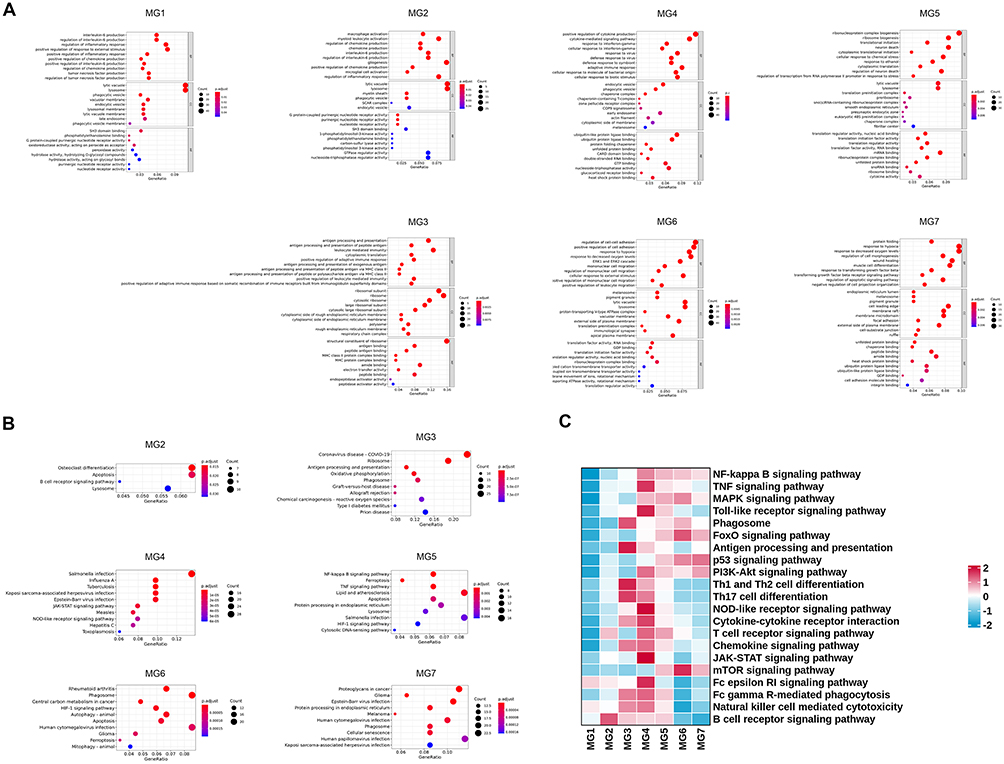 |
Figure 3 Distinct features of microglial clusters. (A) GO enrichment analysis of the top 10 biological process (BP), cellular component (CC), and molecular function (MF) terms among DEGs between sham and MCAO/R groups. (B) KEGG pathway analysis showing the top 10 enriched pathways for microglial DEGs between the two groups. (C) GSVA of canonical pathways enriched in microglial DEGs from sham and MCAO/R groups. |
KEGG pathway analysis was performed to further characterize the functional profiles of microglial subclusters following cerebral ischemia-reperfusion injury. MG1 was significantly enriched only in the lysosome pathway (not shown). MG2 was enriched in apoptosis and osteoclast differentiation pathways, suggesting potential involvement in cell death and tissue remodeling. MG3 was enriched in pathways related to COVID-19 infection, OXPHOS, and antigen processing and presentation, indicating a role in immune response and defense mechanisms under pathological conditions. MG4 was predominantly enriched in the JAK-STAT signaling pathway, highlighting its importance in immune regulation and cellular responses. MG5 was enriched in multiple pathways, including tumor necrosis factor (TNF) signaling, nuclear factor kappa-light-chain-enhancer of activated B cells (NF-κB) signaling, ferroptosis, lipid metabolism, and hypoxia-inducible factor 1-alpha (HIF-1α) signaling, suggesting its involvement in diverse inflammatory and metabolic processes associated with cerebral ischemia-reperfusion injury (Figure 3B).
Additionally, gene set variation analysis (GSVA) revealed significant differences in the inflammatory immune-related KEGG pathways across microglial subclusters following cerebral ischemia-reperfusion injury. Notably, the MG4 and MG5 subclusters exhibited the strongest enrichment in inflammatory response pathways, suggesting that these subpopulations may play crucial roles in immune regulation and inflammatory responses following cerebral ischemia-reperfusion injury (Figure 3C).
Metabolic Features of Microglia Following Cerebral Ischemia-Reperfusion Injury
To explore the metabolic characteristics of different microglial subclusters, we performed GSVA. The results revealed that microglia are highly active in lipid metabolism and amino acid metabolism, especially in pathways related to lipid, cholesterol, and phospholipid metabolism and amino acid biosynthesis after ischemic stroke.25–27 Further analysis revealed that the ISAM subclusters MG4, MG5, MG6, and MG7 are likely more reliant on the glycolysis pathway, whereas MG1, MG2, and MG3 preferentially utilize the TCA cycle, OXPHOS, and pyruvate metabolism. Moreover, the observed disruption of the TCA cycle in ISAM may lead to the accumulation of intermediate metabolites, particularly succinate. These metabolic alterations suggest that microglial metabolic reprogramming following cerebral ischemia-reperfusion injury is driven primarily by upregulation of the HIF-1α signaling pathway and the pentose phosphate pathway (Figure 4A and B).
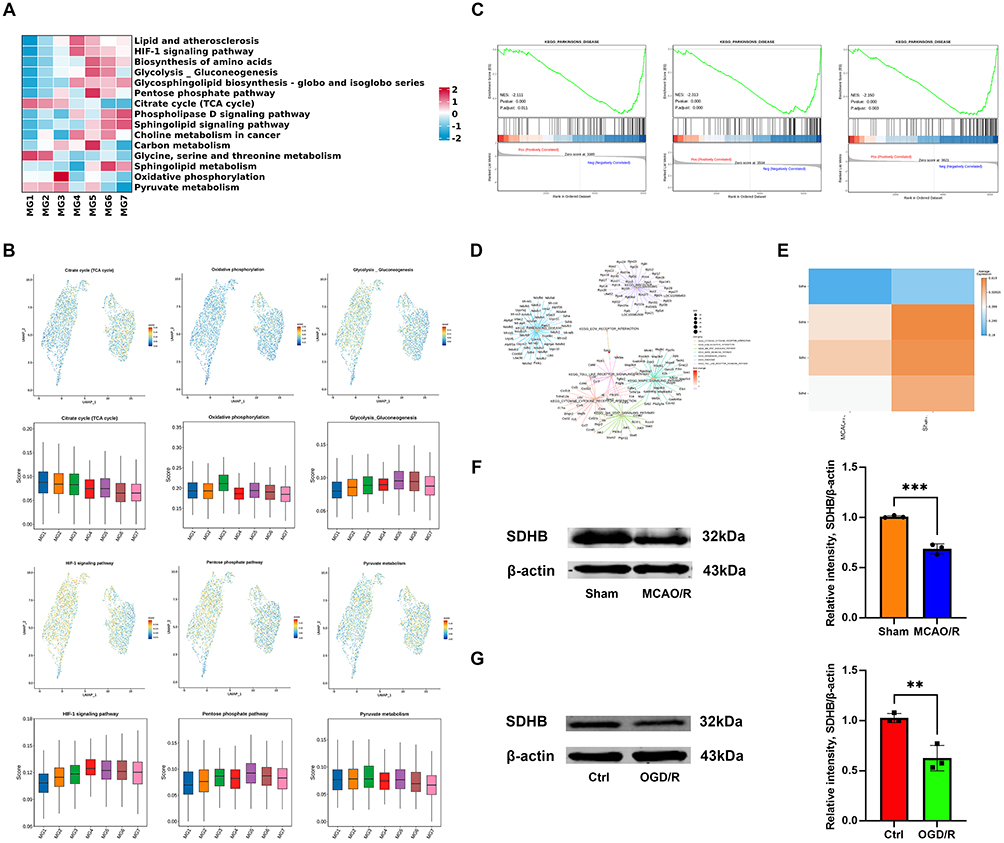 |
Figure 4 Metabolic characteristics of microglia after ischemic stroke. (A) GSVA showing differential enrichment of biological processes across microglial clusters. (B) Gene score feature plots and box plots of representative metabolic genes, including those involved in the TCA cycle, OXPHOS, glycolysis/gluconeogenesis, HIF-1α signaling, the pentose phosphate pathway, and pyruvate metabolism. (C) GSEA comparing MG1, MG2, and MG3 subclusters between sham and MCAO/R groups; metrics include false discovery rate (FDR) and normalized enrichment score (NES). (D) GSEA of pathways and gene networks specific to the MG2 subcluster. (E) Heatmap of DEGs related to SDH in microglia between sham and MCAO/R groups. (F and G) Western blot analysis of the SDHB protein levels in the sham vs MCAO/R and Ctrl vs OGD/R groups. The data are shown as the mean ± SD of three independent experiments; **P < 0.01, ***P < 0.001 (n=3). |
We further performed GSEA on microglial subclusters common to both groups. Interestingly, MG1, MG2, and MG3 shared a notable feature: the PD pathway was significantly downregulated (Figure 4C). For example, in the MG2 subcluster, GSEA revealed key DEGs associated with PD, particularly succinate dehydrogenase (SDH) genes, including SDHA, SDHB, SDHC, and SDHD (Figure 4D). Comparison of SDH gene expression between the two groups showed a general downregulation in the MCAO/R group (Figure 4E). One day after cerebral ischemia-reperfusion injury, the protein level of SDHB in the infarcted hemisphere tissue was significantly lower than that in the sham group (Figure 4F). Similarly, in vitro OGD/R experiment in HAPI cells also revealed a decrease in SDHB protein level (Figure 4G). As a key enzyme in the TCA cycle, SDH subunits displayed distinct alterations in ISAM, indicating that ischemia-induced microenvironmental changes may drive metabolic and inflammatory reprogramming in these cells.28–30 Moreover, these findings reveal a potential link between ischemic stroke and PD, providing novel insights for future investigations into PD mechanisms.31,32 These metabolic changes activate downstream inflammatory and oxidative stress signaling pathways, further driving the alteration of microglial functions.33
Pseudotime Analysis
We performed pseudotime analysis to explore the differentiation trajectory of microglial subcluster differentiation following cerebral ischemia-reperfusion injury, simulating the transition from a homeostatic to a disease-associated state. The analysis revealed that microglial differentiation initiates from the MG1, MG2, and MG3 subclusters, which subsequently give rise to the ischemia-associated MG4, MG5, MG6, and MG7 subclusters (Figure 5A). The trajectory comprises two primary branches, Path1 and Path2 (Figure 5B), and further delineation of the differentiation process identified five distinct stages of microglial maturation (Figure 5C).
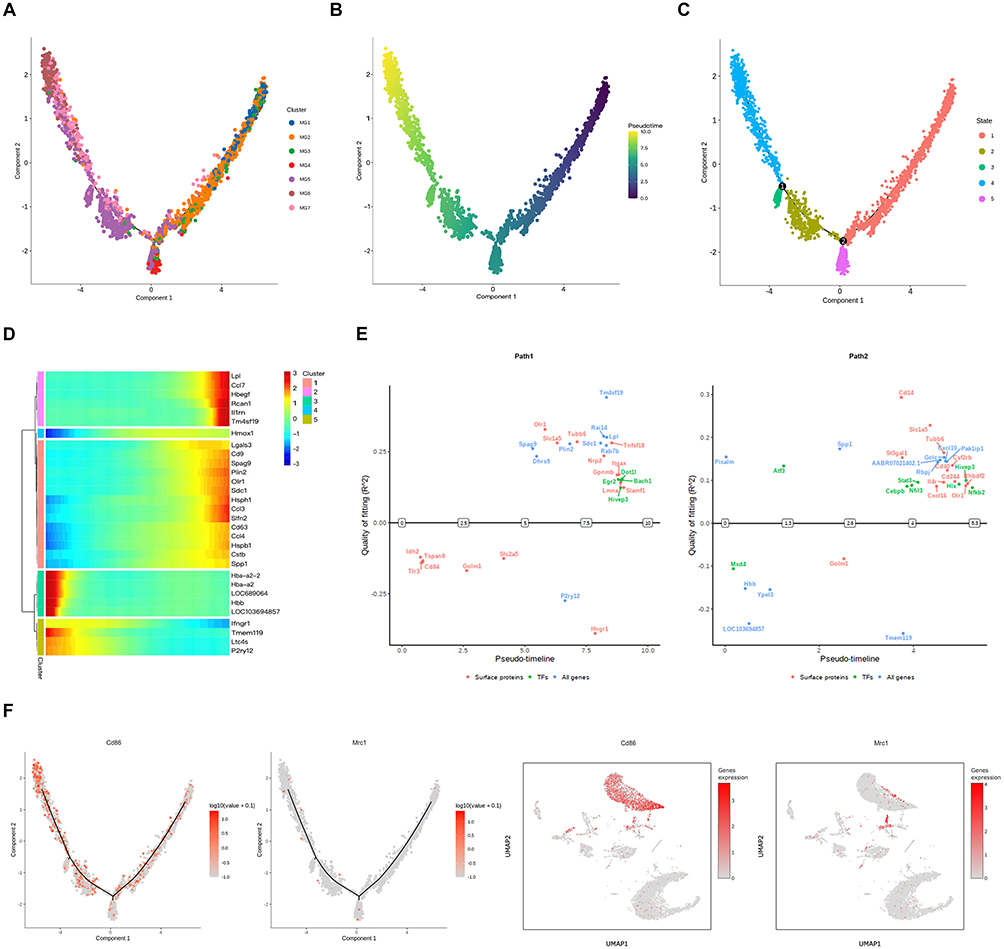 |
Figure 5 Pseudotime trajectory of microglial subcluster differentiation after ischemic stroke. (A) Monocle pseudotime trajectory of MG1-MG7 subclusters, colored by subcluster identity. (B) Identification of two differentiation branches from MG1/MG2 toward MG4 and MG5-MG7 subclusters; colors indicate pseudotime stages. (C) Five distinct differentiation stages in microglia. (D) Heatmap of DEGs across pseudotime, illustrating temporal changes in gene expression. (E) Gene switches along the trajectory highlighting dynamic transcriptional regulation. (F) Expression patterns of M1 and M2 microglial marker genes along the trajectory. |
The gene expression heatmap across the five differentiation stages of the microglial subclusters revealed dynamic changes in gene expression during microglial differentiation. Analysis along pseudotime further indicated that homeostatic microglial genes, such as TMEM119 and P2RY12, were gradually downregulated, whereas genes associated with lipid metabolism, proliferation, and inflammation, including LDL, SPP1, and RCAN1, were upregulated. These upregulated genes were predominantly enriched in ISAM subclusters (Figure 5D).
The overall microglial differentiation trajectory exhibited two branching paths, each associated with specific switch genes. Switch genes for Path1 included the transcription factors DOT1l, EGR2, BACH1, and HIVEP3, with Path1 predominantly linked to the interferon signaling pathway, suggesting a close association with immune response and inflammation. Switch genes for Path2 included the transcription factors ATF3, MXD4, HIVEP3, STAT3, HLX, NFIL3, CEBPB, and NF-κB2, with ATF3 emerging as the most prominent switch gene (Figure 5E). Path2 was enriched in pathways related to stress response, apoptosis, tissue repair, and remodeling, potentially reflecting distinct microglial adaptations following cerebral ischemia-reperfusion injury.
To investigate whether microglial subclusters differentiate along classical M1 and M2 phenotypes following cerebral ischemia-reperfusion injury, we analyzed the expression trajectories of canonical M1 and M2 marker genes. M1 microglia were marked by CD86, whereas M2 microglia were marked by CD206, encoded by mannose receptor C-type 1 (MRC1). Our results revealed no significant differences in the distribution of M1 and M2 markers along the differentiation trajectory (Figure 5F), suggesting that the traditional M1/M2 binary classification may not accurately capture the heterogeneity of microglial subclusters or fully reflect their functional changes following cerebral ischemia-reperfusion injury. However, scRNA-seq data indicated that CD86 is expressed in both microglia and macrophages, whereas Mrc1 is predominantly expressed in macrophages, implying that infiltrating macrophages could be misidentified as classical M2 microglia (Figure 5F).
Single-Cell Regulatory Network Inference and Clustering (SCENIC) Analysis
Transcription factors play crucial roles in transcriptional and epigenetic changes, which serve as key determinants in the regulation of gene expression. To further explore the molecular mechanisms underlying the formation of microglial subclusters following cerebral ischemia-reperfusion injury and to identify the intracellular regulatory factors driving microglial generation, we utilized SCENIC analysis. SCENIC analysis identified 30 transcription factors that were significantly enriched across the microglial subclusters (Figure 6A). Further analysis using regulatory activity scores (RASs) and regulatory specificity scores (RSSs) revealed that the MG4 subcluster exhibited relatively higher enrichment of transcription factors, predominantly from the IRF, STAT, and CEBP families. Additionally, KLF6 and HLX were identified as specific transcription factors upregulated in the MG5 subcluster following cerebral ischemia-reperfusion injury (Figure 6B).
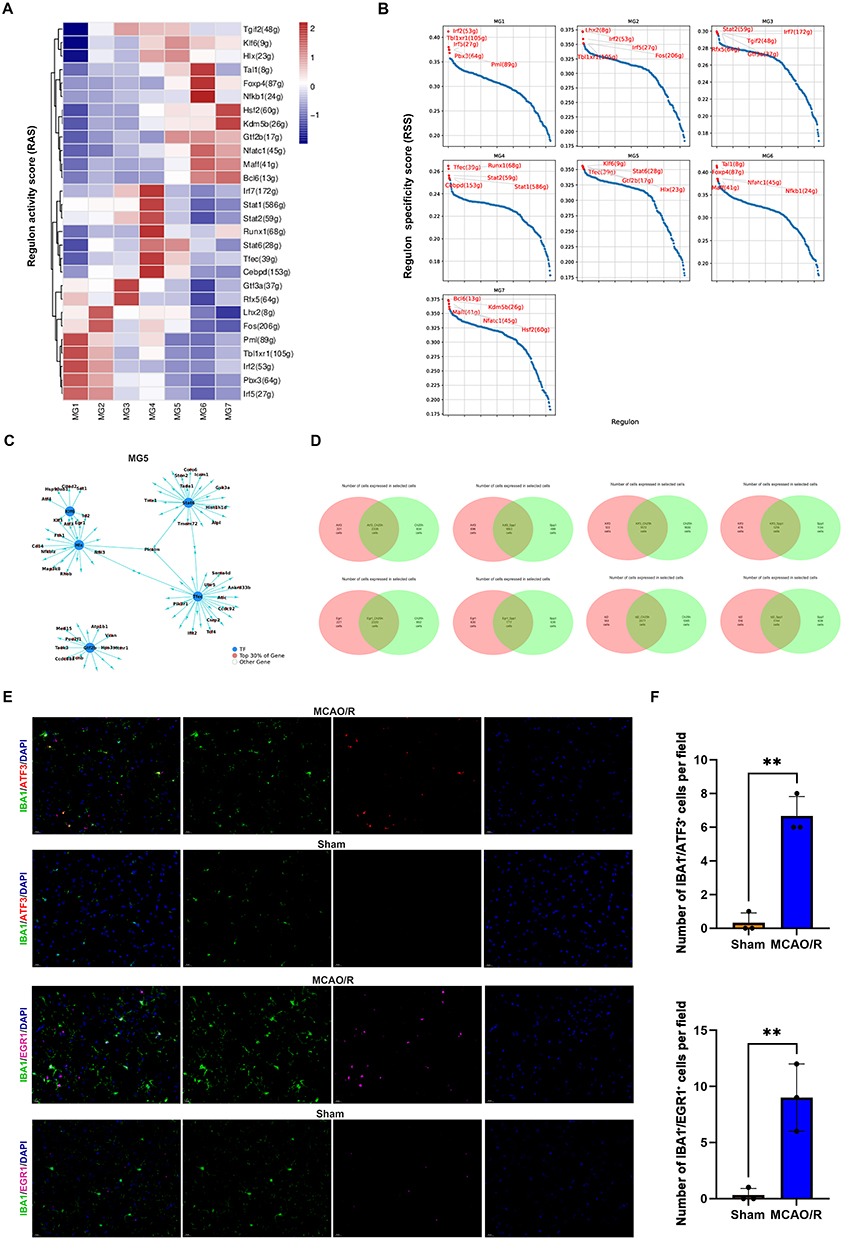 |
Figure 6 SCENIC analysis of microglial subclusters. (A) Transcription factor activity analysis specific to microglial subclusters. (B) Ranking of the top five most transcriptionally active transcription factors in each subcluster; regulon activity scores (RASs) and regulon specificity scores (RSSs) are shown. (C) Network diagram of transcription factor–target gene interactions in the MG5 subcluster. (D) Venn diagram showing co-expressed cells across subclusters. (E and F) Immunofluorescence staining of ATF3, EGR1 and the microglial marker IBA1 in the sham and MCAO/R groups. Scale bars, 20 μm; The data are shown as the mean ± SD of three independent experiments; **P < 0.01 (n=3). |
We further analyzed the downstream target gene network of microglial transcription factors in the MG5 subcluster. The results indicated that ATF3, ID3, EGR1, and KLF3 are key transcription factors co-regulated by KLF6 and HLX (Figure 6C). To validate the role of these transcription factors, we analyzed their co-expression with CH25H and SPP1. Venn diagram analysis revealed that ATF3 and EGR1 were the major transcription factors regulating CH25H and SPP1 (Figure 6D). Moreover, immunofluorescence staining confirmed that, following cerebral infarction, ATF3 and EGR1 levels were significantly increased in microglia (Figure 6E and F). These results highlight ATF3 as a key regulator of poststroke microglial function, with EGR1 also potentially contributing to microglial stress response and functional transformation.
In vivo, RT-qPCR analysis confirmed that the mRNA levels of ATF3, CH25H, and SPP1 were significantly upregulated following cerebral infarction (Figure 7A). Immunofluorescence analysis confirmed the colocalization of ATF3 with CH25H and SPP1 in microglia (Figure 7B). In vitro, RT-qPCR and Western blot analysis confirmed that the mRNA and protein levels of ATF3, CH25H, and SPP1 were significantly upregulated after OGD/R experiment (Figure 7C–F). ATF3 may drive the functional transformation and pathological responses of microglia following cerebral ischemia-reperfusion injury by regulating CH25H and SPP1. This regulatory axis likely facilitates the transition of microglia from a homeostatic state to an inflammatory and reparative phenotype. Targeting ATF3 or its downstream effectors may thus represent a promising strategy to modulate microglial function, reduce poststroke neuroinflammation, and promote tissue repair.
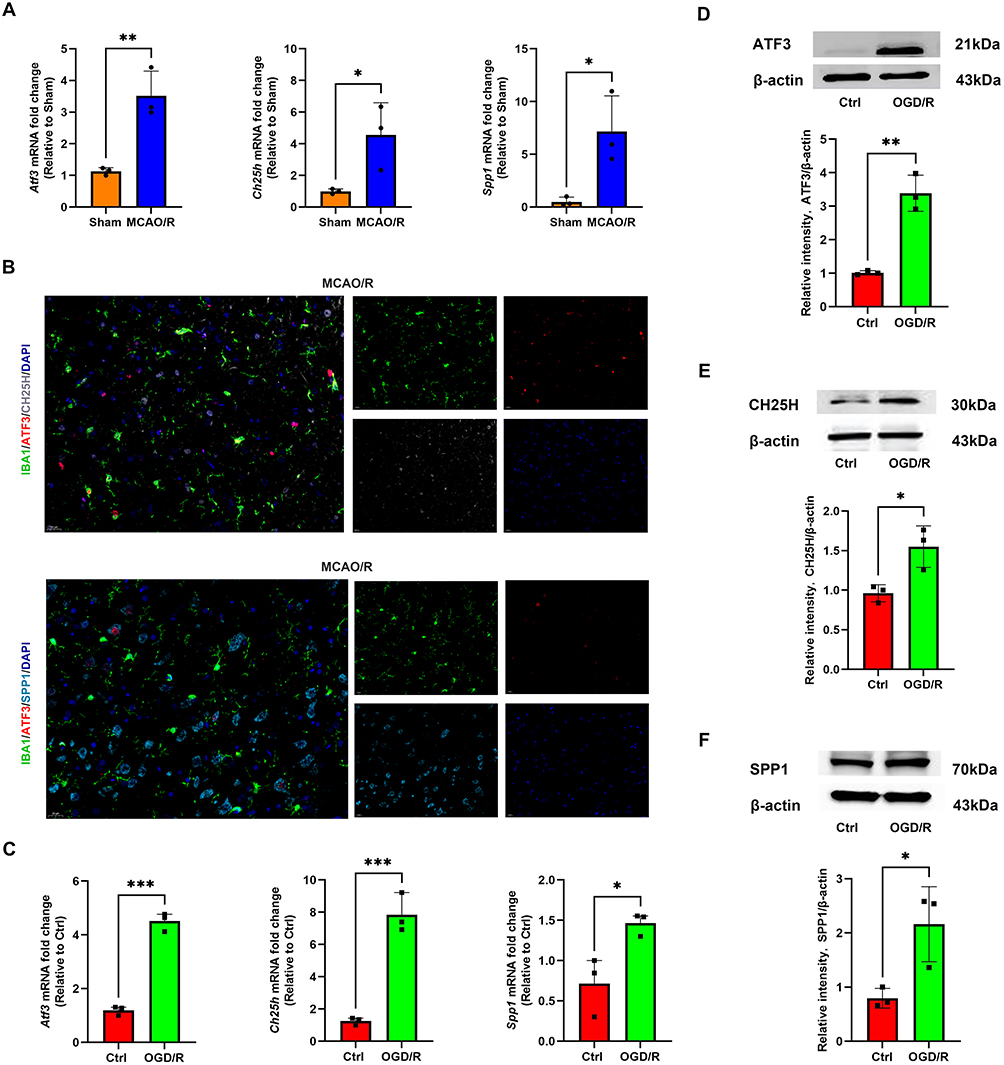 |
Figure 7 The expression of ATF3, CH25H, and SPP1 in microglia after ischemic stroke. (A) RT-qPCR was used to detect the mRNA level of ATF3, CH25H, and SPP1 in the sham and MCAO/R groups. The data are shown as the mean ± SD of three independent experiments; *P < 0.05, **P < 0.01 (n=3). (B) Immunofluorescence staining of ATF3, CH25H, SPP1 and the microglial marker IBA1 in the MCAO/R group. Scale bars, 20 μm. (C) RT-qPCR was used to detect the mRNA level of ATF3, CH25H, and SPP1 in the Ctrl and OGD/R groups. The data are shown as the mean ± SD of three independent experiments; *P < 0.05, ***P < 0.001 (n=3). (D–F) Western blot analysis of the ATF3, CH25H, and SPP1 protein levels in the Ctrl and OGD/R groups. The data are shown as the mean ± SD of three independent experiments; *P < 0.05, **P < 0.01 (n=3). |
Regulation of CH25H and Proinflammatory Cytokines by ATF3 in Microglia
To further elucidate the functional role of ATF3, we examined its regulatory effects on downstream target genes and proinflammatory cytokines in microglial cells. RT-qPCR analysis revealed that ATF3 overexpression (OE-ATF3) markedly increased ATF3 and CH25H mRNA expression, while the expression of SPP1 remained unchanged compared with negative controls (OE-NC) (Figure 8A). Consistent with these findings, Western blotting confirmed the upregulation of ATF3 and CH25H protein levels in the OE-ATF3 group, whereas SPP1 protein expression was not significantly affected (Figure 8B–D). In addition, ATF3 overexpression selectively enhanced TNF-α mRNA expression, whereas interleukin 1β (IL-1β) and IL-6 remained unchanged (Figure 8E).
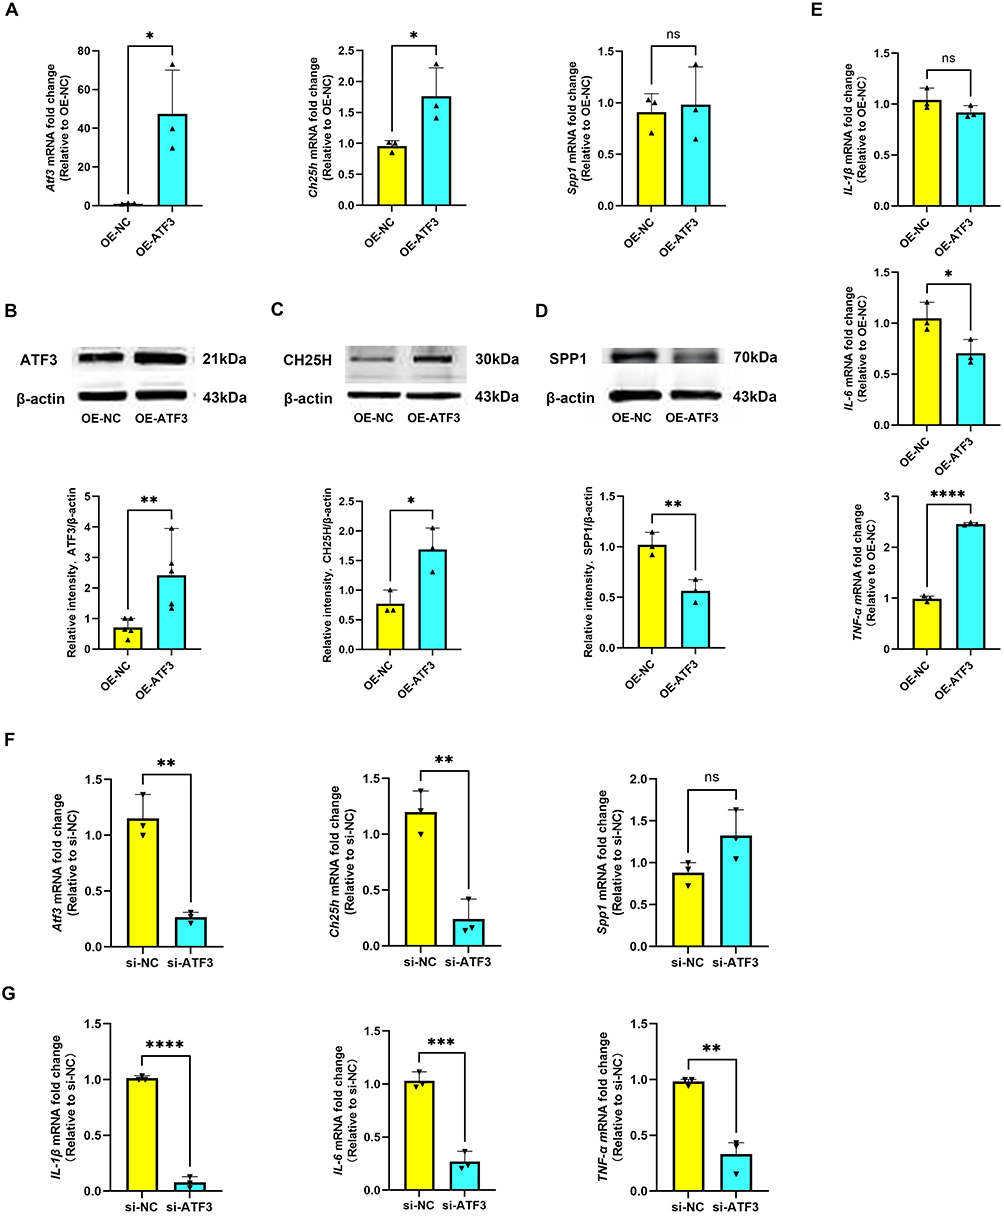 |
Figure 8 ATF3 regulates CH25H and proinflammatory cytokine expression in microglia. (A) RT-qPCR was used to detect the mRNA level of ATF3, CH25H, and SPP1 in the OE-NC and OE-ATF3 groups. The data are shown as the mean ± SD of three independent experiments; ns = not significant, *P < 0.05 (n=3). (B) Western blot analysis of the ATF3 protein levels in the OE-NC and OE-ATF3 groups. The data are shown as the mean ± SD of three independent experiments; **P < 0.01 (n=5). (C and D) Western blot analysis of the CH25H and SPP1 protein levels in the OE-NC and OE-ATF3 groups. The data are shown as the mean ± SD of three independent experiments; *P < 0.05, **P < 0.01 (n=3). (E) RT-qPCR was used to detect the mRNA level of IL-1β, IL-6, and TNF-α in the OE-NC and OE-ATF3 groups. The data are shown as the mean ± SD of three independent experiments; ns = not significant, *P < 0.05, ****P < 0.0001 (n=3). (F) RT-qPCR was used to detect the mRNA level of ATF3, CH25H, and SPP1 in the si-NC and si-ATF3 groups. The data are shown as the mean ± SD of three independent experiments; ns = not significant, **P < 0.01 (n=3). (G) RT-qPCR was used to detect the mRNA level of IL-1β, IL-6, and TNF-α in the si-NC and si-ATF3 groups. The data are shown as the mean ± SD of three independent experiments; **P < 0.01, ***P < 0.001, ****P < 0.0001 (n=3). |
In contrast, ATF3 knockdown by siRNA (si-ATF3) significantly suppressed ATF3 and CH25H expression at the mRNA level, with no observable effect on SPP1 (Figure 8F). Importantly, silencing ATF3 led to a pronounced reduction in IL-1β, IL-6, and TNF-α mRNA expression compared with negative controls (si-NC) (Figure 8G). Together, these results indicate that ATF3 positively regulates CH25H and proinflammatory cytokine expression, particularly TNF-α, thereby promoting microglial inflammatory responses.
Reshaping of Microglial Communication Networks After Cerebral Ischemia-Reperfusion
One of the hallmark features of cerebral ischemia-reperfusion injury is neuroinflammation, driven by interactions between the innate and adaptive immune systems. This process involves complex crosstalk among diverse brain cell types and is mediated by molecular adhesion to cell surfaces or the extracellular matrix, as well as the release of signaling molecules. To better understand the mechanisms of intercellular communication following cerebral ischemia-reperfusion injury, we employed the cell-cell communication inference (CCInx) approach, which leverages ligand-receptor interaction models to systematically investigate microglial communication with other brain cell types. In the sham group, the intercellular interaction network was dominated by astrocyte-endothelial cell (EC) interactions, reflecting typical communication patterns under physiological conditions (Figure 9A). In contrast, the MCAO/R group exhibited a markedly altered interaction landscape, characterized by a more prominent role of fibroblasts, suggesting that cerebral ischemia-reperfusion injury reorganizes intercellular communication networks (Figure 9B).
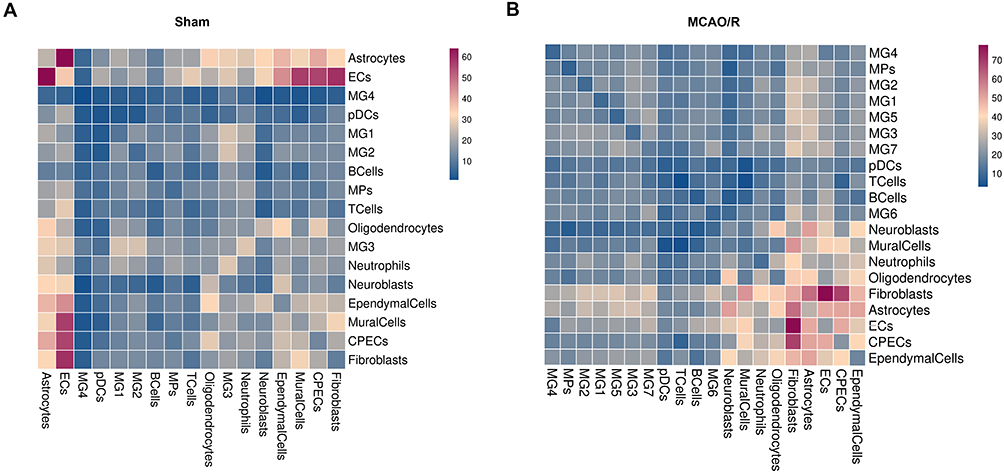 |
Figure 9 Microglial cell-cell interactions in sham and MCAO/R groups. (A and B) Heatmap depicting the number of potential interactions among the analyzed cell clusters. |
Analysis of microglia as ligands revealed distinct ligand-receptor interactions between microglial subclusters and other brain cell types when comparing the sham and MCAO/R groups. In the sham group, MG1 and MG2 primarily interacted with CPECs via ferritin heavy chain 1 to scavenger receptor class A member 5 (FTH1-SCARA5), likely reflecting the role of CPECs in cerebrospinal fluid synthesis and blood-cerebrospinal fluid barrier formation. Given that iron overload commonly occurs following cerebral ischemia-reperfusion injury, this interaction may contribute to iron clearance. MG3 exhibited strong crosstalk with astrocytes through endothelin-3 to endothelin receptor type B (EDN3-EDNRB) and TAX1 binding protein 3 to adhesion G protein-coupled receptor B2 (TAX1BP3-ADGRB2), implicating microglia-astrocyte communication in vascular remodeling and cell migration. MG3 also engaged endothelial cells via vascular endothelial growth factor B to Fms-related receptor tyrosine kinase 1 (VEGFB-FLT1) and angiopoietin 4 to TEK receptor tyrosine kinase (ANGPT4-TEK), indicating a role in angiogenesis and vascular barrier repair. MG4 interacted with astrocytes through prosaposin to G protein-coupled receptor 37-like 1 (PSAP-GPR37L1), supporting neuroprotection and anti-inflammatory signaling. Additionally, MG4 displayed broad interactions with multiple cell types, notably through apolipoprotein E to triggering receptor expressed on myeloid cells 2 (APOE-TREM2). As a key lipid metabolism protein, APOE engages TREM2 to promote microglial activation, migration, clearance of damaged cells, and modulation of neuroinflammatory responses (Figure 10A). In the MCAO/R group, interactions between the MG1 subcluster and astrocytes (PSAP-GPR37L1) were enhanced, whereas the MG2-MG7 subclusters exhibited more frequent interactions with CPECs and fibroblasts (FTH1-SCARA5), highlighting substantial alterations in microglial communication patterns following cerebral ischemia-reperfusion injury. Notably, the ligand-expressing microglial subclusters displayed a high degree of consistency in regulating key signaling pathways with other cell types (Figure 10B).
Figure 10 Continued. Figure 10 Visualization of selected ligand-receptor interactions between cell clusters. (A) Microglia acting as ligands in the sham group. Dot size represents p value, and color indicates scaled mean expression of each receptor-ligand pair. (B) Microglia acting as ligands in the MCAO/R group. Dot size represents p value, and color indicates scaled mean expression. (C) Microglia acting as receptors in the sham group. Dot size represents p value, and color indicates scaled mean expression. (D) Microglia acting as receptors in the MCAO/R group. Dot size represents p value, and color indicates scaled mean expression.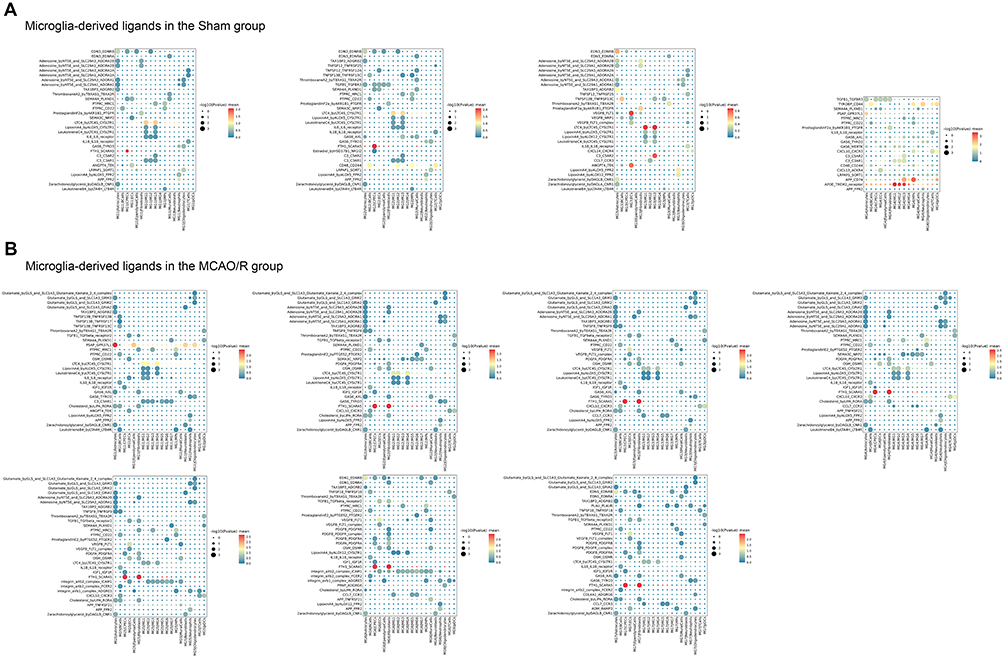
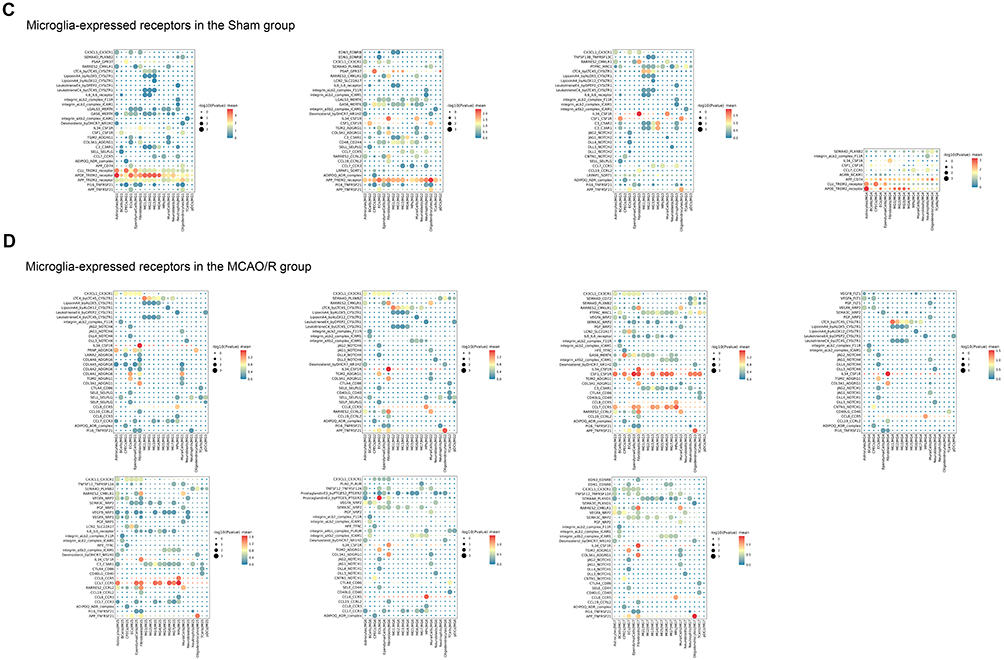
Significant differences were also observed when microglia acted as receptors. In the sham group, MG1-MG4 subclusters, functioning as receptors, maintained strong interactions with astrocytes, endothelial cells, and macrophages, mediated by key ligand-receptor pairs such as clusterin to TREM2 (CLU-TREM2), amyloid beta precursor protein to TREM2 (APP-TREM2), colony-stimulating factor 1 to colony-stimulating factor 1 receptor (CSF1-CSF1R), and IL34-CSF1R (Figure 10C). In the MCAO/R group, these subclusters displayed more diverse interactions, particularly within chemokine, G protein-coupled receptor (GPCR), TNF, and NOTCH signaling pathways, reflecting complex crosstalk with multiple cell types. Activation of chemokine pathways poststroke is associated with immune cell recruitment, especially neutrophils and monocytes, initiating inflammation and promoting neuronal repair. GPCR-mediated interactions suggest roles in vascular repair and extracellular matrix remodeling; for instance, transglutaminase 2 (TGM2) binding to adhesion G protein-coupled receptor G1 (ADGRG1) may facilitate matrix remodeling and collagen deposition.34 Meanwhile, APP-TNF receptor superfamily member 21 (TNFRSF21) interactions may exacerbate cell death, whereas contactin 1 to Notch receptor 1 (CNTN1-NOTCH1) interactions likely regulate cell differentiation and proliferation during repair. The NOTCH pathway, in particular, is critical for postinjury cell proliferation and regeneration. MG5 exhibited particularly active intercellular communication, suggesting a key role in postischemic activation, immune responses, and tissue repair, including modulation of inflammation and support of blood-brain barrier restoration. In contrast, MG6 and MG7 were less involved in early responses, likely contributing mainly to later-stage immune regulation or repair processes (Figure 10D).
Discussion
This study systematically depicts the single-cell transcriptomic landscape of brain cells under both physiological conditions and cerebral ischemia-reperfusion injury, identifying 14 major cell types and characterizing their specific gene expression profiles. The proportions of these cell types are largely consistent with previous studies.35 Variations in cell-type proportions across studies may reflect differences in experimental models, subpopulation classification strategies, tissue sampling locations, enzymatic dissociation protocols, and whether samples were pooled during library construction.36,37 Ischemic stroke triggers a rapid inflammatory response characterized by the activation of resident microglia and the recruitment of peripheral immune cells.38 Consistent with this, our findings show that, following cerebral ischemia-reperfusion injury, microglia and peripheral immune cells, including monocytes/macrophages, neutrophils, and lymphocytes, exhibit varying degrees of increase. This expansion drives the emergence of transcriptionally and functionally distinct microglial subclusters, offering new insights into the dynamic states of microglia during cerebral ischemia-reperfusion injury.
Microglia, the resident immune cells of the CNS, perform diverse and essential functions. Beyond serving as primary initiators of immune responses, they participate in neuronal repair and regeneration, metabolic clearance, and neuronal signal transmission.1,39–41 In this study, we comprehensively characterize microglial heterogeneity and identify key molecular regulators of distinct microglial subtypes. These microglial subclusters may represent potential therapeutic targets for stroke intervention. We found that homeostatic microglial genes, such as TMEM119, P2RY12, and P2RY13, were highly enriched in the MG1 and MG2 subclusters, accounting for over 90% of microglia in control mice, consistent with previous studies.36 These two subclusters were particularly enriched in immune response functions, especially proinflammatory signaling pathways such as the IL-6 signaling pathway. Our results suggest that, in response to acute cerebral ischemia-reperfusion injury, these microglial subclusters undergo activation and progressively shift toward a proinflammatory phenotype, potentially exacerbating tissue damage through cytokine-mediated signaling pathways. Consequently, the expression of homeostatic microglial genes is markedly downregulated following cerebral ischemia-reperfusion injury.
Traditionally, microglia have been classified into M1 and M2 phenotypes. M1 microglia typically promote inflammatory responses that contribute to neuronal injury, whereas M2 microglia exhibit anti-inflammatory and neuroprotective effects.10 Many preclinical studies and clinical trials have attempted to modulate microglial activity by inhibiting M1 polarization or promoting M2 polarization in cerebral ischemia-reperfusion injury.10 However, recent research has revealed that microglial responses across various neurological disorders are highly heterogeneous, indicating that their activation states do not conform to a simple M1/M2 dichotomy but rather exist along a complex and dynamic continuum.42–44 The heterogeneity of post-stroke microglia is far more intricate than traditional classifications suggest.45 These findings highlight the importance of applying scRNA-seq to explore microglial polarization and functional diversity beyond the conventional M1/M2 paradigm. In our study, the identified microglial subclusters did not exhibit full expression of either M1 or M2 marker genes. Notably, the M2 marker MRC1 (encoding CD206) was predominantly expressed in macrophages rather than in microglia. Trajectory analysis revealed dynamic transitions within microglial populations, indicating that microglia do not polarize strictly toward either the M1 or M2 phenotype, in contrast to previous reports. Furthermore, transcription factor analysis demonstrated the involvement of distinct regulators in microglial differentiation, suggesting that activated microglial phenotypes extend beyond the conventional M1/M2 paradigm.
Our findings reveal a dynamic transformation of microglial phenotypes following cerebral ischemia-reperfusion injury, highlighting the emergence of ISAM, comprising the MG4, MG5, MG6, and MG7 subclusters. This progression from homeostatic to activated phenotypes underscores the remarkable plasticity of microglia in response to cerebral ischemia-reperfusion injury. The early predominance of MG4 may reflect an acute microglial activation phase characterized by rapid sensing of tissue damage and release of inflammatory mediators. This transient activation resembles previously described early-response microglia that act as sentinels at the onset of CNS injury. The subsequent emergence of MG5, MG6, and MG7 suggests a temporal and functional diversification, where microglia assume specialized roles ranging from exacerbating neuronal injury to facilitating repair. MG5 enrichment in TNF, NF-κB, and ferroptosis pathways suggests a pathogenic role akin to proinflammatory or neurotoxic microglia described in other injury models. This raises the possibility that MG5 may represent a key driver of secondary injury after ischemia and thus a potential therapeutic target. In contrast, MG6 is strongly associated with chemotaxis, hypoxia, and ERK signaling, which together indicate a role in recruiting and coordinating peripheral immune cells. This finding aligns with studies demonstrating that ischemia triggers microglia-mediated leukocyte recruitment and blood-brain barrier disruption. Targeting chemotactic signaling in MG6 could help limit excessive leukocyte infiltration and downstream tissue damage. Interestingly, MG7 shows enrichment in the TGF-β pathway and wound-healing signatures, consistent with a reparative or neuroprotective microglial state. TGF-β is known to promote anti-inflammatory responses, extracellular matrix remodeling, and neuronal repair and regeneration. Thus, MG7 may correspond to a late-phase microglial population that supports resolution of inflammation and tissue repair. This temporal shift from MG5/MG6 (injury-promoting) to MG7 (repair-promoting) reflects the dynamic microglial trajectory and emphasizes that microglia cannot be simplistically categorized as M1 or M2 phenotype. Instead, they adopt context-dependent, transcriptionally defined states with distinct functional implications.
We identified CH25H and SPP1 as highly expressed genes specific to ISAM. CH25H encodes cholesterol 25-hydroxylase, a key enzyme in cholesterol metabolism that plays a pivotal role in immune regulation and homeostasis. It catalyzes the production of 25-hydroxycholesterol (25HC), which modulates inflammation and lipid metabolism by activating liver X receptors (LXRs) and suppressing NF-κB-mediated proinflammatory cytokine production, including TNF-α and IL-6.24 In addition, 25HC inhibits T-cell membrane fusion to exert antiviral effects and prevents excessive activation of absent in melanoma 2 (AIM2) inflammasomes.46 In tumor-associated macrophages, CH25H expression leads to lysosomal accumulation of 25HC, which competitively binds cholesterol and targets G protein-coupled receptor 155 (GPR155). This interaction inhibits mechanistic target of rapamycin complex 1 (mTORC1) activity and activates AMP-activated protein kinase α subunit (AMPKα), thereby inducing metabolic reprogramming. AMPKα activation enhances mitochondrial function, promotes OXPHOS, and upregulates ARG1 in a STAT6-dependent manner, ultimately improving phagocytic capacity and facilitating tissue repair. These findings highlight 25HC as an important metabolic regulator of macrophage function and position CH25H as an immune-metabolic checkpoint capable of reshaping macrophage fate.47 Furthermore, CH25H is one of the AD-associated DAM genes, with elevated expression observed in both AD patient brain tissue and in models of amyloid-β and tau pathology.48,49 CH25H has also been implicated in enhancing the IL-1β-mediated proinflammatory response of microglia upon lipopolysaccharide stimulation.50 Additionally, 25HC has been shown to promote activation of the NLR family pyrin domain containing 3 (NLRP3) inflammasome in H9C2 cardiomyocytes, exacerbating OGD/R-induced pyroptosis.51 These findings suggest that the CH25H/25HC axis represents a critical metabolic-immune hub and a potential therapeutic target for ischemic stroke and neurodegenerative diseases. SPP1, encoding osteopontin (OPN), is broadly expressed across multiple cell types and plays a pivotal role in both intercellular communication and extracellular matrix regulation. By interacting with integrins and other receptors on the cell surface, SPP1 modulates cytokine and chemokine activity as well as downstream signaling pathways, thereby contributing to a wide range of physiological and pathological processes. Previous studies have demonstrated that SPP1 has been implicated in the pathogenesis of inflammation, cancer, stroke, traumatic brain injury, infectious diseases, and neurodegenerative disorders.52–55 Given its critical involvement in inflammation modulation and tissue remodeling, SPP1 has been suggested to possess potential anti-inflammatory and tissue-protective properties.56 SPP1 is additionally recognized as a signature gene of DAM. Using lineage-tracing approaches, researchers have utilized the dynamic expression of SPP1 to label and track DAM during neural repair, thereby elucidating their functional roles across diverse neuropathological conditions.57 In studies of frontotemporal dementia (FTD), SPP1 knockdown effectively restored mitochondrial function in FTD neurons, mitigated cellular injury, and attenuated astrogliosis.58 SPP1 has also been identified as a potential biomarker for AD, where its involvement in chronic neuroinflammation may exacerbate neurodegeneration in the late stages of AD.59 Furthermore, in AD models, perivascular cells induce microglia to adopt a phagocytic phenotype and promote synaptic engulfment through SPP1, suggesting its mechanistic involvement in neurodegenerative pathologies.60 SPP1-expressing microglia have been shown to facilitate functional recovery and exert neuroprotective effects during early brain development.60,61 Moreover, the interaction between regulatory T cells (Tregs) and microglia, mediated by SPP1, is essential for oligodendrocyte generation and myelin repair, thereby promoting white matter repair after ischemic stroke.62 Microglia expressing CH25H display a gene expression profile linked to neural network reconstruction, including upregulation of SPP1, which may promote axonal growth and synapse formation, thereby facilitating neural network remodeling after ischemic stroke.17,63 Therefore, further investigation into the molecular mechanisms by which SPP1 and CH25H regulate neuroinflammation, neurodegenerative processes, and tissue repair may provide valuable insights into its potential as a therapeutic target.
ATF3 is a stress-inducible transcription factor of the ATF/CREB family, broadly involved in cellular responses to stress, injury, and metabolic changes. It can function as either a transcriptional activator or repressor, and its actions across multiple cell types underlie the complexity of its mechanisms. ATF3 exerts cell- and phase-specific protective roles in the cardiovascular system, regulating fibroblasts, cardiomyocytes, and macrophages to modulate heart remodeling, ischemia–reperfusion injury, angiogenesis, and clearance of apoptotic cells.64 ATF3 plays a key role in the central nervous system, regulating neuroinflammatory responses and neural regeneration.65 SCENIC analysis revealed that ATF3 acts as a central transcription factor regulating the differentiation of ISAM microglial subclusters, co-expressing with CH25H and SPP1 and mediating the transition from homeostatic to disease-associated states. Functional validation demonstrated that ATF3 overexpression selectively enhanced CH25H and TNF-α expression, whereas ATF3 knockdown reduced IL-1β, IL-6, and TNF-α levels, indicating its role as a transcriptional amplifier of microglial inflammatory signaling. By promoting CH25H-mediated oxysterol metabolism and TNF-driven proinflammatory responses, ATF3 links metabolic reprogramming to neuroinflammation, highlighting its potential as a therapeutic target to modulate microglial activity and mitigate ischemia-reperfusion–induced tissue damage. This mechanistic insight provides a foundation for targeting ATF3 or its downstream effectors in strategies aimed at controlling post-stroke neuroinflammation and promoting neurological recovery.
Ischemic stroke induces localized hypoxia and energy deficiency, triggering metabolic reprogramming in microglia. These metabolic alterations directly influence microglial functional states, highlighting the importance of understanding how microglia respond to ischemia-reperfusion injury and undergo metabolic dysregulation.66 After ischemic stroke, microglia engage in lipid metabolism pathways, synthesizing and utilizing substantial amounts of lipids, particularly cholesterol and phospholipids, which are critical for membrane remodeling, signal transduction, and inflammatory processes.67–71 Given the essential role of microglia-derived lipids in myelin regeneration, ISAM activation may facilitate post-stroke myelin repair through the release of lipid metabolites and oligodendrocyte growth factors. In addition, amino acid biosynthesis pathways are activated to meet the bioenergetic and biosynthetic demands of microglia under ischemic conditions.72 Metabolic reprogramming is a hallmark of immune cell responses to inflammatory stimuli, often involving a shift from OXPHOS to glycolysis or alternative metabolic pathways.73 Our study confirmed that different microglial subsets exhibit heterogeneous metabolic profiles following cerebral ischemia-reperfusion injury, reflecting their adaptive responses to ischemia-induced damage, modulation of immune functions, and participation in neural repair. Under homeostatic conditions, microglia predominantly rely on the TCA cycle and OXPHOS for energy production, suppress excessive inflammation, and support cognitive function.74,75 In contrast, post-ischemic activation shifts microglia toward glycolysis, enabling rapid ATP production to sustain inflammatory responses. TCA cycle disruption, and the resulting accumulation of metabolites such as succinate, promotes a proinflammatory phenotype.76 This metabolic dysregulation not only compromises energy production but also exacerbates neuronal injury and cell death by activating downstream oxidative stress and inflammatory signaling pathways, including HIF-1α and the pentose phosphate pathway. Moreover, glycolysis-driven microglial subsets are highly engaged in inflammation-related processes, and accumulating glycolytic products, such as lactate, may further drive microglial phenotypic conversion, modulating neuroinflammation and tissue repair.33,77,78 SDH, a critical enzyme of mitochondrial complex II, plays a central role in linking the TCA cycle with the aerobic electron transport chain. It catalyzes the oxidation of succinate to fumarate while transferring electrons to coenzyme Q, thereby sustaining OXPHOS and cellular energy production. In our study, we observed a downregulation of SDH genes in microglia following cerebral ischemia-reperfusion injury, suggesting a potential mechanistic link between ischemic stroke and PD. This downregulation may impair TCA cycle flux and complex II activity, leading to succinate accumulation, disrupted electron transport, and a shift toward glycolysis for rapid ATP generation. Such metabolic reprogramming not only compromises energy production but also exacerbates ischemia-induced neuronal injury by activating downstream oxidative stress and inflammatory pathways, including HIF-1α signaling. Moreover, the observed SDH dysfunction highlights a potential connection between ischemic stroke and the pathogenesis of inflammation-associated neurodegenerative diseases. Given that SDH deficiency has been implicated in PD, ischemia-induced metabolic reprogramming in microglia may create a microenvironment conducive to neurodegeneration, linking acute ischemic injury with long-term neurodegenerative processes. These findings underscore the importance of targeting microglial metabolic pathways, particularly SDH and its downstream effectors, as a promising therapeutic strategy not only for mitigating post-stroke neuronal damage but also for preventing or attenuating the progression of neurodegenerative disorders.79,80
Intercellular communication plays a pivotal role in the immune response after ischemic stroke. Our CellPhoneDB analysis revealed extensive ligand-receptor interactions between post-stroke microglia and other brain cell types, including astrocytes, oligodendrocytes, and endothelial cells, highlighting dynamic alterations in cellular crosstalk after cerebral ischemia-reperfusion injury. Microglia, as primary immune responders, actively coordinate neuroinflammatory responses and recruit peripheral macrophages to the lesion site. The activation of neuroglial cells disrupts intercellular junctions, compromising blood-brain barrier integrity and facilitating the release of cytokines and chemokines, which further amplify local inflammation. Endothelial cells not only serve as structural components of the blood-brain barrier but also act as active regulators of vascular remodeling and intercellular communication. Post-stroke endothelial cells integrate metabolic and immune signals to support tissue repair. The interplay between microglia and endothelial cells underscores a coordinated response in which immune activation, metabolic reprogramming, and vascular remodeling converge to influence both injury progression and tissue repair. Collectively, our results provide a mechanistic framework linking immune activation, metabolic regulation, and cellular crosstalk in ischemic stroke, offering novel insights into potential targets for early therapeutic intervention.36,81,82
Conclusion
In this study, we employed scRNA-seq to systematically analyze the dynamic changes in microglia after ischemic stroke. We identified multiple subsets with distinct functional roles, thus overcoming the traditional M1/M2 classification model. We also identified key regulatory factors such as CH25H, SPP1, and ATF3, highlighting the specialized contributions of specific microglial subpopulations to inflammation, neuronal injury, and tissue repair. Notably, our findings emphasize the critical role of metabolic reprogramming in stroke, illustrating how microglia adapt to hypoxic conditions and modulate inflammatory responses through alterations in cellular metabolism. Despite these advances, several limitations of this study should be acknowledged. Our study employed a rat MCAO/R model of cerebral ischemia-reperfusion injury to simulate human pathology; however, immune responses, metabolic pathways, and inflammatory processes may differ between species. Although this model recapitulates key features of ischemic stroke, including neuroinflammation and microglial activation, interspecies variations could affect the magnitude and timing of microglial responses. Therefore, caution is warranted when extrapolating these findings to humans. Moreover, our analyses were confined to a single time point (one day post-MCAO/R), which limits the evaluation of microglial dynamics throughout the acute, subacute, and chronic phases. Furthermore, the intercellular communication analysis focused solely on ligand-receptor interactions, omitting other regulatory mechanisms such as microRNA-mediated signaling. Future studies should incorporate multiple time points to comprehensively characterize the temporal dynamics of microglial function and metabolism, integrate diverse intercellular communication mechanisms, and evaluate the complexity of cell-cell interactions after ischemic stroke. Such efforts will provide a more complete understanding of microglial biology and inform the development of precise therapeutic strategies for ischemic stroke.
Data Sharing Statement
The dataset (GSE199558) used in this study is publicly available via the GEO database (http://www.ncbi.nlm.nih.gov/geo). Further details can be obtained from the corresponding author, Dr. Yujun Pan (email: [email protected]).
Ethical Approval and Consent to Participate
The dataset used in our study (GSE199558) is a publicly available and fully de-identified dataset obtained from the GEO database. Our analysis did not involve any human participants, personal information, or human-derived biological materials. According to Article 32 (Items 1 and 2) of the Measures for Ethical Review of Life Science and Medical Research Involving Human Subjects (issued February 18, 2023, China), research using publicly available and anonymized data is exempt from Institutional Review Board (IRB) approval. Therefore, no additional human ethics approval was required.
All experiments involving rats were reviewed and approved by the Institutional Animal Care and Use Committee (IACUC) of the First Affiliated Hospital of Harbin Medical University (Approval No. 2020108) and were performed in accordance with the National Institutes of Health (NIH) guidelines and international standards for the humane care and use of laboratory animals.
Acknowledgments
We are grateful to Prof. Jiulin Du (Institute of Neuroscience, CAS Center for Excellence in Brain Science and Intelligence Technology, Chinese Academy of Sciences), Prof. Mingsha Zhang (State Key Laboratory of Cognitive Neuroscience and Learning, Beijing Normal University) and Prof. Amr H. Sawalha (University of Pittsburgh) for their generous support, including funding, technical assistance, and insightful comments on the manuscript.
Funding
This study was supported by Natural Science Foundation of Heilongjiang Province of China (LH2022H039), High-end Foreign Experts Recruitment Plan of Heilongjiang Province of China (G2023013, G2024024), the Open Fund of the State Key Laboratory of Neuroscience, Shanghai Institutes for Biological Sciences, Chinese Academy of Sciences (SKLN-2022A003), National Natural Science Foundation of China (82001131), the Open Fund of Key Laboratory of Hepatosplenic Surgery, Ministry of Education of China (GPKF202405).
Disclosure
The authors declare that they have no known competing financial interests or personal relationships that could have influenced the work reported in this paper.
References
1. Li Q, Barres BA. Microglia and macrophages in brain homeostasis and disease. Nat Rev Immunol. 2018;18(4):225–242. doi:10.1038/nri.2017.125
2. Augusto‐Oliveira M, Arrifano GP, Delage CI, Tremblay M, Crespo‐Lopez ME, Verkhratsky A. Plasticity of microglia. Biol Rev. 2022;97(1):217–250. doi:10.1111/brv.12797
3. Borst K, Dumas AA, Prinz M. Microglia: immune and non-immune functions. Immunity. 2021;54(10):2194–2208. doi:10.1016/j.immuni.2021.09.014
4. Butovsky O, Weiner HL. Microglial signatures and their role in health and disease. Nat Rev Neurosci. 2018;19(10):622–635. doi:10.1038/s41583-018-0057-5
5. Colonna M, Butovsky O. Microglia function in the central nervous system during health and neurodegeneration. Annu Rev Immunol. 2017;35(1):441–468. doi:10.1146/annurev-immunol-051116-052358
6. Hickman S, Izzy S, Sen P, Morsett L, El Khoury J. Microglia in neurodegeneration. Nat Neurosci. 2018;21(10):1359–1369. doi:10.1038/s41593-018-0242-x
7. Gutmann DH, Kettenmann H. Microglia/brain macrophages as central drivers of brain tumor pathobiology. Neuron. 2019;104(3):442–449. doi:10.1016/j.neuron.2019.08.028
8. Yang X, Wen J, Yang H, et al. Functional characterization of Alzheimer’s disease genetic variants in microglia. Nat Genet. 2023;55(10):1735–1744. doi:10.1038/s41588-023-01506-8
9. Hurford R, Wolters FJ, Li L, Lau KK, Küker W, Rothwell PM. Prevalence, predictors, and prognosis of symptomatic intracranial stenosis in patients with transient ischaemic attack or minor stroke: a population-based cohort study. Lancet Neurol. 2020;19(5):413–421. doi:10.1016/S1474-4422(20)30079-X
10. Long Y, Li XQ, Deng J, et al. Modulating the polarization phenotype of microglia – a valuable strategy for central nervous system diseases. Ageing Res Rev. 2024;93:102160. doi:10.1016/j.arr.2023.102160
11. Ransohoff RM. A polarizing question: do M1 and M2 microglia exist? Nat Neurosci. 2016;19(8):987–991. doi:10.1038/nn.4338
12. Haruwaka K, Ikegami A, Tachibana Y, et al. Dual microglia effects on blood brain barrier permeability induced by systemic inflammation. Nat Commun. 2019;10(1):5816. doi:10.1038/s41467-019-13812-z
13. Beccari S, Sierra-Torre V, Valero J, et al. Microglial phagocytosis dysfunction in stroke is driven by energy depletion and induction of autophagy. Autophagy. 2023;19(7):1952–1981. doi:10.1080/15548627.2023.2165313
14. Paolicelli RC, Angiari S. Microglia immunometabolism: from metabolic disorders to single cell metabolism. Semin Cell Dev Biol. 2019;94:129–137. doi:10.1016/j.semcdb.2019.03.012
15. Peruzzotti-Jametti L, Willis CM, Krzak G, et al. Mitochondrial complex I activity in microglia sustains neuroinflammation. Nature. 2024;628(8006):195–203. doi:10.1038/s41586-024-07167-9
16. Masuda T, Sankowski R, Staszewski O, et al. Spatial and temporal heterogeneity of mouse and human microglia at single-cell resolution. Nature. 2019;566(7744):388–392. doi:10.1038/s41586-019-0924-x
17. Hammond TR, Dufort C, Dissing-Olesen L, et al. Single-cell RNA sequencing of microglia throughout the mouse lifespan and in the injured brain reveals complex cell-state changes. Immunity. 2019;50(1):253–271.e6. doi:10.1016/j.immuni.2018.11.004
18. Keren-Shaul H, Spinrad A, Weiner A, et al. A unique microglia type associated with restricting development of Alzheimer’s disease. Cell. 2017;169(7):1276–1290.e17. doi:10.1016/j.cell.2017.05.018
19. Absinta M, Maric D, Gharagozloo M, et al. A lymphocyte–microglia–astrocyte axis in chronic active multiple sclerosis. Nature. 2021;597(7878):709–714. doi:10.1038/s41586-021-03892-7
20. Longa EZ, Weinstein PR, Carlson S, Cummins R. Reversible middle cerebral artery occlusion without craniectomy in rats. Stroke. 1989;20(1):84–91. doi:10.1161/01.STR.20.1.84
21. Levard D, Seillier C, Bellemain-Sagnard M, et al. Central nervous system-associated macrophages modulate the immune response following stroke in aged mice. Nat Neurosci. 2024;27(9):1721–1733. doi:10.1038/s41593-024-01695-3
22. McDonough A, Noor S, Lee RV, et al. Ischemic preconditioning induces cortical microglial proliferation and a transcriptomic program of robust cell cycle activation. Glia. 2020;68(1):76–94. doi:10.1002/glia.23701
23. Cashikar AG, Toral-Rios D, Timm D, et al. Regulation of astrocyte lipid metabolism and ApoE secretion by the microglial oxysterol, 25-hydroxycholesterol. J Lipid Res. 2023;64(4):100350. doi:10.1016/j.jlr.2023.100350
24. Canfrán-Duque A, Rotllan N, Zhang X, et al. Macrophage-derived 25-hydroxycholesterol promotes vascular inflammation, atherogenesis, and lesion remodeling. Circulation. 2023;147(5):388–408. doi:10.1161/CIRCULATIONAHA.122.059062
25. Chen Q, Zhou T, Yuan JJ, et al. Metabolomics profiling to characterize cerebral ischemia-reperfusion injury in mice. Front Pharmacol. 2023;14:1091616. doi:10.3389/fphar.2023.1091616
26. Liu R, Luo S, Zhang YS, Tsang CK. Plasma metabolomic profiling of patients with transient ischemic attack reveals positive role of neutrophils in ischemic tolerance. eBioMedicine. 2023;97:104845. doi:10.1016/j.ebiom.2023.104845
27. Takeda H, Yamaguchi T, Yano H, Tanaka J. Microglial metabolic disturbances and neuroinflammation in cerebral infarction. J Pharmacol Sci. 2021;145(1):130–139. doi:10.1016/j.jphs.2020.11.007
28. Roh TH, Yim H, Roh J, et al. The loss of succinate dehydrogenase B expression is frequently identified in hemangioblastoma of the central nervous system. Sci Rep. 2019;9(1):5873. doi:10.1038/s41598-019-42338-z
29. Li J, Liang N, Long X, et al. SDHC-related deficiency of SDH complex activity promotes growth and metastasis of hepatocellular carcinoma via ROS/NFκB signaling. Cancer Lett. 2019;461:44–55. doi:10.1016/j.canlet.2019.07.001
30. Mills E, O’Neill LAJ. Succinate: a metabolic signal in inflammation. Trends Cell Biol. 2014;24(5):313–320. doi:10.1016/j.tcb.2013.11.008
31. Henrich MT, Oertel WH, Surmeier DJ, Geibl FF. Mitochondrial dysfunction in Parkinson’s disease – a key disease hallmark with therapeutic potential. Mol Neurodegeneration. 2023;18(1):83. doi:10.1186/s13024-023-00676-7
32. Rocha EM, De Miranda B, Sanders LH. Alpha-synuclein: pathology, mitochondrial dysfunction and neuroinflammation in Parkinson’s disease. Neurobiol Dis. 2018;109:249–257. doi:10.1016/j.nbd.2017.04.004
33. Ye L, Jiang Y, Zhang M. Crosstalk between glucose metabolism, lactate production and immune response modulation. Cytokine Growth Factor Rev. 2022;68:81–92. doi:10.1016/j.cytogfr.2022.11.001
34. Wei L, Tokizane K, Konishi H, Yu HR, Kiyama H. Agonists for G-protein-coupled receptor 84 (GPR84) alter cellular morphology and motility but do not induce pro-inflammatory responses in microglia. J Neuroinflammation. 2017;14(1):198. doi:10.1186/s12974-017-0970-y
35. Li H, Liu P, Zhang B, et al. Acute ischemia induces spatially and transcriptionally distinct microglial subclusters. Genome Med. 2023;15(1):109. doi:10.1186/s13073-023-01257-5
36. Han B, Zhou S, Zhang Y, et al. Integrating spatial and single-cell transcriptomics to characterize the molecular and cellular architecture of the ischemic mouse brain. Sci Transl Med. 2024;16(733):eadg1323. doi:10.1126/scitranslmed.adg1323
37. Del Águila Á, Zhang R, Yu X, et al. Microglial heterogeneity in the ischemic stroke mouse brain of both sexes. Genome Med. 2024;16(1):95. doi:10.1186/s13073-024-01368-7
38. Yu N, Zhao Y, Wang P, Zhang F, Wen C, Wang S. Changes in border-associated macrophages after stroke: single-cell sequencing analysis. Neural Regener Res. 2025;21(1):346–356. doi:10.4103/NRR.NRR-D-24-01092
39. Cserép C, Pósfai B, Dénes Á. Shaping neuronal fate: functional heterogeneity of direct microglia-neuron interactions. Neuron. 2021;109(2):222–240. doi:10.1016/j.neuron.2020.11.007
40. Kent SA, Miron VE. Microglia regulation of central nervous system myelin health and regeneration. Nat Rev Immunol. 2024;24(1):49–63. doi:10.1038/s41577-023-00907-4
41. Marinelli S, Basilico B, Marrone MC, Ragozzino D. Microglia-neuron crosstalk: signaling mechanism and control of synaptic transmission. Semin Cell Dev Biol. 2019;94:138–151. doi:10.1016/j.semcdb.2019.05.017
42. Paolicelli RC, Sierra A, Stevens B, et al. Microglia states and nomenclature: a field at its crossroads. Neuron. 2022;110(21):3458–3483. doi:10.1016/j.neuron.2022.10.020
43. Masuda T, Sankowski R, Staszewski O, Prinz M. Microglia heterogeneity in the single-cell era. Cell Rep. 2020;30(5):1271–1281. doi:10.1016/j.celrep.2020.01.010
44. Hasel P, Aisenberg WH, Bennett FC, Liddelow SA. Molecular and metabolic heterogeneity of astrocytes and microglia. Cell Metab. 2023;35(4):555–570. doi:10.1016/j.cmet.2023.03.006
45. Ma H, Li H, Zhang Y, et al. Microglia exhibit distinct heterogeneity rather than M1/M2 polarization within the early stage of acute ischemic stroke. Aging Dis. 2023;14(6):2284. doi:10.14336/AD.2023.0505
46. Dang EV, McDonald JG, Russell DW, Cyster JG. Oxysterol restraint of cholesterol synthesis prevents AIM2 inflammasome activation. Cell. 2017;171(5):1057–1071.e11. doi:10.1016/j.cell.2017.09.029
47. Xiao J, Wang S, Chen L, et al. 25-Hydroxycholesterol regulates lysosome AMP kinase activation and metabolic reprogramming to educate immunosuppressive macrophages. Immunity. 2024;57(5):1087–1104.e7. doi:10.1016/j.immuni.2024.03.021
48. Toral-Rios D, Long JM, Ulrich JD, et al. Cholesterol 25-hydroxylase mediates neuroinflammation and neurodegeneration in a mouse model of tauopathy. J Exp Med. 2024;221(4):e20232000. doi:10.1084/jem.20232000
49. Izumi Y, Cashikar AG, Krishnan K, et al. A proinflammatory stimulus disrupts hippocampal plasticity and learning via microglial activation and 25-hydroxycholesterol. J Neurosci. 2021;41(49):10054–10064. doi:10.1523/JNEUROSCI.1502-21.2021
50. Wong MY, Lewis M, Doherty JJ, et al. 25-Hydroxycholesterol amplifies microglial IL-1β production in an apoE isoform-dependent manner. J Neuroinflammation. 2020;17(1):192. doi:10.1186/s12974-020-01869-3
51. Jiang T, Li Y. 25-hydroxycholesterol aggravates oxygen-glucose deprivation/reoxygenation-induced pyroptosis through promoting activation of NLRP3 inflammasome in H9C2 cardiomyocytes. Braz J Med Biol Res. 2024;57:e13299. doi:10.1590/1414-431x2024e13299
52. Wang J, Li X, Wang Y, Li Y, Shi F, Diao H. Osteopontin aggravates acute lung injury in influenza virus infection by promoting macrophages necroptosis. Cell Death Discovery. 2022;8(1):97. doi:10.1038/s41420-022-00904-x
53. De Schepper S, Ge JZ, Crowley G, et al. Perivascular cells induce microglial phagocytic states andsynaptic engulfment via SPP1 in mouse models of Alzheimer’sdisease. Nat Neurosci. 2023;26(3):406–415. doi:10.1038/s41593-023-01257-z
54. Kasetty G, Bhongir RKV, Papareddy P, et al. Osteopontin protects against pneumococcal infection in a murine model of allergic airway inflammation. Allergy. 2019;74(4):663–674. doi:10.1111/all.13646
55. Trinh HKT, Nguyen TVT, Kim SH, et al. Osteopontin contributes to late-onset asthma phenotypes in adult asthma patients. Exp Mol Med. 2020;52(2):253–265. doi:10.1038/s12276-020-0376-2
56. Yim A, Smith C, Brown AM. Osteopontin/secreted phosphoprotein‐1 harnesses glial‐, immune‐, and neuronal cell ligand‐receptor interactions to sense and regulate acute and chronic neuroinflammation. Immunol Rev. 2022;311(1):224–233. doi:10.1111/imr.13081
57. Lan Y, Zhang X, Liu S, et al. Fate mapping of Spp1 expression reveals age-dependent plasticity of disease-associated microglia-like cells after brain injury. Immunity. 2024;57(2):349–363.e9. doi:10.1016/j.immuni.2024.01.008
58. Al-Dalahmah O, Lam M, McInvale JJ, et al. Osteopontin drives neuroinflammation and cell loss in MAPT-N279K frontotemporal dementia patient neurons. Cell Stem Cell. 2024;31(5):676–693.e10. doi:10.1016/j.stem.2024.03.013
59. Quesnel MJ, Labonté A, Picard C, et al. Osteopontin: a novel marker of pre‐symptomatic sporadic Alzheimer’s disease. Alzheimers Dement. 2024;20(9):6008–6031. doi:10.1002/alz.14065
60. Lawrence AR, Canzi A, Bridlance C, et al. Microglia maintain structural integrity during fetal brain morphogenesis. Cell. 2024;187(4):962–980.e19. doi:10.1016/j.cell.2024.01.012
61. Wang X, Zhou G, Xiong J, et al. H4K12 lactylation activated-Spp1 in reprogrammed microglia improves functional recovery after spinal cord injury. CNS Neurosci Ther. 2025;31(2):e70232. doi:10.1111/cns.70232
62. Shi L, Sun Z, Su W, et al. Treg cell-derived osteopontin promotes microglia-mediated white matter repair after ischemic stroke. Immunity. 2021;54(7):1527–1542.e8. doi:10.1016/j.immuni.2021.04.022
63. Li Q, Cheng Z, Zhou L, et al. Developmental heterogeneity of microglia and brain myeloid cells revealed by deep single-cell RNA sequencing. Neuron. 2019;101(2):207–223.e10. doi:10.1016/j.neuron.2018.12.006
64. Shao Y, Li Y, Liu Y, et al. ATF3 coordinates the survival and proliferation of cardiac macrophages and protects against ischemia–reperfusion injury. Nat Cardiovasc Res. 2024;3(1):28–45. doi:10.1038/s44161-023-00392-x
65. Pan JZ, Wang Z, Sun W, et al. ATF3 is a neuron‐specific biomarker for spinal cord injury and ischaemic stroke. Clin Transl Med. 2024;14(4):e1650. doi:10.1002/ctm2.1650
66. Shin TH, Lee DY, Basith S, et al. Metabolome changes in cerebral ischemia. Cells. 2020;9(7):1630. doi:10.3390/cells9071630
67. Wei W, Zhang L, Xin W, et al. TREM2 regulates microglial lipid droplet formation and represses post-ischemic brain injury. Biomed Pharmacother. 2024;170:115962. doi:10.1016/j.biopha.2023.115962
68. Wei W, Lattau SSJ, Xin W, et al. Dynamic brain lipid profiles modulate microglial lipid droplet accumulation and inflammation under ischemic conditions in mice. Adv Sci. 2024;11(41):2306863. doi:10.1002/advs.202306863
69. Lin CH, Liao LY, Yang TY, et al. Microglia-derived adiposomes are potential targets for the treatment of ischemic stroke. Cell Mol Neurobiol. 2019;39(5):591–604. doi:10.1007/s10571-019-00665-9
70. Li H, Liu P, Deng S, et al. Pharmacological upregulation of microglial lipid droplet alleviates neuroinflammation and acute ischemic brain injury. Inflammation. 2023;46(5):1832–1848. doi:10.1007/s10753-023-01844-z
71. Chausse B, Kakimoto PA, Kann O. Microglia and lipids: how metabolism controls brain innate immunity. Semin Cell Dev Biol. 2021;112:137–144. doi:10.1016/j.semcdb.2020.08.001
72. Wang XP, Yan D, Jin XP, et al. The role of amino acid metabolism alterations in acute ischemic stroke: from mechanism to application. Pharmacol Res. 2024;207:107313. doi:10.1016/j.phrs.2024.107313
73. Sabogal-Guáqueta AM, Marmolejo-Garza A, Trombetta-Lima M, et al. Species-specific metabolic reprogramming in human and mouse microglia during inflammatory pathway induction. Nat Commun. 2023;14(1):6454. doi:10.1038/s41467-023-42096-7
74. Yang Y, Cui BB, Li J, et al. Tricarboxylic acid cycle metabolites: new players in macrophage. Inflamm Res. 2024;73(4):531–539. doi:10.1007/s00011-024-01853-0
75. Song S, Yu L, Hasan MN, et al. Elevated microglial oxidative phosphorylation and phagocytosis stimulate post-stroke brain remodeling and cognitive function recovery in mice. Commun Biol. 2022;5(1):35. doi:10.1038/s42003-021-02984-4
76. Chinopoulos C. Succinate in ischemia: where does it come from? Int J Biochem Cell Biol. 2019;115:105580. doi:10.1016/j.biocel.2019.105580
77. Zhang D, Tang Z, Huang H, et al. Metabolic regulation of gene expression by histone lactylation. Nature. 2019;574(7779):575–580. doi:10.1038/s41586-019-1678-1
78. Cai X, Ng CP, Jones O, et al. Lactate activates the mitochondrial electron transport chain independently of its metabolism. Mol Cell. 2023;83(21):3904–3920.e7. doi:10.1016/j.molcel.2023.09.034
79. Huang ZP. Role of microglial metabolic reprogramming in Parkinson’s disease. Biochem Pharmacol. 2023;213:115619. doi:10.1016/j.bcp.2023.115619
80. Miao J, Chen L, Pan X, Li L, Zhao B, Lan J. Microglial metabolic reprogramming: emerging insights and therapeutic strategies in neurodegenerative diseases. Cell Mol Neurobiol. 2023;43(7):3191–3210. doi:10.1007/s10571-023-01376-y
81. Zucha D, Abaffy P, Kirdajova D, et al. Spatiotemporal transcriptomic map of glial cell response in a mouse model of acute brain ischemia. Proc Natl Acad Sci USA. 2024;121(46):e2404203121. doi:10.1073/pnas.2404203121
82. Zhang M, Pan X, Jung W, et al. Molecularly defined and spatially resolved cell atlas of the whole mouse brain. Nature. 2023;624(7991):343–354. doi:10.1038/s41586-023-06808-9
 © 2025 The Author(s). This work is published and licensed by Dove Medical Press Limited. The
full terms of this license are available at https://www.dovepress.com/terms
and incorporate the Creative Commons Attribution
- Non Commercial (unported, 4.0) License.
By accessing the work you hereby accept the Terms. Non-commercial uses of the work are permitted
without any further permission from Dove Medical Press Limited, provided the work is properly
attributed. For permission for commercial use of this work, please see paragraphs 4.2 and 5 of our Terms.
© 2025 The Author(s). This work is published and licensed by Dove Medical Press Limited. The
full terms of this license are available at https://www.dovepress.com/terms
and incorporate the Creative Commons Attribution
- Non Commercial (unported, 4.0) License.
By accessing the work you hereby accept the Terms. Non-commercial uses of the work are permitted
without any further permission from Dove Medical Press Limited, provided the work is properly
attributed. For permission for commercial use of this work, please see paragraphs 4.2 and 5 of our Terms.
Recommended articles
M1 Microglia-Derived Exosomes Promote A1 Astrocyte Activation and Aggravate Ischemic Injury via circSTRN3/miR-331-5p/MAVS/NF-κB Pathway
Li Z, Xu P, Deng Y, Duan R, Peng Q, Wang S, Xu Z, Hong Y, Zhang Y
Journal of Inflammation Research 2024, 17:9285-9305
Published Date: 21 November 2024
Therapeutic Potential of TPT-260 in Ischemic Stroke: An Investigation Into Its Anti-Inflammatory Effects and Impact on Microglial Activation
Qian J, Guo X, Xu Q, Huang Z
Journal of Inflammation Research 2025, 18:3055-3066
Published Date: 1 March 2025
Aging Inhibits Emergency Angiogenesis and Exacerbates Neuronal Damage by Downregulating DARS2
Liu D, Weng M, Wang R, Fu W, Zhang L, Wang C, Liu M, Shen T, Ren J, Song Y, Li J, Zeng X
Journal of Inflammation Research 2026, 19:527147
Published Date: 8 January 2026
Obacunone Inhibits Microglia-Mediated Neuroinflammation and Ischemic Injury by Targeting Mitogen-Activated Protein Kinase 1
Huang J, Hu Z, Zhang J, Xiao J, Zhang R, Xia S, Yang H, Bao X, Zhang F, Xu Y, Zhu X, Jin J
Journal of Inflammation Research 2026, 19:551466
Published Date: 3 March 2026