Back to Journals » Journal of Inflammation Research » Volume 16
Single-Cell RNA-Sequencing Analysis of Colonic Lamina Propria Immune Cells Reveals the Key Immune Cell-Related Genes of Ulcerative Colitis
Authors Hua R, Qiao G ![]() , Chen G, Sun Z, Jia H, Li P, Zhang B, Qi F
, Chen G, Sun Z, Jia H, Li P, Zhang B, Qi F ![]()
Received 13 September 2023
Accepted for publication 31 October 2023
Published 11 November 2023 Volume 2023:16 Pages 5171—5188
DOI https://doi.org/10.2147/JIR.S440076
Checked for plagiarism Yes
Review by Single anonymous peer review
Peer reviewer comments 2
Editor who approved publication: Professor Ning Quan
Run Hua,1,* Gangjie Qiao,2,* Guoshan Chen,1,* Zhaonan Sun,3 Haowen Jia,3 Peiyuan Li,1 Baotong Zhang,1 Feng Qi1
1Department of General Surgery, Tianjin Medical University General Hospital, Tianjin, People’s Republic of China; 2Department of Colorectal Surgery, Shanxi Provincial People’s Hospital, Shanxi, People’s Republic of China; 3General Surgery Department, Tianjin Medical University General Hospital Airport Hospital, Tianjin, People’s Republic of China
*These authors contributed equally to this work
Correspondence: Feng Qi, Email [email protected]
Background: Ulcerative colitis (UC) is a severe threat to humans worldwide. Single-cell RNA sequencing (scRNA-seq) can be used to screen gene expression patterns of each cell in the intestine, provide new insights into the potential mechanism of UC, and analyze the development of immune cell changes. These findings can provide new ideas for the diagnosis and treatment of intestinal diseases. In this study, bioinformatics analysis combined with experiments applied in dextran sulfate sodium (DSS)-induced colitis mice was used to explore new diagnostic genes for UC and their potential relationship with immune cells.
Methods: We downloaded microarray datasets (GSE75214, GSE87473, GSE92415) from the Gene Expression Omnibus and used these datasets to screen differentially expressed genes (DEGs) and conduct Weighted Gene Co-expression Network Analysis (WGCNA) after quality control. The hub genes were screened, and ROC curves were drawn to verify the reliability of the results in both training set (GSE75214, GSE87473, GSE92415) and validation cohort (GSE87466). Also, we explored the relation of diagnostic genes and immune cells by CIBERSORT algorithm and single-cell analysis. Finally, the expression of hub genes and their relation with immune cells were verified in DSS-induced colitis mice.
Results: Diagnostic genes (ANXA5, MMP7, NR1H4, CYP3A4, ABCG2) were identified. In addition, we found these five genes firmly related to immune infiltration. The DSS-induced colitis mice confirm that the expression of ANXA5 mainly increased in the intestinal macrophages and had a strong negative correlation with M2 macrophages, which indicated its possible influence on the polarization of macrophages in UC patients.
Conclusion: We identified ANXA5, MMP7, NR1H4, CYP3A4, and ABCG2 as diagnostic genes of UC that are closely related to immune infiltration and ANXA5 maintains a negative correlation with M2 macrophages which indicated its possible influence on the polarization of macrophage in UC patients.
Keywords: ulcerative colitis, ANXA5, diagnostic genes, single-cell analysis, macrophages
Introduction
Ulcerative colitis (UC) is one kind of inflammatory bowel disease (IBD), which is characterized by chronic progressive inflammation of the gastrointestinal tract extending from the rectum to the proximal colon.1 UC affects a large number of people regardless of age, gender, region, or ethnic background.2 As we all know, IBD has emerged and prevailed in the Western world in the past decades; however, this condition has changed by the sharp rise of incidence in Asia and other developing countries.3 According to a previous study, the incidence of UC had increased approximately 20‐fold throughout the past 30 years in some Asian countries such as Korea.4
Most patients suffer from annoying and atypical symptoms, for example, diarrhea, abdominal pain, and bloody stools which impair the quality of their life.5 Sometimes, it is hard to distinguish UC from infectious colitis and hemorrhoids based on these symptoms. Clinical symptoms, typical endoscopy findings plus biopsy may contribute to the diagnosis of UC; however, we also need to exclude other non-specific mucosal inflammation before making a final diagnosis;6 Moreover, the invasiveness and inconvenience of colonoscopy are not easy to accept for some patients and potential disease populations. Therefore, it is necessary to find new UC marker genes to optimize the diagnosis and monitoring of UC.
UC is a complex disease because of its multiple interplay of genetic susceptibility and stimulation from environmental triggers leading to immune system dysregulation.7,8 Previous studies have cleared that some kind of immune cells participate in the process of UC,9,10 but it is still hard to summarize the exact role that immune cells play. Therefore, a better understanding of immune regulatory mechanisms and gene expression features will help us to find out the etiology of UC and create a new perspective on UC treatment.
The development of bioinformatic analysis makes it easier for us to analyze information on interested diseases, especially the single-cell RNA analysis. Single-cell sequencing separately extracts RNA from each cell in the tissue, so it obtains information on gene expression in each cell. It can make up for the limitations of traditional sequencing, and reveal the gene expression of a single cell. In other words, we can get specific gene expression of particular cells.
This research identifies hub genes of UC by Weighted Gene Co-Expression Network Analysis (WGCNA) combined gene expression matrix downloading from the GEO database and then analyzes the relationship between hub genes and immune cell by CIBERSORT and single-cell RNA analysis. Finally, we find out that one of the diagnostic genes is closely related to macrophages, which may help us understand the potential mechanism of the etiology and progression of UC.
System and Methods
Data Sources
Gene expression matrix of normal human intestine and UC patient”s intestinal mucosal samples were retrieved from the Gene Expression Omnibus (GEO) database (Home – GEO DataSets – NCBI (nih.gov)). Using the keyword “ulcerative colitis” to get expression files of UC and normal samples as well as removal of the dataset that contains less than 80 samples. Besides these standards, the dataset should also meet the criteria, such as (1) Homo sapiens array expression profile; (2) All samples were collected from intestinal mucosa; (3) Drugs were not involved in all patients or normal control; (4) Only non-pediatric samples were included in our study. Finally, we get four gene expression matrices which were GSE75214, GSE87473, GSE92415, and GSE87466.11–13 Furthermore, adding “single-cell”, “immune cell”, and “ulcerative colitis” to the search bar of GEO to get the single-cell RNA sequence of UC. GSE162335 contains expression information of pouch lamina propria CD45+ hematopoietic cells from intestinal tissues of ulcerative colitis patients.14 Information on all the datasets in this study is described in Table 1.
 |
Table 1 Base Information for Selected Datasets |
Differential Expression Analysis
For raw data, probe expression matrix was extracted and normalized by “normalizeBetweenArrays” based on R package “limma”. Platform annotation file was used to convert the probe expression matrix into a gene expression matrix. After three gene matrixes were merged by Perl script, R package “sva” was applied to eliminate batch effect. Finally, we obtained one merging normalized gene expression matrix. The merging normalized gene expression matrix that contains 258 UC patients and 64 healthy individuals was conducted to identify the differentially expressed genes (DEGs) between the UC and normal controls. The DEGs were screened with a threshold of p-value <0.05 and |log2FC| >1 by using the “limma” package. DEGs were visualized using the R packages “ggplot2” and “heatmap”.
Weighted Gene Correlation Network Analysis
WGCNA clusters genes into different modules, and the gene in each module presents the same expression pattern and then analyzes the correlation between modules and specific traits to figure out the relationship between genes and traits. Therefore, it is widely used to study the association between disease and genes.15 To find out the key genes of UC, the merging normalized gene expression matrix was used as the input matrix for WGCNA analysis. Firstly, to ensure the accuracy of the analysis, the shear line 90 was set as the threshold to exclude outliers. Then, to select the appropriate soft threshold, the “pickSoftThreshold” function in the WGCNA software package was used. The optimal soft threshold was determined to be 14. Based on the soft threshold, the related modules are classified. Each module had no less than 50 genes, and similar gene modules were merged. In addition, after calculating the correlation between genes and UC in the module, it turns out that the turquoise module maintains the highest correlation with the incidence of UC (r = 0.8).
Construction of Protein–Protein Interaction Network
We import the intersection gene of the turquoise module and DEGs into the String database,16 choose the Homo sapiens and obtain the protein–protein interaction network. Full STRING network including the edges that indicate both functional and physical protein associations and PPI network interactions file with medium confidence scores ≥0.4 was downloaded. Finally, we used Cytoscape to visualize the PPI network.17
Enrichment Analysis
Several kinds of enrichment analyses were performed using the “clusterProfiler” package in R software.18 GO and KEGG enrichment analyses were utilized to annotate the function of DEGs. With p-value <0.05 and q-value <0.05 as the enrichment criteria, the top-ranked enrichment results were visualized. Gene Set Enrichment Analysis (GSEA) is a computational method that determines whether a priori defined set of genes is shown to be statistically significant, and we apply it to evaluate a functionally important set of genes with slight expression changes between different groups.
LASSO Analysis and Exploring Diagnostic Biomarkers
The Least Absolute Shrinkage and Selection Operator (LASSO) was used to screen the diagnostic biomarkers of UC.19 Finally, we identified five biomarkers as our candidate genes. We performed ROC analysis on these five genes one by one in the screening set and turned out that all genes showed excellent predictive performance.
Immune Cell Infiltration Estimation
Using the CIBERSORT algorithm20–22 to calculate the proportion of different immune cell types between UC and health control based on the expression levels of immune cell–related genes. The correlation of core genes with the 22 immune cell types was also calculated to see if there are potential roles that genes may play in immune infiltration.
Single-Cell Analysis
The single-cell sequencing data of dataset GSE162335 was collected from the colonic lamina propria of UC patients14 and it only analyzed the CD45 positive cell to find out the change of immune cells in UC patients. After quality control, cells and genes with low expression levels were removed to ensure that the percentage of mitochondria per cell was below 5% and the features of genes were above 500 and no more than 6000. The “Seurat” package23 was utilized to process single-cell data, and all cells were divided into different clusters. The online website Human Cell Landscape24 and CellMarker25 were used to annotate the cell cluster, and the expression of the hub gene in each cluster was visualized, so that the expression changes of the hub gene in each immune cell can be intuitively clarified.
Animal Experiment
Male BALB/C mice weighing 22–25g were used in this study. All of the animal experimental operations were approved by the Animal Care and Use Committee of TIANJIN Medical University and meet the guidance of the Medical and Ethics Committee of TIANJIN Medical University (Tianjin) (IRB2023-DW-106). Twelve mice were evenly divided into two groups, and the study group received 3% dextran sulfate sodium (DSS, YEASEN, China) for 7 days and then drank tap water for 3 days to induce acute colitis. At the sacrificed day, the mice were placed into a clean box connected to a CO2 tank and exposed to CO2 with a flow rate that was 40% displacement volume/minute until the mice lost their spontaneous respiration ability and died. The colons of mice were collected for further analysis.
RNA Extraction and Gene Expression Analysis
Total RNA isolated from the colon was analyzed by real-time quantitative polymerase chain reaction (RT-qPCR). The primers of a gene was referred to the previous study.26 TRIzol (Invitrogen, CA, USA) was used to extract RNA from the colon. The gene expression level was normalized, and the relative quantification of gene expression was determined using the 2^(− ΔΔCt) method.
Isolation of Murine Lamina Propria Mononuclear Cells
Concerning the protocol of other research, the isolation of mononuclear cells from colonic tissue was performed as guidance.27,28 In brief, after removing the intestines of dead mice from two groups and clearing the feces in the intestine with 1×PBS, the opened intestine was cut into 1cm pieces and washed in cold 1×PBS. Then, dithiothreitol (DTT, Solarbio, D8220, China) and ethylene diamine tetraacetic acid (EDTA, Solarbio, E8040, China) were used to remove epithelial cells from cut colon in several steps as well as collagenase IV (400U/mL, Solarbio, C8160, China) and deoxyribonuclease I (0.15 mg/mL, Solarbio, D8071, China) were applied in the process of digestion. Further, Resuspend the cell with 40% Percoll and carefully overlay the cell suspension on top of 2.5mL of the 80% fraction of the Percoll solution. After Centrifuge for 20 min at 1000g, the lamina propria mononuclear cells (LPMCs) should be visible between two different Percoll solutions.
Flow Cytometry Analysis
The intestinal macrophages and M2 macrophages were identified by flow cytometry. The major flow cytometry monoclonal antibodies and substances utilized in flow cytometry were purchased from eBioscience and BioLegend company. Firstly, to block nonspecific staining, the LPMCs were incubated with Fc receptor (FcR) blocking antibodies (anti-CD16/CD32, eBioscience, USA). After distinguishing the Live /Dead cells with the help of zombie dye, anti-mouse F4/80 and CD206 were applied to detect the intestinal macrophages and M2 macrophages. Finally, an anti-ANXA5 mAb was added and incubated for ANXA5 staining. All the samples were detected using a flow cytometer (BD FACSCalibur, USA) and analyzed by FlowJo software.
Results
Summarize of Research Design
The flowchart shows the total process of this research (Figure 1). Firstly, DEGs were screened between UC patients and normal control based on the data from GEO. Then, WGCNA was utilized to discover the hub module that was mostly related to UC. Further, the intercourse of the DEGs and genes in the hub module shows us the genes that may play an important part in the pathogenesis and development of UC. According to the outcome of the PPI network, 10 genes were determined to be essential in the interaction and LASSO regression further screened out 5 hub genes. What deserves stress is that the diagnosis capability of these five hub genes was confirmed by ROC analysis both in the training set and validation cohort. Next, the correlation between hub genes and the immune cell was explored by the CIBERSORT algorithm and single-cell analysis. Finally, UC model mice were established to verify the expression level of hub genes and their potential relation with immune cells.
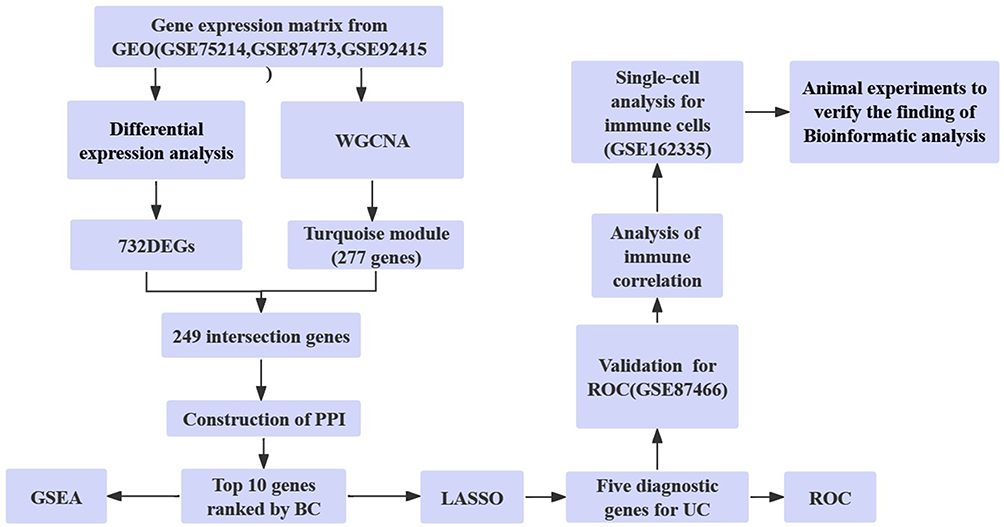 |
Figure 1 The flowchart shows the total process of this research. Abbreviations: GEO, Gene Expression Omnibus; WGCNA, Weighted gene co-expression network analysis; DEGs, Differentially Expressed Genes; PPI, Protein–Protein Interaction; GSEA, Gene Set Enrichment Analysis; BC, Betweenness Centrality; UC, Ulcerative Colitis; ROC, Receiver Operating characteristic Curve. |
Screen of DEGs and Functional Annotation and Pathway Enrichment of DEGs
The expression matrix of three datasets (GSE75214, GSE87473, GSE92415) was regarded as the training set. We identified 732 DEGs including 459 upregulated genes and 273 downregulated genes and visualized the result with heatmap (Figure 2A) and volcano plot (Figure 2B). To better understand the function of DEGs, we performed GO and KEGG enrichment analyses. Interestingly, the outcome of enrichment analysis suggests that the immune system is possibly involved in the progression of UC. GO analysis described that DEGs are mainly enriched in cytokine-mediated signaling pathways, leukocyte migration, and receptor ligand activity (Figure 2C). KEGG analysis illustrated the possible pathways that may contribute to the development of UC such as viral protein interaction with cytokine and cytokine receptor, IL-17 signaling pathway, and cytokine–cytokine receptor interaction (Figure 2D).
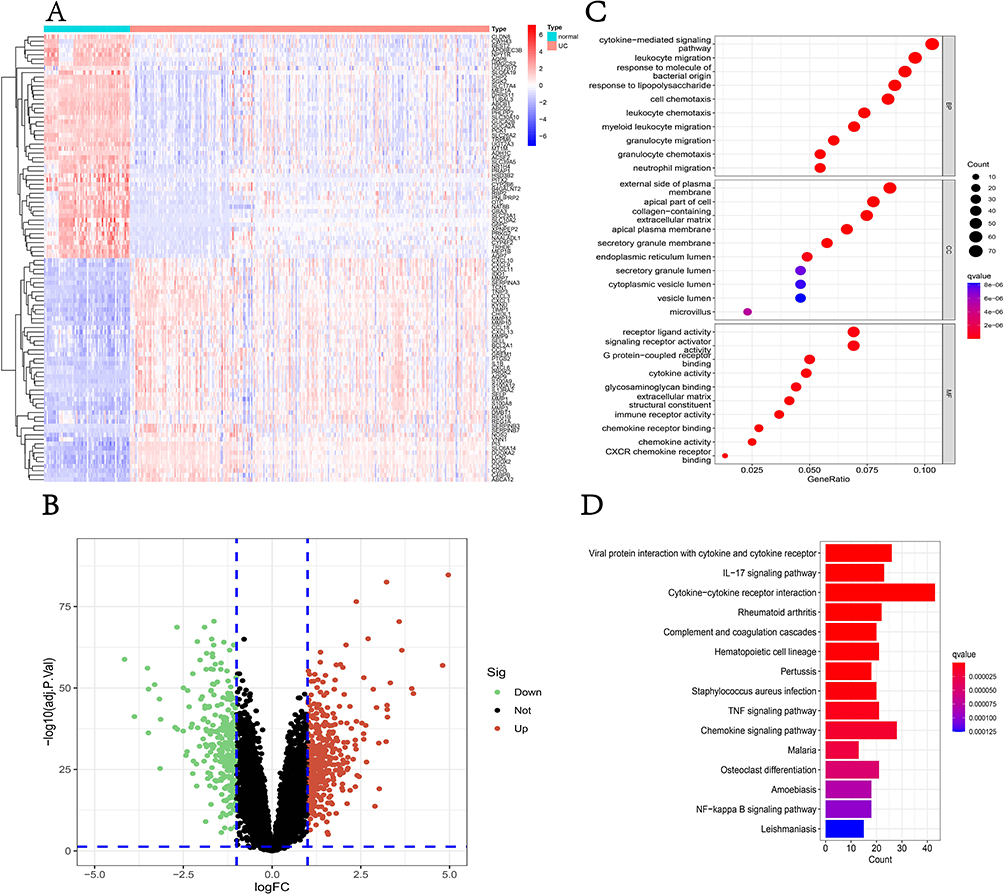 |
Figure 2 Screening of DEGs and enrichment analysis. (A) The heatmap of the top 50 DEGs; (B) the volcano plot of DEGs; (C) the bubble plot shows the top enriched results of DEGs from GO analysis; (D) The barplot shows the most enriched KEGG pathways of DEGs. Abbreviations: DEGs, Differentially Expressed Genes; GO, Gene Ontology; KEGG, Kyoto Encyclopedia of Genes and Genomes; UC, Ulcerative Colitis; IL-17, Interleukin-17; TNF, Tumor Necrosis Factor. |
WGCNA Identifies the Hub Module That Mostly Related to the UC
The Weighted gene co-expression network was constructed to identify the most relevant modules for UC. The samples clustered well, and the outlier sample was excluded using a shear line of 90 as the threshold. Subsequently, the optimal soft threshold was determined to be 14 when a soft threshold of 1–20 was used for topological calculations (Figure 3A). After hierarchical clustering and module merging (Figure 3B), we finally got 4 modules with no less than 50 genes in each module (Figure 3C). Among all these modules, the turquoise module included the highest correlation with the occurrence of UC (r=0.8, p=6e-74) according to the calculation of the correlation between genes within modules and UC. Thus, we consider that 277 genes in the turquoise module were the most important genes depending on the relationship between Gene significance for UC and Module Membership (Figure 3D) (r=0.62, p=8.2e-31).
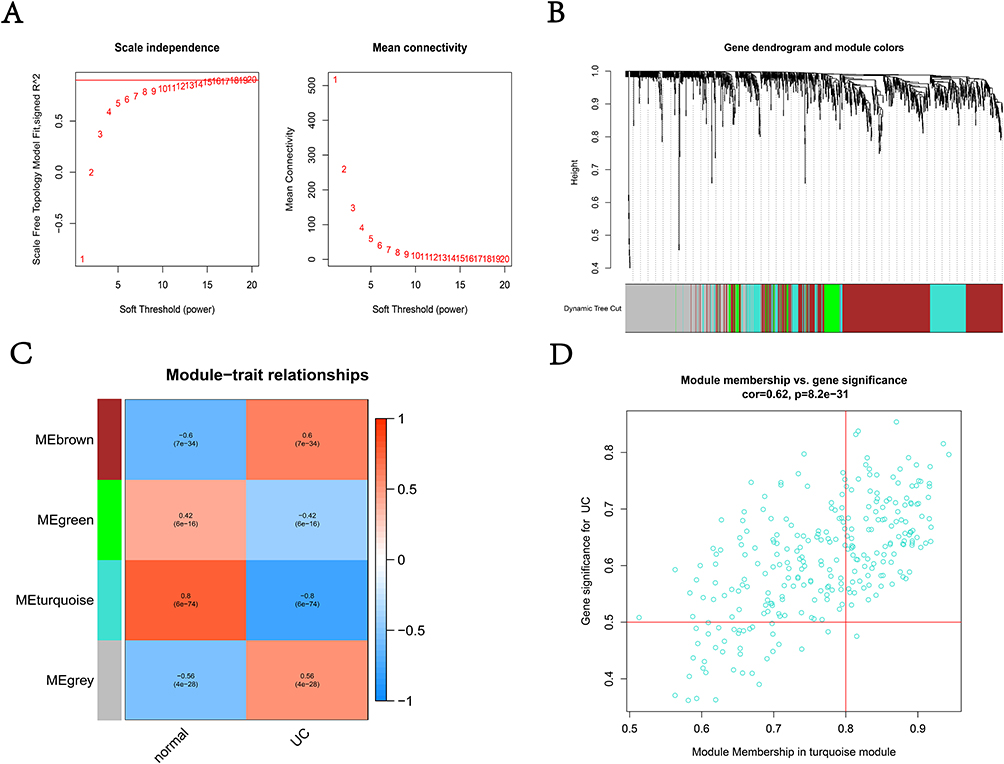 |
Figure 3 WGCNA of expression matrix. (A) The optimal soft threshold was determined to be 14; (B) similar modules were merged; (C) heatmap of the correlation between modules and UC; (D) the correlation between Module membership in turquoise module and Gene significance for UC. Abbreviations: WGCNA, Weighted gene co-expression network analysis; UC, Ulcerative Colitis. |
The Construction of the PPI Network and Performance of GSEA
In accordance with the work we have done, we reckon that the DEGs and genes in the turquoise module may be very important in the development of UC and the intersection of these two parts included 249 genes (Figure 4A). Then, we input the 249 genes into the online website String database to obtain the PPI network which is composed of 244 nodes and 379 edges. In the process of the PPI network, the CytoNCA in the software was used to calculate the Betweenness Centrality (BC). The higher the BC is, the more important the gene is. Finally, we searched out 10 essential genes in the PPI network (Figure 4B) and these 10 genes mostly functionally enrich in the immune related pathway through GSEA such as cytosolic DNA sensing pathway, cytokine–cytokine receptor interaction, intestinal immune network for IgA production and so on (Figure 4C).
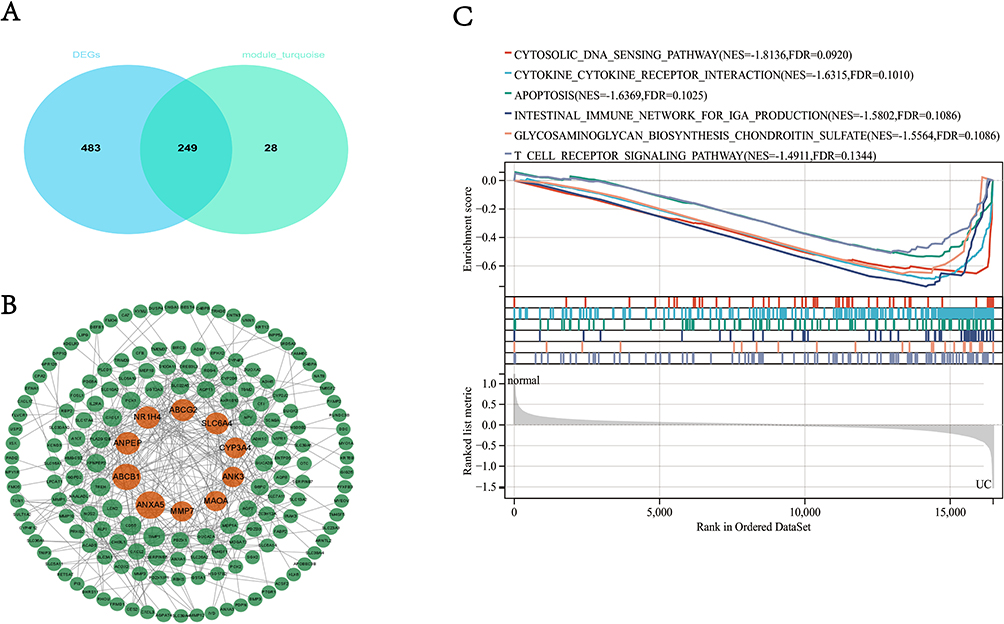 |
Figure 4 The construction of the PPI network and performance of GSEA. (A) The intersection of DEGS and genes in turquoise; (B) top 10 genes ranked by BC in PPI; (C) GSEA of 10 genes. Abbreviations: DEGs, Differentially Expressed Genes; PPI, Protein–Protein Interaction; GSEA, Gene Set Enrichment Analysis; BC, Betweenness Centrality. |
LASSO Analysis and Exploring Diagnostic Biomarkers
After LASSO analysis, we screened out five diagnostic genes for UC which were ANXA5, MMP7, NR1H4, CYP3A4, and ABCG2 (Figure 5A) and they maintained different expression patterns between UC patients and normal control. We performed ROC analysis on each of these five genes in the training set, and the results showed that all genes had excellent diagnostic performance in the training set: ANXA5 (AUC = 0.963), NR1H4 (AUC = 0.888), CYP3A4 (AUC = 0.821), ABCG2 (AUC = 0.982), MMP7 (AUC = 0.938) (Figure 5B). To verify the accuracy of these five hub genes, we chose dataset GSE87466 as the validation cohort. It turns out that these five hub genes were also differently expressed between UC patients and normal control, and ROC also demonstrated excellent diagnostic performance (ANXA5, AUC = 0.933; NR1H4, AUC = 0.911; CYP3A4, AUC = 0.844; ABCG2, AUC = 0.990; MMP7, AUC = 0.946) (Figure 5C).
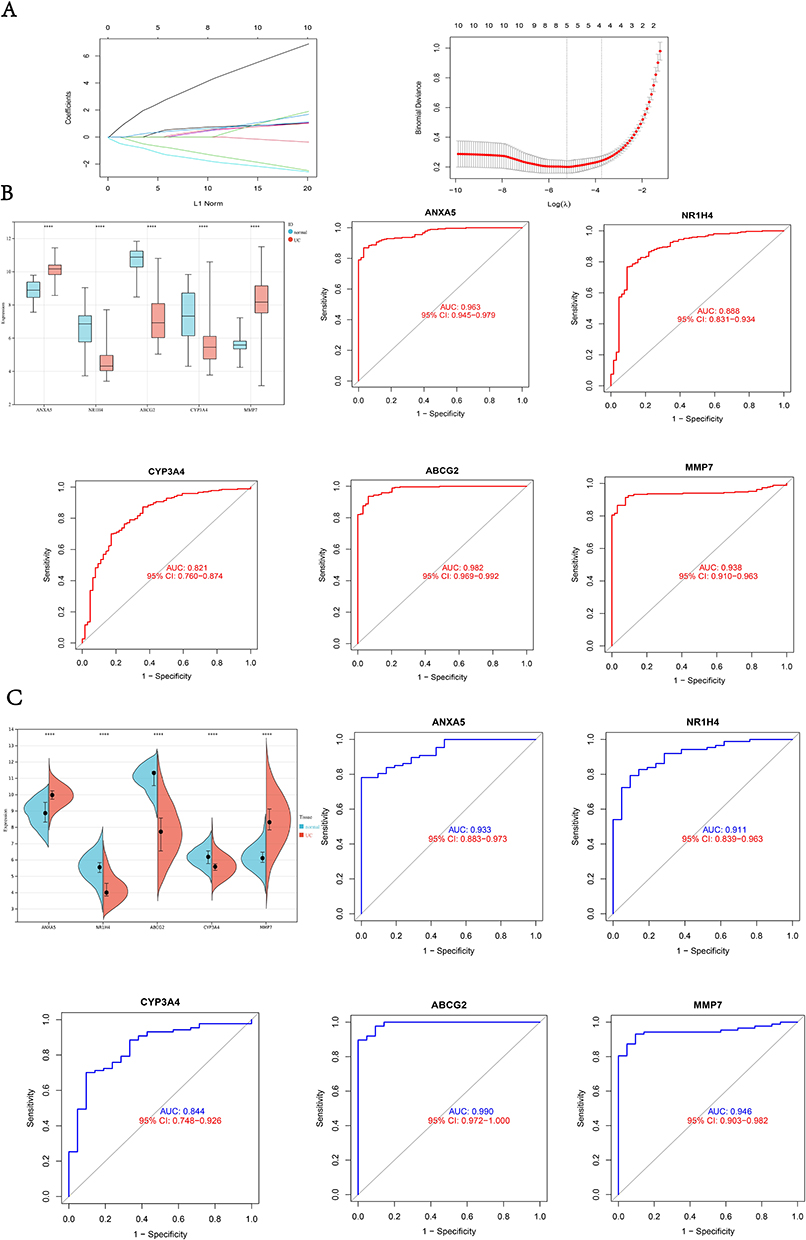 |
Figure 5 LASSO analysis and exploring diagnostic Biomarkers. (A) LASSO analysis to screen diagnostic genes; (B) the expression of diagnostic genes and ROC plot in the training set; (C) the expression of diagnostic genes and ROC plot in the validation cohort. ****p<0.0001. Abbreviations: ROC, Receiver Operating Characteristic Curve; AUC, Area Under Curve. |
Immune Cell Infiltration Evaluation
Considering the important role of the immune pathway in UC that the GSEA gene enrichment analysis showed, we used the CIBERSORT algorithm to analyze the infiltration of immune cells in UC patients, and normal control and samples with p > 0.05 were excluded (Figure 6A). As shown in the figure that among the 22 immune cells, activated memory CD4 +T cells, follicular helper T cells, M0 Macrophages, M1 Macrophages, Activated Dendritic cells, Activated Mast cells, Eosinophils, and Neutrophils were increased in UC patients, while CD8 +T cells, resting memory CD4 +T cells, Tregs cell, M2 Macrophages, and Resting Mast cells were higher in normal control. Also, we can get the approximate proportion of all kinds of immune cells from the bar chart (Figure 6B). In addition, we explored the correlation of hub genes and 22 immune cells (Figure 6C), and it revealed that these five genes correlated with most immune cells. As ANXA5 gained the highest BC, we demonstrated eight immune cells that are mainly correlated with the gene (Figure 6D). Certainly, Neutrophils and M2 Macrophages were most closely related to ANXA5.
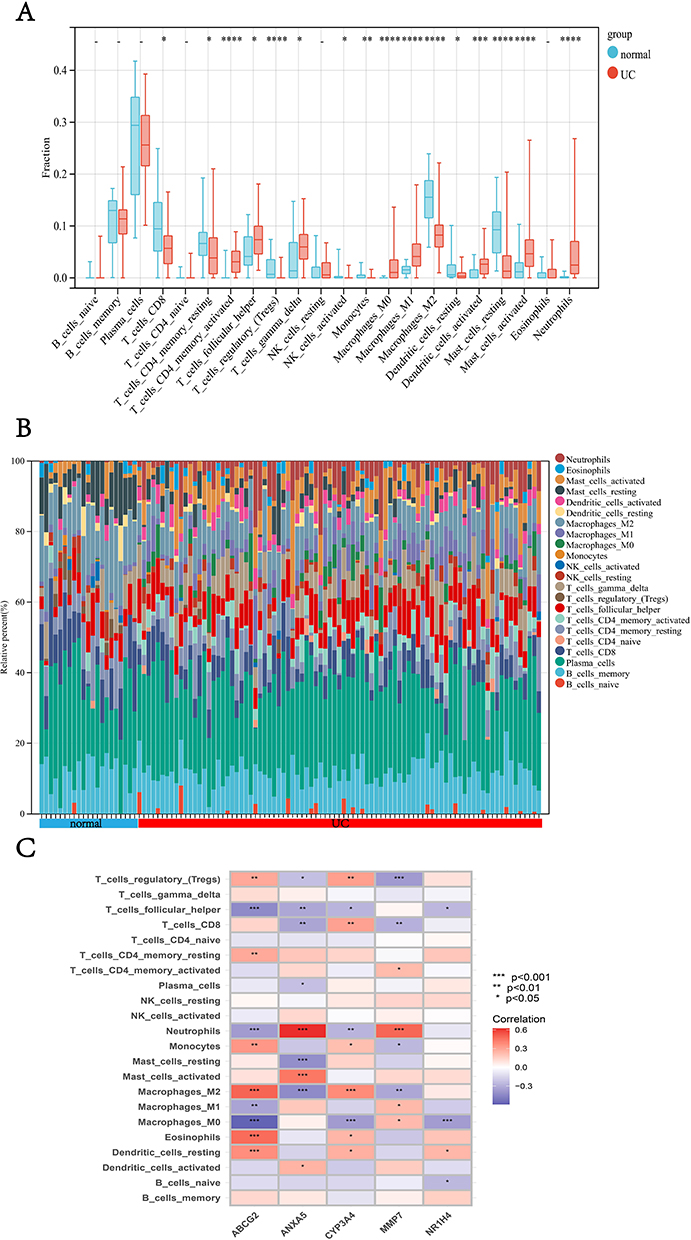 |
Figure 6 Continued. |
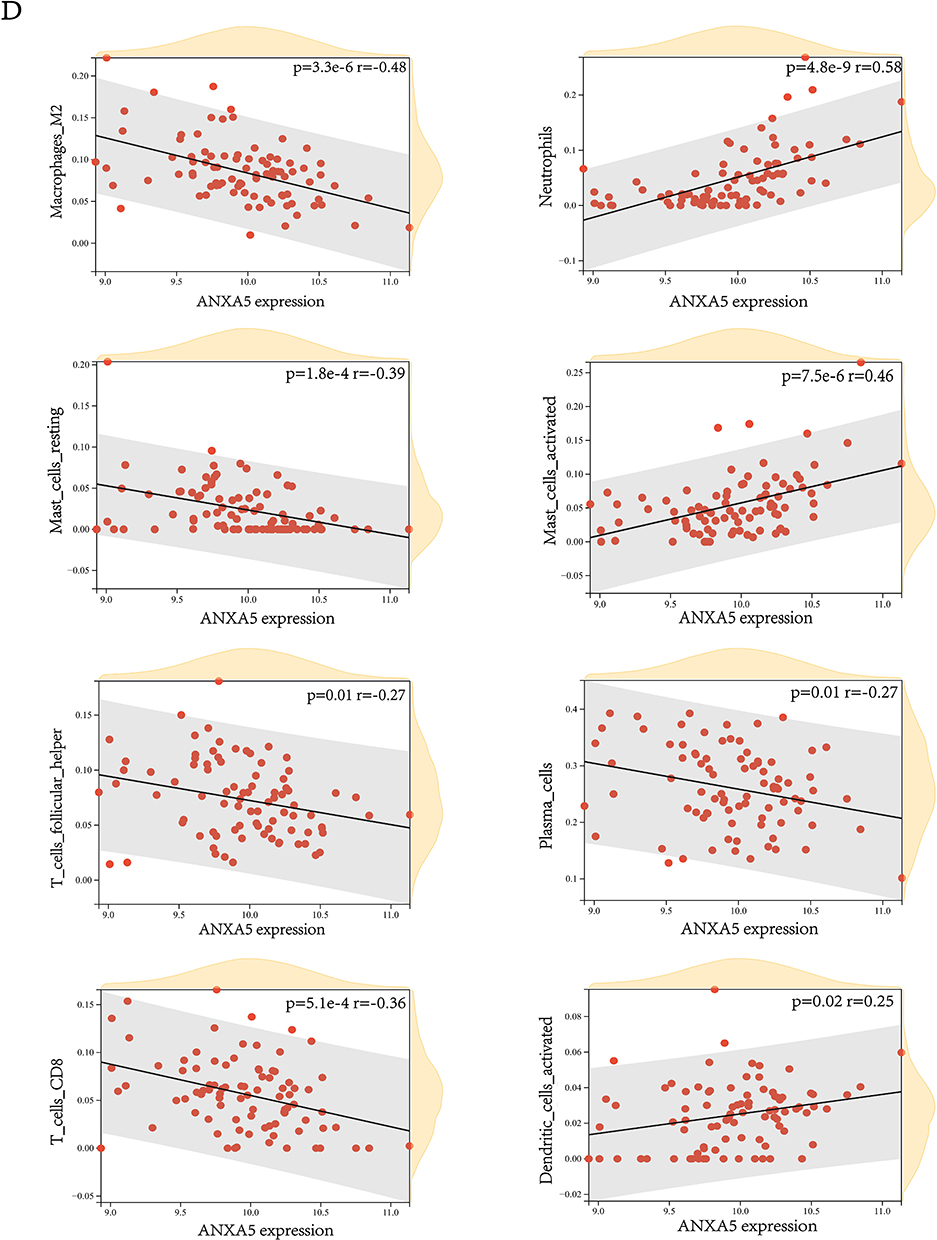 |
Figure 6 Analysis of differences in the immune microenvironment. (A) The content of immune cells in different groups. (B) A view of the distribution of immune cells between different groups. (C) The heatmap shows the correlation between diagnostic genes and immune cells. (D) The relation between ANXA5 and eight immune cells. *p<0.05, **p <0.01, ***p <0.001, and ****p<0.0001. |
Single-Cell RNA Analysis of Colonic Lamina Propria Immune Cells from UC Patients
The GSE162335 dataset collected sequencing data of all CD45 + cells in the UC patient’s colon sample. After quality control, data from 4680 cells remained and there were 1519 cells in GSM4949927, 1591 cells in GSM4949928, and 1570 cells in GSM4949929 (Figure 7A). Through the t-distributed stochastic neighbor embedding method (t-SNE), all immune cells were divided into 14 clusters (Figure 7B). Eventually, with the help of the online website Human Cell Landscape and CellMarker,24,25 cell clusters were annotated as six kinds of immune cells (Figure 7C and D). As we have proved before, ANXA5 was the most significant gene based on its BC and closely related to some immune cells. We analyzed its relationship with each kind of immune cell by single-cell analysis. The result suggested that ANXA5 showed a strong correlation with immune cells, especially macrophages (Figure 7E).
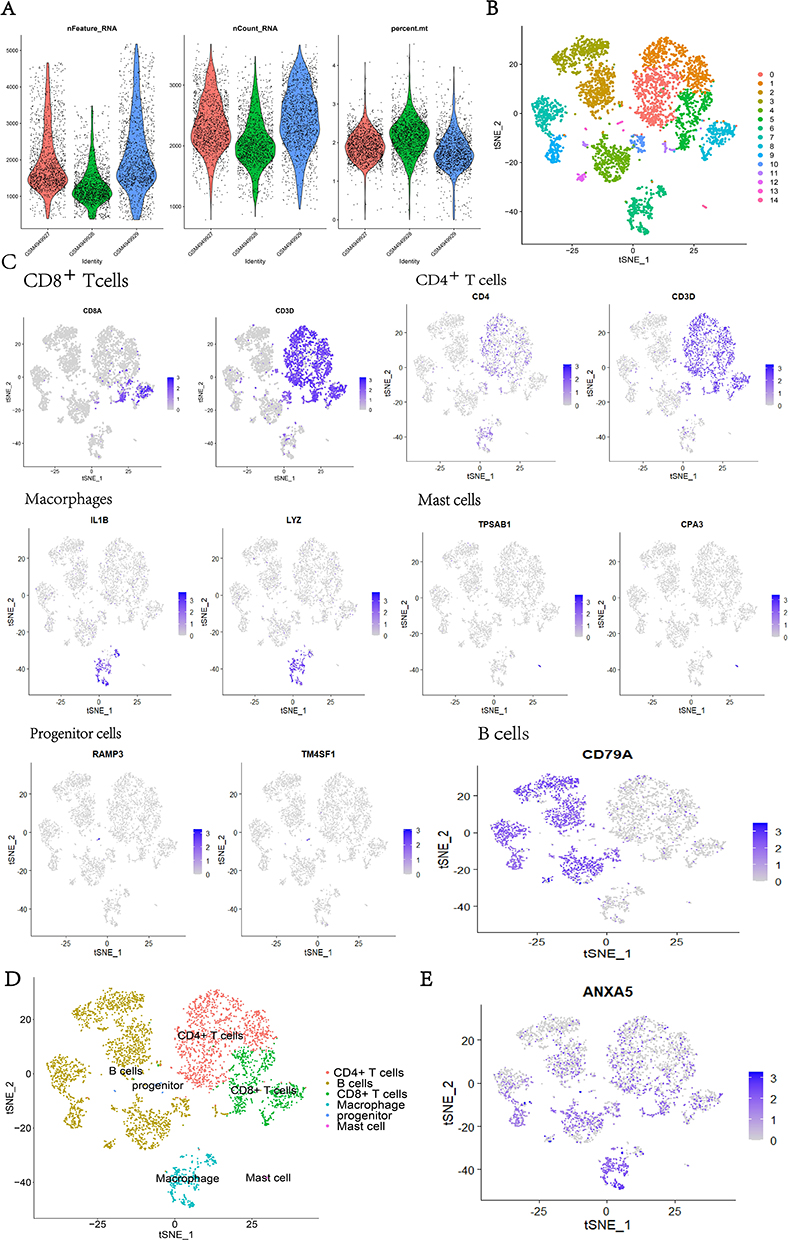 |
Figure 7 Single-cell RNA analysis of Immune cells. (A) Cell samples of GSE162335 after quality control; (B) the cells were divided into 14 clusters using the tSNE algorithm; (C) annotated the cluster by Marker genes; (D) the clusters were annotated as 6 kinds of immune cells; (E) the expression of ANXA5 were mostly concentrated in the intestinal macrophage. |
Animal Experiments to Verify the Expression of ANXA5
After drinking 3% DSS for 7 days, the majority of mice in the study group manifested weight-losing and bloody stools compared with normal control (Figure 8A). At the same time, histopathological changes confirmed that the model of UC was established. Hematoxylin/eosin staining of colonic sections demonstrated that the colon tissue from the study group showed the partial disappearance of intestinal mucosa, inflammatory cell infiltration in the mucosal layer, and structural disruption of the crypt (Figure 8B). Importantly, compared to normal control, the mRNA expression levels of ANXA5 in the colon of UC mice were significantly higher, p<0.05 (Figure 8C). Lastly, as shown in the picture, the ANXA5 expression was increased in the intestinal macrophages (Figure 8D). However, we can see the descending tendency of ANXA5 in M2 macrophages (Figure 8E). To summarize, there is no denying that all the outcomes of experiments firmly prove the accuracy of what we gain through bioinformatic analysis.
 |
Figure 8 The results of the animal experiment. (A) The study group shows bloody stool after DSS induction; (B) hematoxylin/eosin staining of colonic sections in each group(100×); (C) the expression of ANXA5 in two groups; (D) the ANXA5 expression in the intestinal macrophages was determined by Flow cytometry analysis; (E) the Flow cytometry analysis present the level of ANXA5 in M2 macrophage. *p<0.05, ***p <0.001. Abbreviation: UC, ulcerative colitis. |
Discussion
UC is a chronic, idiopathic inflammatory disease affecting the colon, most commonly diagnosed in adults aged 30–40 years old, and may seriously affect the patient’s working ability and quality of life.29,30 Diagnosis and disease management are extremely important in the long run. The main manifestations of UC are bloody diarrhea with or without mucus.31 Most patients may experience tenesmus and other atypical symptoms, which make it more difficult to diagnose UC. To date, the diagnosis of UC still depends on colonoscopy. Finding out new potential biomarkers contributes to deepening the research on the etiology of UC, to optimize the diagnosis and treatment methods.32 In recent years, with the rapid development of bioinformatics analysis, gene expression microarray has been widely used in the exploration of potential biomarkers for complex diseases, such as UC.33 In this study, we screened out DEGs and its intersection of genes in the hub module selected by WGCNA. Moreover, we eventually figured out five reliable diagnostic genes (ANXA5, MMP7, NR1H4, CYP3A4, ABCG2) that maintained excellent AUC values both in the training set and validation cohort after multiple processes. Also, the enrichment analysis of hub genes revealed the significance of the immune pathway in the progress of UC. We carried out research on the immune infiltration of UC compared with normal control and cleared the relation between diagnostic genes and immune cells, especially that ANXA5 showed a positive correlation with Neutrophils and a negative correlation with M2 macrophages. Additionally, the single-cell analysis indicated that ANXA5 mainly enriches in the intestinal macrophages which further confirms our finding. Above all, the animal experiment verified the increase of ANXA5 in the UC mice model and showed that the expression of ANXA5 was enhanced in intestinal macrophages but decreased in M2 macrophages with the comparison of macrophages extracted from normal colon.
MMP7 (Matrix metalloproteinase 7) belongs to a kind of calcium and zinc-dependent proteolytic enzyme produced by multiple cells and tissues.34,35 It is the smallest MMP and lacks a hemopexin domain at the C-terminus.36 MMP-7 secreted from glandular and mucosal epithelial cells in the lung and the gut participates in innate immunity through activating a-defensins (response to bacterial products such as LPS). Although the specific role of MMP7 in UC is not clear now, studies showed the increased expression of MMP7 in UC patients.37 As a promising diagnostic gene, MMP7 may provide a potential direction for the study of UC.
NR1H4 (nuclear receptor subfamily 1 group H member 4) is also called Farnesoid X receptor which is highly expressed in the gastrointestinal tract.38,39 Some research suggests that the interaction between bile acid and NR1H4 may be involved in the pathogenesis of a variety of diseases, such as cholestatic liver disease, hepatocellular carcinoma, and inflammatory bowel disease.40 Moreover, NR1H4 alleviates inflammation, maintains the integrity of the intestinal epithelial barrier, and prevents bacterial translocation in the intestinal tract.41 Vavassori42 found that the expression of pro-inflammatory factors in NR1H4 knockout mice was significantly higher than that in wild-type mice. Our study concluded that NR1H4 was decreased in UC patients which proved that the decrease of NR1H4 may play an essential part in promoting the development of UC.
CYP3A4C is a member of the cytochrome P450 enzyme system, which is famous for its function in metabolizing drugs.43 However, CYP3A4C would reduce in the presence of inflammation,44 and its activity may be related to various pro-inflammatory cytokines, especially interleukin 6, CXCL8, interleukin 1 receptor antagonists, and so on.45 As one of the inflammatory bowel diseases, UC is characterized by chronic and progressive inflammation of the intestine. The decrease of CYP3A4 in UC patients may be caused by the inordinate cytokines in UC, which could serve as potential mechanisms of CYP3A4 as an excellent diagnostic marker for UC.
In recent years, considerable progress has been made in the study of the regulated role of ABCG2 in infection, inflammation, tissue damage, hypoxia, and endoplasmic reticulum stress.46,47 Although no research clearly elucidated the inhibitive role of ABCG2, some studies have shown that the expression of ABCG2 in UC patients was decreased, and its reduction is negatively correlated with the functional microRNA in UC.48
ANXA5 (Annexin A5) is a member of the annexin protein family and mostly exists in mammalian cells.49 Annexins are a family of proteins that could bind to negatively charged phospholipids in the presence of calcium. It was first discovered in 1978.50 The Annexin protein family has diverse biological activities, such as participating in the formation of the cell membranes, playing a part in the coagulation process by binding actin protein,51,52 involving in cell signal transduction regulation,53 and so on. ANXA5 is one of the most famous annexins owing to its role as an exogenous protein binding to extracellularly exposed phosphatidylserine, which is a marker of apoptosis.54 The anti-apoptotic effect of ANXA5 depends on phosphatidylserine (PS) that is exposed on the surface of apoptotic and necrotic cells. ANXA5 binds to PS with high affinity and inhibits macrophage’s uptake of apoptotic and necrotic cells, thereby increasing the immunogenicity of necrotic cells.55 Frey et al knocked out the ANXA5 gene of mice and it allowed them to investigate the role of endogenous ANXA5 in the modulation of immune response towards allogeneic cells for the first time.56 Apparently, the data they gathered demonstrated that the peritoneal macrophages of ANXA5 KO mice uptake more necrotic cells and obtain an increased secretion of the anti-inflammatory cytokine IL-10 after co-culture with necrotic cells. As we all know, macrophages are the first-line cells in the innate immune system that defend against foreign pathogens and maintain the barrier function in the intestine.57 Macrophages display remarkable plasticity that allows them to change their phenotype and their physiology by both innate and adaptive immune responses.58 Normally, macrophage populations can be divided into pro-inflammatory M1 macrophages or anti-inflammatory M2 macrophages. During homeostasis, macrophages exhibit a M2-like phenotype, with high expression of CD206, and present typical functions of anti-inflammatory macrophages such as secretion of anti-inflammatory cytokines IL-10 and TGF-β. In the context of IBD, the differentiation process towards mature M2 macrophages is disrupted, and monocytes are more likely to differentiate proinflammatory M1 macrophages.59 Nowadays, more and more studies focus on the underlying mechanism of macrophage polarization in ulcerative colitis.33 In this study, we not only find out that ANXA5 was a diagnostic gene for UC but also testify its correlation with immune cells. Most importantly, the expression of ANXA5 maintained a positive correlation with intestinal macrophages while obtained a negative correlation with M2 macrophages which were confirmed by bioinformatic analysis and animal experiments. All results showed a possibility of ANXA5 in the regulation of macrophage polarization. In other words, ANXA5 acts as an inflammatory factor in specific conditions. Similarly, previous work concluded that silencing of ANXA5 attenuates the lipopolysaccharide‐induced inflammatory response of rat alveolar macrophages.60 With the combination of previous research, we presume that ANXA5 plays an important part in the progression of UC and the underlying mechanism may rely on its regulation role of macrophage polarization. Despite our findings, our conclusions need to be verified by more clinical trials before they can be applied to clinical use.
In summary, we screened out five diagnostic genes for UC (ANXA5, MMP7, NR1H4, CYP3A4, ABCG2) and analyzed their relation with immune cells. Besides, the ultimate analysis of ANXA5 and immune cell correlation suggests that ANXA5 may influence the polarization of macrophages. This may provide a new direction for us to study the mechanism of UC progression.
Conclusion
We identified ANXA5, MMP7, NR1H4, CYP3A4, and ABCG2 as diagnostic genes of UC that are closely related to immune infiltration and ANXA5 maintains a negative correlation with M2 macrophages, which indicated its possible influence on the polarization of macrophage in UC patients.
Abbreviations
UC, Ulcerative colitis; IBD, Inflammatory bowel diseases; ANXA5, Annexin 5; MMP7, Matrix metalloproteinase 7; NR1H4, Nuclear receptor subfamily 1 group H member 4; CYP3A, Cytochrome P450, subfamily IIIA; ABCG2, ATP-binding cassette transporter G2; DSS, Dextran sodium sulfate; WGCNA, Weighted gene co-expression network analysis; PPI, Protein–Protein Interaction Networks; CC, Cellular component; BP, Biological process; MF, Molecular function; GSEA, Gene Set Enrichment Analysis; GS, Gene significance; MM, Module membership.
Statement of Animal Rights
All of the experiment procedures involving animals were conducted in accordance with the guidance of the Medical and Ethics Committee of TIANJIN Medical University (Tianjin) and approved by the Animal Care and Use Committee of TIANJIN Medical University (IRB2023-DW-106).
Data Sharing Statement
The datasets generated during the current study are available in the GEO repository. The GEO dataset name was mentioned in Materials and Methods.
Ethics Approval and Consent to Participate
All of the animal experimental operations were approved by the Animal Care and Use Committee of TIANJIN Medical University and meet the guidance of the Medical and Ethics Committee of TIANJIN Medical University (Tianjin) (IRB2023-DW-106).
Author Contributions
All authors made a significant contribution to the work reported, whether that is in the conception, study design, execution, acquisition of data, analysis and interpretation, or in all these areas; Also, all authors took part in drafting, revising or critically reviewing the article, gave final approval of the version to be published and agreed on the journal to which the article has been submitted and agree to be accountable for all aspects of the work.
Funding
This study was supported by the National Natural Science Foundation of China (Grant No. 82170399).
Disclosure
The authors declare that they have no competing interests in this work.
References
1. Ordas I, Eckmann L, Talamini M, et al. Ulcerative colitis. Lancet. 2012;380(9853):1606–1619. doi:10.1016/S0140-6736(12)60150-0
2. Buie MJ, Quan J, Windsor JW, et al. Global hospitalization trends for Crohn’s Disease and Ulcerative Colitis in the 21st century: a systematic review with temporal analyses. Clin Gastroenterol Hepatol. 2023;21(9):2211–2221. doi:10.1016/j.cgh.2022.06.030
3. Agrawal M, Jess T. Implications of the changing epidemiology of inflammatory bowel disease in a changing world. United Eur Gastroent. 2022;10(10):1113–1120. doi:10.1002/ueg2.12317
4. Aniwan S, Santiago P, Loftus EV, et al. The epidemiology of inflammatory bowel disease in Asia and Asian immigrants to Western countries. United Eur Gastroent. 2022;10(10):1063–1076. doi:10.1002/ueg2.12350
5. Cosnes J, Gower-Rousseau C, Seksik P, et al. Epidemiology and natural history of inflammatory bowel diseases. Gastroenterology. 2011;140(6):1785–1794. doi:10.1053/j.gastro.2011.01.055
6. Magro F, Gionchetti P, Eliakim R, et al. Third European Evidence-based Consensus on Diagnosis and Management of Ulcerative Colitis. Part 1: definitions, Diagnosis, Extra-intestinal Manifestations, Pregnancy, Cancer Surveillance, Surgery, and Ileo-anal Pouch Disorders. J Crohns Colitis. 2017;11(6):649–670. doi:10.1093/ecco-jcc/jjx008
7. Du L, Ha C. Epidemiology and pathogenesis of ulcerative colitis. Gastroenterol Clin North Am. 2020;49(4):643–654. doi:10.1016/j.gtc.2020.07.005
8. Xavier RJ, Podolsky DK. Unravelling the pathogenesis of inflammatory bowel disease. Nature. 2007;448(7152):427–434. doi:10.1038/nature06005
9. Zaiatz Bittencourt V, Jones F, Tosetto M, et al. Dysregulation of metabolic pathways in circulating natural killer cells isolated from inflammatory bowel disease patients. J Crohns Colitis. 2021;15(8):1316–1325. doi:10.1093/ecco-jcc/jjab014
10. Rao Q, Ma G C, Wu H, et al. Dendritic cell combination therapy reduces the toxicity of triptolide and ameliorates colitis in murine models. Drug Deliv. 2022;29(1):679–691. doi:10.1080/10717544.2022.2044935
11. Vancamelbeke M, Vanuytsel T, Farre R, et al. Genetic and transcriptomic bases of intestinal epithelial barrier dysfunction in inflammatory bowel disease. Inflamm Bowel Dis. 2017;23(10):1718–1729. doi:10.1097/MIB.0000000000001246
12. Li K, Strauss R, Ouahed J, et al. Molecular comparison of adult and pediatric ulcerative colitis indicates broad similarity of molecular pathways in disease tissue. J Pediatr Gastroenterol Nutr. 2018;67(1):45–52. doi:10.1097/MPG.0000000000001898
13. Sandborn WJ, Feagan BG, Marano C, et al. Subcutaneous golimumab induces clinical response and remission in patients with moderate-to-severe ulcerative colitis. Gastroenterology. 2014;146(1):85–95; quiz e14–5. doi:10.1053/j.gastro.2013.05.048
14. Devlin JC, Axelrad J, Hine AM, et al. Single-cell transcriptional survey of ileal-anal pouch immune cells from ulcerative colitis patients. Gastroenterology. 2021;160(5):1679–1693. doi:10.1053/j.gastro.2020.12.030
15. Langfelder P, Horvath S. WGCNA: an R package for weighted correlation network analysis. BMC Bioinform. 2008;9(1):559. doi:10.1186/1471-2105-9-559
16. Szklarczyk D, Morris JH, Cook H, et al. The STRING database in 2017: quality-controlled protein-protein association networks, made broadly accessible. Nucleic Acids Res. 2017;45(D1):D362–D8. doi:10.1093/nar/gkw937
17. Otasek D, Morris JH, Boucas J, et al. Cytoscape Automation: empowering workflow-based network analysis. Genome Biol. 2019;20(1):185. doi:10.1186/s13059-019-1758-4
18. Yu G, Wang LG, Han Y, et al. clusterProfiler: an R package for comparing biological themes among gene clusters. OMICS. 2012;16(5):284–287. doi:10.1089/omi.2011.0118
19. Daneshvar A, Mousa G. Regression shrinkage and selection via least quantile shrinkage and selection operator. PLoS One. 2023;18(2):e0266267. doi:10.1371/journal.pone.0266267
20. Chen LB, Khodadoust MS, Liu CL, et al. Profiling tumor infiltrating immune cells with CIBERSORT. Methods Mol Biol. 2018;1711:243–259 doi:10.1007/978-1-4939-7493-1_12
21. Newman AM, Liu CL, Green MR, et al. Robust enumeration of cell subsets from tissue expression profiles. Nat Methods. 2015;12(5):453–457. doi:10.1038/nmeth.3337
22. Deng B, Liao F, Liu Y, et al. Comprehensive analysis of endoplasmic reticulum stress-associated genes signature of ulcerative colitis. Front Immunol. 2023;14:1158648. doi:10.3389/fimmu.2023.1158648
23. Hao Y, Hao S, Andersen-Nissen E, et al. Integrated analysis of multimodal single-cell data. Cell. 2021;184(13):3573–87 e29. doi:10.1016/j.cell.2021.04.048
24. Han X, Zhou Z, Fei L, et al. Construction of a human cell landscape at single-cell level. Nature. 2020;581(7808):303–309. doi:10.1038/s41586-020-2157-4
25. Hu C, Li T, Xu Y, et al. CellMarker 2.0: an updated database of manually curated cell markers in human/mouse and web tools based on scRNA-seq data. Nucleic Acids Res. 2023;51(D1):D870–D6. doi:10.1093/nar/gkac947
26. Sun X, Wei B, Liu S, et al. Anxa5 mediates the in vitro malignant behaviours of murine hepatocarcinoma Hca-F cells with high lymph node metastasis potential preferentially via ERK2/p-ERK2/c-Jun/p-c-Jun(Ser73) and E-cadherin. Biomed Pharmacother. 2016;84:645–654. doi:10.1016/j.biopha.2016.09.086
27. Koscso B, Bogunovic M. Analysis and purification of mouse intestinal dendritic cell and macrophage subsets by flow cytometry. Curr Protoc Immunol. 2016;114:14 39 1–14 39 14. doi:10.1002/cpim.11
28. Weigmann B, Tubbe I, Seidel D, et al. Isolation and subsequent analysis of murine lamina propria mononuclear cells from colonic tissue. Nat Protoc. 2007;2(10):2307–2311. doi:10.1038/nprot.2007.315
29. Hoivik ML, Moum B, Solberg IC, et al. Work disability in inflammatory bowel disease patients 10 years after disease onset: results from the IBSEN Study. Gut. 2013;62(3):368–375. doi:10.1136/gutjnl-2012-302311
30. Torres J, Billioud V, Sachar DB, et al. Ulcerative colitis as a progressive disease: the forgotten evidence. Inflamm Bowel Dis. 2012;18(7):1356–1363. doi:10.1002/ibd.22839
31. Mcdowell C, Farooq U, Haseeb M. Inflammatory Bowel Disease. 2023 Aug 4. In :StatPearls[Internet]. Treasure Island (FL): StatPearls Publishing; 2023 Jan–. PMID: 29262182.
32. Lewis JD. The utility of biomarkers in the diagnosis and therapy of inflammatory bowel disease. Gastroenterology. 2011;140(6):1817–26 e2. doi:10.1053/j.gastro.2010.11.058
33. Zhang J, Wang X, Xu L, et al. Investigation of potential genetic biomarkers and molecular mechanism of ulcerative colitis utilizing bioinformatics analysis. Biomed Res Int. 2020;2020:4921387. doi:10.1155/2020/4921387
34. Gross J, Lapiere CM. Collagenolytic activity in amphibian tissues: a tissue culture assay. Proc Natl Acad Sci U S A. 1962;48(6):1014–1022. doi:10.1073/pnas.48.6.1014
35. Saito S, Trovato MJ, You R, et al. Role of matrix metalloproteinases 1, 2, and 9 and tissue inhibitor of matrix metalloproteinase-1 in chronic venous insufficiency. J Vasc Surg. 2001;34(5):930–938. doi:10.1067/mva.2001.119503
36. Burke B. The role of matrix metalloproteinase 7 in innate immunity. Immunobiology. 2004;209(1–2):51–56. doi:10.1016/j.imbio.2004.04.005
37. Rath T, Roderfeld M, Graf J, et al. Enhanced expression of MMP-7 and MMP-13 in inflammatory bowel disease: a precancerous potential? Inflamm Bowel Dis. 2006;12(11):1025–1035. doi:10.1097/01.mib.0000234133.97594.04
38. Chiang JYL. Bile acid metabolism and signaling in liver disease and therapy. Liver Res. 2017;1(1):3–9. doi:10.1016/j.livres.2017.05.001
39. Li T, Chiang JY. Bile acid signaling in metabolic disease and drug therapy. Pharmacol Rev. 2014;66(4):948–983. doi:10.1124/pr.113.008201
40. Gadaleta RM, Van Mil SW, Oldenburg B, et al. Bile acids and their nuclear receptor FXR: relevance for hepatobiliary and gastrointestinal disease. Biochim Biophys Acta. 2010;1801(7):683–692. doi:10.1016/j.bbalip.2010.04.006
41. Ding L, Yang L, Wang Z, et al. Bile acid nuclear receptor FXR and digestive system diseases. Acta Pharm Sin B. 2015;5(2):135–144. doi:10.1016/j.apsb.2015.01.004
42. Vavassori P, Mencarelli A, Renga B, et al. The bile acid receptor FXR is a modulator of intestinal innate immunity. J Immunol. 2009;183(10):6251–6261. doi:10.4049/jimmunol.0803978
43. Werk AN, Cascorbi I. Functional gene variants of CYP3A4. Clin Pharmacol Ther. 2014;96(3):340–348. doi:10.1038/clpt.2014.129
44. Molanaei H, Stenvinkel P, Qureshi AR, et al. Metabolism of alprazolam (a marker of CYP3A4) in hemodialysis patients with persistent inflammation. Eur J Clin Pharmacol. 2012;68(5):571–577. doi:10.1007/s00228-011-1163-8
45. Wollmann BM, Syversens W, Vistnes M, et al. Associations between cytokine levels and CYP3A4 phenotype in patients with rheumatoid arthritis. Drug Metab Dispos. 2018;46(10):1384–1389. doi:10.1124/dmd.118.082065
46. Martin CM, Ferdous A, Gallardo T, et al. Hypoxia-inducible factor-2alpha transactivates Abcg2 and promotes cytoprotection in cardiac side population cells. Circ Res. 2008;102(9):1075–1081. doi:10.1161/CIRCRESAHA.107.161729
47. To KK, Leung WW, Ng SS. A novel miR-203-DNMT3b-ABCG2 regulatory pathway predisposing colorectal cancer development. Mol Carcinog. 2017;56(2):464–477. doi:10.1002/mc.22508
48. Erdmann P, Bruckmueller H, Martin P, et al. Dysregulation of mucosal membrane transporters and drug-metabolizing enzymes in ulcerative colitis. J Pharm Sci. 2019;108(2):1035–1046. doi:10.1016/j.xphs.2018.09.024
49. Krey JF, Drummond M, Foster S, et al. Annexin A5 is the most abundant membrane-associated protein in stereocilia but is dispensable for hair-bundle development and function. Sci Rep. 2016;6:27221. doi:10.1038/srep27221
50. Pollard HB, Creutz CE, Pazoles CJ. Identification and purification of an adrenal medullary protein (synexin) that causes calcium-dependent aggregation of isolated chromaffin granules. J Biol Chem. 1978;253(8):2858–2866. doi:10.1016/S0021-9258(17)40901-X
51. Ju XIY, Wang Y R, Wang Y. Roles of Annexin A protein family in autophagy regulation and therapy. Biomed Pharmacother. 2020;130:110591. doi:10.1016/j.biopha.2020.110591
52. Tzima E, Trotter PJ, Orchard MA, et al. Annexin V relocates to the platelet cytoskeleton upon activation and binds to a specific isoform of actin. Eur J Biochem. 2000;267(15):4720–4730. doi:10.1046/j.1432-1327.2000.01525.x
53. Monastyrskaya K, Babiychuk EB, Draeger A. The annexins: spatial and temporal coordination of signaling events during cellular stress. Cell Mol Life Sci. 2009;66(16):2623–2642. doi:10.1007/s00018-009-0027-1
54. Kuge Y, Zhao S, Takei T, et al. Molecular imaging of apoptosis with radio-labeled Annexin A5 focused on the evaluation of tumor response to chemotherapy. Anticancer Agents Med Chem. 2009;9(9):1003–1011. doi:10.2174/187152009789377736
55. Munoz LE, Franz S, Pausch F, et al. The influence on the immunomodulatory effects of dying and dead cells of Annexin V. J Leukoc Biol. 2007;81(1):6–14. doi:10.1189/jlb.0306166
56. Frey B, Munoz LE, Pausch F, et al. The immune reaction against allogeneic necrotic cells is reduced in Annexin A5 knock out mice whose macrophages display an anti-inflammatory phenotype. J Cell Mol Med. 2009;13(7):1391–1399. doi:10.1111/j.1582-4934.2008.00395.x
57. Pan X, Zhu Q, Pan LL, et al. Macrophage immunometabolism in inflammatory bowel diseases: from pathogenesis to therapy. Pharmacol Ther. 2022;238:108176. doi:10.1016/j.pharmthera.2022.108176
58. Mosser DM, Edwards JP. Exploring the full spectrum of macrophage activation. Nat Rev Immunol. 2008;8(12):958–969. doi:10.1038/nri2448
59. Bain C, Scott CL, Uronen-Hansson H, et al. Resident and pro-inflammatory macrophages in the colon represent alternative context-dependent fates of the same Ly6Chi monocyte precursors. Mucosal Immunol. 2013;6(3):498–510. doi:10.1038/mi.2012.89
60. Zhang Z, Zhang Y, Zhou R. Loss of Annexin A5 expression attenuates the lipopolysaccharide-induced inflammatory response of rat alveolar macrophages. Cell Biol Int. 2020;44(2):391–401. doi:10.1002/cbin.11239
 © 2023 The Author(s). This work is published and licensed by Dove Medical Press Limited. The
full terms of this license are available at https://www.dovepress.com/terms
and incorporate the Creative Commons Attribution
- Non Commercial (unported, 3.0) License.
By accessing the work you hereby accept the Terms. Non-commercial uses of the work are permitted
without any further permission from Dove Medical Press Limited, provided the work is properly
attributed. For permission for commercial use of this work, please see paragraphs 4.2 and 5 of our Terms.
© 2023 The Author(s). This work is published and licensed by Dove Medical Press Limited. The
full terms of this license are available at https://www.dovepress.com/terms
and incorporate the Creative Commons Attribution
- Non Commercial (unported, 3.0) License.
By accessing the work you hereby accept the Terms. Non-commercial uses of the work are permitted
without any further permission from Dove Medical Press Limited, provided the work is properly
attributed. For permission for commercial use of this work, please see paragraphs 4.2 and 5 of our Terms.
Recommended articles
Pneumococcal Endopeptidase O Attenuates Colitis by Inhibiting the Macrophage–CCL2 Axis and Reshaping Gut Microbiota
Wang H, Shao S, Peng Y, Xu W, Zhang J, Liu X, Bian X, Huang K, Zhang X
Journal of Inflammation Research 2026, 19:601434
Published Date: 27 May 2026