Back to Journals » Breast Cancer: Targets and Therapy » Volume 18
Single-Cell Profiling Reveals a Treg-Rich, NK Cell-Depleted Immune Microenvironment in Triple-Negative Breast Cancer with High-Glucocorticoid Receptor Expression
Authors Behar J ![]() , Shiang C, Dolcen DN, Bennett LB, DeVilbiss AW, Matossian MD, Chan IS, Nanda R
, Shiang C, Dolcen DN, Bennett LB, DeVilbiss AW, Matossian MD, Chan IS, Nanda R ![]() , Conzen SD, Lafin JT
, Conzen SD, Lafin JT
Received 27 October 2025
Accepted for publication 11 March 2026
Published 14 April 2026 Volume 2026:18 569936
DOI https://doi.org/10.2147/BCTT.S569936
Checked for plagiarism Yes
Review by Single anonymous peer review
Peer reviewer comments 2
Editor who approved publication: Professor Robert Clarke
Joshua Behar,1,* Christine Shiang,1,* Deniz Nesli Dolcen,1 Lynda B Bennett,1 Andrew W DeVilbiss,1 Margarite D Matossian,2 Isaac S Chan,1,3 Rita Nanda,2 Suzanne D Conzen,1 John T Lafin4
1Department of Internal Medicine, Division of Hematology & Oncology, UT Southwestern Medical Center, Dallas, TX, 75390, USA; 2Department of Medicine, Section of Hematology and Oncology, The University of Chicago Medicine Comprehensive Cancer Center, Chicago, IL, 60805, USA; 3Department of Molecular Biology, UT Southwestern Medical Center, Dallas, TX, 75390, USA; 4Department of Urology, UT Southwestern Medical Center, Dallas, TX, 75390, USA
*These authors contributed equally to this work
Correspondence: Suzanne D Conzen, Division of Hematology & Oncology, UT Southwestern Medical Center, Dallas, TX, 75390, USA, Email [email protected] John T Lafin, Department of Urology, UT Southwestern Medical Center, Dallas, TX, 75390, USA, Email [email protected]
Purpose: Analyses of patients with early-stage, treatment-naïve triple-negative breast cancer (TNBC) have demonstrated that high glucocorticoid receptor (GR) expression in primary tumors is associated with poor prognosis. We previously observed that GR-high primary TNBCs exhibited significantly increased numbers of tumor-infiltrating regulatory T cells (Tregs) compared with GR-low tumors. To further investigate GR-associated immunologic features, we leveraged imaging mass cytometry (IMC) to profile additional immune cell phenotypes and spatial architecture in GR-high versus GR-low primary TNBC.
Patients and Methods: Tumor-infiltrating immune cells were profiled in formalin-fixed paraffin-embedded (FFPE) core biopsies from five untreated GR-high and four GR-low TNBC tumors using IMC with a 21-antibody panel. Regions of interest (ROI) were selected within pan-cytokeratin-positive tumor nests. Data underwent unsupervised clustering, and cell types were identified based on protein expression profiles. Analyses compared cell-type abundance and spatial interactions in GR-high versus GR-low tumors.
Results: GR-high tumors exhibited significantly greater Treg infiltration within tumor nests than GR-low tumors. GR-high TNBC also showed a comparatively greater abundance of activated memory CD8+ T cells, cytotoxic CD4+ T cells, and effector memory CD4+ T cells. In contrast, GR-low tumors exhibited relatively greater representation of HLA-ABC-positive (HLA-ABC+) cancer cells as well as early-activated dendritic cells (DCs) and natural killer (NK) cells. Spatial analysis revealed that Tregs in GR-high tumors colocalized more frequently with proliferating tumor cells relative to Tregs in GR-low tumors. NK cells in GR-high tumors displayed relatively less colocalization with proliferating tumor cells.
Conclusion: Compared with GR-low disease, treatment-naïve GR-high primary TNBC exhibits a more immunosuppressive tumor microenvironment characterized by greater Treg density, closer Treg-cancer cell proximity, reduced NK cell infiltration, impaired immune surveillance, and decreased abundance of HLA-ABC+ cancer cells. These findings implicate TNBC cell GR signaling as immunosuppressive, likely through mechanisms resulting in both differential immune cell enrichment and altered spatial organization.
Keywords: imaging mass cytometry, tissue architecture, tumor infiltrating immune lymphocytes, antigen presentation, antitumor immunity
Introduction
Triple-negative breast cancer (TNBC) is a clinically aggressive disease marked by limited and often non-durable responses to existing therapies in part due to biological heterogeneity.1,2 Emerging evidence suggests that tumor cell-intrinsic signaling programs dictate the cellular composition and spatial organization of the immune-tumor cell neighborhood in vivo.3–5 Defining these programs has critical implications for understanding and targeting immune evasion and drug resistance.3–5 Tumor cell glucocorticoid receptor (GR) expression and activation have been associated with enhanced cancer cell survival, metastatic potential, and poor patient outcomes.6,7 High tumor cell GR expression correlates with decreased overall survival in patients with estrogen receptor (ER)-negative breast cancers, including TNBC, when compared with patients who have ER-positive disease.8
Our group and others have demonstrated that early-stage TNBC with high tumor cell GR expression is associated with an immunoregulatory tumor microenvironment (TME) characterized by greater infiltration of regulatory T cells (Tregs).9,10 Although these findings suggest a role for tumor cell GR activity in shaping tumor-immune cell dynamics, those data were derived from bulk gene transcriptomic profiling or limited-marker immunohistochemistry (IHC), both of which lack the spatial and phenotypic resolution required to fully characterize the TME. As a result, the broader immune landscape and spatial organization of GR-high TNBC TMEs remain poorly defined.3,4
Imaging mass cytometry (IMC) enables simultaneous quantification of over 40 protein markers using metal-tagged antibodies and laser ablation mass spectrometry, while preserving spatial resolution at the single-cell level.11 Leveraging this platform, we expanded upon prior IHC-based data9 to more comprehensively characterize the immune landscape of treatment-naive TNBC with high versus low GR-expression. IMC enabled detailed phenotyping, quantification of immune cell subsets, and interrogation of cell-cell spatial relationships within the TME. We hypothesized that, beyond greater Treg infiltration, GR-high TNBC might be associated with additional TME immunosuppressive features.5,10,12
To our knowledge, this is the first study to spatially resolve GR-associated immune architecture in TNBC using cellular resolution IMC, providing novel insights into how tumor cell GR signaling may enhance immune evasion and promote disease progression.
Materials and Methods
TNBC Data Collection
Pre-treatment tumor tissue from the diagnostic tumor biopsies of a previously reported cohort of 47 patients with TNBC investigated with multiplex IHC were available for this IMC study.9 These diagnostic biospecimens, derived from patients at The University of Chicago between 2002 and 2014, were de-identified prior to analysis.9
The patient’s age at diagnosis and self-identified race were collected from the de-identified records (Supplemental Table S1); self-identified race was treated strictly as a sociocultural/administrative variable and was not analyzed as an exposure, outcome, or proxy for genetic ancestry. Self-identified race did not inform case selection, image analysis, clustering, or primary statistical analyses. Additional clinical data such as stage and grade were not used.
Because the biospecimens were acquired from an external institution and were fully de-identified prior to investigator access, the UT Southwestern Human Research Protection Program determined that this work does not meet the definition of human subject research under 45 CFR 46.102 and considered our analysis of anonymized retrospective samples to be exempt from Institutional Review Board (IRB) review or oversight.
Accordingly, informed consent was not required and the requirement for consent was waived by The UT Southwestern Human Research Protection Program. All procedures were conducted in accordance with the ethical principles of the Declaration of Helsinki.
Tissue Specimen Selection for Analysis
We pre-specified inclusion criteria to prioritize specimens at the extremes of GR expression. Primary tumors were evaluated for GR expression using the anti-GR rabbit monoclonal XP antibody (Cell Signaling, 1:200 dilution) and secondary anti-rabbit antibody as previously described.9 For each tumor, a weighted H-score was calculated for each case as the percentage of positively stained nuclei in tumor cells multiplied by a weighted intensity of the anti-GR staining (H-score = SPi* I where Pi is the percentage of stained cells in each intensity category, and I is the intensity for i = samples 0, 1, 2, 3) with a range of 0–300.9
From the original cohort of 47 patients, the five biopsies with the highest tumor cell GR H-scores and the four with the lowest H-scores were selected and classified as GR-high (H-score > 200) and GR-low (H-score ≤ 100), respectively.9 Intermediate GR expression cases (H-score between 101 to 200) were excluded from this analysis to avoid potential biological heterogeneity that could confound group comparisons.
Region of Interest Selection
Previously analyzed hematoxylin and eosin (H&E) and multiplexed immunofluorescence (mIF) slides guided the selection of ROI (Figure 1A, left and middle panels).9 Tumor nests were identified and annotated on pan-Cytokeratin mIF sections as equidimensional ROIs, as previously defined,9 and served as spatial references for Hyperion IMC acquisition. Sequential digital images were superimposed to align tissue architecture, enabling one-to-one selection of annotated tumor nest ROIs on their matching IMC slide. Finalized ROIs for acquisition using the Hyperion platform are modeled in Figure 1A (right panel). This was done for each biopsy that was obtained from an individual patient and represented a single biological replicate, whereas ROIs and individual cells represented repeated technical measurements within the same tumor section.
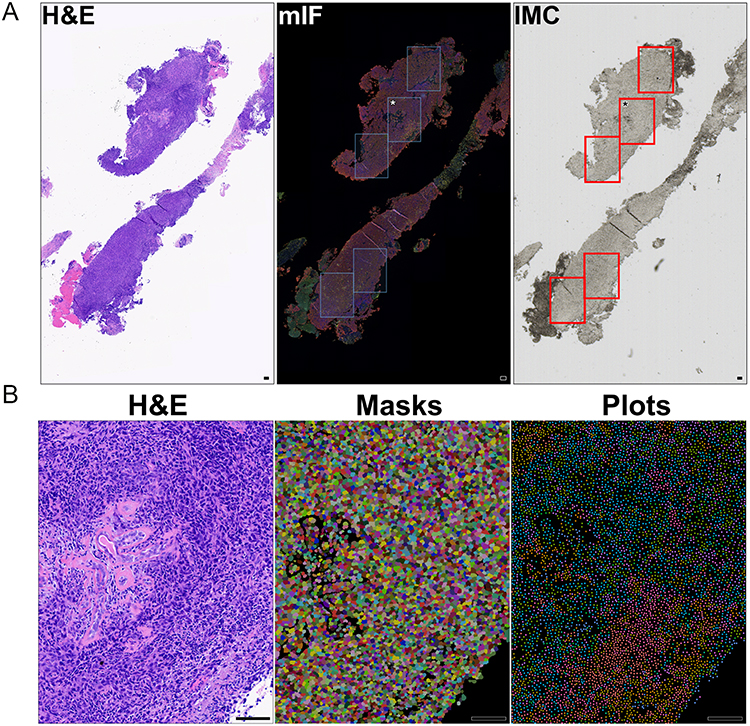 |
Figure 1 Pre- and post-IMC microscopy and computer rendering, illustrating spatial workflow and data for bioinformatics. Light microscopy imaging of serial sections from a representative TNBC biopsy demonstrating ROI mapping for IMC prior to acquisition. (A) Left panel: H&E-stained section showing tumor architecture.9 Middle panel: pan-Cytokeratin mIF delineating five epithelial tumors nests outlined in blue boxes; asterisk indicates the example ROI shown in (B).9 Right panel: Unstained consecutive biopsy section with one-to-one mapping of ROIs outlined in red, confirming accurate mapping of all ROIs prior to Hyperion acquisition. (B) Example confirmatory mask and plot data for the asterisked ROI in (A) relative to its corresponding H&E following IMC acquisition. All scale bars =100 μm. |
The number of ROIs per sample was comparable between GR-high and GR-low tumors (mean ROIs per tumor: 4.6 versus 4.0, respectively) supporting balanced sampling between groups (Supplemental Tables S1 and S2). ROI dimensions were similar between cases and can be found in Supplemental Table S2.
Custom Antibody Panel
To enable high-resolution spatial phenotyping of immune and tumor cell populations, we developed a focused custom 21-antibody panel for single-cell analysis (Table 1). The panel was designed to capture key components of the TME, including markers of dendritic cell (DC) and immune activation (CD11c, CCR7, Granzyme B, CD45RO, HLA-DR, CD25, Perforin, CD69), as well as T cells (CD4, CD8) and natural killer (NK) cells (CD56).
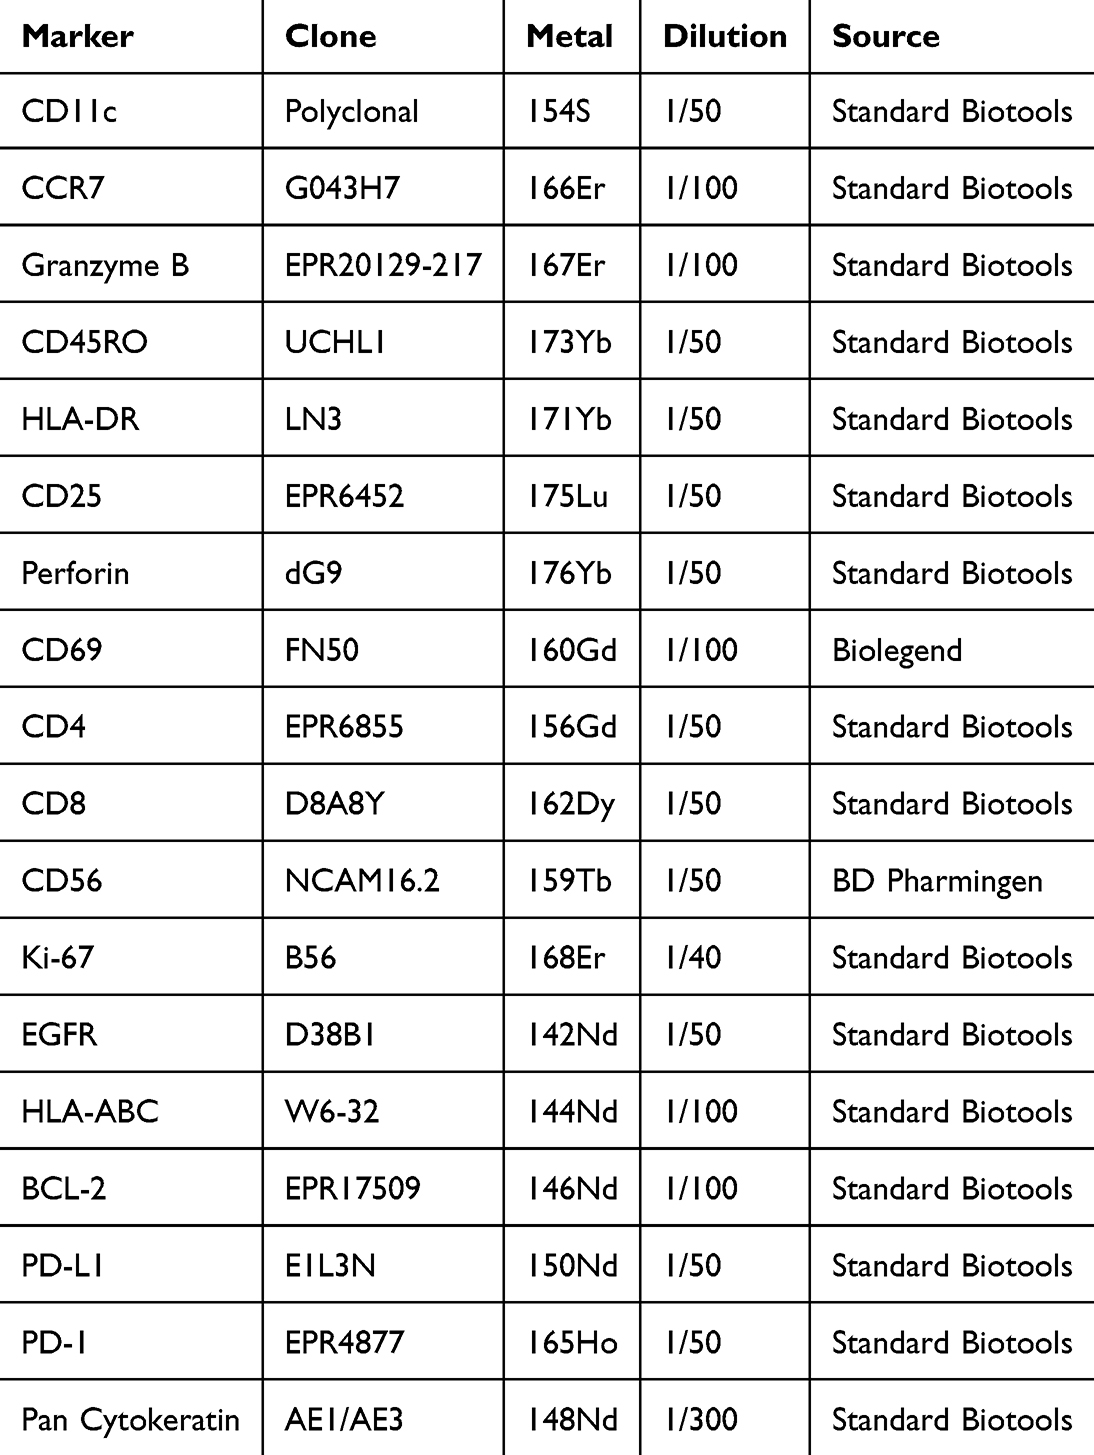 |
Table 1 Metal-Tagged Antibody Panel for Immune Cell Phenotyping and Functional Analysis |
To assess functional states, we also included markers of cell proliferation and differentiation (Ki-67, EGFR), antigen presentation (HLA-ABC), and immune regulation and cell death (PD-L1, PD-1, BCL-2). Tumor cell identification was enabled by pan-cytokeratin (AE1/AE3), a marker of epithelial and carcinoma cells. For accurate cell segmentation, plasma membrane (ICSK1, ICSK2, ICSK3) and nuclear (DNA1, DNA2) markers were incorporated.
Imaging Mass Cytometry
Paraffin sections prepared sequentially to the anti-GR IHC slide (from tumors with the five highest and four lowest weighted H-scores) were handled gently and maintained in sealed containers to avoid contaminating metals. These slides were subsequently analyzed by Hyperion IMC spatial proteomics.13–16
Throughout the IMC staining process, all reagents were prepared in Maxpar water or Maxpar PBS (Standard Biotools, Boulder, CO) to minimize contaminating metals. Following deparaffinization and run to Maxpar water, target antigenic epitopes were retrieved by heating slides in pH 9.0 10mM Tris/1mM EDTA (T6066, E5134, Molecular Biology Grade salts, Sigma-Aldrich, St Louis, MO) for 30-minutes at 95°C. Slides were then cooled to room temperature in Maxpar PBS and blocked with 3% bovine serum albumin (BSA, 100–030, Roche, Indianapolis, IN) prepared in Maxpar PBS for 45 min. The slides were then hybridized with the 21-marker panel (Table 1) prepared in 0.5% BSA/Maxpar PBS overnight at 4°C in a humid environment. The next day, the slides were washed with Maxpar PBS and stained with 250 nM iridium DNA intercalator (Cat# 201192A, Lot# 2301042–24, Standard Biotools) in 0.2% Triton X-100 (X100, Sigma Aldrich, St Louis, MO) for 30 min. Slides were then washed in Maxpar water, air-dried and readied for ROI mapping. During mapping, ROIs for IMC within each were chosen for cellularity with avoidance of stroma, and without regard for GR-expression (Figure 1A). The Hyperion mass cytometer (Standard Biotools) was auto-tuned using the slide and protocol provided by Standard Biotools prior to data acquisition. Samples were then acquired via laser ablation at a resolution of 1 µm per pixel on the Hyperion, utilizing CyTOF software version 7.0 (Standard Biotools). The data was exported as an MCD file. For brevity and illustration of downstream analytical workflow, an example ROI (Figure 1A, asterisk) is illustrated at higher magnification with realized masks and plots related to its histology by corresponding H&E section (Figure 1B).
Data Pre-Processing
Following acquisition, raw data was processed using the Steinbock pipeline.17 Briefly, MCD files were converted to TIFF, and a hot pixel filter with a threshold of 50 was applied. Images were then segmented with the Steinbock implementation of DeepCell with minmax normalization.18 The mean intensities of the ICSK1/2/3 and DNA1/2 channels were used for membrane and nuclear segmentation, respectively. The segmentation masks were then used to extract mean object intensities per channel, as well as region properties. These values were used for downstream analysis.
Object intensities were loaded into R (version 4.4.3) as SingleCellExperiment objects using the imcRtools package,17 and further pre-processing was completed using the Bioconductor single cell analysis framework.19 Objects with all mean intensities equal to 0 were removed. Mean intensities were asinh-transformed, then clipped, and normalized to the 99th percentile per channel. Following dimensional reduction by PCA, batch correction was applied using Harmony,20 and Leiden clustering was performed on the Harmony-corrected PCA embeddings (resolution 0.8). Default parameters were used for Harmony batch correction. The impact of batch correction was evaluated both qualitatively, through examination of dimensional reduction plots, and quantitatively, by computing Local Inverse Simpson Index for integration (iLISI) and cell type (cLISI). A batch effect was present in dimensional reduction plots, which was improved after Harmony correction (Supplemental Figure S1, panels A and B). Cell types remained easily separable after correction, indicating sufficient biological variation remained. Harmony correction increased iLISI without a meaningful change of cLISI, indicating improved batch integration without negative effects on biological variation (Supplemental Figure S1, panel C). Uniform Manifold Approximation and Projection (UMAP) were computed from Harmony-corrected PCA embeddings for visualization, using the same principal components as clustering. UMAP was employed for visualization and annotation support only; UMAP provided a two-dimensional embedding to overlay marker intensities and cluster labels and to index single cells for spatial review.
Cluster Annotation and Cell Phenotyping
Automated phenotyping was ambiguous for several clusters due to overlapping signatures or limited lineage markers. Positivity thresholds were set per channel using empirical negatives from opposite compartments. For example, immune cell markers such as CD8, CD4, CD56, and CD11c served as negatives for epithelial markers including pan-cytokeratin (AE1/AE3) and EGFR. These anchors established conservative, compartment-aware cutoffs for marker positivity.
Using spatial maps, single cells were localized back to tissue context, enabling direct correlation with H&E morphology and immunofluorescence (IF) where available. This confirmed epithelial architecture for cancer anchors, immune compartment localization for lymphoid/myeloid phenotypes, and aided in the adjudication of ambiguous clusters near tumor-immune interfaces.
Label assignments were reviewed for biological plausibility and consistency across images. Clusters that could not be resolved by proximity to anchors and multi-marker patterns were labeled as “Other.” One cluster showed overlapping CD11c positive, CD56 positive, HLA-DR positive status with CD69 positivity; because conventional dendritic cell, type 1 (cDC1)-defining markers were not in the panel, this cluster could not be unambiguously separated into NK or DC subsets and was conservatively labeled early-activated DC/NK cells. This conservative assignment did not materially alter downstream analysis.
Differential Abundance Analysis
Differential abundance analysis was conducted using MiloR.21 A k-nearest neighbor graph (k = 120) was calculated from the batch-corrected embeddings; overlapping neighborhoods were generated and pruned using graph refinement.
To account for multiple testing, the spatial false discovery rate (SpatialFDR) was controlled using a weighted version of the Benjamini-Hochberg (BH) method. Neighborhoods with SpatialFDR <0.05 were considered significantly enriched for one class (GR-high versus GR-low). The ability of the trimmed mean of M values (TMM) normalization to overcome class imbalance was assessed by examination of an MA-plot and was determined to be sufficient (Supplemental Figure S2).
Neighborhoods were assigned a cell-type identity when at least 75% of member cells originated from a single Leiden cluster (≥75%); otherwise, they were assigned labeled as “Mixed”.
Cell-Cell Interaction Analyses
Pairwise interaction scoring between the IMC-derived phenotypes was computed with the imcRtools package.17 This approach uses a permutation test on each individual image to test for attraction and repulsion between phenotype pairs. The resulting p-values were corrected for multiple comparisons with the BH procedure, and interactions with adjusted p-values <0.05 were considered significant. Because each image is tested individually, the class imbalance does not influence these results. Results were visualized with interaction heatmaps by GR stratum displaying interaction scores calculated as running tallies per interaction pair (+1 per image with significant attraction, −1 per image with significant repulsion).
Score ranges reflected the number of images analyzed per stratum (GR-high: from –23 to +23; GR-low: –16 to +16).
Results
IMC Reveals 12 Conserved TME Phenotypes in GR-High and GR-Low TNBC
We profiled the TME using batch-corrected Hyperion IMC across 39 ROI from 9 biopsies (5 GR-high, 4 GR-low). Of 259,513 segmented cells, 245,474 passed antibody-detection quality control (GR-high: 164,193 GR-high cells; GR-low 81,281). A fifth GR-low biopsy originally included in the sample was excluded due to processing damage, contributing to the imbalanced cell counts; downstream comparative analyses account for this imbalance. Normalized single-cell marker profiles were visualized with UMAP and clustered using Leiden, revealing 12 reproducible phenotypes present in both GR-high and GR-low tumors (Figure 2A), indicating a conserved cellular repertoire across extremes of GR expression.
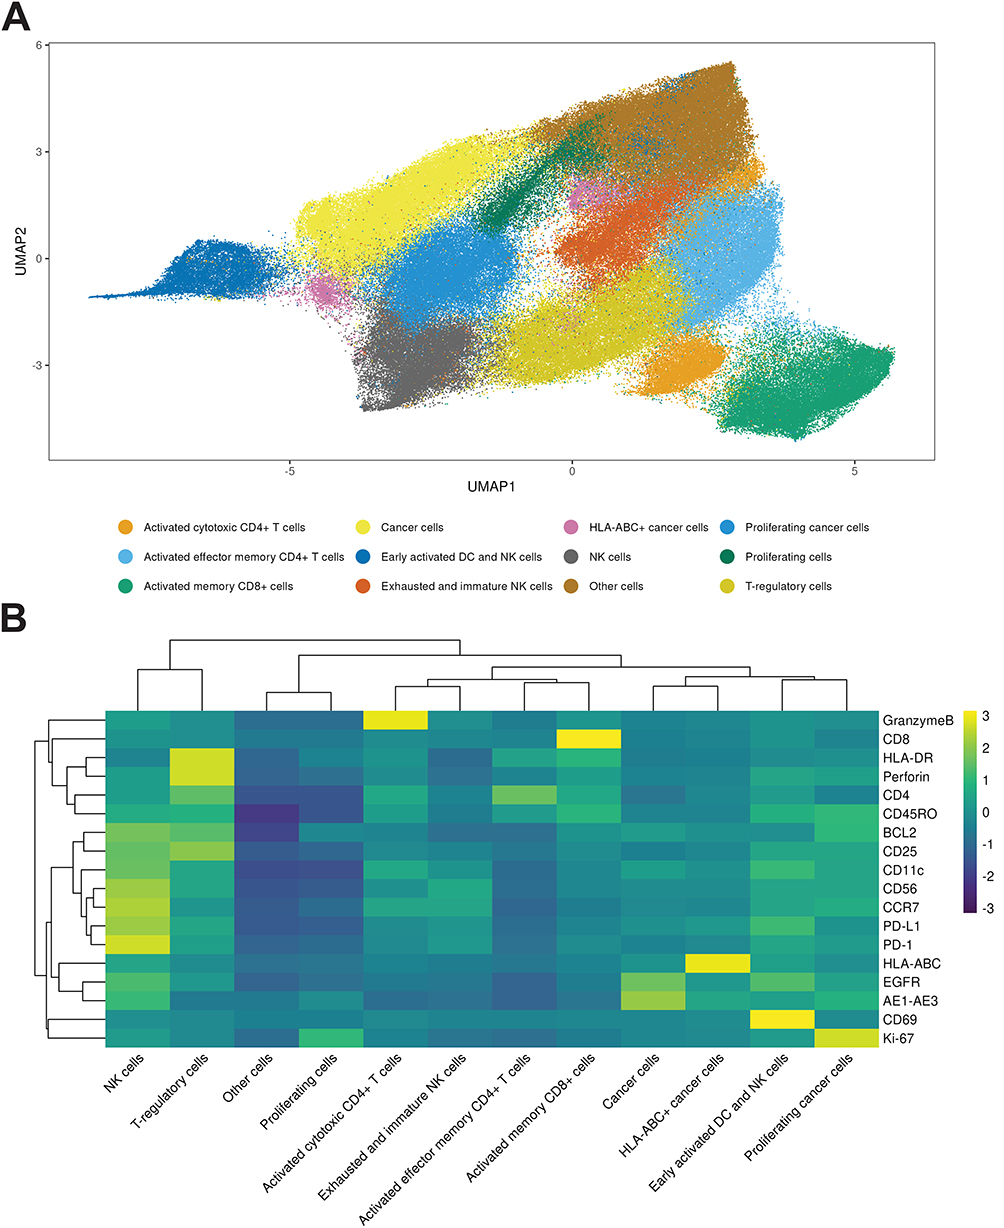 |
Figure 2 UMAP visualization and marker expression heatmap of single-cell populations. (A) UMAP plot of single-cell spatial proteomic data, colored by annotated cell phenotype clusters. (B) Heatmap of standardized z-scored expression across the cell populations defined in panel A, clustered bidirectionally. Color scale: z = −3 (purple) to +3 (yellow). Full marker panel, clustering parameters and annotation criteria are in Supplemental Table S3 and Methods. |
The 12 phenotypes (Supplemental Table S3) included innate immune and lymphoid compartments, including an early-activated DC/NK co-cluster (CD11c+, CD56+, HLA-DR+), typical NK cells (CD56bright, Granzyme B+, Perforin+), and exhausted/immature NK cells (CD56dim, granzyme B-low and perforin-low).
T cell phenotypes included activated cytotoxic CD4+ T cells (CD4+, perforin+, HLA-DR+), activated effector-memory CD4+ T cells (CD45RO+, CD4+, CD25-, granzyme B+, perforin+), activated memory CD8+ T cells (CD45RO+, CD8+, HLA-DR+), and Tregs (CD4+, CD25+).
Three epithelial cancer cell clusters were defined and anchored by high AE1/AE3 positivity: cancer cells (AE1/AE3+), proliferating cancer cells (Ki-67+, AE1/AE3+, EGFR+), and HLA-ABC-positive cancer cells (HLA-ABC+, AE1/AE3+). Two lineage-indeterminate groups were identified: proliferating cells (Ki-67+) and other cells (globally negative across markers).
A heatmap and dendrogram of normalized cluster-level marker means (Figure 2B) recapitulated this structure, separating epithelial and immune compartments and highlighting coherent marker modules. Full marker-to-phenotype definitions and supporting citations are provided in Supplemental Table S3. A Fractional composition plot showing fraction of each cell type per patient is available in Supplemental Figure S3.
Immune Cell-Rich Neighborhoods Predominate in GR-High TNBC
Previous multi-plex IHC results indicated differential enrichment of immune cell subpopulations in GR-high and GR-low TNBC.9 To examine these findings using an orthogonal approach, we conducted differential abundance analysis with Milo.21 Superimposing the UMAP projection (Figure 3A) with Milo cell neighborhoods revealed clear patterns of differential abundance (Figure 3B) and an enrichment of neighborhoods with high numbers of cells from GR-high regions (positive LogFC) in multiple immune cell clusters. Conversely, neighborhoods with high numbers of cells from GR-low regions (negative LogFC) were more enriched in tumor cell clusters.
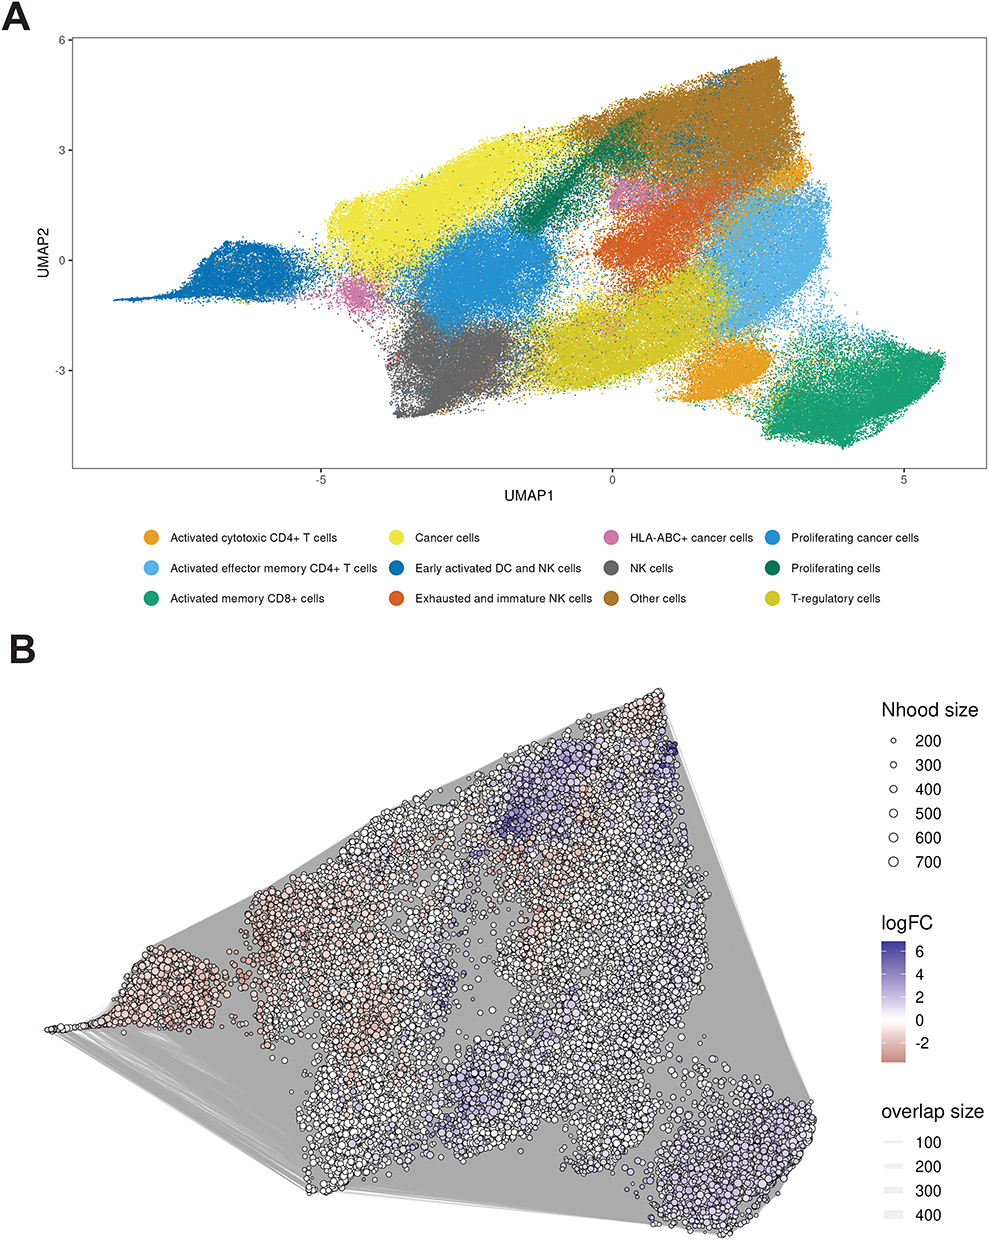 |
Figure 3 UMAP visualization and neighborhood graph of single-cell data colored by cell type and log fold change. (A) UMAP embedding of single cells colored by annotated cell types, including various immune and cancer cell populations. (B) Neighborhood graph representation of cells with nodes sized by neighborhood size and edges weighted by overlap size. Node color gradient represents log fold change (LogFC), with blue indicating positive (enriched in GR-high) and red indicating negative (enriched in GR-low) values. |
GR-high TME contained more immune-inflamed niches relative to GR-low TME. By contrast, GR-low TMEs were predominated by early-activated DC/NK neighborhoods and TNBC cell-related neighborhoods.
GR-Low Tumors Enrich for Immune Cell Neighborhoods, GR-High for Regulatory and Proliferative Niches
To test for enrichment of immune cell phenotypes abundance based on tumor cell GR status, we next assigned each neighborhood to an immune cell phenotype. We assigned a neighborhood to a cell type only if 75% or more of its member cells belonged to one cell type; otherwise, we labeled the neighborhood “Mixed.” This process provided labels for 13,369 (71%) neighborhoods, leaving 5,491 neighborhoods labeled “Mixed.”
Having identified the cell neighborhoods, we next sought to determine which, if any, of the distinct phenotypes were enriched in GR-high versus GR-low tumors. After correction for multiple comparisons (Spatial FDR < 0.05), 6,078 neighborhoods (32.2%) were significantly enriched in either GR-high or GR-low tumor nests (Figure 4).
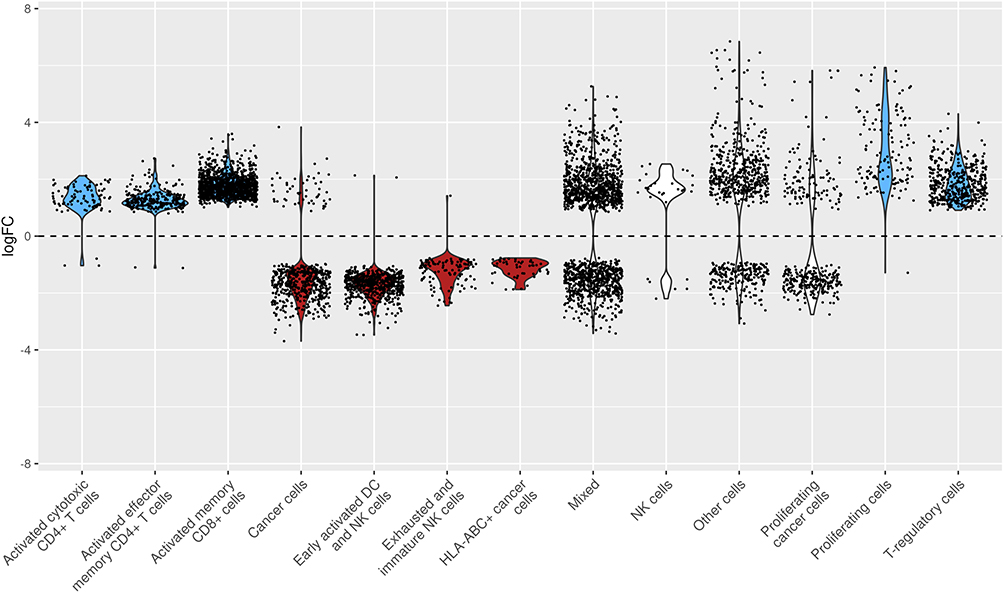 |
Figure 4 Violin plot of log fold change (logFC) distribution across cell types. Each violin plot shows the distribution of logFC values for different annotated cell types. Black dots represent individual data points, and the dashed horizontal line at zero indicated no fold change. This plot highlights the variability and central tendency of logFC within each cell type. Blue corresponds to significant differential abundance in GR-high. Red corresponds to significant abundance in GR-low. |
GR-low tumor nests normalized for total cell count contained significantly higher frequencies of non-proliferating cancer cells (mean logFC ± SD: 1.40 ± 1.11), early-activated DC/NK cells (1.72 ± 0.44), exhausted/immature NK cells (1.23 ± 0.49), and HLA-ABC-positive (HLA-ABC+) cancer cells (1.15 ± 0.3) (Figure 4).
Conversely, GR-high tumor nests were enriched for activated cytotoxic CD4+ T cells (1.32 ± 0.54), activated effector memory CD4+ T cells (1.28 ± 0.36), activated memory CD8+ cells (1.77 ± 0.37), proliferating cells (3.01 ± 1.27), and Treg lymphocytes (1.85 ± 0.59).
The “Mixed” cell phenotype, typical NK cells, “Other” cells, and proliferating cancer cell neighborhoods centered around log FC = 0, were not relatively enriched in either GR-low or GR-high tumors (Figure 4).
GR-High Tumors Exhibit Spatial Coupling of Tregs and Proliferating Cancer Cells
Building on prior evidence, corroborated here with IMC, that GR-high TNBC is associated with increased Treg infiltration,9 we next asked whether Treg spatial localization differs between GR-high and GR-low tumors. We hypothesized that Tregs would preferentially colocalize with GR-high tumor cells, supporting an immunosuppressive function of tumor cell GR activation. To test this, we conducted cell-cell interaction analyses to identify distinct interaction patterns between GR-strata.
In GR-high tumors (Figure 5A), Tregs more frequently colocalized with proliferating cancer cells, indicating higher Treg-proliferating tumor interface interactions relative to GR-low tumors (Figure 5B). GR-high tumors also exhibited less frequent, or more repulsive, interactions between NK cells and proliferating cancer cells, as well as fewer NK-cancer cell interactions compared with GR-low tumors.
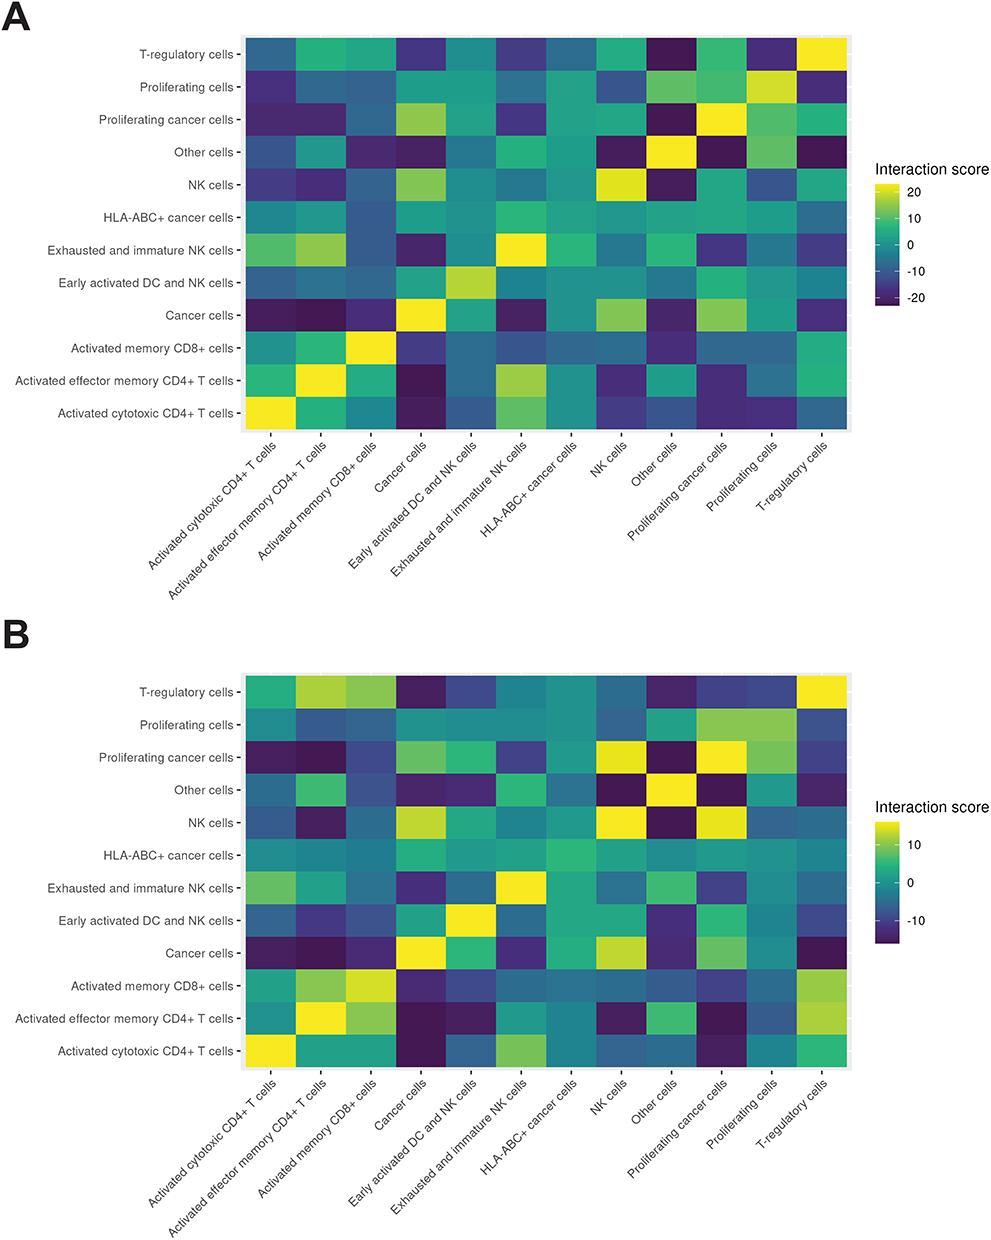 |
Figure 5 Cell-cell interaction heatmaps among annotated cell populations. (A) GR-high tumors: Heatmap of inferred interactions scores between annotated cell populations (rows and columns as in Figure 2). Color indicates interaction score from –23 to +23 (purple to yellow). (B) GR-low tumors with interaction score from –16 to +16 using the same color convention. |
In contrast to GR-high tumors, GR-low tumors showed preferential colocalization of Tregs with activated memory CD8+ T cells (Figure 5B). Tregs in GR-low tumors also exhibited more frequent colocalization with activated cytotoxic CD4+ T cells relative to GR-high tumors (Figure 5B). Collectively, these findings demonstrate that GR-high and GR-low TNBC tumor nests exhibit distinct spatial architectures, with GR-high tumors characterized by preferential Treg-proliferating cancer cell association and relatively reduced engagement with cytotoxic lymphocytes.
Discussion
In this study, immune cell enrichment and spatial organization analyses revealed that GR-high expressing TNBC is associated with an immunosuppressed TME. These findings are consistent with a model in which high GR expression in TNBC cells is associated with altered antitumor immune activity. Prior studies have linked GR expression in TNBC with poor prognosis,8 and spatially organized immune niches have also been associated with clinical outcomes in TNBC.3 Within this context, we hypothesize that tumor cell GR expression and activity may modulate the TME by regulating cancer cell surface proteins and secreted cytokine profiles. These findings extend prior work demonstrating that oncogenic transcription factors traditionally viewed as cell-autonomous drivers of tumor growth, such as MYC, can also remodel the tumor immune microenvironment to promote immune evasion.22 Our data suggest that GR may represent a similar cancer cell-intrinsic transcriptional program linking stress signaling to immune suppression.
GR-high TNBC exhibited features consistent with reduced immune activation. These included increased numbers of Tregs, which were preferentially localized to proliferating tumor cell regions (Figure 5), suggesting localized immunosuppression at sites of active tumor growth.4,9 We also observed that GR-high tumor nests had fewer HLA-ABC+ cancer cells, consistent with findings in pancreatic cancer where high GR expression was associated with repression of tumor cell HLA expression.6 Notably, GR-high TNBCs also showed enrichment of memory CD8+ T cells within tumor nests, a population previously associated with immunosuppressive TMEs.23
Given these observations, future studies using immunocompetent syngeneic mice comparing GR-high and GR-low TNBC models will be critical to elucidate the mechanistic basis of GR-mediated tumor cell immune suppression.
In contrast to GR-high TNBC, we found that GR-low TNBC (Figure 4) demonstrated relatively increased abundance of early-activated DC and NK cell neighborhoods, as well as exhausted or immature NK cell neighborhoods. This pattern may indicate active DC-NK cell crosstalk,24 a configuration previously shown to enhance DC recruitment and promote CD8+ T cell activation.25 GR-low tumors had a greater proportion of HLA-ABC+ cancer cells and contained more non-proliferating tumor cell neighborhoods, features suggestive of effective tumor cell antigen presentation.26
This study is limited by a small sample size and the constraints of our IMC antibody panel, which did not allow for full resolution of all lymphoid and myeloid subsets. Importantly, a recent integrative analysis of multiple breast cancer datasets reported that higher GR expression in immune cells is associated with a better prognosis in TNBC27 As our analysis focused on tumor-cell GR and does not assess GR expression in immune or stromal compartments, these findings highlight likely cell-type-specific and context-dependent functions for GR signaling. Despite these limitations, our spatial analysis offers new insights into how TNBC-cell intrinsic GR signaling may shape an immunosuppressive TME, providing biological context that may inform hypothesis-generating exploration of GR-targeted strategies in TNBC. These findings support a conceptual framework linking GR-high TNBC cell stress hormone signaling to immune evasion, which may contribute to the relatively poor prognosis observed in early-stage GR-high TNBC.
Conclusion
Spatially resolved profiling of GR-high versus GR-low TNBC TMEs revealed divergent immune ecologies: we observed GR-high TNBC TMEs to have features consistent with localized immunosuppression, whereas GR-low TNBC displayed immune cell patterns consistent with both increased innate immune activation and more effective tumor cell HLA-ABC-mediated antigen presentation. Integration of cellular abundance with spatial organization analyses highlighted GR-associated immune architecture and provides a framework for interrogating mechanisms affecting immune regulation and function in GR-positive TNBC. Extension of these observations to expanded patient cohorts and complimentary experimental systems will further refine the relevance and mechanistic implications of these GR-associated immune phenotypes.
Abbreviations
DA, differential abundance; DC, dendritic cells; GR, glucocorticoid receptor; H&E, hematoxylin and eosin; IHC, immunohistochemistry; IMC, imaging mass cytometry; IRB, institutional review board; NK, natural killer cells; ROI, regions of interest; TME, tumor microenvironment; TNBC, triple-negative breast cancer; Tregs; regulatory T cells; UMAP: Uniform Manifold Approximation and Projection.
Data Sharing Statement
The data analyzed in this study is publicly available on Zenodo (DOI: 10.5281/zenodo.17058670). The environment and code used to perform this analysis are publicly available at https://git.biohpc.swmed.edu/s133712/behar_tnbc_imc. Other data generated in this study are available with the article and its supplementary files.
Acknowledgments
We are grateful to the University Flow and Mass Cytometry Facility at the University of Texas Southwestern Medical Center, as well as Angela Mobley, John M. Shelton, and Juan A. Daniel, for their expert assistance with Hyperion mass cytometry, including experimental setup and data acquisition. We thank the Comprehensive Cancer Center Human Tissue Core at the University of Chicago for processing the patient samples used in this study. We also appreciate Anna Biernacka from the Department of Pathology at The University of Chicago for kindly sharing the relevant H&E slides and tumor GR status assessments from a prior study. Our sincere thanks go to Mengxi Yu, Andrew R. Jamieson, and Douglas W. Strand for their insightful discussion during the development of our methodology.
We extend our gratitude to Poornima Saha, whose original patient cohort formed the foundation of this study.
This research was supported in part by the computational resources provided by the BioHPC supercomputing facility at the Lyda Hill Department of Bioinformatics, University of Texas Southwestern Medical Center.
Author Contributions
All authors made a significant contribution to the work reported, whether that is in the conception, study design, execution, acquisition of data, analysis and interpretation, or in all these areas; took part in drafting, revising or critically reviewing the article; gave final approval of the version to be published; have agreed on the journal to which the article has been submitted; and agree to be accountable for all aspects of the work.
Funding
This research was funded by The University of Chicago Comprehensive Cancer Center (NIH Grant P30CA014599) to support the Human Tissue Core and Biostatistics Core (RN and SDC). This research was also funded by a Cancer Prevention and Research Institute of Texas Scholar Award to SDC (CPRIT Grant ID RR190037).
Disclosure
Rita Nanda has served on advisory boards for AstraZeneca, BeyondSpring, Daiichi Sankyo, Exact Sciences, Fujifilm, GE, Gilead, Guardant Health, Infinity, iTeos, Merck, Moderna, Novartis, OBI, Oncosec, Pfizer, Sanofi, Seagen, Stemline, and she has research funding from Arvinas, AstraZeneca, BMS, Corcept Therapeutics, Genentech/Roche, Gilead, GSK, Merck, Novartis, OBI Pharma, OncoSec, Pfizer, Relay, Seattle Genetics, Sun Pharma, Taiho. Suzanne D. Conzen is a co-inventor of patents issued to The University of Chicago for methods and compositions related to GR antagonism in breast cancer and has served on a scientific advisory board for Corcept Therapeutics. She also reports personal fees from Corcept Therapeutics, outside of the submitted work. The authors report no other conflicts of interest in this work.
References
1. Bianchini G, Balko JM, Mayer IA, Sanders ME, Gianni L. Triple-negative breast cancer: challenges and opportunities of a heterogeneous disease. Nat Rev Clin Oncol. 2016, May 17;13(11):674–14. doi:10.1038/nrclinonc.2016.66
2. Schmid P, Cortes J, Pusztai L, McArthur, H, Kümmel, S, Bergh, J et al. Pembrolizumab for early triple-negative breast cancer. New Engl J Med. 2020, Feb 26;382(9):810–821. doi:10.1056/NEJMoa1910549
3. Keren L, Bosse M, Marquez D, Angoshtari, R, Jain, S, Varma, S et al. A structured tumor-immune microenvironment in triple negative breast cancer revealed by multiplexed ion beam imaging. Cell. 2018, Sep 6;174(6):1373–87.e19. doi:10.1016/j.cell.2018.08.039
4. Jackson HW, Fischer JR, Zanotelli VRT, Ali, HR, Mechera, R, Soysal, SD et al. The single-cell pathology landscape of breast cancer. Nature. 2020, Feb;578(7796):615–620. doi:10.1038/s41586-019-1876-x
5. Acharya N, Madi A, Zhang H, Klapholz, M, Escobar, G, Dulberg, S et al. Endogenous glucocorticoid signaling regulates CD8+ T cell differentiation and development of dysfunction in the tumor microenvironment. Immunity. 2020, Sep 15;53(3):658–71.e6. doi:10.1016/j.immuni.2020.08.005
6. Deng Y, Xia X, Zhao Y, Zhao, Z, Martinez, C, Yin, W et al, et al. Glucocorticoid receptor regulates PD-L1 and MHC-I in pancreatic cancer cells to promote immune evasion and immunotherapy resistance. Nat Commun. 2021, Dec 6;12(1):7041. doi:10.1038/s41467-021-27349-7
7. Skor MN, Wonder, EL, Kocherginsky, M, Goyal, A, Hall, BA, Cai, Y et al. Glucocorticoid receptor antagonism as a novel therapy for triple-negative breast cancer. Cancer Res. 2013, Nov 15;73(24):7020–7032. doi:10.1158/0008-5472.CAN-13-1290
8. Pan D, Kocherginsky M, Conzen SD. Activation of the glucocorticoid receptor is associated with poor prognosis in estrogen receptor-negative breast cancer. Cancer Res. 2011, Aug 25;71(20):6360–6370. doi:10.1158/0008-5472.CAN-11-0362
9. Matossian MD, Shiang C, Dolcen DN, Dreyer, Marie, Hatogai, Ken, Hall, Katie et al. High tumor glucocorticoid receptor expression in early-stage, triple-negative breast cancer is associated with increased T-regulatory cell infiltration. Breast Cancer Res Treat. 2024, Nov 23;209(3):563–572. doi:10.1007/s10549-024-07515-3
10. Swatler J, Ju YJ, Anderson AC, Lugli E. Tumors recycle glucocorticoids to drive Treg-mediated immunosuppression. J Clin Invest. 2023, Sep 15;133(18):e173141. doi:10.1172/JCI173141
11. Geisen C, Wang HAO, Schapiro D, Zivanovic N, Jacobs A, Hattendorf B et al. Highly multiplexed imaging of tumor tissues with subcellular resolution by mass cytometry. Nature Methods. 2014, Mar 02;11(4):417–422. doi:10.1038/nmeth.2869
12. Cain DW, Cidlowski JA. Immune regulation by glucocorticoids. Nat Rev Immunol. 2017, Apr 17;17(4):233–247. doi:10.1038/nri.2017.1
13. Janesick A, Shelansky R, Gottscho AD, Wagner, F, Williams, SR, Rouault, M et al. High-resolution mapping of the tumor microenvironment using integrated single-cell, spatial and in situ analysis. Nat Commun. 2023, Dec 19;14(1):8353. doi:10.1038/s41467-023-43458-x
14. Le Rochais M, Hemon P, Pers JO, Uguen A. Application of high-throughput imaging mass cytometry Hyperion in cancer research. Front Immunol. 2022, Mar 31;13:859414. doi:10.3389/fimmu.2022.859414
15. Bandura DR, Baranov VI, Ornatsky OI, Antonov, A, Kinach, R, Lou, X et al. Mass cytometry: technique for real time single cell multitarget immunoassay based on inductively coupled plasma time-of-flight mass spectrometry. Anal Chem. 2009, Aug 15;81(16):6813–6822. doi:10.1021/ac901049w
16. Chang Q, Ornatsky OI, Siddiqui I, Loboda A, Baranov VI, Hedley DW. Imaging mass cytometry. Cytometry Part A. 2017, Feb 03;91(2):160–169. doi:10.1002/cyto.a.23053
17. Windhager J, Zanotelli VRT, Schulz D, Meyer, L, Daniel, M, Bodenmiller, B et al, et al. An end-to-end workflow for multiplexed image processing and analysis. Nature Protocols. 2023, Nov 18;18(11):3565–3613. doi:10.1038/s41596-023-00881-0
18. Greenwald NF, Miller G, Moen E, Kong, A, Kagel, A, Dougherty, T et al. Whole-cell segmentation of tissue images with human-level performance using large-scale data annotation and deep learning. Nature Biotechnol. 2022, Nov 18;40(4):555–565. doi:10.1038/s41587-021-01094-0
19. McCarthy DJ, Campbell KR, Lun ATL, Willis QF. Scater: pre-processing, quality control, normalisation and visualisation of single-cell RNA-seq data in R. Bioinformatics. 2017, Apr 15;33(8):1179–1186. doi:10.1093/bioinformatics/btw777
20. Korsunsky I, Millard N, Fan J, Slowikowski, K, Zhang, F, Wei, K et al, et al. Fast, sensitive and accurate integration of single-cell data with Harmony. Nature Methods. 2019, Nov 18;16(12):1289–1296. doi:10.1038/s41592-019-0619-0
21. Dann E, Henderson NC, Teichmann SA, Morgan MD, Marioni JC. Differential abundance testing on single-cell data using k-nearest neighbor graphs. Nature Biotechnol. 2021, Sep 30;40(2):245–253. doi:10.1038/s41587-021-01033-z
22. Lee JV, Housley F, Yau C, Nakagwa, R, Winkler, J, Anttila, JM et al, et al. Combinatorial immunotherapies overcome MYC-driven immune evasion in triple negative breast cancer. Nat Commun. 2022, Jun 27;13(1):3671. doi:10.1038/s41467-022-31238-y
23. Machicote A, Belén S, Baz P, Billordo LA, Fainboim L. Human CD8+HLA-DR+ regulatory T cells, similarly to classical CD4+Foxp3+ cells, suppress immune responses via PD-1/PD-L1 axis. Front Immunol. 2018, Nov 28;9. doi:10.3389/fimmu.2018.02788
24. Barry KC, Hsu J, Broz ML, Cueto FJ, Binnewies M, Combes AJ et al. A natural killer-dendritic cell axis defines checkpoint-therapy-responsive tumor microenvironments. Cell. 2018, Aug 24;173(6):1273–1289 doi:doi: 10.1038/s41591-018-0085-8.
25. Bottcher JP, Bonavita E, Chakravarty P, Blees H, Cabeza-Cabrerizo M, Sammicheli S et al. NK cells stimulate recruitment of cDC1 into the tumor microenvironment via XCL1 and CCL5. Nature. 2018, Feb 22;562(7725):245–249. doi:10.1038/s41586-018-0575-3
26. McGranahan N, Rosenthal R, Hiley CT, Rowan AJ, Watkins TBK, Wilson GA et al. Allele-specific HLA loss and immune escape in lung cancer evolution. Cell. 2017, Nov 30;171(6):1259–1271.e11. doi:10.1016/j.cell.2017.10.001
27. Snijesh VP, Nimbalkar VP, Patil S, Rajarajan, S, Anupama, CE, Mahalakshmi, S et al, et al. Differential role of glucocorticoid receptor based on its cell type specific expression on tumor cells and infiltrating lymphocytes. Transl Oncol. 2024, Apr 20;45:101957. doi:10.1016/j.tranon.2024.101957
 © 2026 The Author(s). This work is published and licensed by Dove Medical Press Limited. The
full terms of this license are available at https://www.dovepress.com/terms
and incorporate the Creative Commons Attribution
- Non Commercial (unported, 4.0) License.
By accessing the work you hereby accept the Terms. Non-commercial uses of the work are permitted
without any further permission from Dove Medical Press Limited, provided the work is properly
attributed. For permission for commercial use of this work, please see paragraphs 4.2 and 5 of our Terms.
© 2026 The Author(s). This work is published and licensed by Dove Medical Press Limited. The
full terms of this license are available at https://www.dovepress.com/terms
and incorporate the Creative Commons Attribution
- Non Commercial (unported, 4.0) License.
By accessing the work you hereby accept the Terms. Non-commercial uses of the work are permitted
without any further permission from Dove Medical Press Limited, provided the work is properly
attributed. For permission for commercial use of this work, please see paragraphs 4.2 and 5 of our Terms.