Back to Journals » International Journal of General Medicine » Volume 18
Single Cell and Transcriptomic Analysis of Regulatory Mechanisms of Key Genes in Systemic Lupus Erythematosus
Authors Zhou Y ![]() , Wu Y, Yang B, Zhu Q, Long H, Yuan L, Cao W, Deng D
, Wu Y, Yang B, Zhu Q, Long H, Yuan L, Cao W, Deng D
Received 16 February 2025
Accepted for publication 1 June 2025
Published 15 June 2025 Volume 2025:18 Pages 3193—3206
DOI https://doi.org/10.2147/IJGM.S522871
Checked for plagiarism Yes
Review by Single anonymous peer review
Peer reviewer comments 2
Editor who approved publication: Dr Woon-Man Kung
Yali Zhou,* Yongzhuo Wu,* Binbin Yang,* Qinghuan Zhu, Haojun Long, Limei Yuan, Wenting Cao, Danqi Deng
Department of Dermatology, The Second Affiliated Hospital of Kunming Medical University, Kunming, People’s Republic of China
*These authors contributed equally to this work
Correspondence: Danqi Deng, Email [email protected]
Background: Abnormal cell-mediated immunoregulation plays a central role in the pathogenesis of systemic lupus erythematosus (SLE). Identifying distinct cellular subtypes and key genes is critical for understanding disease mechanisms.
Methods: Peripheral blood scRNA-seq was performed on six SLE patients and six controls. The GSE82221 transcriptomic dataset was integrated with scRNA-seq data for a comprehensive analysis. Differentially expressed genes (bulk DEGs) and different immune cells (DICs) were identified from bulk RNA-seq analysis using differential expression and single-sample gene set enrichment analysis (ssGSEA). Key cell populations that showed similar differential patterns to DICs were identified from scRNA-seq data, and a second set of DEGs (single-cell DEGs) was obtained. Key genes were defined as the intersection of bulk and single-cell DEGs with an area under the ROC curve (AUC) > 0.7. Functional enrichment, single-cell expression analysis, methylation analysis, and protein-protein interaction (PPI) network construction were performed on the key genes.
Results: From GSE82221, 2041 bulk DEGs and 14 DICs were identified. Memory B cells exhibited consistent differences between SLE and controls in both datasets. Nineteen single-cell DEGs were identified in memory B cells, with six key genes (MX1, IFI44L, ISG15, OAS1, IFI6, IFI27) showing AUC > 0.7. PPI analysis revealed their involvement in antiviral responses. Functional enrichment highlighted pathways such as Epstein–Barr virus infection and NK cell-mediated cytotoxicity. Methylation analysis showed distinct gene regulation patterns, and pseudotime analysis demonstrated dynamic expression of IFI44L and MX1 during B cell differentiation.
Conclusion: This study integrated single-cell and bulk transcriptomic data to identify six key genes (MX1, IFI44L, ISG15, OAS1, IFI6, and IFI27) involved in SLE pathogenesis and highlighted the central role of memory B cells. Our findings offer new insights into SLE mechanisms and provide a theoretical basis for developing targeted therapeutic strategies.
Keywords: systemic lupus erythematosus, immune cell, key gene, single-cell analysis
Introduction
Systemic lupus erythematosus (SLE) is a chronic autoimmune disease primarily caused by immune system dysfunction, leading to damage in multiple organs such as the skin, kidneys, joints, nervous system, and cardiovascular system.1 The global incidence and prevalence of SLE are steadily increasing, with incidence rates ranging from 1.4 to 15.13 per 100,000 individuals and an annual addition of approximately 400,000 new cases. The prevalence ranges from 15.87 to 108.92 per 100,000 individuals, posing a serious threat to human health.2 SLE is characterized by heterogeneous clinical manifestations and complex molecular mechanisms, with abnormal immune regulation at the cellular level playing a central role in its pathogenesis.3 Among immune cells, B cells are particularly crucial in driving disease development. Dysregulated B cell function contributes to SLE through mechanisms such as the production of autoantibodies, excessive secretion of inflammatory cytokines, and antigen presentation, all of which promote chronic inflammation and tissue damage.4 Despite the availability of various treatment options, such as immunosuppressants, antimalarials, and biologics, the cure rate for SLE remains low, and treatment outcomes vary among individuals.5 Thus, the identification of effective biomarkers is essential for early diagnosis and the prediction of treatment efficacy.
In recent years, bioinformatics has emerged as a powerful approach for analyzing large-scale biological data to uncover disease-related mechanisms and identify key molecular drivers. By leveraging transcriptomic, genomic, and proteomic datasets, bioinformatics enables systematic screening for disease-associated biomarkers and therapeutic targets. Additionally, single-cell RNA sequencing (scRNA-seq) has revolutionized our ability to profile cellular heterogeneity, revealing previously unrecognized immune cell subpopulations and gene expression patterns at single-cell resolution. Numerous studies have applied these methods to investigate immune mechanisms in SLE. However, despite these advances, a comprehensive screening of key genes associated with B cell dysfunction in SLE remains limited.
Therefore, our study integrates single-cell transcriptomics with conventional bulk transcriptomic data to enable high-resolution mapping of immune cell alterations in SLE. This integrative approach allows us to identify key pathogenic genes more robustly, particularly those associated with dysfunctional B cells, thus advancing our understanding of SLE pathogenesis and providing a theoretical foundation for novel therapeutic strategies.
Materials and Methods
Data Sources
This study was approved by the Ethics Committee of the Second Affiliated Hospital of Kunming Medical University, and written informed consent was obtained from all participants. A total of 6 SLE patients and 6 age- and sex-matched healthy controls were recruited. Peripheral blood (8 mL) was collected from each participant, and peripheral blood mononuclear cells (PBMCs) were isolated for single-cell transcriptomic sequencing analysis. The GSE82221 dataset was sourced from Gene Expression Omnibus (GEO) database (https://www.ncbi.nlm.nih.gov/geo/), which included transcriptome data (GPL10558) and methylation data (GPL13534) of peripheral blood from 25 control (CTL) samples and 30 systemic lupus erythematosus (SLE) samples.
Differential Gene and Immune Cell Analysis
Differentially expressed genes (bulk DEGs) between the SLE and CTL groups were identified in the GSE82221 dataset using the limma package,6 with thresholds set at P<0.05 and |log2FC|>1. The results were visualized using volcano and heat maps generated by the ggplot2 (v 3.3.2)7 and heatmap (v 4.1.0)8 packages, respectively, to display DEG distributions. Additionally, to investigate immune function differences between the SLE and CTL groups, differential immune cells (DICs) were identified using single-sample gene set enrichment analysis (ssGSEA) within the GSVA package (v 1.70–3),9 based on 28 immune cell gene sets.6
Single-Cell Sequencing Data Analysis
Single-cell data were filtered using the R package Seurat (v 4.0.6)10 by excluding cells with ≥5% mitochondrial gene expression, low-quality cells (fewer than 200 or more than 6000 genes), and genes detected in 3 or fewer cells. The remaining cells were integrated using the Harmony method, followed by gene variance analysis on batch-effect-corrected cells. A set of 1500 highly variable genes was selected for subsequent analysis. Principal component analysis (PCA) was then performed (p < 0.05), and sample clustering was conducted using the UMAP algorithm based on the principal components (PCs). Cluster annotations were performed using Azimuth (https://github.com/satijalab/azimuth),11 with annotation scores ranging from 0 to 5 (0–2: low annotation confidence; 2–3.75: possible annotation issues; 3.75–5: high annotation confidence). Finally, the cell proportion differences between the SLE and CTL groups (cell type count/total cell count per patient) were calculated and analyzed. Cells exhibiting the same differential trends as those observed in the CTLs from section 2.2 were defined as key cells.
Key Gene Selection and Gene Set Enrichment Analysis (GSEA)
Differentially expressed genes (single-cell DEGs) in key cells were identified using the FindMarkers function in Seurat (SLE vs CTL), with criteria of p < 0.05 and |log2FC| > 0.5 (v 4.0.6).10 The bulk DEGs and single-cell DEGs were taken to intersect to get candidate genes, in which the genes with area under curve (AUC) values of receiver operating characteristic (ROC) curves greater than 0.7 were designated as key genes. In order to explore whether there were interactions between key genes, protein-protein interaction (PPI) network was constructed for them using GeneMANIA website (http://genemania.org/). The role played by key genes in SLE was explored by GSEA, where the expression of all genes in the single-cell dataset with key genes was first calculated and ranked, and then enriched using the clusterProfiler package (P value < 0.05) (v 6.1.0).12 Additionally, methylation analysis of key genes was performed in the GSE82218 dataset using the ChAMP package (v 2.80).13
Construction of Regulatory Networks
The transcription factors (TFs) targeting key genes were predicted using NetworkAnalyst database (https://www.networkanalyst.ca/). In addition, the miRWalk (http://mirwalk.umm.uni-heidelberg.de/) and starBase (https://ngdc.cncb.ac.cn/databasecommons/database/id/169) databases were used to predict miRNAs targeting key genes. The miRNAs that were predicted in both databases were used as the co-rmiRNAs in this study. Next, starBase (clipExpNum > 0) and miRNet (https://www.mirnet.ca/) databases were utilized to predict target co-lncRNAs targeting the co-miRNAs. Finally, the key gene-TF and lncRNA-miRNA-mRNA network were constructed by Cytoscape (v 3.8.2).14
Analysis of Single Cell Expression Level
To explore the expression differences of key genes between different B cell subpopulations as well as between SLE and CTL, differential analyses were performed using kruskal.test. At the same time, monocle (v 2.22.0)15 was used for analyzing the cell differentiation trajectory of differentially expressed cells. Finally, the cellular time-series analysis was combined with the expression of key genes and presented.
Statistical Analysis
Differences were analyzed via the Wilcox. Test and kruskal.test between two groups. P value < 0.05 was considered statistically significant.
Results
Identification of Bulk DEGs and DICs
A total of 2041 bulk DEGs were identified between the SLE and CTL groups, including 847 up-regulated genes and 1194 down-regulated genes (Figure 1A and B). Meanwhile, the results of ssGSEA algorithm showed that the scores of 14 immune cells such as activated CD4 T cell, CD56 dim natural killer cell, central memory CD8 T cell, effector memory CD4 T cell and memory B cell were significantly different between the SLE and CTL groups (Figure 1C).
 |
Figure 1 Identification of differentially expressed genes and immune cells between SLE and normal groups. (A) Heatmap of gene expression density illustrating the expression levels of 2041 differentially expressed genes (DEGs) between the SLE and control groups. (B) Volcano plot depicting the distribution of DEGs between the SLE and control groups. (C) Violin plot showing the significant differences in 14 immune cell types between the SLE and control groups, as calculated using the ssGSEA algorithm(ns: not significant, *p < 0.05, **p < 0.01, ***p < 0.001, ****p < 0.0001). |
Identification of Key Cell Clusters at the Single-Cell Level
To further analyze key cell clusters at the single-cell level, single-cell analysis was performed after cell filtering (Figure S1A). A total of 1500 highly variable genes were identified (Figure S1B). PCA plots revealed that single cell samples in SLE and CTL groups were dispersed, indicating that there was no significant batch effect of sequencing results (Figure S1C). Subsequently, 35 principal components (p < 0.05) were selected for further analysis (Figure S1D–E). Clustering results revealed 24 cell clusters (Figure 2A and S1F), annotated into 30 different cell types, such as CD4 TCM cells, CD8 TEM cells, and NK cells (Figure 2B). Analysis of the cellular proportion differences between subpopulations showed significant differences in ASDC cells, memory B cells, and CD8. Proliferating cells (Figure 2C). The trend of memory B cell differences was consistent with the differential immune cells at the transcriptional level, being higher in the CTL group and lower in the SLE group (Figure 2D). Therefore, memory B cells were selected as the key cell type for further analysis.
 |
Figure 2 Clustering and Cellular Proportions in SLE and Control Groups. (A) UMAP plot displaying the clustering results of single-cell samples from the SLE and control groups, with cells classified into 24 clusters. (B) UMAP plot annotated with 30 distinct cell types. (C) Stacked bar plot showing the proportions of different immune cell subsets in each sample from the SLE and control groups. (D) Comparison of the proportions of different immune cell subsets between the SLE and control groups. (ns: not significant; *p < 0.05; **p < 0.01). |
Key Genes Involved in Virus-Related Pathways
In memory B cells, 19 differentially expressed genes (single-cell DEGs) were identified between SLE and CTL groups. The top four single-cell DEGs included IFI44L, IGHV5-51, IFI27, and MX1 (Figure 3). Six candidate genes (MX1, IFI44L, ISG15, OAS1, IFI6, and IFI27) were selected by intersecting bulk DEGs and single-cell DEGs (Figure 4A). ROC analysis revealed that these genes had diagnostic value for SLE (AUC > 0.7) (Figure 4B). Thus, they were defined as key genes for this study. PPI network analysis showed that the key genes are involved in regulating antiviral responses. For example, the OAS1 gene co-expressed with OAS2, participating in pathways such as antiviral response regulation, negative regulation of viral processes, and viral genome replication (Figure 4C). Additionally, methylation analysis indicated that IFI27, IFI44L, IFI6, ISG15, MX1, and OAS1 had 6, 4, 12, 6, 14, and 1 methylation sites, respectively, with significant differences in methylation levels (Figure 4D). For instance, significant methylation differences were observed in cg10778971, cg12177001, cg14352715, and cg23893332 in IFI27. To further explore the potential roles of MX1, IFI44L, ISG15, OAS1, IFI6, and IFI27, single-gene GSEA analysis was performed. KEGG analysis revealed that most key genes were significantly enriched in pathways such as cytoplasmic translation, viral defense response, and symbiont defense response (Figure 5 and S2).
 |
Figure 3 UMAP plot illustrating the top four DEGs in memory B cells. |
 |
Figure 4 Identification and analysis of key genes in SLE. (A) Venn diagram showing the overlap of differentially expressed genes (DEGs) between memory B cells and the whole transcriptome dataset. (B) Receiver operating characteristic (ROC) curve analysis demonstrating the diagnostic value of these key genes in SLE. (C) Protein-protein interaction (PPI) network of key genes. (D) Methylation analysis showing the number of significantly methylated sites for each key gene (ns: not significant; *p<0.05; **p<0.01; ***p<0.001; ****p<0.0001; red text indicates statistically significant differences). |
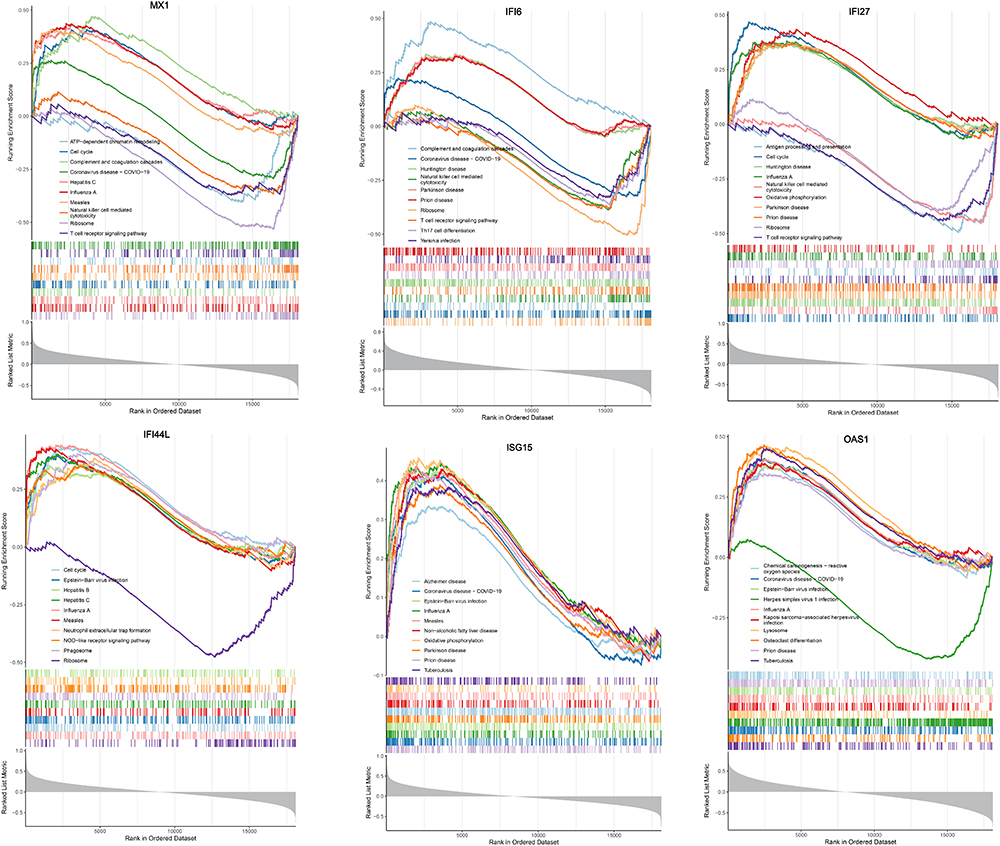 |
Figure 5 Single-gene GSEA analysis displaying KEGG enrichment results for MX1, IFI6, IFI27, IFI44L, ISG15 and OAS1. |
ceRNA Regulation of Genes and miRNA-mRNA-TF Networks
To explore the regulatory mechanisms of MX1, IFI44L, ISG15, OAS1, IFI6, and IFI27, a key gene-TF network was constructed, consisting of 41 nodes and 48 edges (Figure 6A). In this network, BRCA1 was found to potentially influence the expression of both IFI6 and MX1. Moreover, an mRNA-miRNA-lncRNA network comprising 53 nodes and 73 edges was constructed, consisting of four miRNAs (hsa-miR-485-5p, hsa-miR-28-5p, hsa-miR-185-5p, and hsa-miR-326) (Figure 6B), two mRNAs (IFI44L and OAS1), and 47 lncRNAs (such as GAS5, FGD5-AS1) (Figure 6C). This network included pathways such as hsa-miR-485-5p-OAS1-MEG3 and IFI44L-hsa-miR-326-LINC00894 (Figure 6D).
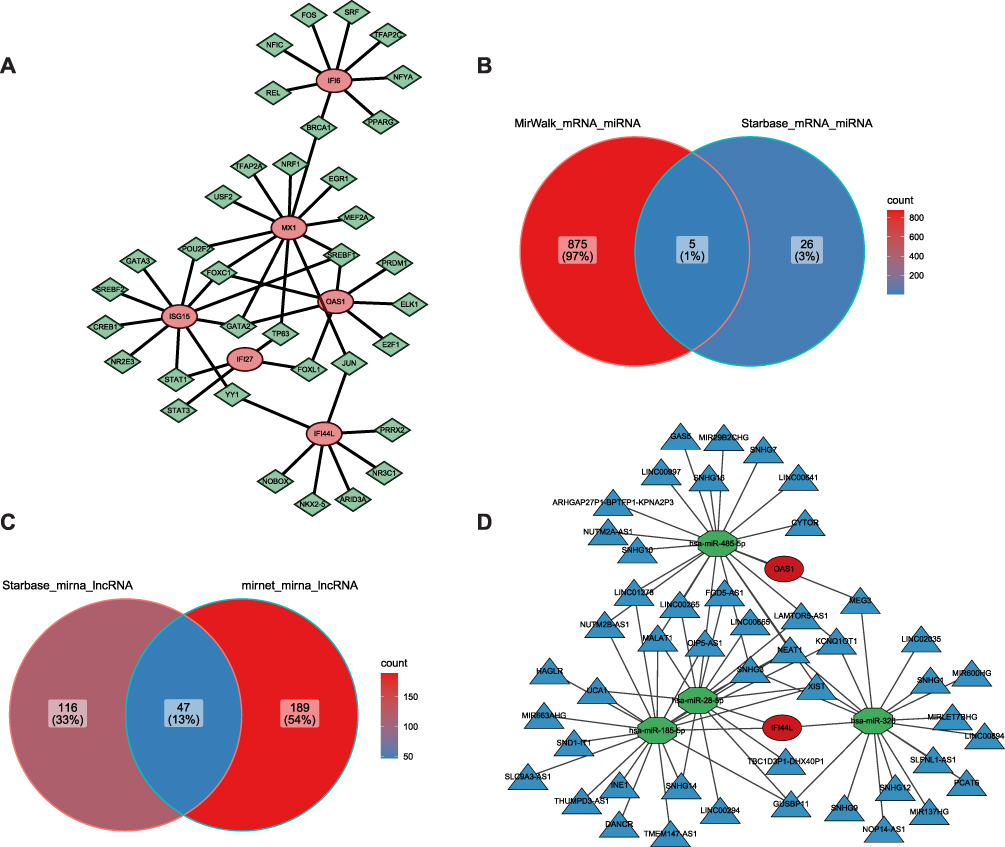 |
Figure 6 Construction of Regulatory Networks Involving ceRNA, miRNA-mRNA, and Transcription Factor (TF) Interactions. (A) Key gene-transcription factor (TF) network illustrating the regulatory relationships between key genes and transcription factors. (B) Venn diagram showing the overlapping miRNA-mRNA interactions identified by MirWalk and StarBase. (C) Venn diagram displaying the overlapping lncRNAs identified by MirWalk and StarBase. (D) mRNA-miRNA-lncRNA regulatory network. |
Expression of Key Genes in Cell Pseudotime Analysis
MX1, ISG15, and OAS1 were expressed in memory B cells, naïve B cells, and intermediate B cells, while IFI6 was highly expressed in intermediate B cells, and IFI44L was highly expressed in naïve B cells and intermediate B cells (Figure 7A). Additionally, the expression levels of the six key genes were higher in the B cell subpopulations of the SLE group compared to the CTL group (Figure 7B). Further exploration of biomarker expression during B cell differentiation revealed three distinct states (Figure 8A and B), with state 1 primarily comprising memory B cells, and naïve B cells and intermediate B cells predominantly in state 2 (Figure 8C and D). Ultimately, combining the cell pseudotime analysis with key gene expression showed that IFI44L and MX1 initially increased and then decreased over pseudotime (Figure 8E).
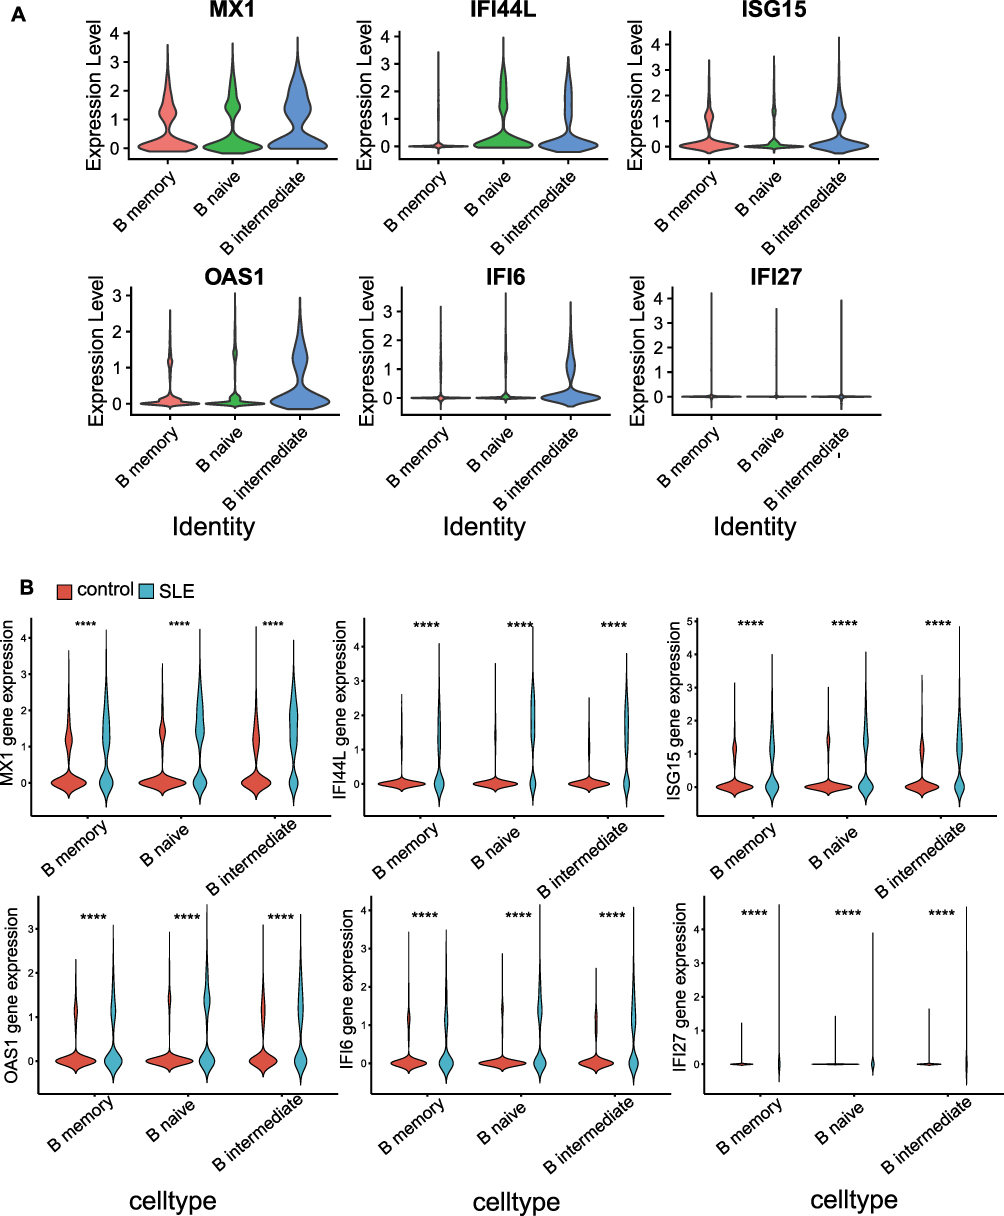 |
Figure 7 Expression of Key Genes in Different B Cell Subpopulations. (A) Gene expression analysis across various B cell subpopulations. (B) Comparison of key gene expression levels in B cell subpopulations between the SLE and control groups (****p < 0.0001). |
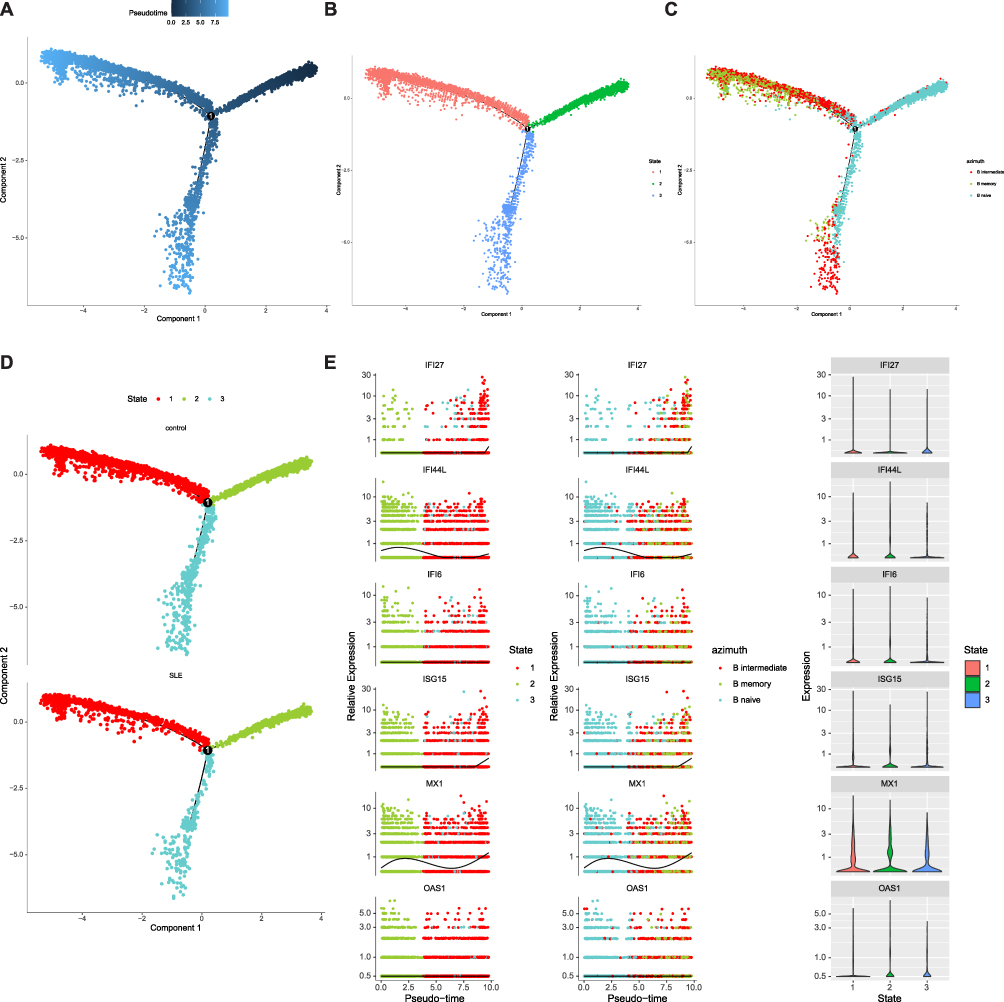 |
Figure 8 Pseudotime analysis of B cell subpopulations and the expression of key genes in these subpopulations. (A and B) The pseudotime trajectory plot shows the differentiation process of B cell subpopulations, with three distinct states observed in the B cell subpopulations. (C) Pseudotime analysis combined with cell state classification, displaying the distribution of B cell subpopulations across different states. (D) Pseudotime analysis in the control and SLE groups. (E) Temporal dynamics of key genes such as IFI27, IFI44L, IFI6, ISG15, MX1, and OAS1 in each state based on pseudotime analysis. |
Discussion
Systemic lupus erythematosus is a globally prevalent autoimmune disease, and elucidating its underlying mechanisms is critical for developing novel diagnostic and therapeutic strategies. In this study, single-cell and transcriptomic analyses identified six key genes associated with SLE (MX1, IFI44L, ISG15, OAS1, IFI6, IFI27), which were significantly differentially expressed in immune cells, particularly memory B cells, from SLE patients. Further analysis suggested that these genes contribute to immune dysregulation in SLE through pathways such as viral response and T-cell receptor signaling. Additionally, we explored their epigenetic regulation, ceRNA network interactions, and associations with transcription factors and miRNAs, offering new insights into potential therapeutic targets for SLE.
IFI44L, ISG15, IFI6, and IFI27, as interferon-stimulated genes, play crucial roles in immune responses, with methylation modifications potentially influencing SLE susceptibility. OAS1 is involved in antiviral immunity, while MX1 is upregulated following viral infection, and its high expression may contribute to immune dysregulation.16 Methylation of MX1 and IFI44L has been proposed as biomarkers for SLE,17,18 with MX1 demonstrating strong diagnostic potential in proteomics and single-cell sequencing studies.19 Additionally, MX1 and IFI16 have been identified as potential biomarkers for lupus nephritis (LN), suggesting applications in LN diagnosis and treatment.20,21 IFI44L promoter methylation has been established as a blood biomarker for SLE,22 influencing SLE pathogenesis through the type I interferon signaling pathway.23 Our study confirmed that IFI44L is highly expressed in SLE patients, particularly in memory B cells, further supporting its critical role in SLE pathogenesis. Furthermore, IFI44L, IFI27, and OAS1 are closely associated with SLE progression,24 with IFI44L methylation having been suggested as a highly sensitive diagnostic biomarker.25 Free-form ISG15 may exacerbate disease severity by enhancing pro-inflammatory activity,26,27 and its high expression in B cells of SLE patients may contribute to immune response imbalance.
Significant differences exist between naive and memory B cells in SLE patients,27 with abnormal memory B cells disrupting immune homeostasis and being associated with SLE relapse.28,29 Despite exhibiting reduced responsiveness to B cell receptor (BCR) signaling, SLE memory B cells retain responsiveness to toll-like receptor and type I interferon signaling,30 which may reduce the efficacy of B cell-targeted therapies such as Bruton’s Tyrosine Kinase (BTK) inhibitors and anti-CD22 antibodies.31 These findings suggest that aberrant memory B cells may play a role in SLE pathogenesis and could potentially serve as therapeutic targets. However, further functional studies and clinical investigations are needed to confirm their pathogenic role and assess the feasibility of such therapeutic strategies.32
Functional enrichment analysis revealed that these key genes are primarily involved in antiviral defense, cell cycle regulation, and immune-related pathways, aligning with the immunopathological characteristics of SLE. MX1, IFI44L, OAS1, and ISG15 are closely associated with antiviral responses, with OAS1 implicated in Epstein–Barr virus infection and MX1 involved in NK cell-mediated cytotoxicity.33,34 Additionally, IFI6 and IFI44L participate in T cell receptor signaling and Th17 cell differentiation, both of which are critical in SLE pathogenesis.35,36 Methylation analysis identified multiple significant methylation sites in MX1, IFI44L, ISG15, and OAS1, highlighting the essential role of epigenetic modifications in SLE immune dysfunction.37
Pseudotime analysis revealed the temporal expression dynamics of key genes in B-cell subsets. MX1, ISG15, and OAS1 were linked to immune dysregulation in SLE, while IFI6 and IFI44L played roles in B-cell differentiation and regulation. These genes were expressed in memory, naïve and intermediate B cells, suggesting viral influence on B-cell immunity. Notably, IFI6 was enriched in intermediate B cells, whereas IFI44L was upregulated in naïve and intermediate B cells, highlighting their functional significance. Their widespread upregulation indicates dysregulated B-cell activation in SLE. Pseudotime analysis also identified three B-cell differentiation states, with IFI44L and MX1 peaking early before declining, underscoring their roles in B-cell development. These findings link gene dynamics to immune regulation, cell cycle control, and viral responses, providing insights into SLE pathogenesis and potential therapies.
Additionally, this study constructed a key gene–transcription factor regulatory network, revealing that BRCA1 may regulate IFI6 and MX1, supporting its involvement in immune responses.38 Furthermore, mRNA–miRNA–lncRNA network analysis identified hsa-miR-485-5p as a potential regulator of OAS1, while the IFI44L–hsa-miR-326–LINC00894 axis may be implicated in SLE immune mechanisms. Further experimental validation is needed to explore the clinical significance of these regulatory interactions However, it should be noted that these conclusions are primarily based on computational predictions, which represent a limitation of this study. Future research should incorporate functional validation through knockdown or overexpression experiments, as well as chromatin immunoprecipitation (ChIP) assays, to confirm the biological relevance of these regulatory interactions.
Conclusions
This study systematically identified key genes implicated in SLE pathogenesis (MX1, IFI44L, ISG15, OAS1, IFI6, and IFI27) and their potential regulatory mechanisms in memory B cells using single-cell sequencing and transcriptomic analysis. These genes are likely to contribute to SLE pathogenesis by modulating antiviral responses, immune signaling pathways, and epigenetic regulation, thereby providing novel insights into SLE diagnosis and targeted therapy. These findings suggest that the identified genes may serve as potential biomarkers for early screening and as molecular targets for precision therapies in clinical settings. However, this study is limited by its reliance on computational predictions, the possibility of batch effects, and sample heterogeneity. Future studies should incorporate functional validation approaches, including gene knockout or overexpression, CRISPR-Cas9-based editing, and clinical validation in larger SLE cohorts, to further verify the biological significance and clinical applicability of these findings.
Abbreviations
BCR, B cell receptor; DEGs, differentially expressed genes; DIC, different immune cells; scRNA-seq, single-cell RNA sequencing; SLE, systemic lupus erythematosus.
Data Sharing Statement
All data and materials utilized in this study are accessible upon reasonable request from the corresponding author.
Ethics Statement
All studies involving human specimens were conducted in accordance with the ethical policies and procedures approved by the Human Ethics Committee of the Second Affiliated Hospital of Kunming Medical University (No: Approval-PJ-Science-2022-39). Written informed consent was obtained from each patient prior to their inclusion in the study. The study complied with the principles set out in the Declaration of Helsinki.
Author Contributions
All authors made a significant contribution to the work reported, whether that is in the conception, study design, execution, data analysis and interpretation, or in all these areas; took part in drafting, revising or critically reviewing the article; gave final approval of the version to be published; have agreed on the journal to which the article has been submitted; and agree to be accountable for all aspects of the work.
Funding
This study was supported by grants from the National Natural Science Foundation of China, Grant/Award Numbers: 82160595, 82373474; the Yunnan Fundamental Research Kunming Medical University Joint Projects, Grant/Award Numbers: 202301AY070001-014, 202201AY070001-111; the Yunnan Technology Talent and Platform Plan for Academician and Expert Workstation, Grant/Award Number: 202305AF150010; Innovation Fund Project for Graduate Students of Kunming Medical University, Grant/Award Number: 2023B021.
Disclosure
The authors report no conflicts of interest in this work.
References
1. Kiriakidou M, Ching CL. Systemic lupus erythematosus. Ann Intern Med. 2020;172(11):Itc81–itc96. doi:10.7326/aitc202006020
2. Tian J, Zhang D, Yao X, Huang Y, Lu Q. Global epidemiology of systemic lupus erythematosus: a comprehensive systematic analysis and modelling study. Ann Rheum Dis. 2023;82(3):351–356. doi:10.1136/ard-2022-223035
3. Caielli S, Wan Z, Pascual V. Systemic lupus erythematosus pathogenesis: interferon and beyond. Annu Rev Immunol. 2023;41(1):533–560. doi:10.1146/annurev-immunol-101921-042422
4. Yap DYH, Chan TM. B cell abnormalities in systemic lupus erythematosus and lupus nephritis-role in pathogenesis and effect of immunosuppressive treatments. Int J Mol Sci. 2019;20(24):6231. doi:10.3390/ijms20246231
5. Lazar S, Kahlenberg JM. Systemic lupus erythematosus: new diagnostic and therapeutic approaches. Annu Rev Med. 2023;74(1):339–352. doi:10.1146/annurev-med-043021-032611
6. Zhang X, Lan Y, Xu J, et al. CellMarker: a manually curated resource of cell markers in human and mouse. Nucleic Acids Res. 2019;47(D1):D721–d728. doi:10.1093/nar/gky900
7. Ito K, Murphy D. Application of ggplot2 to pharmacometric graphics. CPT Pharmacometrics Syst Pharmacol. 2013;2(10):e79. doi:10.1038/psp.2013.56
8. Jin W, Zhao S, Sun H, Pei J, Gao R, Jiang P. Characterization and discrimination of flavor volatiles of different colored wheat grains after cooking based on GC-IMS and chemometrics. Curr Res Food Sci. 2023;7:100583. doi:10.1016/j.crfs.2023.100583
9. Sun Y, Zhang C, Fang Q, Zhang W, Liu W. Abnormal signal pathways and tumor heterogeneity in osteosarcoma. J Transl Med. 2023;21(1):99. doi:10.1186/s12967-023-03961-7
10. Gribov A, Sill M, Lück S, et al. SEURAT: visual analytics for the integrated analysis of microarray data. BMC Med Genomics. 2010;3(1):21. doi:10.1186/1755-8794-3-21
11. Hao Y, Hao S, Andersen-Nissen E, et al. Integrated analysis of multimodal single-cell data. Cell. 2021;184(13):3573–3587.e3529. doi:10.1016/j.cell.2021.04.048
12. Wu T, Hu E, Xu S, et al. clusterProfiler 4.0: a universal enrichment tool for interpreting omics data. Innovation. 2021;2(3):100141. doi:10.1016/j.xinn.2021.100141
13. Tian Y, Morris TJ, Webster AP, et al. ChAMP: updated methylation analysis pipeline for Illumina BeadChips. Bioinformatics. 2017;33(24):3982–3984. doi:10.1093/bioinformatics/btx513
14. Su G, Morris JH, Demchak B, Bader GD. Biological network exploration with Cytoscape 3. Curr Protoc Bioinformatics. 2014;47(1):
15. Du J, Yuan X, Deng H, et al. Single-cell and spatial heterogeneity landscapes of mature epicardial cells. J Pharm Anal. 2023;13(8):894–907. doi:10.1016/j.jpha.2023.07.011
16. Kim A, Choi SJ, Song GG, Kim JH, Jung JH. Characterization of virus-mediated autoimmunity and the consequences for pathological process in patients with systemic lupus erythematosus. Clin Rheumatol. 2023;42(10):2799–2809. doi:10.1007/s10067-023-06597-6
17. Allen PC, Roberts K, Rubio JE, et al. Genome-wide DNA methylation analysis implicates enrichment of interferon pathway in African American patients with systemic lupus erythematosus and European Americans with lupus nephritis. J Autoimmun. 2023;139:103089. doi:10.1016/j.jaut.2023.103089
18. Ehtesham N, Habibi Kavashkohie MR, Mazhari SA, et al. DNA methylation alterations in systemic lupus erythematosus: a systematic review of case-control studies. Lupus. 2023;32(3):363–379. doi:10.1177/09612033221148099
19. Li Y, Ma C, Liao S, et al. Combined proteomics and single cell RNA-sequencing analysis to identify biomarkers of disease diagnosis and disease exacerbation for systemic lupus erythematosus. Front Immunol. 2022;13:969509. doi:10.3389/fimmu.2022.969509
20. Wang L, Yang Z, Yu H, et al. Predicting diagnostic gene expression profiles associated with immune infiltration in patients with lupus nephritis. Front Immunol. 2022;13:839197. doi:10.3389/fimmu.2022.839197
21. Tian M, Tang M, Chen C, Lin Y, Chen H, Xu Y. Macrophage infiltration correlated with IFI16, EGR1 and MX1 expression in renal tubular epithelial cells within lupus nephritis-associated tubulointerstitial injury via bioinformatics analysis. J Inflamm Res. 2024;17:11469–11483. doi:10.2147/jir.S489087
22. Zhao M, Zhou Y, Zhu B, et al. IFI44L promoter methylation as a blood biomarker for systemic lupus erythematosus. Ann Rheum Dis. 2016;75(11):1998–2006. doi:10.1136/annrheumdis-2015-208410
23. Wang Y, Jia W, Ma Q, et al. Identification of IFI44L as a new candidate molecular marker for systemic lupus erythematosus. Clin Exp Rheumatol. 2023;41(1):48–59. doi:10.55563/clinexprheumatol/q3aa6s
24. Zhao X, Zhang L, Wang J, et al. Identification of key biomarkers and immune infiltration in systemic lupus erythematosus by integrated bioinformatics analysis. J Transl Med. 2021;19(1):35. doi:10.1186/s12967-020-02698-x
25. Zhang B, Liu L, Zhou T, et al. A simple and highly efficient method of IFI44L methylation detection for the diagnosis of systemic lupus erythematosus. Clin Immunol. 2020;221:108612. doi:10.1016/j.clim.2020.108612
26. Mirzalieva O, Juncker M, Schwartzenburg J, Desai S. ISG15 and ISGylation in human diseases. Cells. 2022;11(3):538. doi:10.3390/cells11030538
27. Apaer A, Shi Y, Aobulitalifu A, et al. Identification of potential therapeutic targets for systemic lupus erythematosus based on GEO database analysis and Mendelian randomization analysis. Front Genet. 2024;15:1454486. doi:10.3389/fgene.2024.1454486
28. Weißenberg SY, Szelinski F, Schrezenmeier E, et al. Identification and characterization of post-activated B cells in systemic autoimmune diseases. Front Immunol. 2019;10:2136. doi:10.3389/fimmu.2019.02136
29. Schrezenmeier E, Weißenberg SY, Stefanski AL, et al. Postactivated B cells in systemic lupus erythematosus: update on translational aspects and therapeutic considerations. Curr Opin Rheumatol. 2019;31(2):175–184. doi:10.1097/bor.0000000000000576
30. Jenks SA, Cashman KS, Zumaquero E, et al. Distinct effector B cells induced by unregulated toll-like receptor 7 contribute to pathogenic responses in systemic lupus erythematosus. Immunity. 2018;49(4):725–739.e726. doi:10.1016/j.immuni.2018.08.015
31. Jenks SA, Cashman KS, Woodruff MC, Lee FE, Sanz I. Extrafollicular responses in humans and SLE. Immunol Rev. 2019;288(1):136–148. doi:10.1111/imr.12741
32. Dörner T, Lipsky PE. The essential roles of memory B cells in the pathogenesis of systemic lupus erythematosus. Nat Rev Rheumatol. 2024;20(12):770–782. doi:10.1038/s41584-024-01179-5
33. Han L, Zhang Y, Wang Q, et al. Epstein-Barr virus infection and type I interferon signature in patients with systemic lupus erythematosus. Lupus. 2018:961203317753069. doi:10.1177/0961203317753069
34. Robinson WH, Younis S, Love ZZ, Steinman L, Lanz TV. Epstein-Barr virus as a potentiator of autoimmune diseases. Nat Rev Rheumatol. 2024;20(11):729–740. doi:10.1038/s41584-024-01167-9
35. Li H, Boulougoura A, Endo Y, Tsokos GC. Abnormalities of T cells in systemic lupus erythematosus: new insights in pathogenesis and therapeutic strategies. J Autoimmun. 2022;132:102870. doi:10.1016/j.jaut.2022.102870
36. Huang J, Li X, Zhu Q, Wang M, Xie Z, Zhao T. Imbalance of Th17 cells, Treg cells and associated cytokines in patients with systemic lupus erythematosus: a meta-analysis. Front Immunol. 2024;15:1425847. doi:10.3389/fimmu.2024.1425847
37. Zhou HY, Luo Q, Sui H, et al. Recent advances in the involvement of epigenetics in the pathogenesis of systemic lupus erythematosus. Clin Immunol. 2024;258:109857. doi:10.1016/j.clim.2023.109857
38. Wang F, Lyu XY, Qin YM, Xie MJ. Relationships between systemic sclerosis and atherosclerosis: screening for mitochondria-related biomarkers. Front Genet. 2024;15:1375331. doi:10.3389/fgene.2024.1375331
 © 2025 The Author(s). This work is published and licensed by Dove Medical Press Limited. The
full terms of this license are available at https://www.dovepress.com/terms
and incorporate the Creative Commons Attribution
- Non Commercial (unported, 4.0) License.
By accessing the work you hereby accept the Terms. Non-commercial uses of the work are permitted
without any further permission from Dove Medical Press Limited, provided the work is properly
attributed. For permission for commercial use of this work, please see paragraphs 4.2 and 5 of our Terms.
© 2025 The Author(s). This work is published and licensed by Dove Medical Press Limited. The
full terms of this license are available at https://www.dovepress.com/terms
and incorporate the Creative Commons Attribution
- Non Commercial (unported, 4.0) License.
By accessing the work you hereby accept the Terms. Non-commercial uses of the work are permitted
without any further permission from Dove Medical Press Limited, provided the work is properly
attributed. For permission for commercial use of this work, please see paragraphs 4.2 and 5 of our Terms.