
Back to Journals » Risk Management and Healthcare Policy » Volume 18
Simultaneous Symptom Network Analysis of Heart Failure Patients: A Cross-Sectional Study
Authors Wu R, Chen L, Li Y, Wang H, Liu M, Yao Y, Chen H, Xiao D
Received 12 February 2025
Accepted for publication 15 May 2025
Published 26 July 2025 Volume 2025:18 Pages 2493—2503
DOI https://doi.org/10.2147/RMHP.S520974
Checked for plagiarism Yes
Review by Single anonymous peer review
Peer reviewer comments 2
Editor who approved publication: Professor Haiyan Qu
Rui Wu,1,2 Lu Chen,3 Yingjie Li,3 Huiwen Wang,3 Mengdie Liu,3 Yingxia Yao,3 Huiyan Chen,3 Dan Xiao4
1Department of Cardiology, The Second Affiliated Hospital of Jiangxi Medical College, Nanchang University, Nanchang, People’s Republic of China; 2School of Nursing, Jiangxi Medical College, Nanchang University, Nanchang, People’s Republic of China; 3School of Nursing, Nanchang University, Nanchang, People’s Republic of China; 4The Second Affiliated Hospital of Jiangxi Medical College, Nanchang, People’s Republic of China
Correspondence: Dan Xiao, The Second Affiliated Hospital of Jiangxi Medical College, Nanchang, People’s Republic of China, Email [email protected]
Context: Heart failure is a complex clinical syndrome associated with various symptoms that significantly impact patients’ quality of life. Effective management of these symptoms remains a major challenge. Identifying and understanding the interactions between these symptoms is crucial for improving symptom control and patient outcomes.
Objective: This study aimed to investigate the incidence and severity of symptoms in heart failure patients, construct a symptom network of heart failure patients, and explore the centrality of symptoms in the network. The goal was to identify core symptoms and explore the potential targets for symptom intervention.
Methods: A total of 1051 heart failure patients were selected through convenience sampling. The Chinese version of the Memorial Heart Failure Symptom Assessment Scale was used to assess the prevalence and severity of symptoms. Regularized partial correlation network analysis was employed to construct the symptom network and evaluate the centrality of each symptom within the network.
Results: Palpitations were found to be the most common symptom among heart failure patients, while lack of energy and depression were the most severe symptoms. In the symptom network, chest pain emerged as the core symptom with the highest predictability.
Conclusion: Intervening with chest pain as the core symptom can effectively reduce the severity of the entire symptom network. Early intervention for symptoms such as lack of energy can alleviate the burden of symptom management. Identifying predictable symptoms can help guide targeted symptom management strategies. Healthcare professionals can use the symptom patterns identified in this study to develop more precise and effective symptom management plans for heart failure patients.
Keywords: heart failure, core symptoms, network analysis, symptom management, cross-sectional study
Key Message
This study explores the symptom network in heart failure patients, identifying chest pain as the central symptom with the highest predictability. Targeting chest pain and early intervention for lack of energy can improve symptom management and help healthcare professionals prioritize treatment, leading to more effective, tailored care for heart failure patients.
Introduction
Heart failure is a heterogeneous clinical syndrome stemming from cardiac overload and injury that results in considerable morbidity and mortality.1 The number of patients is expected to continue to increase in the coming years due to demographic changes.2 The prevalence of heart failure in developed countries is typically about 1–2%, with a prevalence of more than 10% in patients over 70 years of age.3 Heart failure increasingly disables individuals and makes healthcare expensive.4 As a result of cardiac output decreases, the basic needs of the body’s metabolic functions cannot be met, causing patients to experience a wide range of associated symptoms.5
In the last decade, significant progress has been made in pharmacological, technological, and surgical interventions for heart failure, improving survival rates.6 Despite these advancements, managing heart failure symptoms—an essential component of patient care—remains a challenge. Patients experience a variety of symptoms, both physical and psychological, including dyspnea, fatigue, pain, edema, and depression, which severely affect their quality of life.7–9 Symptoms are multidimensional, involving frequency, severity, and distress.10 Effective symptom management requires assessing these various dimensions, rather than simply identifying their presence or absence. Previous symptom management efforts, focused on individual symptoms or symptom clusters, have failed to account for the complex interactions between symptoms, making interventions less effective and less precise.11,12
Symptom network analysis offers a novel approach to understanding these interactions. It constructs a network where symptoms are treated as nodes, and their relationships are represented as edges. This method can quantify the degree of importance of each symptom by calculating its centrality in the network, identifying core symptoms that may influence the progression of the disease.13,14 Network analysis goes beyond traditional symptom management approaches by revealing the complex interplay between symptoms, which is often overlooked when symptoms are treated in isolation. By visualizing and quantifying these relationships, symptom networks provide valuable insights into the mechanisms of symptom interactions and guide more targeted and precise interventions.15
Therefore, the aim of this study was to identify the synergistic interactions between heart failure symptoms through symptom networks, to inform the development of more effective symptom management strategies. The specific objectives of this study were: (1) to determine the prevalence and severity of symptoms in heart failure patients, (2) to construct a visualized symptom network, and (3) to identify the core symptoms in heart failure patients prior to hospital admission.
Objects and Methods
Subjects
From February 2023 to August 2024, patients with chronic heart failure admitted to the Department of Cardiology of the Second Affiliated Hospital of Nanchang University were selected by convenience sampling method as the survey subjects. Inclusion criteria: (1) patients who met the diagnostic criteria for heart failure in the China Heart Failure Diagnosis and Treatment Guidelines 2018 and whose heart failure diagnosis was more significant than 7 d; (2) age ≥ 18 years; (3) New York Heart Association cardiac function classification of II to IV; (4) independent communication ability and voluntary participation in this study. Exclusion criteria: (1) after major cardiac surgery or cardiac transplantation; (2) with physical severe illnesses (eg, malignant tumors, hepatic or renal insufficiency, etc).; (3) with a history of psychological disorders or psychiatric illnesses; and (4) with recent major life events. Since the scale used in this study included 32 symptoms, the total parameters to be estimated for constructing the network model were 528 (32 threshold parameters and 32 × 31/2 = 496 pairwise correlation parameters), and the sample size needed to be at least equal to the number of total parameters in order to ensure the reliability of the model.16
Methods
Survey Instrument
The general information questionnaire was self-designed and included socio-demographic information (gender, age, marital status, education level, place of residence) and disease-related information (etiology, duration of the disease, cardiac function grading).
The Chinese version of the Memorial Symptom Assessment scale-heart failure (MSAS-HF) was developed by Zambroski et al.17 The revised Chinese version was used in this study by Guo Jinyu et al to assess the symptoms of HF patients in the past 7d, including physiological symptoms and the symptoms of HF patients in the past 7d. In the present study, we used a revised Chinese version of the scale developed by Guo Jinyu et al to assess the symptoms of HF patients in the past 7 d. The scale consisted of 32 symptom entries, including physical symptoms (21), psychological symptoms (21), psychosocial symptoms (6), and heart failure symptoms (5). Each symptom entry included the following aspects: presence or absence of symptoms, frequency of occurrence (Likert 4-point scale, from “rarely” to “almost always”), severity (Likert 4-point scale, from “mild” to “severe”), and the degree of severity (Likert 4-point scale, from “mild” to “severe”). Severity (Likert 4-point scale from “mild” to “very severe” on a scale of 1 to 4), and distress (Likert 5-point scale from “not at all” to “very severe” on a scale of 1 to 4), and the degree of distress (Likert 5-point scale from “not at all” to “not at all” on a scale of 1 to 4). (Likert 5 scale from “not at all” to “very severe” on a scale of 0 to 4), and the degree of distress (Likert 5 scale from “not at all” to “very severe” on a scale of 0 to 4). Since the present study was conducted based on the severity of the patient’s symptoms, only the incidence and severity of the patient’s symptoms were investigated. The Cronbach’s alpha coefficient of the scale in this study was 0.912, with good reliability.
Data Collection methods and Quality Control Methods
Before the formal survey, two investigators were trained and unified the survey terminology, the questionnaire was modified and perfected after the pre-survey, and the paper version of the questionnaire was distributed to the respondents in strict compliance with the inclusion and exclusion criteria. An informed consent form accompanied the questionnaire on the first page, and the investigator, after obtaining the informed consent of the patients, explained in detail the purpose of the survey, the content, and the significance of the study and launched the survey. The questionnaires were filled out anony-mously, and the investigator answered the questions promptly without giving any hints. The questionnaires took 15–20 min to complete, and all questionnaires were collected on the spot after completion and checked for omission-s promptly. The questionnaires were entered by two persons and verified by a third person to ensure the accuracy of data entry. One thousand two hundred questionnaires were distributed in this study, 1051 valid questionnaire-s were recovered, and the effective recovery rate of the questionnaires was 87.6%.
Statistical Processing
R software (4.2.2) was used for descriptive analysis and undirected network construction. Frequencies, percentages, means, and standard deviations were used to characterize demographics and the prevalence and severity of symptoms. Symptom severity network graphs were constructed using the graph package and based on the EBICglasso function and Spearman correlation analysis.18 Symptoms are the nodes of the network, 2 nodes are connected by edges, the edges represent the biased correlation between the connected 2 nodes after controlling the influence of other nodes. The closeness of the connection between symptoms can be indicated by the connection strength of the edges, ie, the edge weights. The absolute value of the edge weight indicates the strength of the interaction, the larger the absolute value, the thicker the edge in the network structure graph, representing the stronger relationship between the 2 nodes.19 Non-normally distributed study item means were used to calculate nonparametric correlation coefficients by non-supernatural transformation.20 The centrality of nodes is a kind of objective index to quantify the importance of individual nodes, which mainly includes strength centrality, tightness centrality and intermediary centrality. The above indicators can measure the influence and importance of a node from the perspective of the mechanism, and the larger the value, the higher the importance of the node in the whole network.21 Strength is the sum of the symptom’s connectivity with other symptoms, indicating the influence of the symptom in the network; tightness centrality is the inverse of the sum of the distances between the symptom and the other symptoms, and the larger the value, the more likely the symptom is at the center of the network; mediated centrality refers to the number of times that the symptom passes through the symptom’s shortest path, ie, the symptom’s role as a bridge in the network. After forming the network model, in order to quantify the importance of each node, the expected influence (EI) of each node was calculated by the graph package in R software, which estimates the sum of the raw values of the edges connected between every two nodes, and the calculation of EI is more suitable for the network structure that contains both positive and negative correlations, compared with the traditional centrality index (ie, node strength).22 The greater the expected impact of a node, the closer the node is to the other nodes in the network and the more central and important it is in the network. The bootnet package of R software was used to evaluate the accuracy and stability of the network model. The accuracy of the partial correlation coefficient was assessed by calculating the 95% confidence interval through the nonparametric bootstrap method (1000 bootstrap samples), and the central stability coefficient was calculated to assess the stability of the node’s expected influence by using the sample descent bootstrap method (1000 bootstrap samples), which was shown in the study23 to be no less than 0.25 and preferably higher than 0.50.
Results
General Information of Patients
A total of 1051 patients were included in this study, aged from 28 to 83 years old, with an average of 57.31±8.24 years old; 687 (65.4%) were male and 364 (34.6%) were female; 465 (44.24%) were in elementary school and below, 347 (33.02%) were in junior high school, 157 (14.94%) were in senior high school or technical secondary school, and 82 (7.80%) were in college and above; marital status, 941 (89.53%) were married/cohabiting, 110 (10.47%) were single/divorced/widowed/separated, and 10.47% were single/widowed/widowed/separated. Marital status: married/cohabiting 941 cases (89.53%), single/divorced/widowed/separated 110 cases (10.47%); place of residence: 465 cases (44.24%) in rural areas, 586 cases (55.76%) in urban areas; duration of the disease: <12 months, 230 cases (21.88%); 12–36 months, 453 cases (43.10%); 12–36 months, 453 cases (43.10%); 12–36 months, 453 cases (43.10%). Cases (13.89%), 98 cases (9.32%) of arrhythmia, and 30 cases (2.85%) of other. See Table 1.
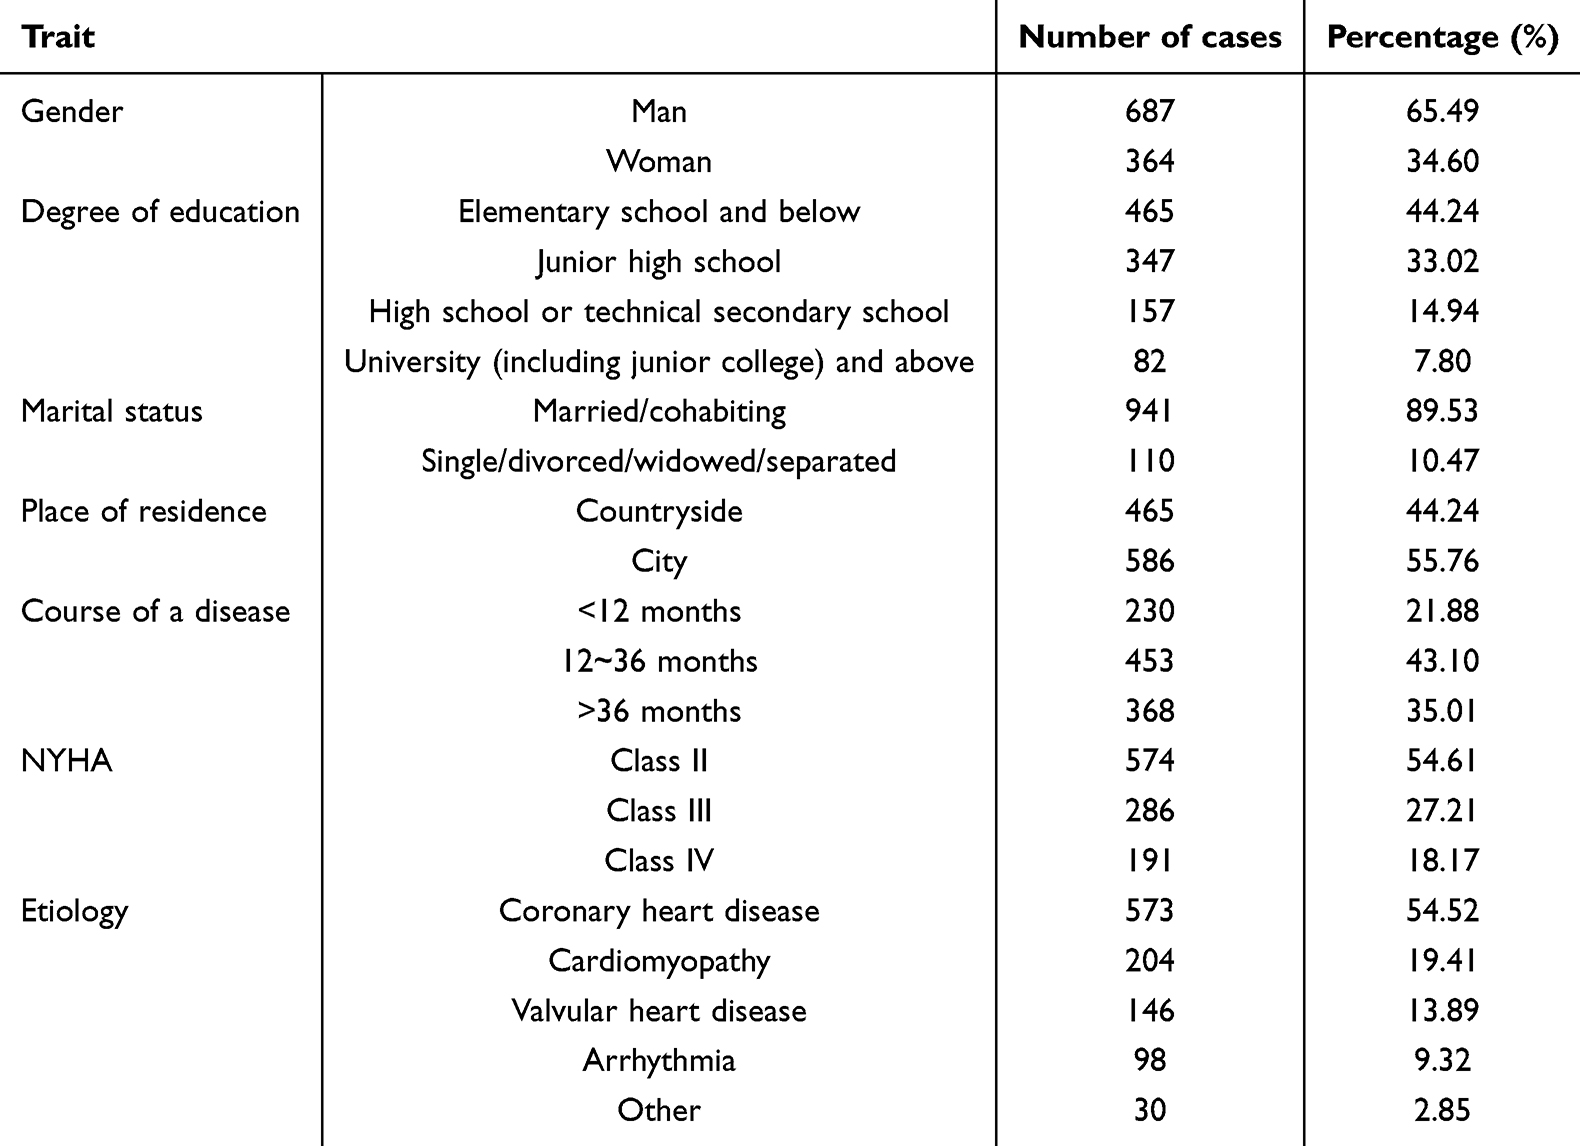 |
Table 1 Characteristics of Participants (n=1051) |
Incidence and Severity of Patient Symptoms
Symptom incidence ranged from 2.8% to 85.7%, with the most common symptoms being palpitations (85.7%), lack of energy (84.1%), and chest pain (79.3%); symptom severity scores conformed to a normal distribution, with higher scores for lack of energy (2.58±0.72), chest pain (2.41±0.90), and flat-lining dyspnea (2.36± 0.88). See Table 2.
 |
Table 2 Prevalence and Severity of Symptoms in Patients with Heart Failure (n=1051) |
Results of Symptom Network Analysis
Symptom Network Relationship
The structure of the symptom network of heart failure patients during the same period is shown in Figure 1. The results show that according to the thickness of the edges in the symptom network, the symptom pairs with solid correlations between symptoms were chest pain and shortness of breath (r=0.78); pain in other parts and very difficult to concentrate (r=0.66); abnormal urination and irritability (r=0.53); abnormal urination and easy sleepiness (r=0.51); node predictability Shown as the circle around the node in Figure 1, the measure is the variance explained rate of the node, which takes a value ranging from 0 to 1. A higher value means that the node change is more likely to be explained by other network node changes. The node predictability values in this study ranged from 1.7% to 84.1%. Chest pain has the highest predictability, ie, it is more likely to be alleviated by intervening with its neighboring worry symptoms.
 |
Figure 1 Network of concurrent symptoms in patients with heart failure. X1: Chest pain; X2: Difficulty breathing when lying flat; X3: Waking up breathless at night; X4: Weight gain X5: Palpitations; S1: Other pain; S2: Lack of energy; S3: Shortness of breath; S4: Dizziness; S5: Feeling drowsy; S6: Dry mouth; S7: Nausea; S8: Vomiting; S9: Change in the way food tastes; S10: Lack of appetite; S11: Weight loss; S12: Diarrhea; S13: Constipation; S14: Cough; S15: Swelling of arms or legs; S16: Feeling bloated; S17: Problem with urination; S18: Sweats; S19: Itching; S20: Numbness/tingling in hands/feet; S21: Problems with sexual interest or activity; H1: Difficulty concentrating; H2: Difficulty sleeping; H3: Feeling nervous; H4: Worrying; H5: Feeling sad; H6: Feeling irritable. |
Centrality Analysis
The results showed that the symptom “Chest pain (X1)” had the highest predictable impact (EI=1.315), and the node had the highest centrality. It was the core symptom, followed by “Diarrhea (S12)” (EI= 0.826), and the third was “Difficulty in lying down and breathing” (EI= 0.826). “flatulent dyspnea (X2)” (EI= 0.783). According to the traditional centrality index (ie, node intensity), chest pain (X1) (rS = 1.312) had the highest intensity centrality sum, ie, chest pain was also at the core of the network. Palpitations (X5) had the most significant (rC = 0.0015, rB = 72.34) tight centrality and direct centrality values, ie, they may act as a bridge symptom and be at the center of the network. See Figure 2.
 |
Figure 2 Analysis of node strength, closeness, mediocentricity, and expected impact indicators. |
Accuracy and Stability Assessment of Symptom Network Analysis
Accuracy of Side Weights
The 95% confidence interval obtained by the nonparametric bootstrap method is −0.294 to 0.337 (see Appendix Figure 1), the assessment of side weights is relatively accurate, and the accuracy of the network is good.19
Stability of Expected Impact of Nodes
The central stability coefficient of the expected impact of symptoms calculated using the sample descent bootstrap method is 0.276, which is greater than 0.25 (see Appendix Figure 2), indicating that the expected impact is sufficiently stable and that the core symptoms remain stable even after re-estimating the network using fewer samples or nodes,18 and that the network has good Stability.
Discussion
Patients with heart failure face an unacceptably large number of symptoms and a severe symptom burden.17 As expected, symptoms usually attributed to shortness of breath, palpitations, lack of energy, chest pain, difficulty sleeping, and dyspnea when lying down are very common in heart failure patients.24,25 Surprisingly, other symptoms, such as dry mouth, sweating, and other aches and pains, are more prevalent than the typical symptoms, such as swelling of the arms or legs, weight gain, and dizziness.
The present study showed that among the symptoms with high prevalence, the one with the highest severity was a list of no energy. Previous studies26 reported that lack of energy was the most prevalent and severe symptom in patients with heart failure, and patients felt fatigued almost every day, which seriously affected their physical and mental health. However, in the symptom network analysis, the centrality index (intensity) of lack of energy was lower than that of other symptoms, and it was not a core symptom in patients with heart failure. This is consistent with the finding of Hans et al27 that the most severe symptom may not be the symptom with the highest centrality in the network. In addition, the survey instrument used in this paper was the Patient Self-Report Outcome Measure (PSOM), a subjective report by patients of their health and functional status.28 However, network analysis identifies potential central symptoms from the perspective of symptom interaction mechanisms. The expression of patients’ subjective feelings and the degree of influence of symptoms in the network may be biased, resulting in the symptoms at the network’s lower center having a more significant impact on the patients being easily overlooked.
The results of the symptom network analysis in this study showed the strongest association between the symptom “chest pain(X1)” and the symptom “shortness of breath (S3)”. The association between chest pain and shortness of breath in patients with heart failure (HF) is a complex issue involving multiple physiologic mechanisms and clinical manifestations.29 Chest pain may be associated with severe conditions such as cardiac ischemia or cardiac rupture, which require urgent medical intervention.30 In the case of heart failure, the heart’s pumping capacity decreases, leading to an increase in venous return, which in turn causes congestion and edema in the lungs, in which case the patient’s respiration is compromised and manifests as shortness of breath, and these two symptoms may constitute a mutually reinforcing feedback loop.31 Chest pain was also the symptom with the highest predictability value in this study; predictability refers to the extent to which a node is affected by its connected nodes. Highly predictable symptoms indicate that they can be alleviated by intervening on the peripheral symptoms connected to them, and the more highly correlated peripheral symptoms are the targets of symptom intervention. The more severe heart failure symptom of chest pain is more likely to be alleviated by intervening in its neighboring symptoms of shortness of breath.
The results of the expected impact and intensity centrality analyses in this study indicate that “chest pain (x1)” is a central symptom in the symptom network of patients with heart failure. About 41% of patients with heart failure in the Study to Understand Prognosis and Outcomes and Risk Preferences for Treatment (SUPPORT) reported pain at the end of life.32 In the general population of HF subjects, pain interfered with activity in 70% of patients. 28.6% of subjects with chest pain and 38.9% of subjects with pain elsewhere had pain that was “severe” or “very severe”.33 Chest pain has been identified in patients with frequent and severe heart failure, and angina chest pain is associated with clinical deterioration prior to hospital admission.34 Therefore, in the context of this study, it can be hypothesized that intensive caregiver interventions targeting the symptom “chest pain (x1)” may reduce its transmission within the symptom network and may be more effective in reducing the overall symptom burden in patients with heart failure than interventions targeting the remaining symptoms.
Some studies have shown that the role of “asymptomatic state” is also important in patients with heart failure with atrial fibrillation, especially those with potentially severe cardiomyopathy.35 Elderly men with heart failure and atrial fibrillation often exhibit a rounded transverse thorax or a spherical thorax, which may account for the absence of significant symptoms despite the presence of severe cardiomyopathy.36 This unique anatomical feature may be a potential reason for the asymptomatic nature of some patients, as noted in studies of asymptomatic atrial fibrillation. Assessment of thoracic shape in clinical practice may provide further insight into the symptoms of heart failure and atrial fibrillation, leading to more individualized and accurate symptom management strategies. Understanding the link between body shape and symptom perception could further enhance our approach to managing pain and other symptoms in this patient population, contributing to more effective interventions based on individual needs.
Limitations
While the findings provide valuable insights into the symptom network of heart failure patients, their external applicability should be considered with caution. The study was conducted in a specific patient population, and the results may not be generalizable to all heart failure patients, particularly those in different geographic regions, cultural contexts, or healthcare settings. Additionally, demographic factors such as age, sex, and education may influence the symptom profiles reported by participants, potentially limiting the transferability of the findings to other populations. Since most of the subjects in this study were in cardiac function class II–III, it may lead to bias in the incidence and severity of symptoms. In addition, this is a cross-sectional study, and the causal relationship between symptoms could not be determined. In the future, researchers must develop dynamic symptom networks based on longitudinal data to explore the underlying mechanisms and causal relationships between symptoms and provide the basis for efficient and accurate symptom management.
Additionally, the convenience sampling method used to select participants introduces potential selection bias. This method relies on easily accessible individuals, which may not represent the broader heart failure patient population. Patients who volunteer for studies or who are easier to recruit may differ in significant ways from those who are not included, leading to overrepresentation or underrepresentation of certain symptom patterns or disease characteristics. This selection bias limits the generalizability of the findings to the broader heart failure population. Future research should consider employing more randomized sampling techniques to reduce selection bias and increase the external validity of the results.
Conclusion
This study utilized symptom network analysis to identify the interrelationships between symptoms in heart failure patients, revealing that chest pain emerged as the core symptom in the network. The high predictability of chest pain suggests that interventions targeting this symptom and its related symptoms may be effective in reducing the overall symptom burden in heart failure patients. Our findings provide a new perspective on symptom management by emphasizing the importance of addressing core symptoms, such as chest pain, which may have a cascading effect on other symptoms.
Furthermore, future research should explore the mechanisms underlying symptom interactions, such as the physiological processes that link chest pain and shortness of breath, to better inform targeted interventions. Investigating the effects of symptom management interventions on the network structure could provide further insights into the most effective strategies for improving the quality of life and reducing the burden of symptom management in heart failure patients.
Ethics Approval
This study was approved by the Medical Ethics Committee of the Second Affiliated Hospital of Nanchang University, China, with approval number ([2024] No. (80)). All participants provided written informed consent in accordance with the Declaration of Helsinki. Participants were informed of their right to withdraw from the study at any time and that their privacy and personal data would be fully protected and confidential.
Consent to Participate and Publish
In this study, informed consent was obtained from all participants prior to their inclusion. Participants were fully informed about the study’s purpose, procedures, and potential risks. They were also assured that their participation was voluntary and that they could withdraw from the study at any time without any negative consequences. Furthermore, all participants provided consent for the publication of the study findings. Personal identifiers were removed to ensure anonymity and confidentiality of the participants. The results of this study may be used for scientific publication, presentations, and further research, with the understanding that all data will be presented in aggregate form to protect individual privacy.
Acknowledgments
We are grateful for financial support from the Chinese Nursing Association.
Author Contributions
All authors made a significant contribution to the work reported, whether that is in the conception, study design, execution, acquisition of data, analysis, and interpretation, or in all these areas; took part in drafting, revising, or critically reviewing the article; gave final approval of the version to be published; have agreed on the journal to which the article has been submitted; and agree to be accountable for all aspects of the work.
Disclosure
The authors declare no conflicts of interest in this work.
References
1. Snipelisky D, Chaudhry SP, Stewart GC. The many faces of heart failure. Card Electrophysiol Clin. 2019;11(1):11–20. doi:10.1016/j.ccep.2018.11.001
2. Rogers C, Bush N. Heart failure: pathophysiology, diagnosis, medical treatment guidelines, and nursing management. Nurs Clin North Am. 2015;50(4):787–799. doi:10.1016/j.cnur.2015.07.012
3. Špinar J, Špinarová L, Vítovec J. Pathophysiology, causes and epidemiology of chronic heart failure. Vnitr Lek. 2018;64(9):834–838. doi:10.36290/vnl.2018.114
4. While A, Kiek F. Chronic heart failure: promoting quality of life. Br J Community Nurs. 2009;14(2):54–59. doi:10.12968/bjcn.2009.14.2.38760
5. Jurgens CY. The value of patient perception of heart failure symptoms: commentary on physical and psychological symptom biomechanics in moderate to advanced heart failure. J Cardiovasc Nurs. 2016;31(2):140–141. doi:10.1097/JCN.0000000000000233
6. Zou CH, Zhang J. Interpretation of 2023 ESC focused update of the 2021 ESC Guidelines for the diagnosis and treatment of acute and chronic heart failure. Zhonghua Xin Xue Guan Bing Za Zhi. 2023;51(12):1268–1272. doi:10.3760/cma.j.cn112148-20230908-00143
7. Wang Z, Redeker NS, Walsh S, et al. Longitudinal transition of symptom cluster profiles among community-dwelling older adults with heart failure. Nurs Res. 2024;2024:10–97.
8. Ye Y, Mei J, Zhang J, Zhao Q, Fan X. The heterogeneity of physical and anxiety symptoms and quality of life among patients with heart failure: a latent class analysis. J Cardiovasc Nurs. 2022;37(6):558–569. doi:10.1097/JCN.0000000000000867
9. Yu DS, Li PW, Chong SO. Symptom cluster among patients with advanced heart failure: a review of its manifestations and impacts on health outcomes. Curr Opin Support Palliat Care. 2018;12(1):16–24. doi:10.1097/SPC.0000000000000316
10. Lenz ER, Pugh LC, Milligan RA, Gift A, Suppe F. The middle-range theory of unpleasant symptoms: an update. ANS Adv Nurs Sci. 1997;19(3):14–27. doi:10.1097/00012272-199703000-00003
11. Park J, Moser DK, Griffith K, Harring JR, Johantgen M. Exploring symptom clusters in people with heart failure. Clin Nurs Res. 2019;28(2):165–181. doi:10.1177/1054773817729606
12. Santos GC, Liljeroos M, Dwyer AA, et al. Symptom perception in heart failure: a scoping review on definition, factors and instruments. Eur J Cardiovasc Nurs. 2020;19(2):100–117. doi:10.1177/1474515119892797
13. Borsboom D, Cramer AO. Network analysis: an integrative approach to the structure of psychopathology. Annu Rev Clin Psychol. 2013;9:91–121. doi:10.1146/annurev-clinpsy-050212-185608
14. Hofmann SG, Curtiss J, McNally RJ. A complex network perspective on clinical science. Perspect Psychol Sci. 2016;11(5):597–605. doi:10.1177/1745691616639283
15. Fried EI, Boschloo L, van Borkulo CD, et al. Commentary: “consistent superiority of selective serotonin reuptake inhibitors over placebo in reducing depressed mood in patients with major depression”. Front Psychiatry. 2015;6:117. doi:10.3389/fpsyt.2015.00117
16. Papachristou N, Barnaghi P, Cooper B, et al. Network analysis of the multidimensional symptom experience of oncology. Sci Rep. 2019;9(1):2258. doi:10.1038/s41598-018-36973-1
17. Zambroski CH, Moser DK, Bhat G, Ziegler C. Impact of symptom prevalence and symptom burden on quality of life in patients with heart failure. Eur J Cardiovasc Nurs. 2005;4(3):198–206. doi:10.1016/j.ejcnurse.2005.03.010
18. Epskamp S, Fried EI. A tutorial on regularized partial correlation networks. Psychol Methods. 2018;23(4):617–634. doi:10.1037/met0000167
19. Zhu Z, Sun Y, Kuang Y, et al. Contemporaneous symptom networks of multidimensional symptom experiences in cancer survivors: a network analysis. Cancer Med. 2023;12(1):663–673. doi:10.1002/cam4.4904
20. He Y, Li Q, Hu Q, Liu L. Transfer learning in high-dimensional semiparametric graphical models with application to brain connectivity analysis. Stat Med. 2022;41(21):4112–4129. doi:10.1002/sim.9499
21. Ralph-Nearman C, Williams BM, Ortiz AML, Smith AR, Levinson CA. Pinpointing core and pathway symptoms among sleep disturbance, anxiety, worry, and eating disorder symptoms in anorexia nervosa and atypical anorexia nervosa. J Affect Disord. 2021;294:24–32. doi:10.1016/j.jad.2021.06.061
22. Robinaugh DJ, Millner AJ, McNally RJ. Identifying highly influential nodes in the complicated grief network. J Abnorm Psychol. 2016;125(6):747–757. doi:10.1037/abn0000181
23. Epskamp S, Borsboom D, Fried EI. Estimating psychological networks and their accuracy: a tutorial paper. Behav Res Method. 2018;50(1):195–212. doi:10.3758/s13428-017-0862-1
24. Xu M, Ruan T, Huang X, et al. Care-seeking delay of patients with heart failure in China: a mixed-method study. ESC Heart Fail. 2024;11(4):2086–2099. doi:10.1002/ehf2.14757
25. Yang M, Kondo T, Adamson C, et al. Impact of comorbidities on health status measured using the Kansas City cardiomyopathy questionnaire in patients with heart failure with reduced and preserved ejection fraction. Eur J Heart Fail. 2023;25(9):1606–1618. doi:10.1002/ejhf.2962
26. Walthall H, Floegel T, Boulton M, Jenkinson C. Patients experience of fatigue in advanced heart failure. Contemp Nurse. 2019;55(1):71–82. doi:10.1080/10376178.2019.1604147
27. Han S, Zhang Y, Yang X, et al. Exploring core mental health symptoms among persons living with HIV: a network analysis. Front Psychiatry. 2023;14:1081867. doi:10.3389/fpsyt.2023.1081867
28. Guidotti E, Pennucci F, Valleggi A, De RS, Passino C. A longitudinal assessment of chronic care pathways in real-life: self-care and outcomes of chronic heart failure patients in Tuscany. BMC Health Serv Res. 2022;22(1):1146. doi:10.1186/s12913-022-08522-0
29. Joho S, Ushijima R, Akabane T, Hirai T, Inoue H. Restrictive lung function is related to sympathetic hyperactivity in patients with heart failure. J Card Fail. 2017;23(2):96–103. doi:10.1016/j.cardfail.2016.06.001
30. Lepor NE, McCullough PA. Differential diagnosis and overlap of acute chest discomfort and dyspnea in the emergency department. Rev Cardiovasc Med. 2010;11(Suppl 2):S13–23. doi:10.3909/ricm11S2S0006
31. Wibring K, Herlitz J, Christensson L, Lingman M, Bång A. Prehospital factors associated with an acute life-threatening condition in non-traumatic chest pain patients - A systematic review. Int J Cardiol. 2016;219:373–379. doi:10.1016/j.ijcard.2016.06.066
32. Levenson JW, McCarthy EP, Lynn J, Davis RB, Phillips RS. The last six months of life for patients with congestive heart failure. J Am Geriatr Soc. 2000;48(S1):S101–109. doi:10.1111/j.1532-5415.2000.tb03119.x
33. Goodlin SJ, Wingate S, Albert NM, et al. Investigating pain in heart failure patients: the Pain Assessment, Incidence, and Nature in Heart Failure (PAIN-HF) study. J Card Fail. 2012;18(10):776–783. doi:10.1016/j.cardfail.2012.07.007
34. Chin MH, Goldman L. Factors contributing to the hospitalization of patients with congestive heart failure. Am J Public Health. 1997;87(4):643–648. doi:10.2105/AJPH.87.4.643
35. Boriani G, Laroche C, Diemberger I, et al. Asymptomatic atrial fibrillation: clinical correlates, management, and outcomes in the EORP-AF pilot general registry. Am J Med. 2015;128(5):509–518. doi:10.1016/j.amjmed.2014.11.026
36. Sonaglioni A, Grasso E, Nicolosi GL, Lombardo M. Modified Haller Index is inversely associated with asymptomatic status in atrial fibrillation patients undergoing electrical cardioversion: a preliminary observation. Minerva Cardiol Angiol. 2024;72(2):190–203. doi:10.23736/S2724-5683.23.06446-3
 © 2025 The Author(s). This work is published and licensed by Dove Medical Press Limited. The
full terms of this license are available at https://www.dovepress.com/terms
and incorporate the Creative Commons Attribution
- Non Commercial (unported, 4.0) License.
By accessing the work you hereby accept the Terms. Non-commercial uses of the work are permitted
without any further permission from Dove Medical Press Limited, provided the work is properly
attributed. For permission for commercial use of this work, please see paragraphs 4.2 and 5 of our Terms.
© 2025 The Author(s). This work is published and licensed by Dove Medical Press Limited. The
full terms of this license are available at https://www.dovepress.com/terms
and incorporate the Creative Commons Attribution
- Non Commercial (unported, 4.0) License.
By accessing the work you hereby accept the Terms. Non-commercial uses of the work are permitted
without any further permission from Dove Medical Press Limited, provided the work is properly
attributed. For permission for commercial use of this work, please see paragraphs 4.2 and 5 of our Terms.