")
Back to Journals » International Journal of Nanomedicine » Volume 18
Simple and Ultrasensitive Detection of Glioma-Related ctDNAs in Mice Serum by SERS-Based Catalytic Hairpin Assembly Signal Amplification Coupled with Magnetic Aggregation
Authors Wang Y, Yang Y, Cao X, Liu Z, Chen B, Du Q, Lu X
Received 14 March 2023
Accepted for publication 5 June 2023
Published 14 June 2023 Volume 2023:18 Pages 3211—3230
DOI https://doi.org/10.2147/IJN.S410080
Checked for plagiarism Yes
Review by Single anonymous peer review
Peer reviewer comments 2
Editor who approved publication: Dr Yan Shen
Youwei Wang,1,* Yang Yang,2,* Xiaowei Cao,3 Zhensheng Liu,4 Bing Chen,5 Qiu Du,1,* Xiaoxia Lu6,*
1Department of Neurosurgery, The Affiliated Hospital of Yangzhou University, Yangzhou, Jiangsu Province, People’s Republic of China; 2Department of Clinical Laboratory, The Affiliated Hospital of Yangzhou University, Yangzhou, Jiangsu Province, People’s Republic of China; 3Institute of Translational Medicine, Medical College, Yangzhou University, Yangzhou, Jiangsu Province, People’s Republic of China; 4Department of Interventional Radiology, The Affiliated Hospital of Yangzhou University, Yangzhou, Jiangsu Province, People’s Republic of China; 5Department of neurosurgery, The Affiliated hospital of Qingdao University, Qingdao, Shandong Province, People’s Republic of China; 6Department of Oncology, The Affiliated Hospital of Yangzhou University, Yangzhou, Jiangsu Province, People’s Republic of China
*These authors contributed equally to this work
Correspondence: Xiaoxia Lu, Department of oncology, The Affiliated Hospital of Yangzhou University, Yangzhou, Jiangsu Province, People’s Republic of China, Tel +86 514-82981199, Email [email protected] Qiu Du, Department of neurosurgery, The Affiliated Hospital of Yangzhou University, Yangzhou, Jiangsu Province, People’s Republic of China, Tel +86 514-82981199, Email [email protected]
Purpose: Circulating tumor DNA (ctDNA) is more representative and accurate than biopsy and is also conducive to dynamic monitoring, facilitating accurate diagnosis and prognosis of glioma. Therefore, the present study aimed to establish and validate a novel amplified method for the detection of IDH1 R132H and BRAF V600E, which were associated with the genetic diagnosis of glioma.
Patients and Methods: A dual-signal amplification method based on magnetic aggregation and catalytic hairpin assembly (CHA) was constructed for the simultaneous detection of ctDNAs. When target ctDNAs are present, the CHA reaction is initiated and leads to the assembly of Au-Ag nanoshuttles (Au-Ag NSs) onto magnetic beads (MBs). Further enrichment of MBs under an external magnetic field facilitated the dual-signal amplification of SERS.
Results: The limit of detection (LOD) for IDH1 R132H and BRAF V600E in serum was as low as 6.01 aM and 5.48 aM. The reproducibility and selectivity of the proposed SERS analysis platform was satisfactory. Finally, the platform was applied to quantify IDH1 R132H and BRAF V600E in the serum of subcutaneous-tumor‑bearing nude mice, and the results obtained by SERS were consistent with those from quantitative real-time polymerase chain reaction (qRT-PCR).
Conclusion: The present study showed that the dual-signal amplification method is a simple and ultrasensitive strategy for gliomas-associated ctDNAs detection, which is crucial for early diagnosis and dynamic monitoring.
Keywords: circulating tumor DNA, Au-Ag nanoshuttles, magnetic beads, catalytic hairpin assembly, surface-enhanced Raman spectroscopy
Introduction
Glioma is one of the most prevalent and deadly tumors, accounting for more than 70% of all primary malignant brain tumors.1 Numerous genomic alterations associated with glioma heterogeneity contribute to the dysregulation of various signaling pathways and tumorigenesis.2–4 One of the most important genetic mutation commonly found in gliomas is IDH,5,6 which has significant clinical value for prognosis and personalized targeted therapy.7 IDH1 Arg 132 (R132H) is the most prevalent heterozygous mutation that overproduces D-(R)-2-hydroxyglutarate (2-HG), disrupting global cellular metabolism and resulting in better survival regardless of histology and grade.7 BRAF mutation is another prevalent and important oncogenic alteration in a wide spectrum of brain tumors, including in gliomas.8 The most prevalent BRAF mutation is a substitution of valine to glutamic acid at codon 600 (V600E), which accounts for 70–88% of all BRAF mutations.9 The presence of IDH1 Arg 132 (R132H) portends a favorable outcome of prolonged median survival,10,11 and targeted therapy aimed at inhibiting BRAF V600E has shown promising therapeutic outcomes.8,9 Thus, identifying IDH1 R132H and BRAF V600E is of great significance for predicting prognosis and guiding accurate treatment.
Although cerebrospinal fluid (CSF) is regarded as the most valuable specimen for identifying glioma biomarkers,12 the invasive procedure to obtain the sample is risky and complex. In fact, the relevant biomarkers could be released into blood from blood-brain barrier (BBB), which was disrupted in brain-derived diseases such as traumatic brain injury13 and gliomas.14,15 Circulating tumor DNAs (ctDNAs) in the peripheral circulation harbor tumor-specific genetic alterations and can accurately reflect the dynamics of mutational status.16–18 Analyzing mutations carried by ctDNA faces various challenges, including complex biological environments, short half-lives, and low concentrations.19 Thus, the technical requirements are extremely demanding. So far, new technologies like droplet-based digital PCR (ddPCR) and tailored types of next-generation sequencing (NGS) have been used for ctDNA mutation detection.17,20 Bettegowda et al21 employed dPCR to identify ctDNA in various cancers and ctDNA was only found in <10% of glioma patients. A recent study22 applied a highly sensitive and specific NGS panel to examine plasma samples from 222 GBM patients and discovered that 55% of them had ctDNA mutations. Obviously, different detection sensitivities may yield different results. Thus, a rapid, simple, and ultrasensitive approach is urgently needed to address the limitations of the current techniques such as complicated operating procedures, expensive specialized equipment, long detection time, and low sensitivity.
In recent years, surface-enhanced Raman spectroscopy (SERS)-based optical biosensors have become one of the most promising tools for biomedical analysis and gained remarkable attention.23,24 SERS is a physical phenomenon in which Raman scattering from the surface of specific noble metal nanoparticles is enhanced when excited by laser light.25,26 The SERS-based sensing technique can provide molecular fingerprint vibrational spectra27 of Raman reporters labelled on a probe, allowing for exact ctDNA identification or simultaneous detection of multiple ctDNAs in complex biological samples. So far, various SERS-based strategies are performed to detect miRNAs and proteins, which are closely associated with tumors. Li et al28 achieved simultaneous quantitative detection of p21 mRNA and miRNA 21 in cancer cells using magnetic SERS nanotags. Based on the low-cost and sensitive method, the LOD of p21 mRNA and miRNA 21 were 0.12 fM and 0.17 fM, respectively. Medetalibeyoglu’s29 team presented a novel SERS-based sandwich type immunosensors for detecting carcinoembryonic antigen (CEA). The result showed that the novel immunosensor exhibited excellent selectivity and sensitivity for the recognition of CEA in plasma, which could facilitate the real-time monitoring of malignant tumors. SERS sensitivity is mainly attributed to Raman signal amplification arising from “hot spots” areas, which are generated at the nanometer gaps between adjacent nanoparticles or around the edges and vertices of isolated nanoparticles.30 The aggregated “hot spots” increase the sensitivity of SERS detection by 10–14 orders of magnitude compared to conventional Raman spectroscopy.31 Au-Ag nanoshuttles (Au-Ag NSs) show promising prospects for practical detection.32,33 Firstly, Au-AgNSs shell contributes to better chemical stability34 and higher electric field enhancement at the “hot spots” compared to pure Au or Ag nanoparticles.35 Secondly, Au-AgNSs are arrow-headed tips at both ends, which promote the formation of “hot spots.”32 Moreover, Au-AgNSs have easy fabrication, low synthesis cost, and mild synthesis conditions.30,33 Apart from the above, a reproducible and standardized substrate is indispensable for the construction of SERS-based biosensing platforms. However, SERS-active planar substrates are cumbersome to fabricate and have some limitations in application due to the two-dimensional (2-D) configurations.36 Recently, the combination of magnetic bead (MB) technology and SERS analysis solved the aforementioned problems. The 3-D structure of MB has a larger exterior surface-to-volume ratio, which improves the loading density of capture probes by reducing the steric effect.37 MBs can freely diffuse three-dimensionally in solution to achieve sufficient mixing and efficient capture of target molecules.38 Under the fields of external magnetic, MBs can be separated and eluted rapidly, avoiding tedious washing steps and reducing incubation time.39
Despite the fact that numerous SERS-based nucleic acid assays have been developed, more sensitive and feasible SERS sensing approaches are urgently needed to accomplish ultra-sensitive detection of low-concentration ctDNA in peripheral blood. Several signal amplification strategies have been introduced for the sensitivity analysis of biomarkers. Among these strategies, the toehold-mediated strand displacement (TMSD) reaction has the characteristics of enzyme-free isothermal amplification and had been extensively applied to construct sensitive miRNA sensing platforms owing to its minimal equipment requirement and effective and rapid amplification. Catalytic hairpin assembly (CHA), as one of the most prominent TMSD reactions can obtain a hundred-fold signal amplification.40 In CHA, the introduction of an initiator triggers the assembly step between the initiator and a DNA hairpin. The initiator is replaced by another DNA hairpin during the subsequent disassembly step, forming a double-stranded DNA (dsDNA).41 Since one initiator can be continuously replaced and recycled to trigger a new reaction, a succession of dsDNA is generated, realizing signal amplification. Thus, by combining magnetic SERS probes with CHA amplification, it is expected to manufacture an analysis platform with excellent sensitivity and specificity for the simultaneous detection of IDH1 R132H and BRAF V600E.
Herein, a strategy based on SERS and dual-signal amplification (CHA and magnetic enrichment) was designed for the detection of glioma-related ctDNAs (IDH1 R132H and BRAF V600E) in an aqueous solution. Firstly, the first hairpin DNAs (HP1-1 and HP1-2) modified with sulfhydryl at the 5’-end and biotin at the 3’-end, and two Raman reporters (4-Mercaptobenzoic acid, 4-MBA, and Rhodamine 6G, R6G) were wrapped on Au-Ag NSs to prepare SERS probes (Au-AgNSs@4-MBA@HP1-1 and Au-AgNSs@R6G@HP1-2). Next, MBs decorated with the second hairpin DNAs (HP2-1 and HP2-2) acted as capture probes to capture Au-AgNSs for convenient separation. In the presence of IDH1 R132H (or BRAF V600E), HP1-1 (or HP1-2) on SERS probes was unfolded owing to the hybridization between the complementary regions of IDH1 R132H (or BRAF V600E) and the exposed toehold H1 and formed the Au-AgNSs@4-MBA@HP1-1@IDH1 R132H (Au-AgNSs@R6G@HP1-2@BRAF V600E) intermediate product. Subsequently, HP1-1 (or HP1-2) on SERS probes triggered another assembly reaction with HP2-1 (or HP2-2) on MBs, formatting the Au-AgNSs@4-MBA@HP1-1@ IDH1 R132H@HP2-1@MB (or Au-AgNSs@R6G@HP1-2@BRAF V600E@HP2-2@MB) complex. The toehold-mediated strand displacement reactions resulted in the release of IDH1 R132H (or BRAF V600E) and the formation of stable composite structures Au-AgNSs@4-MBA@HP1-1@ HP2-1@MB (or Au-AgNSs@R6G@HP1-2@ HP2-2@MB). The released IDH1 R132H (or BRAF V600E) initiated the next CHA cycle and finally formed numerous stable composite structures after many cycles. The amount of two SERS probes, incubation time, and other related experimental parameters were optimized to guarantee sufficient progress of CHA. Subsequently, the sensitivity, reproducibility, and specificity of the analysis platform were assessed. Finally, to verify the feasibility and accuracy of the proposed strategy, the concentrations of the two ctDNAs in subcutaneous-tumor‑bearing nude mice serum were quantified by quantitative real-time polymerase chain reaction (qRT-PCR) and SERS, respectively. Overall, this novel strategy that can dynamically monitor ctDNAs in serum shows significant clinical translational potential in glioma diagnosis and dynamic monitoring.
Materials and Methods
Cell Line and Animals
U87 glioma cell line was obtained from the Cell Bank of the Chinese Academy of Sciences. The cell line was fostered in DMEM medium (GIBCO) containing 10% fetal bovine serum (FBS) (GIBCO), 1% penicillin/streptomycin (Invitrogen) at 37°C with 5% CO2. Twenty specific pathogen-free nude mice (Jiangsu Huachuang Xinnuo Pharmaceutical Technology Co. Ltd. Provide, license No. SCXK (Su) 2020–0009) that weighed 15.7± 1.09 g and aged 5 weeks were maintained in an SPF sterile laminar flow chamber. Keep the indoor constant temperature (22–26°C) and humidity (55± 5%).
Animals and Subcutaneous-Tumor‑bearing Nude Mouse Model
All nude mice were anesthetized with sodium pentobarbital (60 mg/kg, intraperitoneal injection) and then disinfected with ethyl alcohol in the right back. Each mouse was injected with U87 cell suspension (1 × 10⁷ cells, 0.1 mL) into the subcutaneous tissue of the previously sanitized area, and thus constructed the subcutaneous-tumor-bearing nude mouse model. Tumor formation occurred about 5 d later. Tumor volume was measured with a vernier caliper every 3 d and calculated using the following formula: volume (mm3) = 0.5 × length × width2. According to the experimental protocol, mice were sacrificed at desired time points (7 d, 14 d, 21 d, and 28 d). The tumors were then excised from the sacrificed mice and weighed to evaluate tumor development. Collected tumors were fixed using 10% formaldehyde, followed by embedding in paraffin, sectioning, and hematoxylin–eosin (HE) staining. Peripheral blood samples were collected and individually labeled before sacrifice (0 d, 7 d, 14 d, 21 d, and 28 d). Subsequently, samples were centrifuged for 10 min at 3000 rcf at 4°C, and plasma fractions were stored at −80°C. All animal studies were approved by the Experimental Animal Ethics Committee of Yangzhou University (No.2020-FSYY-2). All procedures were performed in accordance with the Guide for Medical Experimental Animal Care and Use of Laboratory Animals.
Reagents
Chloroauric acid tetrahydrate (HAuCl4), hexadecyl trimethyl ammonium bromide (CTAB), sodium borohydride (NaBH4), silver nitrate (AgNO3), sodium oleate (NaOL), hydrochloric acid (HCl), ascorbic acid (AA), and absolute ethanol were obtained from Yangzhou Feichang Chemicals Co. Ltd (China). Bovine serum albumin (BSA), rhodamine 6g (R6G), 4-Mercaptobenzoic acid (4-MBA) 1-ethyl-3-(3-dimethylaminopropyl) carbodiimide (EDC), N-hydroxysuccinimide (NHS), tris-2-carboxyethyl phosphine (TCEP) were purchased from Shanghai Aladdin Biochemical Technology Co., Ltd. Magnetic bead (MB) was obtained from Sigma-Aldrich Co., Ltd. TRIzol and PrimeScript RT Master Mix were purchased from Life Technologies, Carlsbad, CA, and TaKaRa, Dalian, China, respectively. Hieff® qPCR SYBR Green Master Mix was obtained from Yeasen, Shanghai, China. Ethidium bromide (EB), agarose gel, super stain dye solution, DNA marker, and 5X loading buffer were purchased from Jiangsu Kangwei Century Biotechnology Co. Ltd (China). Milli-Q water (Millipore, USA, resistivity 4 18 M) was used for all experiments. All oligonucleotide sequences listed in Table 1, including target ctDNAs (IDH1R132H and BRAF V600E), hairpin DNAs (HP1-1, HP1-2, HP2-1, and HP2-2), base mismatch sequences (MT1-1, MT1-2, MT3-1, MT3-2, and random sequences), and primers (IDH R132H forward primer, IDH R132H reverse primer, BRAF V600E forward primer, and BRAF V600E reverse primer) were acquired from GENEWIZ (Suzhou, China).
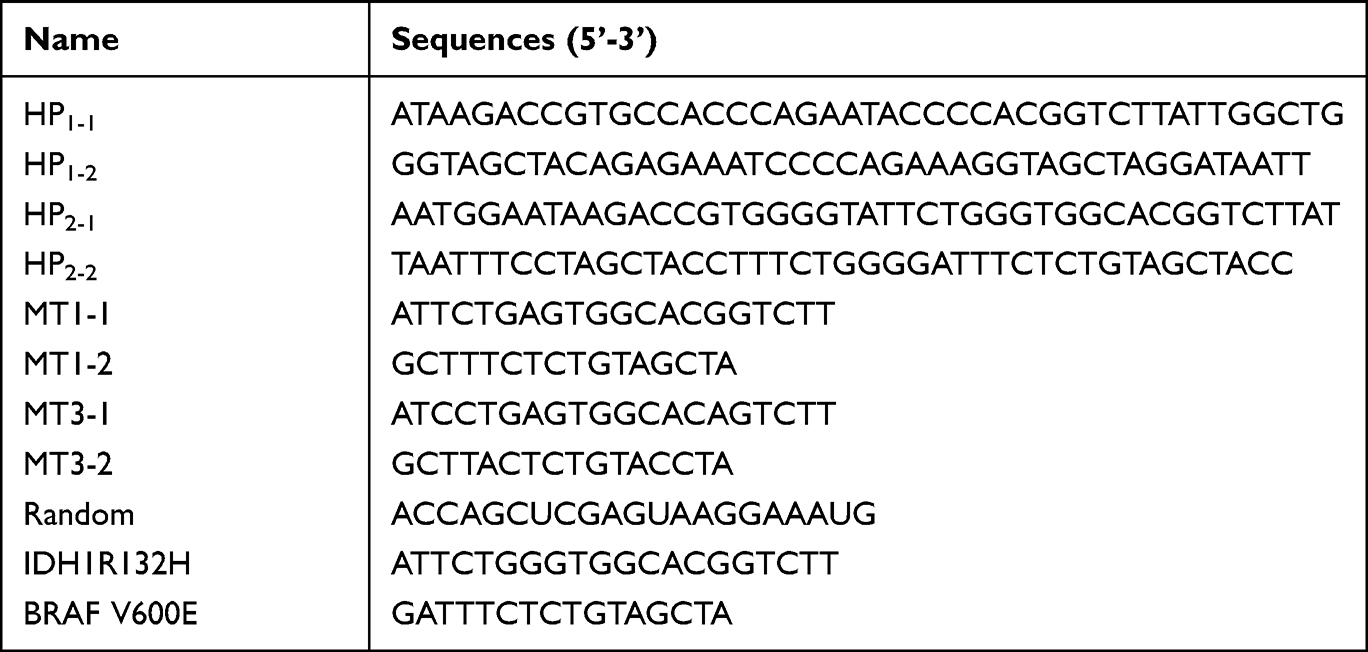 |
Table 1 Sequences of Oligonucleotides Used in the Experiment |
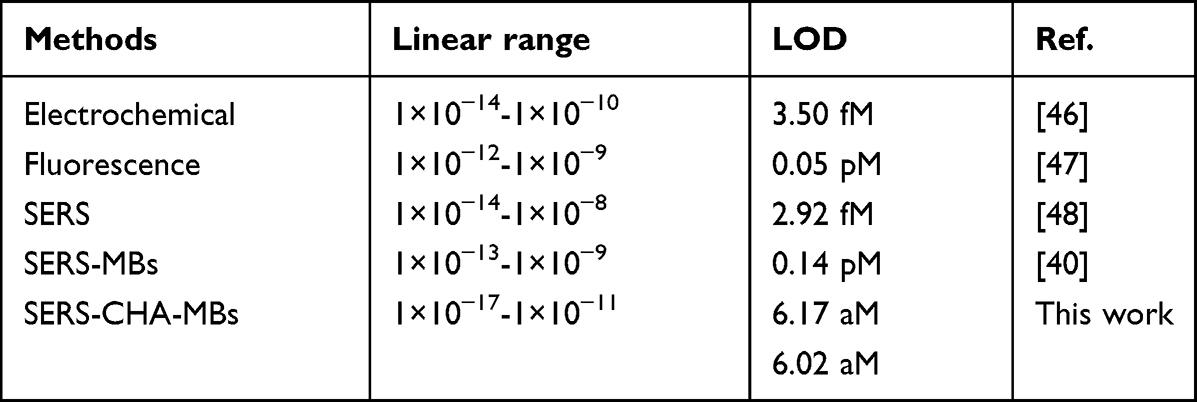 |
Table 2 Comparison of the Proposed SERS Analysis Platform with Other Methods |
Quantitative Real-Time Polymerase Chain Reaction (qRT-PCR)
Total ctDNAs were extracted from the plasma with TRIzol according to the manufacturer’s protocol, and the ctDNA concentrations were detected by an ultramicro spectrophotometer (Thermo Fisher Scientific), which was then reverse-transcribed into cDNA using PrimeScript RT Master Mix (TaKaRa, Dalian, China). Hieff® qPCR SYBR Green Master Mix in a CFX96 Touch Real-Time PCR Detection System (Bio-Rad Laboratories, Inc., Hercules, CA, USA) was used to perform qRT-PCR. The sequences of the primers used for the qRT-PCR experiments are shown as follows: IDH R132H forward primer 5’-CATTAGACGCCAGCCAGTCG-3’ and IDH R132H reverse primer 5’-ATCTCCACCACAGAACCTCCT-3’; BRAF V600E forward primer 5’-ATTGGATCTGGGTCATTTGG-3’; BRAF V600E reverse primer 5’-TGCCAGTTGTGGCTTTGTAG-3’.
Agarose Gel Electrophoresis (PAGE)
Firstly, a 2.5% agarose gel is prepared: 1 g of agarose is added to 40 mL of 5×TAE buffer and heated in a microwave oven. Then, drop 2 µL of ethidium bromide (10 mg/mL) and mix the gel solution thoroughly by swirling gently. Secondly, pour the agarose solution into the gel mold and wait 30 min for it to completely solidify. In each well, 7 μL of the samples and 3 μL of bromophenol blue gel loading buffer are loaded. Then, electrophoresis is carried out in 1× TAE buffer for 70 min at 120 V. Finally, visualize and photograph the samples in the agarose gel.
Synthesis of Au-Ag NSs
The fabrication of Au-AgNSs started with the preparation of Au nanorods (NRs). Au NRs were synthesized by the binary surfactant assistant, seed-growth method proposed by Ye et al.42 Firstly, newly prepared, ice-cold NaBH4 solution (0.6 mL, 10 mM) was added into a solution consisting of CTAB (9.9 mL, 0.1 M) and HAuCl4 (0.1 mL, 25 mM), followed by stirring (700 rcf, 2 min). The resulting solution was aged for 2 h at 30°C to obtain the gold seed solution. Secondly, a 100 mL solution made by combining 0.037 M CTAB and 0.078 M NaOL was mixed with AgNO3 (1.44 mL, 10 mM) and HAuCl4 (2 mL, 25 mM). Then, the above solution was kept stirred at 700 rcf (30°C) for 90 min. After that, Au NR growth solution was obtained by introducing 0.42 mL hydrochloric acid (37%) and 0.16 mL freshly prepared AA (0.1 M) and keeping stirring for 5 min. Finally, 0.08 mL gold seed solution was injected into the Au NR growth solution and left undisturbed overnight at 30°C for NR growth. The as-prepared Au NRs were centrifuged at 10,000 rcf for 15 min twice, then the purified Au NRs were redissolved in an equal volume of CTAB (0.1 M) for further use. Thirdly, 5 mL solution from the previous step was first mixed with AA (5 mL, 0.2 M) and NaOH (30 µL, 2 M). Added additional HAuCl4 (40 µL, 25 mM) and AgNO3 (0.2 mL, 10 mM) with vigorous stirring and then incubated at room temperature. 0.2 mL of AA (0.1 M) was added, and the reaction mixture was aged for 1 h after stirring for 30 s to prepare Au-AgNSs. Finally, the mixture was centrifuged (7500 rcf, 10 min) to remove excess reactants. The Au-AgNSs were redispersed with ultrapure water and stored at 4°C.
Preparation of SERS Probes
The preparation process of SERS probes (Au-AgNSs@4-MBA@HP1-1 and Au-AgNSs@R6G@HP1-2) is illustrated in Figure 1B. The steps were as follows: (1) 4-MBA (100 μL, 1 mM) or R6G (100 μL, 1 mM) alcohol solutions were thoroughly mixed with 5 mL of Au-AgNSs solution. Raman reporter 4-MBA and R6G can be attached to the surface of Au-AgNSs after 2 h incubation at room temperature.43 Then, the prepared Au-AgNSs@4-MBA (Au-AgNSs@R6G) were purified to remove excess Raman reporters. (2) 60 μL of the first hairpin DNA (HP1-1 and HP1-2) (0.1 M) was added to 80 μL newly prepared tris-2-carboxyethyl phosphine (TCEP) buffer (1 mM) for 1 h, which could activate HP1-1 and HP1-2. Then, the activated HP1-1 (and HP1-2) were mixed with 2 mL Au-AgNSs@4-MBA (and Au-AgNSs@R6G) for 12 h. Following that, the resulting solution was dispersed in 40 µL BSA solution (1 wt%) and incubated for 60 min to eliminate nonspecific binding. Finally, a purification process (9000 rcf, 15 min) was performed, and the produced SERS probes were dispersed in PBS buffer.
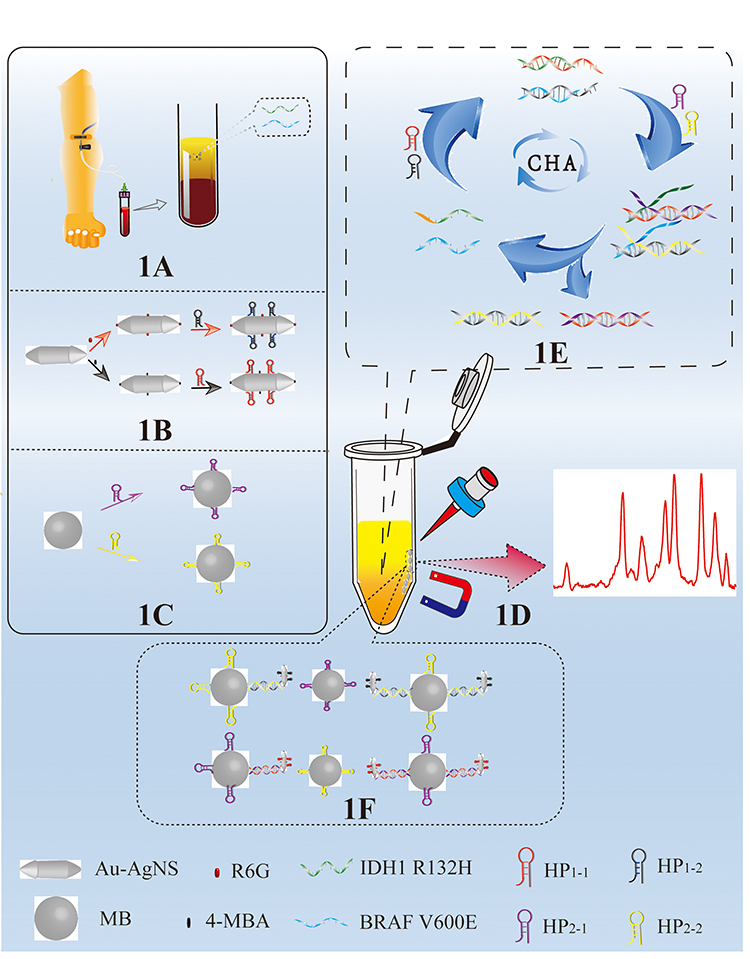 |
Figure 1 The principle of ctDNAs detection by SERS assisted with dual-signal amplification. (A) Peripheral blood was centrifuged to obtain target ctDNAs (B) fabrication processes of two SERS probes (R6G-labeled and HP1-2 -coupled Au-Ag NSs, 4-MBA-labeled and HP1-1 -coupled Au-Ag NSs) (C) the synthesis procedure of two capture probes (HP2-1 and HP2-2 decorated MBs) (D) numerous MBs and composite structures (Au-AgNSs@4-MBA@HP1-1@IDH1 R132H@HP2-1@MB (or Au-AgNSs@R6G@HP1-2@BRAF V600E@HP2-2@MB) were magnetically enriched (E) the process of CHA signal amplification (F) SERS detection. |
Formation of Capture Probes
The capture probes (MBs@HP2-1 and MBs@HP2-2) were obtained by decorating MBs with the second hairpin DNAs (HP2-1 and HP2-2), which is described in Figure 1C. Firstly, 0.02 g of MBs were accurately weighed and dissolved into 40 mL absolute ethanol to obtain a concentration of 0.5 mg/mL. Measured out 500 µL of MBs into a test tube and added 470 µL of PBS buffer (10 mM) to make a suspension. The purified MBs solution was obtained by repeated washing with the aid of an external magnet. Then, EDC (250 mL, 0.1 M) and NHS (250 mL, 0.1 M) were added to the resulting solution to activate the carboxyl groups of MBs, and the MBs were subsequently incubated with stirring (500 rcf, 30 min) at room temperature. To seal the surface sites of the MBs, 10 µL of 10 wt% BSA solution was dropped. After washing with PBS, MBs were redispersed in 1 mL PBS. Finally, TECP-activated hairpin DNA (HP2-1 and HP2-2) was added and followed by incubation for 12 h at 37°C to prepare the capture probes. The resultant mixture was washed three times to remove excess impurities and dispersed in a PBS buffer for future use.
SERS Measurement
The quantitative detection process of target ctDNAs was performed as follows: 10 µL diluted serum sample solution was pipetted into a mixture containing 9 µL of SERS probes and 7 µL of capture probes. The final mixtures were incubated for 40 min, with gentle shaking at 40°C. Then, the reaction complexes were collected by magnetic separation and the supernatant was discarded. 30 µL PBS buffer solution was added and mixed thoroughly. The external magnetic field was applied again to enrich the reaction complexes and used to perform SERS measurements. The laser wavelength was 785 nm, the exposure time was 10 s, and the power was 5 mW. For each sample, nine spectral values were obtained by repeating the experiment three times at three different sites. The final values were obtained by averaging these spectrum values, guaranteeing the representativeness and accuracy of the results. The spectra were collected from 700 to 1800 cm−1 with a spectral resolution of 3 cm−1. All data were analyzed using SPSS Statistics software 21.0 (Chicago, IL, USA), and a difference is considered to be statistically significant when P < 0.05.
Characterization
The UV–visible absorption spectra were obtained from a UNICO 2100 PC UV–Vis spectrophotometer (Japan). All Raman spectra were recorded with a Renishaw InVia Raman Microscope Spectrometer (UK) with excitation at 785 nm and 50 × objective lens. The WiRETM software of Renishaw was used for Raman system operation and data acquisition. To repress the background noises of instrument, smoothing and baseline correction were applied. Tecnai 12 transmission electron microscope (Philips) was used to achieve the transmission electron microscopy (TEM) images of Au-AgNSs and MBs, operating at an accelerating voltage of 60 kV. S-4800 II field-emission scanning electron microscope (Hitachi) was applied for the scanning electron microscopy (SEM) images of Au-AgNSs and MBs, operating at 1.0 kV. The selected area electron diffraction (SAED) images and high-resolution TEM (HRTEM) were obtained with a Tecnai G2 F30 S-Twin TEM (FEI) at 200 kV.
Results and Discussion
The Principle of ctDNAs Detection by SERS Assisted with Dual-Signal Amplification
The SERS-based dual-signal amplification strategy for rapid and ultrasensitive detection of ctDNAs simultaneously is illustrated in Figure 1. The initial preparatory work was the construction of SERS probes and capture probes. Firstly, SERS probes were constructed as follows: both 4-MBA, HP1-1, and HP1-2 could be modified onto the surface of Au-AgNSs via Ag-S bond, while another Raman reporter R6G chemisorbed on Au-AgNSs surface via its two ethylamine groups (Figure 1B).44 Secondly, the interaction between sulfhydryl groups on the second hairpin DNAs (HP2-1 and HP2-2) and the activated carboxyl groups on MBs surface facilitate the formation of capture probes (Figure 1C). In the absence of target ctDNAs, the complementary sequences in hairpin DNAs are trapped within the secondary structure, which avoids hybridization with other sequences and maintains a “steady state” condition. The target ctDNAs in peripheral blood (Figure 1A) broke the “steady state”, take IDH1 R132H for example, the hybridization between HP1-1 and IDH1 R132H exposed the hidden toehold in the stem of HP1-1, which allowed the corresponding capture probe HP2-1 to be recognized and initiated the displacement of IDH1 R132H with HP2-1, forming a stable HP1-1/HP2-1 duplex. The released IDH1 R132H triggered the following cycle, which ultimately resulted in the anchoring of the SERS probes onto MBs, achieving the first signal amplification (Figure 1E). In the presence of external magnets, the composite structures containing numerous Au-AgNSs and MBs were magnetically enriched (Figure 1D), causing the further enrichment of Au-AgNSs and enhancing the SERS signal once again. Ultimately, Raman detection was performed on the composite structures aggregated on the side wall of the test tube (Figure 1F), and the specific genetic mutations of glioma could be attained by analyzing the SERS intensity of Raman reporters.
Characterization of Au-AgNSs and SERS Probes
The morphology and structure of the as-prepared Au-AgNSs were characterized by SEM and TEM images. Figure 2A indicates that Au-AgNSs had complete structure and uniform size. All of them had two arrow-headed tips at the ends and exhibited long spindle-shaped morphology. As shown in Figure 2B, the average length of the Au-AgNSs particles was about 110 nm and the width was 35 nm. The HRTEM image (Figure 2C) was conducted to determine the crystalline structure of the Au-AgNSs. The right inset image of Figure 2C indicates that the interplanar spacing of the shell displayed was 0.209 nm, which was attributed to the {100} planes of Au. To further characterize its crystal structure, the SAED image in the left inset image of Figure 2C was taken. Initially, Ag atoms grow in random directions on the surface of Au NRs. Due to the stronger interaction with CTAB, the {110} facets of Au NRs were less accessible for growth, which lead to preferential growth on the {100} and {111} planes. This anisotropic overgrowth generated the arrowhead structure in Au-AgNSs. Energy-dispersive X-ray spectroscopy (EDS) elemental mapping was performed to further investigate the distribution of gold and silver elements in Au-AgNSs. Figure 2D shows the HAADF-STEM image, which made sure that the structure of Au-AgNS was long spindle-shaped morphology. Figure 2E and F displayed that the shell around the Au NR was composed of Au-Ag alloy structure, which had been proven to further enhance the localized SPR and possess better thermodynamic stability.33,45 The EDX image of Au-AgNS in Figure 2G clearly revealed that Au-AgNS was made of Au and Ag. The UV-vis-NIR absorption spectrum of Au-AgNSs (Figure 2H) exhibits a transverse absorption peak at 501 nm and a longitudinal absorption peak at 797 nm, respectively.33 To study the SERS-enhancing effect of Au-AgNSs, the SERS spectra of the two Raman reporters (4-MBA/R6G)-labeled Au-AgNSs are described in Figure 2I. It could be found that the SERS spectra of 4-MBA and R6G showed evident fingerprint characteristics. The two Raman peaks of 4-MBA molecules located at 1078 cm−1 and 1585 cm−1 are ascribed to the aromatic ring breathing mode. The Raman peaks of R6G located at 612 cm−1, 774 cm−1, 1185 cm−1, 1311 cm−1, 1362 cm−1, 1507 cm−1, and 1649 cm−1 were assigned to the C-C-C torus in-plane vibration, the C-H out of plane bending mode, the C-H in-plane bending mode, and aromatic C-C tensile vibration, respectively.43 The quantitative analysis of IDH1 R132H and BRAF V600E selected the characteristic peak of 4-MBA at 1078 cm−1 and the characteristic peak of R6G at 1362 cm−1. When 4-MBA and R6G were labeled on Au-AgNSs, stronger SERS signals were obtained. This indicated that the Au-AgNSs had a significant surface enhancement effect, which comes from the “hot spots” provided by the two tips of Au-AgNSs. The enhancement factor (AEF) of Au-AgNSs was calculated using the following formula: AEF = (ISERS/CSERS)/(IRS/CRS), where ISERS represents the intensity of SERS produced for the Au-AgNSs colloidal dispersion at a certain concentration (CSERS), whereas IRS denotes the Raman intensity acquired at the analyte concentration of CRS under non-SERS conditions. The SERS AEF of Au-AgNS was calculated to be 2.19×10⁵ when using CSERS = 10−6 M, CRS = 10−2 M. These findings suggested that Au-AgNSs had a significant SERS enhancement and was particularly suitable for measuring low concentrations of analytes. The preparation process of the SERS probes was characterized by UV-Vis-NIR absorption spectrum. As shown in Figure 2I, the pure Au-AgNSs exhibited a strong LSPR band at 789 nm. When 4-MBA and HP1-1 were assembled, a decrease in the LSPR band and a red shift to 794 nm and 803 nm were observed, which may be due to the coating of 4-MBA and HP1-1. The synthesis process of Au-AgNSs@R6G@HP2-1 was likewise.
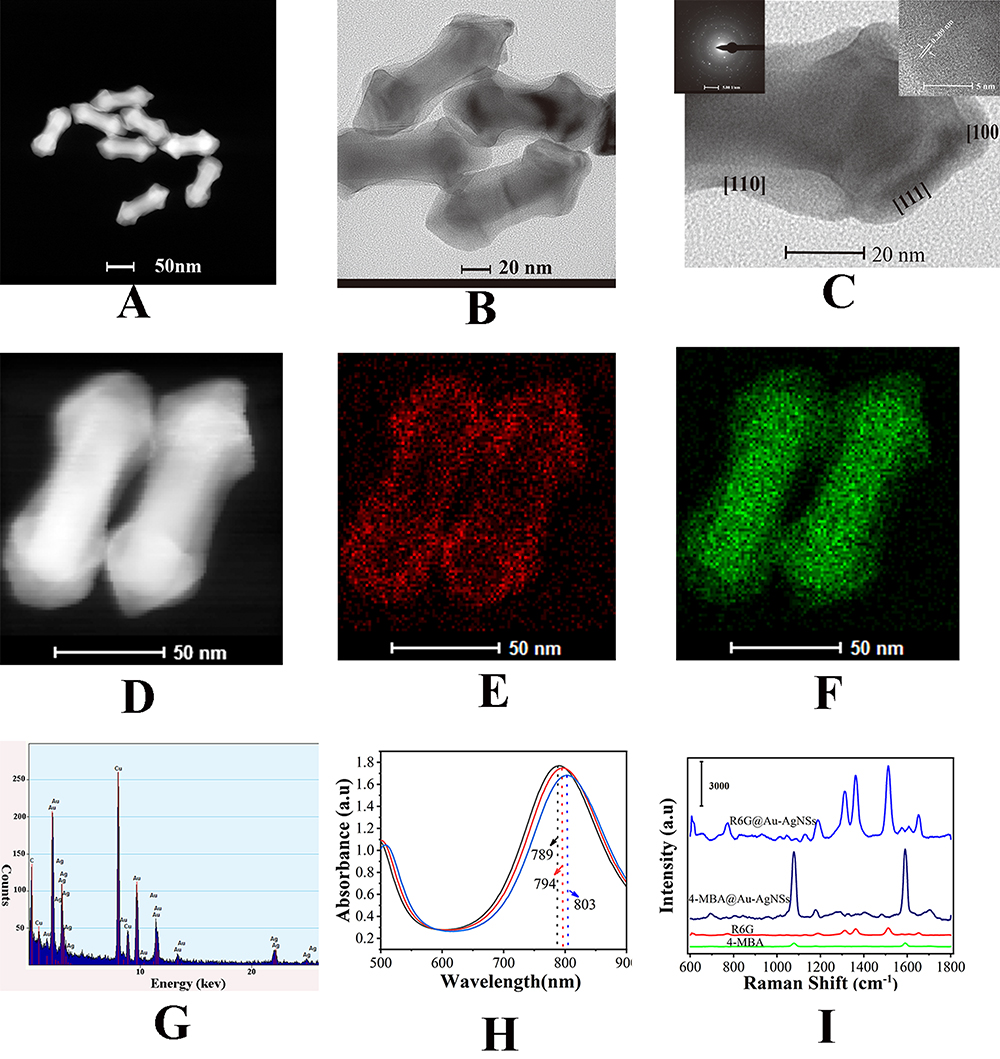 |
Figure 2 Characterization of Au-AgNSs (A) SEM image and (B) TEM image (C) Partially enlarged HRTEM and SAED image (the left inset image) (D) HAADF-STEM image (E) Au and (F) Ag elemental mapping of Au-AgNSs (G) EDX image of Au-AgNSs (H) UV–vis absorption spectrum of Au-AgNSs, Au-AgNSs@4-MBA and Au-AgNSs@4-MBA@HP1-1 (I) SERS spectra of 4-MBA, R6G, Au-AgNSs@R6G and Au-AgNSs@4-MBA. |
Characterization of MBs and Au-AgNSs@4-MBA@HP1-1-HP2-1@MBs and Au-AgNSs @R6G@HP1-2-HP2-2@MBs
SEM Figure 3A and TEM Figure 3C images were used to characterize the bare MB nanoparticles’ size and shape. The SEM and TEM images at high magnification (Figure 3B and D) exhibited a rough surface, which was suitable for modification with the second hairpin DNAs (HP2-1 and HP2-2). MB particles were almost spherical in shape with good dispersity and magnetic aggregation (the inset image of Figure S1) in aqueous conditions. The size distribution histogram of MBs was statistically obtained by analyzing the recorded TEM images (Figure S1), indicating that the used MBs had a uniform size distribution ranging from 400 to 500 nm in size.
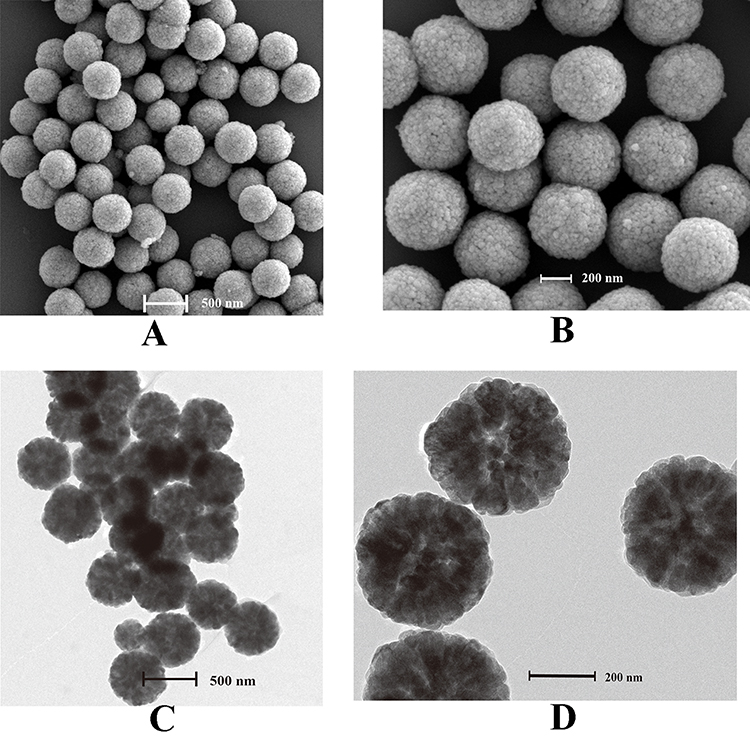 |
Figure 3 Characterization of MBs. SEM images of MBs at different magnification: (A) low magnification, (B) high magnification. TEM images of MBs at different magnification: (C) low magnification, and (D) high magnification. |
SERS composite structures (Au-AgNSs@4-MBA@HP1-1-HP2-1@MBs and Au-AgNSs @R6G@HP1-2-HP2-2@MBs) were the products of the CHA reaction between SERS probes and capture probes. As depicted in Figure 4A and B, Au-AgNSs were assembled on MBs, and Au-AgNSs could also be observed between adjacent MBs, suggesting that magnetic aggregation can lead to the enrichment of Au-AgNSs. Figure 4C shows a high-magnification TEM image of the composite product, which further demonstrated that Au-AgNSs can be aggregated in the gaps between adjacent MBs. The distribution of the elements in the composite products was revealed by element mapping images in Figure 4D–I, where the colors blue, purple, yellow, and red indicate the presence of Ag, Au, Fe, and O, respectively.
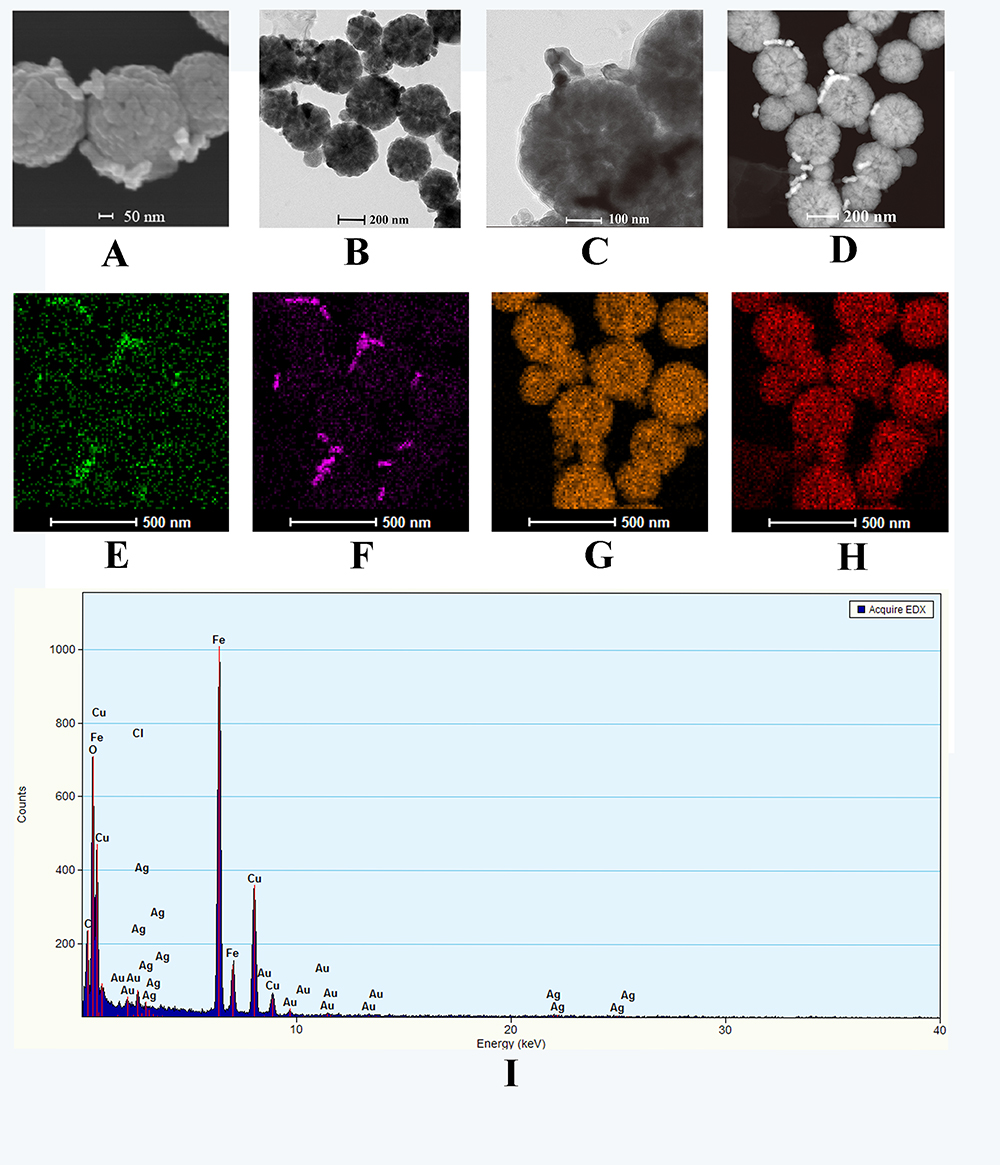 |
Figure 4 Characterization of composite products (Au-AgNSs@4-MBA@HP1-1@IDH1 R132H@HP2-1@MB (or Au-AgNSs@R6G@HP1-2@BRAF V600E@HP2-2@MB) (A) SEM image (B) TEM images at low magnification and (C) high magnification (D) HAADF-STEM image of composite products (E) Ag (F) Au (G) Fe (H) O (I) Elemental mapping images. |
Evaluation of Cross-Reactivity and Characterization of CHA Amplification
To evaluate the cross-reactivity between the two ctDNAs, 10 pM of IDH1 R132H was mixed with BRAF V600E at concentrations ranging from 10 aM to 10 pM. Figure 5 depicts the detected SERS intensities of the corresponding ctDNAs in EP tubes. The results revealed that the signal intensities of BRAF V600E showed a significant linear increase with increasing concentration of BRAF V600E, but the signal intensity of 10 pM IDH1 R132H maintained a consistent value. The results showed that the signal intensity of BRAF V600E showed a significant linear increase with increasing concentration of BRAF V600E, but the intensity variation for BRAF V600E at 10 pM exhibited consistent values. Therefore, no cross-reactivity was present between the two ctDNAs, which confirmed the feasibility of detecting IDH1 R132H and BRAF V600E simultaneously.
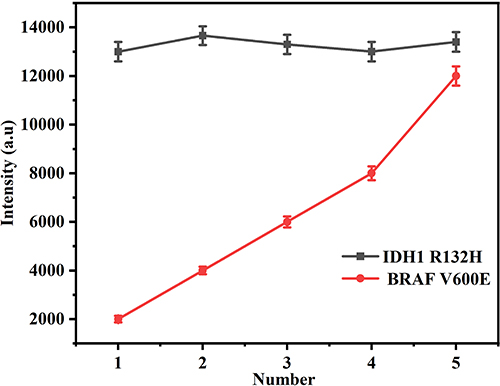 |
Figure 5 Evaluation of cross-reactivity. Line chart of SERS intensities at 1078 cm−1 and 1362 cm−1. The concentration of the applied sample solution: (1) 10 aM BRAF V600E +10 pM IDH1 R132H; (2) 100 aM BRAF V600E +10 pM IDH1 R132H; (3) 1 fM BRAF V600E +10 pM IDH1 R132H; (4) 10 fM BRAF V600E +10 pM IDH1 R132H; (5) 10pM BRAF V600E +10 pM IDH1 R132H. |
To analyze the feasibility of CHA amplification, PAGE was employed. As depicted in Figure 6A, lane 2, 3, and 4 displayed a single band, representing BRAF V600E (16 nt), HP1-2 (42 nt), and HP2-2 (42 nt), respectively. Lane 7 was the mixture of BRAF V600E and HP2-1, a new higher molecular weight band (58 nt) can be seen after incubation for 40 min. The molecular weight of new band lied between 25 bp and 50 bp band (lane 1), indicating that BRAF V600E could open and hybridized with HP2-1. As shown in lane 5, the band was almost identical to lane 3 or lane 4, revealing that no hybridization reaction happened between HP1-2 and HP2-2 in the absence of BRAF V600E. Two product bands appeared in lane 5, the upper one demonstrating the formation of a larger molecular weight complex (42 bp) and the lower one being unreacted HP1-2 or (and) HP2-2. Similarly, in Figure 6B, IDH1 R132H (20 nt), HP1-1 (43 nt), and HP2-1 (43 nt), displayed a single band (lanes 2, 3, and 4). In lane 6, the band exhibited similar electrophoretic mobility to lane 3 and lane 4, revealing HP1-1 and HP2-1 could coexist without hybridization. Lane 7 showed a mixture of IDH1 R132H and HP1-1. After incubation, a new band with a larger molecular weight (63 nt) than both was observed, indicating that the hairpin structure of HP1-1 was opened up and hybridized with IDH1 R132H. When HP2-1 was introduced into the product in lane 7 and incubated for 40 min, a new band (43 bp) appeared in Lane 5, proving the forming of HP1-1@HP2-1 with the largest molecular weight. The result confirmed IDH1 R132H (BRAF V600E) could be applied to trigger the CHA, proving the feasibility of the CHA signal amplification strategy.
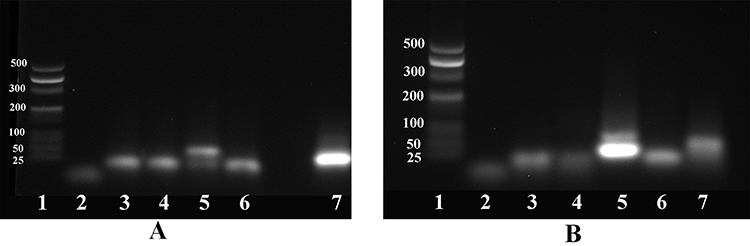 |
Figure 6 PAGE of CHA amplification for the detection of BRAF V600E and IDH1 R132H. (A) Lane 1: Marker; Lane 2: BRAF V600E; Lane 3: HP2-1; Lane 4: HP2-2; Lane 5: HP2-1+ HP2-2+ BRAF V600E; Lane 6: HP2-1+ HP2-2; Lane 7: BRAF V600E+ HP2-1. (B) Lane 1: Marker; Lane 2: IDH1 R132H; Lane 3: HP1-1; Lane 4: HP1-2; Lane 5: HP1-1+ HP1-2+ IDH1 R132H; Lane 6: HP1-1+ HP1-2; Lane 7: IDH1 R132H + HP1-1. |
Optimization of Experimental Parameters
Several critical experimental parameters, including reaction time, incubation temperature, pH, volumes of two SERS probes, volumes of capture probes, and types of reaction buffer were optimized to achieve the best sensing performance for the detection of IDH1 R132H and BRAF V600E. The optimization procedure was carried out by changing one parameter while keeping the other entirely constant. In the experiments, the characteristic peak of 4-MBA and R6G at 1078 cm−1 and 1362 cm−1 were employed to quantify the Raman intensity of IDH1 R132H and BRAF V600E, respectively. Since the reaction time was related to the degradation of nucleic acid molecules and was of great significance to CHA signal amplification, it was necessary to optimize the reaction time to ensure the best results in the amplification. As displayed in Figure 7A, Raman intensities at 1078 cm−1 and 1362 cm−1 increased gradually with the time increasing up to 40 min and further incubation could not reach the best value. Thus, the suitable incubation time was 40 min. As can be seen in Figure 7B, Raman intensities increased correspondingly with increasing temperature from 25°C to 40°C, while a decreasing trend was observed with a further increase in temperature. Therefore, 40°C was selected as the optimal temperature for subsequent experiments. In the same way, the reaction pH is also investigated in Figure 7C, when the pH value was maintained at 7.5, the Raman intensity reached the highest value. Based on this result, the optimum pH value is 7.5. The volumes of the SERS probe and capture probes were invested in Figure 7D and E for optimal signal amplification performance. The results showed that the appropriate volume of SERS probes for IDH1 R132H and BRAF V600E is 5 µL and 4 µL. The optimal volume of capture probes is 3 µL and 4 µL. It is known that hybridization efficiency is affected by the type of buffer solution. Several buffer solutions such as Tris-Acetate, PBS, and HEPES were tested to select the best type of buffer solution for CHA reaction. The results illustrate that the hybridization efficiency in PBS was higher than the other buffer solutions (Figure 7F). Thus, PBS was selected as the experimental buffer solution.
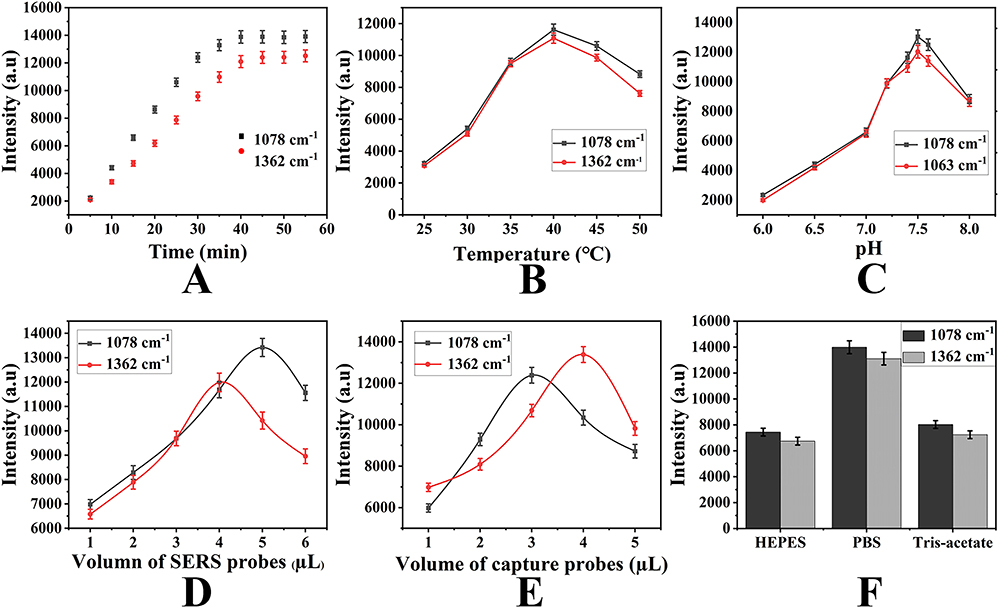 |
Figure 7 Optimization of (A) incubation time (B) temperature (C) pH (D) volume of SERS probes for ctDNAs; (E) volume of capture probes; (F) category of buffer solution. |
Performance Assessment of the SERS Analysis Platform
The reproducibility and selectivity of the prefabricated SERS analysis platform were considered critical parameters for its practical application. The reproducibility was investigated by analyzing target ctDNAs with five SERS analysis platforms prepared at different times. The results, which were recorded in Figure 8A–C, clearly demonstrated that there was no noticeable difference in SERS intensities at 1078 cm−1 and 1362 cm−1. The relative standard deviation (RSD) was 6.74% at 1078 cm−1 and 7.16% at 1362 cm−1, respectively, which proved the excellent reproducibility of the proposed SERS analysis platform. Additionally, given the complexity of plasma, the specificity of the SERS detection platform was also explored to ensure its ability to accurately detect target ctDNAs. Target ctDNAs and several interferences were introduced to the experiment, including two single-base mismatching sequences (MT1-1 and MT1-2), two triple-base mismatching sequences (MT3-1 and MT3-2), and two random sequences. Figure 8D–8F presented the SERS spectra and the corresponding histogram of different test objects at 1078 cm−1 and 1362 cm−1. The results showed that the signal intensities of target ctDNAs can generate stronger SERS responses than other interferants, indicating the satisfying specificity of the prepared SERS analysis platform.
 |
Figure 8 Performance assessment (A) The reproducibility the SERS analysis platform at different times. (B) SERS spectra of the five different times and (C) corresponding scattergram of the peak intensities at 1078 cm−1 and 1362 cm−1. (D) SERS spectra of IDH1 R132H&BRAF V600E, MT1-1, MT1-2, MT3-1, MT3-2, random and blank with the same concentration (10 pM). Corresponding histogram of intensities at 1070 cm−1 (E) and 1362 cm−1 (F). |
Quantitative Analysis
The qualitative analysis of IDH1 R132H and BRAF V600E was applied to validate the feasibility of the proposed SERS analysis platform for the rapid detection of target ctDNAs. As illustrated in Figure 9A, the characteristic peaks at 1078 cm−1 and 1362 cm−1 were clearly observed in the SERS spectrum when IDH1 R132H and BRAF V600E exist simultaneously. Figure 9B and C display only one characteristic peak at 1078 cm−1 or 1362 cm−1 in the SERS spectrum, indicating the existence of IDH1 R132H or BRAF V600E alone. When no target ctDNAs existed, no characteristic peak and SERS signal are shown in Figure 9D. These results demonstrated the proposed SERS analysis platform exhibited satisfactory qualitative analysis of IDH1 R132H and BRAF V600E.
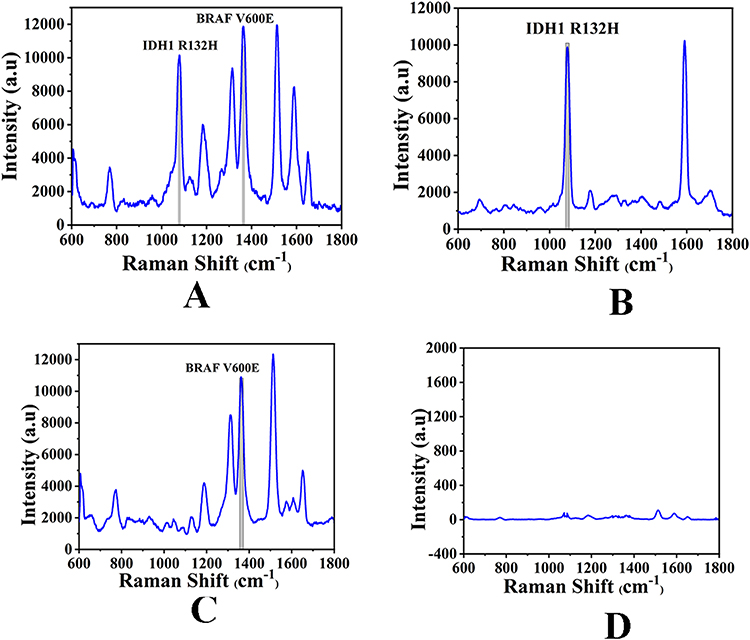 |
Figure 9 The qualitative analysis of ctDNAs. (A) Coexistence of IDH1 R132H and BRAF V600E (B) the exist of IDH1 R132H, and (C) BRAF V600E alone (D) a negative result. |
Quantitative Determination of IDH1 R132H and BRAF V600E
Under-optimized conditions, IDH1 R132H and BRAF V600E were quantitatively analyzed in different concentrations of PBS buffer ranging from 10 aM to 100 pM. In Figure 10A, the SERS signal intensity of the characteristic peaks at 1078 cm−1 gradually enhanced as the concentrations of IDH1 R132H increased from 10 aM to 100 pM. Furthermore, there was an excellent linearity between the fingerprint peak (1078 cm−1) intensity and the logarithm of target ctDNA concentration ranging from 10 aM to 100 pM (Figure 10B). The corresponding regression equation was y=1730.66x-1349.69 (R2=0.9769), where y is the SERS intensity at 1078 cm−1 and x is the logarithm of IDH1 R132H concentration. Similarly, the regression equation for BRAF V600E is y=1941.96x-1535.9, with R2=0.9846 (Figure 10C). The limit of detection (LOD) is defined as the lowest concentration of IDH1 R132H or BRAF V600E that can be detected. The following formula was applied to calculate the corresponding LOD values: LOD=3× (σ/S), where σ is the standard deviation of y-intercepts and S is the slope from the calibration curve. Thus, the LODs for IDH1 R132H and BRAF V600E were calculated to 6.17 aM and 6.02 aM, respectively. To study the feasibility of the platform in serum and the SERS sensing performance, target ctDNAs were diluted with plasma instead of PBS. Herein, the concentration range of IDH1 R132H and BRAF V600E was also from 10 aM to 100 pM. As depicted in Figure 10D, it can be seen that the corresponding signal intensities increase with increasing concentration of the target ctDNAs in the concentration range of 10 aM to 100 pM. Moreover, the plot showed that the relationship between the signal intensities and target ctDNAs concentration is nonlinear but linear with the log concentration of target ctDNAs. The regression equation for IDH1 R132H is y=1772.77x-1392.0, R2=0.9854 (Figure 10E). The regression equation for BRAF V600E is y=1811.33x-1469.57, R2=0.985 (Figure 10F). Thus, the LODs for IDH1 R132H and BRAF V600E in serum were 6.01 aM and 5.48 aM, which is better than some previously reported works (Table 2). The results demonstrate that the designed SERS platform has a high sensitivity for the simultaneous detection of IDH1 R132H and BRAF V600E.
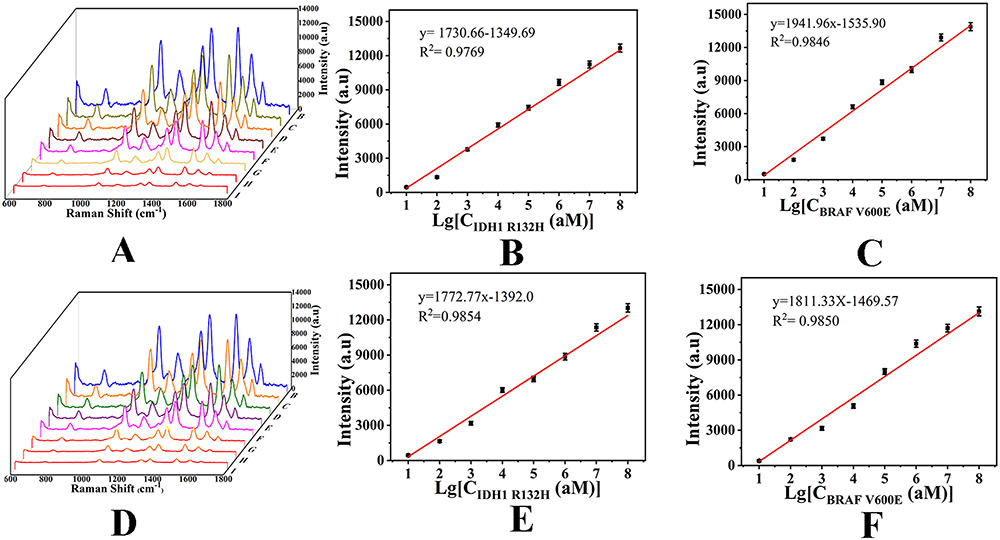 |
Figure 10 (A) SERS spectra of IDH1 R132H and BRAF V600E with different concentrations in PBS buffer (10 aM, 100 aM, 1 fM, 10 fM, 100 fM, 1 pM, 10 pM and 100 pM). (B) Calibration curve of peak intensities at 1078 cm−1 versus logarithm of IDH1 R132H concentration and (C) calibration curve of peak intensities at 1362 cm−1 versus logarithm of BRAF V600E concentration. (D) SERS spectra of IDH1 R132H and BRAF V600E with different concentrations in serum (10 aM, 100 aM, 1 fM, 10 fM, 100 fM, 1 pM, 10 pM and 100 pM). (E) Calibration curve of peak intensities at 1078 cm−1 versus logarithm of IDH1 R132H concentration and (F) calibration curve of peak intensities at 1362 cm−1 versus logarithm of BRAF V600E concentration. |
Characterization of Tumor-Bearing Nude Mice Model
To study the dynamic expression levels of ctDNAs during the pathogenesis of glioma and to further evaluate the utility of the proposed SERS assay platform for real-time monitoring of target ctDNAs, we established a heterologous glioma nude mouse model. After the subcutaneous injection of U87 into the right back of the nude mice, all mice at the inoculation site had visible xenografts on the fifth day, which achieved a 100% tumor formation rate (Figure 11A). Mice were grouped into four groups of four mice each based on the survival time of the mice implanted with tumors. As illustrated in Table S1, mice were observed daily and weighed every 3 days throughout the experiment to record body weight changes. The digital photos of tumor-bearing nude mice on the 7d, 14d, 21d, and 28d were recorded in Figure 11A. Table S1 also showed that the length and width measured at different periods (every 6 d), indicating that the tumor volume firstly decreased and then increased rapidly over time. On day 28, Xenografts were collected (Figure 11B). Figure 11C shows the final size of the tumors at day 28, with no significant differences observed between individuals. Figure 11D shows the body weight changes and growth curves of mice in each group. The tumor volume cure of the nude mice was described in Figure 11E. Mice in different groups were sacrificed by cervical dislocation on the 7d, 14d, 21d, and 28d, respectively. Xenografts were collected, weighed, fixed, paraffin embedded, and made into pathological sections. Hematoxylin–Eosin (H&E) staining was conducted to observe pathological changes in tumor tissues. As illustrated in Figure 11C, typical morphologic features such as many mitotic phases, neovascularization, necrotic clusters along with pseudo palisading cells, and hemorrhage were observed. Moreover, the tumor cells showed irregular size and shape, less cytoplasm, and large and atypical nuclei with dark blue color. All those results demonstrated that the subcutaneous xenograft tumor model was established successfully.
 |
Figure 11 Characterization of tumor-bearing nude mice model. (A) The digital photo of each nude mice with glioma. (B) The tumor mass obtained from corresponding mice (at 28d). (C) Hematoxylin and eosin staining of tumor tissues. (D) The weight growth curves of mice (E) Tumor volume curve. |
Application Analysis in Mice Serum
To further confirm the practicability and reliability of the proposed SERS analysis platform, the expression of IDH1 R132H and BRAF V600E in mice serum collected at different times (0 d, 7 d, 14 d, 21 d, and 28 d) was quantified using SERS. As shown in Figure 12, the characteristic peaks of R6G and 4-MBA were detectable from all the resulting averaged SERS spectra. The corresponding peak intensities of 4-MBA at 1078 cm−1 and R6G at 1362 cm−1 increased with tumor progression. Then, the intensities of 1078 cm−1 and 1362 cm−1 obtained were entered into the linear regression equations in Figure 10E and F to derive the actual concentrations of IDH1 R132H and BRAF V600E in mice serum. Moreover, the same samples were validated through qRT-PCR analysis. Results of IDH1 R132H and BRAF V600E concentrations in the serum of all mice in four groups obtained by two methods and the RSD of each group were recorded in Tables S2–S7, the average concentration of IDH1 R132H measured by the proposed SERS analysis platform at 0 d, 7 d, 14d, 21d, and 28d were 0.01 fM, 0.012 fM, 0.076 fM, 0.164 fM, and 0.473 fM, whereas the results measured by qRT-PCR were 0.009 fM, 0.011 fM, 0.071 fM, 0.171 fM, and 0.493 fM, respectively. The relative errors were calculated to 10%, 8.3%, 6.6%, −4.3%, and −4.2%, respectively. Similarly, the average expression levels of BRAF V600E in mice serum obtained at different times (0d, 7d, 14d, 21d, and 28 d) were 0.013 fM, 0.049 fM, 0.371 fM, 1.114 fM, and 1.968 fM, whereas the results measured by qRT-PCR were 0.012 fM, 0.045 fM, 0.402 fM, 1.036 fM, 2.123 fM, respectively. The relative errors were calculated as 7.7%, 8.2%, −8.4%, 7%, and −7.9%, respectively. The results show that the two methods have high consistency in detection values, demonstrating the high accuracy of the proposed SERS analysis platform.
 |
Figure 12 Application analysis in mice serum. SERS spectra of IDH1 R132H and BRAF V600E in mice serum at different times: (A) 0 d; (B) 7 d; (C) 14 d; (D) 21 d and (E) 28 d. |
Conclusion
In summary, a SERS analysis platform based on dual-signal amplification was constructed for the simultaneous sensitive detection of glioma-related ctDNAs. The Au-AgNSs exhibited robust Raman signal enhancement, which helped to improve the analytical precision. The 3D MBs could be loaded with more Au-AgNSs, which can effectively gather numerous “hot spots” around adjacent particle gaps for SERS enhancement. The prepared new strategy can differentiate the highly similar ctDNA sequences with only single-base mismatches and detect IDH1 R132H and BRAF V600E concentrations as low as 6.01 aM and 5.48 aM, which demonstrated high selectivity and ultra-sensitivity. Furthermore, the expression of ctDNAs in tumor-bearing nude mice serum was analyzed and the results were consistent with those of qRT-PCR, indicating the accuracy of the strategy. Therefore, the new strategy is a promising candidate for the detection of ctDNAs in clinical samples.
Data Sharing Statement
The authors confirm that the data supporting the findings of this study are available within the article and the raw data will be available on request to corresponding author.
Acknowledgments
This work was supported by the National Natural Science Foundation of China (No.81701825), the Social Development Foundation of Jiangsu (No. BE2018684), the Natural Science Foundation of the Jiangsu Higher Education Institutions of China (No.17KJB416012). Youwei Wang and Yang Yang are co-first authors for this study. Qiu Du and Xiaoxia Lu are co-senior authors for this study.
Disclosure
The authors report no conflicts of interest in this work.
References
1. Lang F, Liu Y, Chou FJ, Yang C. Genotoxic therapy and resistance mechanism in gliomas. Pharmacol Ther. 2021;228:107922. doi:10.1016/j.pharmthera.2021.107922
2. Dono A, Vu J, Anapolsky M, et al. Additional genetic alterations in BRAF-mutant gliomas correlate with histologic diagnoses. J Neurooncol. 2020;149:463–472. doi:10.1007/s11060-020-03634-1
3. Finch A, Solomou G, Wykes V, Pohl U, Bardella C, Watts C. Advances in research of adult gliomas. Int J Mol Sci. 2021;22:924. doi:10.3390/ijms22020924
4. Yan H, Parsons DW, Jin G, et al. IDH1 and IDH2 mutations in gliomas. N Engl J Med. 2009;360:765–773. doi:10.1056/NEJMoa0808710
5. Sukswai N, Khoury JD. Immunohistochemistry innovations for diagnosis and tissue-based biomarker detection. Curr Hematol Malig Rep. 2019;14:368–375. doi:10.1007/s11899-019-00533-9
6. Han S, Liu Y, Cai SJ, et al. IDH mutation in glioma: molecular mechanisms and potential therapeutic targets. Br J Cancer. 2020;122:1580–1589. doi:10.1038/s41416-020-0814-x
7. Wan PT, Garnett MJ, Roe SM, et al. Mechanism of activation of the RAF-ERK signaling pathway by oncogenic mutations of B-RAF. Cell. 2004;116:855–867. doi:10.1016/S0092-8674(04)00215-6
8. Gessi M, Pietsch T. The diagnostic role and clinical relevance of determination of BRAF status in brain tumors. Per Med. 2013;10:405–412. doi:10.2217/pme.13.27
9. Davis EJ, Johnson DB, Sosman JA, Chandra S. Melanoma: what do all the mutations mean? Cancer. 2018;124:3490–3499. doi:10.1002/cncr.31345
10. Nobusawa S, Watanabe T, Kleihues P, Ohgaki H. IDH1 mutations as molecular signature and predictive factor of secondary glioblastomas. Clin Cancer Res. 2009;15:6002–6007. doi:10.1158/1078-0432.CCR-09-0715
11. Kaminska B, Czapski B, Guzik R, Król SK, Gielniewski B. Consequences of IDH1/2 mutations in gliomas and an assessment of inhibitors targeting mutated IDH proteins. Molecules. 2019;24:968. doi:10.3390/molecules24050968
12. Silantyev AS, Falzone L, Libra M, et al. Current and future trends on diagnosis and prognosis of glioblastoma: from molecular biology to proteomics. Cells. 2019;8:863. doi:10.3390/cells8080863
13. Gao X, Boryczka J, Zheng P, et al. A “hot Spot”-Enhanced paper lateral flow assay for ultrasensitive detection of traumatic brain injury biomarker S-100β in blood plasma. Biosens Bioelectron. 2021;177:112967. doi:10.1016/j.bios.2021.112967
14. Dubois LG, Campanati L, Righy C, D’Andrea-Meira I, Spohr TC, Porto-Carreiro I. Gliomas and the vascular fragility of the blood brain barrier. Front Cell Neurosci. 2014;8:418. doi:10.3389/fncel.2014.00418
15. Jalali M, Isaac Hosseini I, AbdelFatah T, et al. Plasmonic nanobowtiefluidic device for sensitive detection of glioma extracellular vesicles by Raman spectrometry. Lab Chip. 2021;21:855–866. doi:10.1039/D0LC00957A
16. Müller Bark J, Kulasinghe A, Chua B, Day BW, Punyadeera C. Circulating biomarkers in patients with glioblastoma. Br J Cancer. 2020;122:295–305. doi:10.1038/s41416-019-0603-6
17. Birkó Z, Nagy B, Klekner Á, Virga J. Novel molecular markers in glioblastoma-benefits of liquid biopsy. Int J Mol Sci. 2020;21:7522. doi:10.3390/ijms21207522
18. Zhang L, Liang Y, Li S, et al. The interplay of circulating tumor DNA and chromatin modification, therapeutic resistance, and metastasis. Mol Cancer. 2019;18:36. doi:10.1186/s12943-019-0989-z
19. Wang J, Bettegowda C. Applications of DNA-based liquid biopsy for central nervous system neoplasms. J Mol Diagn. 2017;19:24–34. doi:10.1016/j.jmoldx.2016.08.007
20. Postel M, Roosen A, Laurent-Puig P, Taly V, Wang-Renault SF. Droplet-based digital PCR and next generation sequencing for monitoring circulating tumor DNA: a cancer diagnostic perspective. Expert Rev Mol Diagn. 2018;18:7–17. doi:10.1080/14737159.2018.1400384
21. Bettegowda C, Sausen M, Leary RJ, et al. Detection of circulating tumor DNA in early- and late-stage human malignancies. Sci Transl Med. 2014;6:224ra24. doi:10.1126/scitranslmed.3007094
22. Piccioni DE, Achrol AS, Kiedrowski LA, et al. Analysis of cell-free circulating tumor DNA in 419 patients with glioblastoma and other primary brain tumors. CNS Oncol. 2019;8:Cns34. doi:10.2217/cns-2018-0015
23. Zhang J, Dong Y, Zhu W, et al. Ultrasensitive detection of circulating tumor DNA of lung cancer via an enzymatically amplified SERS-based frequency shift assay. ACS Appl Mater Interfaces. 2019;11:18145–18152. doi:10.1021/acsami.9b02953
24. Zhou Q, Zheng J, Qing Z, et al. Detection of circulating tumor DNA in human blood via DNA-mediated surface-enhanced Raman Spectroscopy of single-walled carbon nanotubes. Anal Chem. 2016;88:4759–4765. doi:10.1021/acs.analchem.6b00108
25. Wee EJ, Wang Y, Tsao SC, Trau M. Simple, sensitive and accurate multiplex detection of clinically important melanoma DNA mutations in circulating tumour DNA with SERS nanotags. Theranostics. 2016;6:1506–1513. doi:10.7150/thno.15871
26. Schlücker S. Surface-enhanced Raman spectroscopy: concepts and chemical applications. Angew Chem Int Ed Engl. 2014;53:4756–4795. doi:10.1002/anie.201205748
27. Zhang Y, Mi X, Tan X, Xiang R. Recent progress on liquid biopsy analysis using surface-enhanced raman spectroscopy. Theranostics. 2019;9:491–525. doi:10.7150/thno.29875
28. Li M, Li JY, Zhang X, Yao MM, Li P, Xu WP. Simultaneous detection of tumor-related mRNA and miRNA in cancer cells with magnetic SERS nanotags. Talanta. 2021;232:122432. doi:10.1016/j.talanta.2021.122432
29. Medetalibeyoglu H, Kotan G, Atar N, Yola ML. A novel sandwich-type SERS immunosensor for selective and sensitive carcinoembryonic antigen (CEA) detection. Anal Chim Acta. 2020;1139:100–110. doi:10.1016/j.aca.2020.09.034
30. Cao XW, Sun Y, Mao Y, et al. Rapid and sensitive detection of dual lung cancer-associated miRNA biomarkers by a novel SERS-LFA strip coupling with catalytic hairpin assembly signal amplification. J Mater Chem C. 2021;9:3661–3671. doi:10.1039/D0TC05737A
31. Yoon J, Choi N, Ko J, Kim K, Lee S, Choo J. Highly sensitive detection of thrombin using SERS-based magnetic aptasensors. Biosens Bioelectron. 2013;47:62–67. doi:10.1016/j.bios.2013.03.003
32. Lu D, Ran M, Liu Y, Xia J, Bi L, Cao X. SERS spectroscopy using Au-Ag nanoshuttles and hydrophobic paper-based Au nanoflower substrate for simultaneous detection of dual cervical cancer-associated serum biomarkers. Anal Bioanal Chem. 2020;412:7099–7112. doi:10.1007/s00216-020-02843-x
33. Bai T, Sun J, Che R, et al. Controllable preparation of core-shell Au-Ag nanoshuttles with improved refractive index sensitivity and SERS activity. ACS Appl Mater Interfaces. 2014;6:3331–3340. doi:10.1021/am405357v
34. Cao X, Ge S, Zhou X, et al. A dual-signal amplification strategy based on pump-free SERS microfluidic chip for rapid and ultrasensitive detection of non-small cell lung cancer-related circulating tumour DNA in mice serum. Biosens Bioelectron. 2022;205:114110. doi:10.1016/j.bios.2022.114110
35. Sasikumar T, Ilanchelian M. A simple assay for direct visual and colorimetric sensing application of cysteamine using Au@Ag core-shell nanoparticles. Opt Mater (Amst). 2020;109:110237. doi:10.1016/j.optmat.2020.110237
36. Jun BH, Kim G, Baek J, et al. Magnetic field induced aggregation of nanoparticles for sensitive molecular detection. Phys Chem Chem Phys. 2011;13:7298–7303. doi:10.1039/c0cp02055a
37. Wu L, Xiao X, Chen K, et al. Ultrasensitive SERS detection of Bacillus thuringiensis special gene based on Au@Ag NRs and magnetic beads. Biosens Bioelectron. 2017;92:321–327. doi:10.1016/j.bios.2016.11.005
38. Geng P, Sun S, Wang X, et al. Rapid and sensitive detection of amphetamine by SERS-based competitive immunoassay coupled with magnetic separation. Anal Methods. 2022;14:2608–2615. doi:10.1039/D2AY00581F
39. Zong S, Wang Z, Zhang R, Wang C, Xu S, Cui Y. A multiplex and straightforward aqueous phase immunoassay protocol through the combination of SERS-fluorescence dual mode nanoprobes and magnetic nanobeads. Biosens Bioelectron. 2013;41:745–751. doi:10.1016/j.bios.2012.09.057
40. Yue S, Song X, Song W, Bi S. An enzyme-free molecular catalytic device: dynamically self-assembled DNA dendrimers for in situ imaging of microRNAs in live cells. Chem Sci. 2019;10:1651–1658. doi:10.1039/C8SC04756A
41. Wu Y, Fu C, Shi W, Chen J. Recent advances in catalytic hairpin assembly signal amplification-based sensing strategies for microRNA detection. Talanta. 2021;235:122735. doi:10.1016/j.talanta.2021.122735
42. Ye X, Zheng C, Chen J, Gao Y, Murray CB. Using binary surfactant mixtures to simultaneously improve the dimensional tunability and monodispersity in the seeded growth of gold nanorods. Nano Lett. 2013;13:765–771. doi:10.1021/nl304478h
43. Zhang C, Chen S, Jiang Z, Shi Z, Wang J, Du L. Highly sensitive and reproducible SERS substrates based on ordered micropyramid array and silver nanoparticles. ACS Appl Mater Interfaces. 2021;13:29222–29229. doi:10.1021/acsami.1c08712
44. Fernand D, Bergé-Lefranc D, Pardanaud C, Phan TN, Merlen A, Hornebecq V. Detection of Rhodamine 6G at low concentrations using Raman Spectroscopy: a comparison between Ag and Au-based nanoporous substrates. Eur Phys J Spec Top. 2015;224:2001–2010. doi:10.1140/epjst/e2015-02517-5
45. Sun Y, Xia Y. Alloying and dealloying processes involved in the preparation of metal nanoshells through a galvanic replacement reaction. Nano Lett. 2003;3:1569–1572. doi:10.1021/nl034765r
46. Chen Z, Xie Y, Huang W, Qin C, Yu A, Lai G. Exonuclease-assisted target recycling for ultrasensitive electrochemical detection of microRNA at vertically aligned carbon nanotubes. Nanoscale. 2019;11:11262–11269. doi:10.1039/C9NR02543J
47. Zhao Q, Piao J, Peng W, et al. Simple and sensitive quantification of microRNAs via PS@Au microspheres-based DNA probes and DSN-assisted signal amplification platform. ACS Appl Mater Interfaces. 2018;10:3324–3332. doi:10.1021/acsami.7b16733
48. Lv W, Zhao J, Situ B, et al. A target-triggered dual amplification strategy for sensitive detection of microRNA. Biosens Bioelectron. 2016;83:250–255. doi:10.1016/j.bios.2016.04.053
 © 2023 The Author(s). This work is published and licensed by Dove Medical Press Limited. The full terms of this license are available at https://www.dovepress.com/terms.php and incorporate the Creative Commons Attribution - Non Commercial (unported, v3.0) License.
By accessing the work you hereby accept the Terms. Non-commercial uses of the work are permitted without any further permission from Dove Medical Press Limited, provided the work is properly attributed. For permission for commercial use of this work, please see paragraphs 4.2 and 5 of our Terms.
© 2023 The Author(s). This work is published and licensed by Dove Medical Press Limited. The full terms of this license are available at https://www.dovepress.com/terms.php and incorporate the Creative Commons Attribution - Non Commercial (unported, v3.0) License.
By accessing the work you hereby accept the Terms. Non-commercial uses of the work are permitted without any further permission from Dove Medical Press Limited, provided the work is properly attributed. For permission for commercial use of this work, please see paragraphs 4.2 and 5 of our Terms.