Back to Journals » International Journal of Nanomedicine » Volume 12
Silica nanoparticles induce liver fibrosis via TGF-β1/Smad3 pathway in ICR mice
Authors Yu Y, Duan J, Li Y, Li Y, Jing L ![]() , Yang M, Wang J, Sun Z
, Yang M, Wang J, Sun Z
Received 12 January 2017
Accepted for publication 13 June 2017
Published 21 August 2017 Volume 2017:12 Pages 6045—6057
DOI https://doi.org/10.2147/IJN.S132304
Checked for plagiarism Yes
Review by Single anonymous peer review
Peer reviewer comments 4
Editor who approved publication: Professor Lei Yang
Yang Yu,1,2 Junchao Duan,1,2 Yang Li,1,2 Yanbo Li,1,2 Li Jing,1,2 Man Yang,1,2 Ji Wang,1,2 Zhiwei Sun1,2
1School of Public Health, Capital Medical University, Beijing, People’s Republic of China; 2Beijing Key Laboratory of Environmental Toxicology, Capital Medical University, Beijing, People’s Republic of China
Abstract: The liver is one of the target organs of silica nanoparticles (SiO2 NPs) but the toxic mechanism on the liver still remains unclear. This study aimed to explore the hepatic toxicity and its mechanism through repeated intravenous exposure to SiO2 NPs in ICR mice. Results indicated that SiO2 NPs could be distributed in hepatocytes, Kupffer cells, and hepatic stellate cells, and induce hepatic dysfunction as well as granuloma formation in the liver. The increase of lipid peroxide level and decrease of antioxidant enzyme activities in the liver indicated that SiO2 NPs could induce hepatic oxidative damage. SiO2 NPs induced hepatocytes’ apoptosis shown by morphological examination and TUNEL assay. The results of Masson’s trichrome staining and hydroxyproline assay showed hyperplasia of collagen fibers in the liver, suggesting SiO2 NPs caused liver fibrosis, and it was promoted by oxidative damage and hepatocytes’ apoptosis. The results of Western blot analysis and immunohistochemical staining indicated that the activation of TGF-β1/Smad3 signaling pathway played an important role in this pathophysiological process. The results suggested that oxidative damage and hepatocyte apoptosis activated TGF-β1/Smad3 signaling pathway, and thus promoted the process of liver fibrosis induced by intravenous injection of SiO2 NPs in mice. This study, for the first time, investigated liver fibrosis and its related mechanism induced by repeated intravenous exposure of amorphous SiO2 NPs, and provides important experimental evidence for safety evaluation of SiO2 NPs, especially in biomedical application.
Keywords: silica nanoparticles, oxidative stress, hepatocyte apoptosis, fibrosis, TGF-β1/Smad3 signaling pathway
Introduction
Silica nanoparticles’ (SiO2 NPs’) output is the largest in engineering nanomaterials because of its stable physical-chemical properties and good biocompatibility, and are widely used in drug delivery, biological imaging, and medical diagnosis, etc. In the field of biomedical application, as drug carrier, SiO2 NPs enter into the body by intravenous injection; in the food processing industry, average daily intake of SiO2 NPs as food additive in the human body reaches 1.8 mg/kg;1 an environmental study has shown that SiO2 NPs are an important inorganic composition of atmospheric pollution;2 in occupational exposure, SiO2 NPs could enter the lung by respiration and then pass the gas-blood barrier into systemic circulation. Thus, with the application increasing and environmental pollution exaggerated, the population’s exposure to SiO2 NPs is apparently increased. SiO2 NPs are on the priority list of manufactured nanomaterials for toxicological evaluation by Organisation for Economic Co-operation and Development,3 so attention should be paid to the hazard of SiO2 NPs to environmental safety and human health.
As an important part of the reticuloendothelial system, the liver has the responsibility of recognition and clearance of nanoparticles which have entered into the bloodstream.4,5 Toxicokinetics study also indicated that the liver was the largest holder for nanoparticles by intravenous injection.6 So, the liver could be the primary target organ through intravenous administration of SiO2 NPs. Previously, we reported the acute toxicity of SiO2 NPs by intravenous injection in mice, and SiO2 NPs could also induce elevation of serum AST level in a dose-dependent manner.7 Several studies have also demonstrated that SiO2 NPs may be hepatotoxic by intravenous injection in animal models.8,9
van der Zande et al observed that rats orally exposed to SiO2 NPs, showed significantly elevated expression of fibrosis-related genes in the liver, their study provided us with an important clue that SiO2 NPs may induce liver fibrosis through oral administration.10 Few studies have investigated the toxicity of SiO2 NPs on the liver by intravenous administration. Liu et al reported that mesoporous SiO2 NPs could induce hepatic fibrosis in intravenously exposed mice.11 So far it is still indistinct whether amorphous SiO2 NPs could induce liver fibrosis after intravenous injection, and the related mechanism is also unknown. Due to more and more biomedical application of SiO2 NPs, it is important to clarify the hepatic toxicity of SiO2 NPs in intravenous exposure.
So this study plans to evaluate the hepatic toxicity of SiO2 NPs and preliminarily explore the related mechanism by repeated intravenous exposure in mice. Blood biochemical indexes were used to assess the impairment of liver function. Hepatic morphological changes, ultrastructural changes, and ultra-distribution of SiO2 NPs were observed. Oxidative damage and cell apoptosis were used to assess liver injury. The collagen fiber content was tested to assess liver fibrosis. The activation of TGF-β1/Smad3 pathway was detected to confirm its participation in the process of liver fibrosis induced by SiO2 NPs. This study observes the liver injury not only immediately after repeated intravenous exposure, but also after 45-day recovery period, so as to provide more comprehensive understanding of hepatic injury induced by SiO2 NPs.
Methods
SiO2 NPs’ preparation and characterization
The amorphous SiO2 NPs were prepared using the Stöber method as previously described.12 The SiO2 NPs were dispersed in distilled water (stock media) or saline (exposure media) at the concentration of 500 μg/mL. The SiO2 NPs drop was added to the copper grid and put in the incubators at 50°C for 24 h. Then, the shape and size of SiO2 NPs were observed by transmission electron microscopy (TEM) (JEM2100; JEOL, Akishima-shi, Japan). The zeta potential and hydrodynamic sizes of SiO2 NPs in dispersion media at the concentration 500 μg/mL were measured by zeta electric potential granulometer (Nano-ZS90; Malvern Instruments, Malvern, UK). The purity of the SiO2 NPs was determined by inductively coupled plasma-atomic emission spectrometer (ARL 3520; ARL, Washington, DC, USA). The endotoxin detection was conducted using Gel-Clot Limulus Amebocyte Lysate (LAL) assay (Bokang, Zhanjiang, Guangdong, People’s Republic of China).
Animals
Male ICR mice (8 weeks old with weight 20–22 g) were purchased from Vital River Laboratory Animal Technology Co. Ltd (Beijing, People’s Republic of China). Groups of five mice were kept in a stainless steel cage. They were allowed to have free access to water and chow in a temperature controlled room (20°C±2°C) with 60%±10% relative humidity and a 12:12 h light/dark cycle. Prior to the final treatment, the mice were fasted overnight. The experiment followed the National Guidelines for Animal Care and Use, and was approved by the Laboratory Animal Care and Use Committee in Capital Medical University.
The mice were continuously intravenously injected with SiO2 NPs at 20 mg/kg once every 3 days, in total five times. The dosage selection of SiO2 NPs was based on our previous acute toxicity study.7 An amount of 20 mg/kg is not only less than one tenth of the LD50 of SiO2 NPs, but also lower than the lowest level in previous acute toxicity study. The control groups were intravenously injected with the same volumes of sterile saline. Mortality and clinical manifestation was recorded. The mice were sacrificed at days 15, 30, and 60 after the first injection, and the serum and livers were harvested for further study, the experimental design was shown in Figure 1. The livers were weighed accurately, and the coefficients of livers were calculated as the ratio of livers (wet weight, mg) to body weight (g).
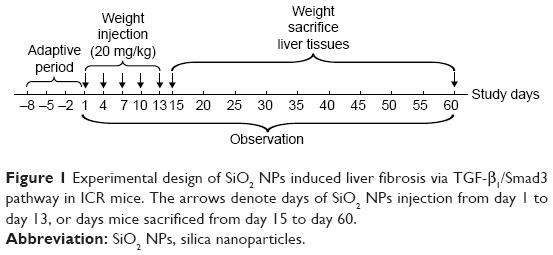 | Figure 1 Experimental design of SiO2 NPs induced liver fibrosis via TGF-β1/Smad3 pathway in ICR mice. The arrows denote days of SiO2 NPs injection from day 1 to day 13, or days mice sacrificed from day 15 to day 60. |
Blood biochemical assay
Blood samples were collected via the ocular vein. The serum was obtained by centrifugation of the whole blood at 3,000 rpm for 15 min. The serum levels of AST, ALT, LDH, and ALB were assayed by an automated biochemical analyzer (Type 7200-202; Hitachi Ltd., Tokyo, Japan).
Histopathological examination
The livers were fixed in 10% formalin, embedded in paraffin, sectioned, and stained with hematoxylin and eosin for histological examination. After staining, the histopathological changes were observed and examined under optical microscope (Olympus X71-F22PH; Olympus Corporation, Tokyo, Japan). For quantification, the total number and size of granulomas in 30 optical fields (200× magnification) of each liver section were determined using the Olympus software (CellSens Standard). The fields were chosen randomly and continuously. Data were presented as mean ± SD of five mice of each group. The pathologist was blinded to all the histopathological examinations.
TEM imaging
The livers were excised and immediately fixed in 3% glutaraldehyde overnight. Then the samples were rinsed three times with 0.1 M PBs and postfixed with 1% osmic acid for 2 h. After being rinsed three times with 0.1 M PB and serially dehydrated with 50%, 70%, 80%, 90%, and 100% alcohol and 100% acetone, the samples were embedded in epoxy resin. The ultrathin sections (50 nm) were obtained by an ultra-microtome (Ultra cut UCT; Leica Microsystems, Wetzlar, Germany). They were then stained with lead citrate and uranyl acetate, and observed by TEM. The pathologist was blinded to identity and analysis of the ultrathin sections.
Assessment of oxidative damage
The oxidative damage in the liver was assessed by measuring the level of MDA as an end product of lipid peroxidation, the activities of SOD and GSH-Px as the anti-oxidative systems to eliminate ROS. Liver tissues (100 mg) were homogenized in 1 mL ice-cold saline. After centrifuging the homogenates at 3,000 rpm at 4°C for 10 min, the supernatants were collected for measurement of the production of MDA, the activities of SOD and GSH-Px at concentrations of 10%, 5%, and 1%, respectively. All examinations were carried out using commercially available kits (Jiancheng, Nanjing, Jiangsu, People’s Republic of China) according to the manufacturer’s instructions. The protein concentrations of the liver homogenates were determined by the BCA protein assay (Jiancheng).
Apoptosis detection by TUNEL stain
In situ detection of DNA fragmentation was performed using TUNEL staining on liver paraffin sections in mice. In apoptosis the cleavage of DNA by endogenous DNases leads to the formation of free 3′ DNA hydroxyl groups, which are substrates for the enzyme TdT that can attach nucleotides to the free 3′ DNA hydroxyl groups. In TUNEL staining, labeled nucleotides represent the cells undergoing apoptosis. TUNEL staining was performed according to an in situ cell death detection kit (KeyGEN, Nanjing, Jiangsu, People’s Republic of China) following the manufacturer’s protocol.
Detection of collagen content
Liver paraffin sections were stained by Masson’s trichrome stains13 to assess liver fibrosis. The slides were observed using an optical microscope (Olympus X71-F22PH). Slides showed red keratin and muscle fibers, blue or green collagen and bone, light red or pink cytoplasm, and dark brown cell nuclei.
Hepatic hydroxyproline (HYP) content in the liver was measured by Kivirikko’s method with some modification14 by using HYP assay kits (Jiancheng). The results were expressed as mg of hydroxyproline per g of wet liver weight.
Western blot analysis
The total protein was extracted with the Tissue Total Protein Extraction Kit (KeyGEN) and determined using the BCA protein kit (Jiancheng) according to the manufacturer’s instructions. Equal amounts of lysate proteins (40 μg) were loaded onto SDS-polyacrylamide gels (12% separation gels) and electrophoretically transferred to PVDF membranes (EMD Millipore, Billerica, MA, USA). The membrane was blocked with fat-free milk at room temperature for 2 h and incubated at 4°C overnight with the following primary antibodies: TGF-β1 (Abcam, Cambridge, MA, USA), Smad3, p-Smad3, and β-actin (Cell Signaling Technology [CST], Beverly, MA, USA) in 5% fat-free milk in TBST separately. The membranes were washed with TBST three times, each time for 10 min and incubated with 1:2,000 dilution of HRP-conjugated secondary antibody (CST) at room temperature for 1 h. After being washed three times with TBST, the antibody-bound proteins were detected using the enhanced chemiluminescence reagent (Thermo Fisher Scientific, Waltham, MA, USA).
Immunohistochemical staining
p-Smad3 was detected immunohistochemically in the paraffin-embedded liver sections. After deparaffinization and rehydration, the liver sections were placed in a 10 mM citrate buffer solution (pH 6.0) for antigen retrieval. In order to quench endogenous peroxidase activity, the sections were treated with 3% H2O2 in PBS for 5 min and then washed in PBS. Then, the sections were blocked with 10% normal goat serum at 37°C for 10 min and incubated with primary antibody or an equivalent amount of normal goat IgG as a negative control at 4°C overnight. The sections were then treated with an avidin-biotin affinity system at room temperature for 30 min, stained with 3-3′ diaminobenzidine substrate, and counter-stained with hematoxylin. The pathologist was blinded to all the analyses of the slides. A brown staining indicates positive expression. Results were expressed as the total positive cell numbers from 50 random and continuous fields in each section.
Statistical analysis
Results were expressed as mean ± SD. Significance was determined by using one-way ANOVA and followed by least significant difference test to compare the differences between groups. Independent sample t-test was performed to compare the difference between control group and the SiO2 NPs treated groups at the same time. Differences were considered significant at P<0.05.
Results
Characterization of SiO2 NPs
The SiO2 NPs were well characterized in our previous research.7,15 The average size of the spherical SiO2 NPs was 64.43±10.50 nm and the SiO2 NPs had good monodispersity in distilled water and in saline with time. In addition, the SiO2 NPs’ purity was >99.9% and the LAL assay indicated no detectable gram negative endotoxin.
Weight gain and coefficient of livers
As shown in Figure 2, the total weight gain decreased in a time-dependent manner in the control and in the SiO2 NPs treated mice, and the values in the SiO2 NPs treated mice were lower than in the control groups, with significant difference at day 15 and day 60 (P<0.05). Besides, SiO2 NPs induced hepatomegaly in mice. The coefficients of livers were significantly increased in the SiO2 NPs treated groups than that in the control groups at days 15, 30, and 60. The coefficients of livers in the SiO2 NPs treated group decreased in the period of observation but were still significantly higher than in the control group at day 60 (Figure 2).
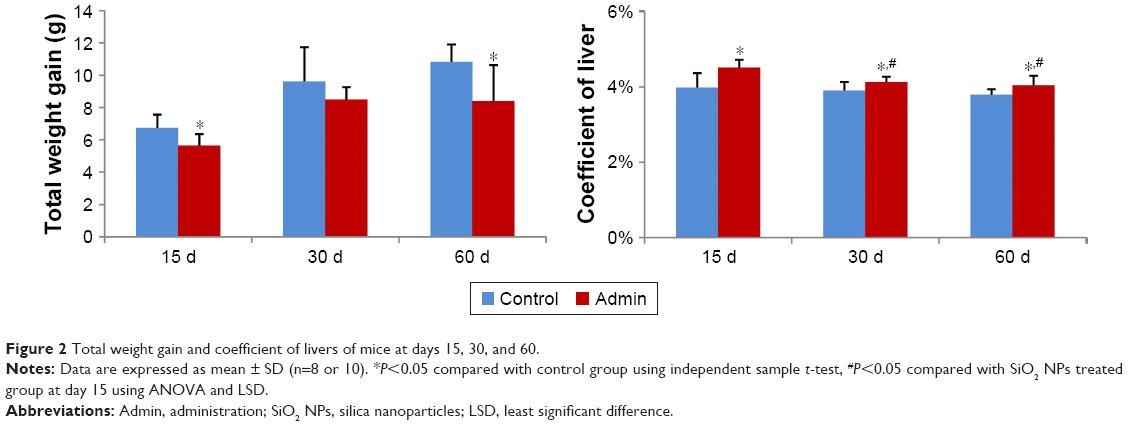 | Figure 2 Total weight gain and coefficient of livers of mice at days 15, 30, and 60. |
Blood biochemical assay
SiO2 NPs induced serum ALT and AST elevation in the SiO2 NPs treated groups as shown in Figure 3. Also, the level of serum LDH significantly increased in the SiO2 NPs treated groups compared with the control groups. The levels of serum ALT, AST, and LDH in the SiO2 NP treated mice were all first elevated at day 15, and then reached the peak value at day 30, and finally decreased at day 60. But at day 60, the AST level and LDH level still remained higher in the SiO2 NP treated groups than that in the control groups (P<0.05). The levels of serum ALB and A/G in the SiO2 NPs treated groups decreased in a time-dependent manner, and the A/G was significantly lower than that in the control group at day 60 (P<0.05). On the other hand, the serum GLB level was significantly elevated in the SiO2 NP treated groups compared with that in the control group at day 60.
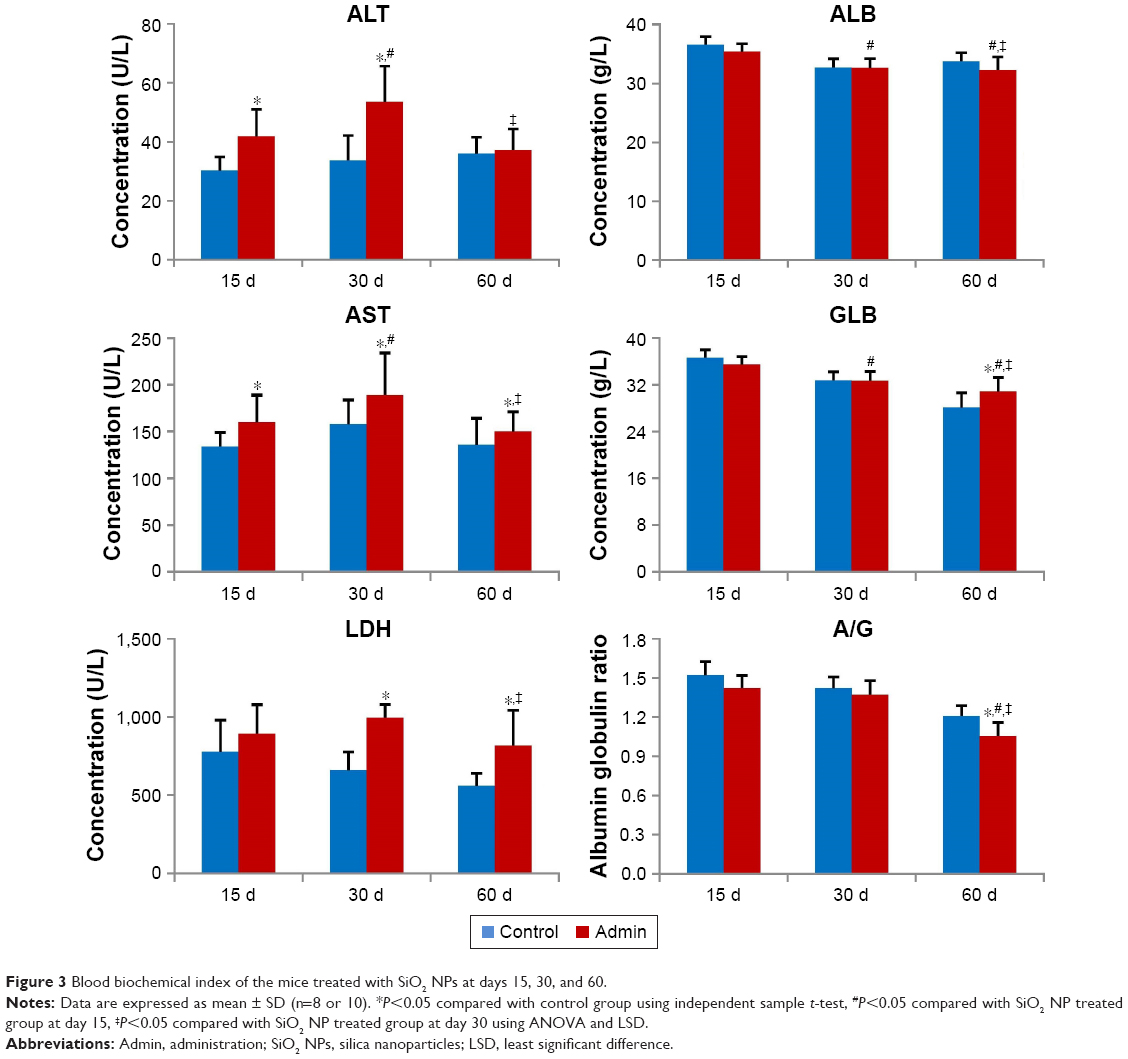 | Figure 3 Blood biochemical index of the mice treated with SiO2 NPs at days 15, 30, and 60. |
Pathological examination
SiO2 NPs induced lymphocytic infiltration, granuloma formation, and hepatocellular hydropic degeneration in the liver samples of mice at days 15, 30, and 60 (Figure 4A). The liver sections exhibited well-formed multi-cellular granulomas with a large number of macrophages and minimal hepatocyte necrosis, as well as inflammatory cell infiltration in the SiO2 NP treated mice at day 15 and day 30. In contrast, the granulomas in the liver sections in the SiO2 NP treated mice at day 60 appeared more collagen fibers which were stained pink (Figure 4A). In addition, hepatic sinusoid and central vein hyperemia, hepatocyte degeneration, apoptosis, and necrosis were also observed in the liver sections in the SiO2 NP treated mice (Figure 4A). The numbers, total sizes, and average sizes of granulomas in the livers in the SiO2 NP treated mice decreased in a time-dependent manner (Figure 4B). The total sizes of granulomas in the livers in the SiO2 NP treated mice at day 15 were respectively 1.8-fold and 5.8-fold larger than that in the livers from the SiO2 NP treated mice at day 30 and day 60.
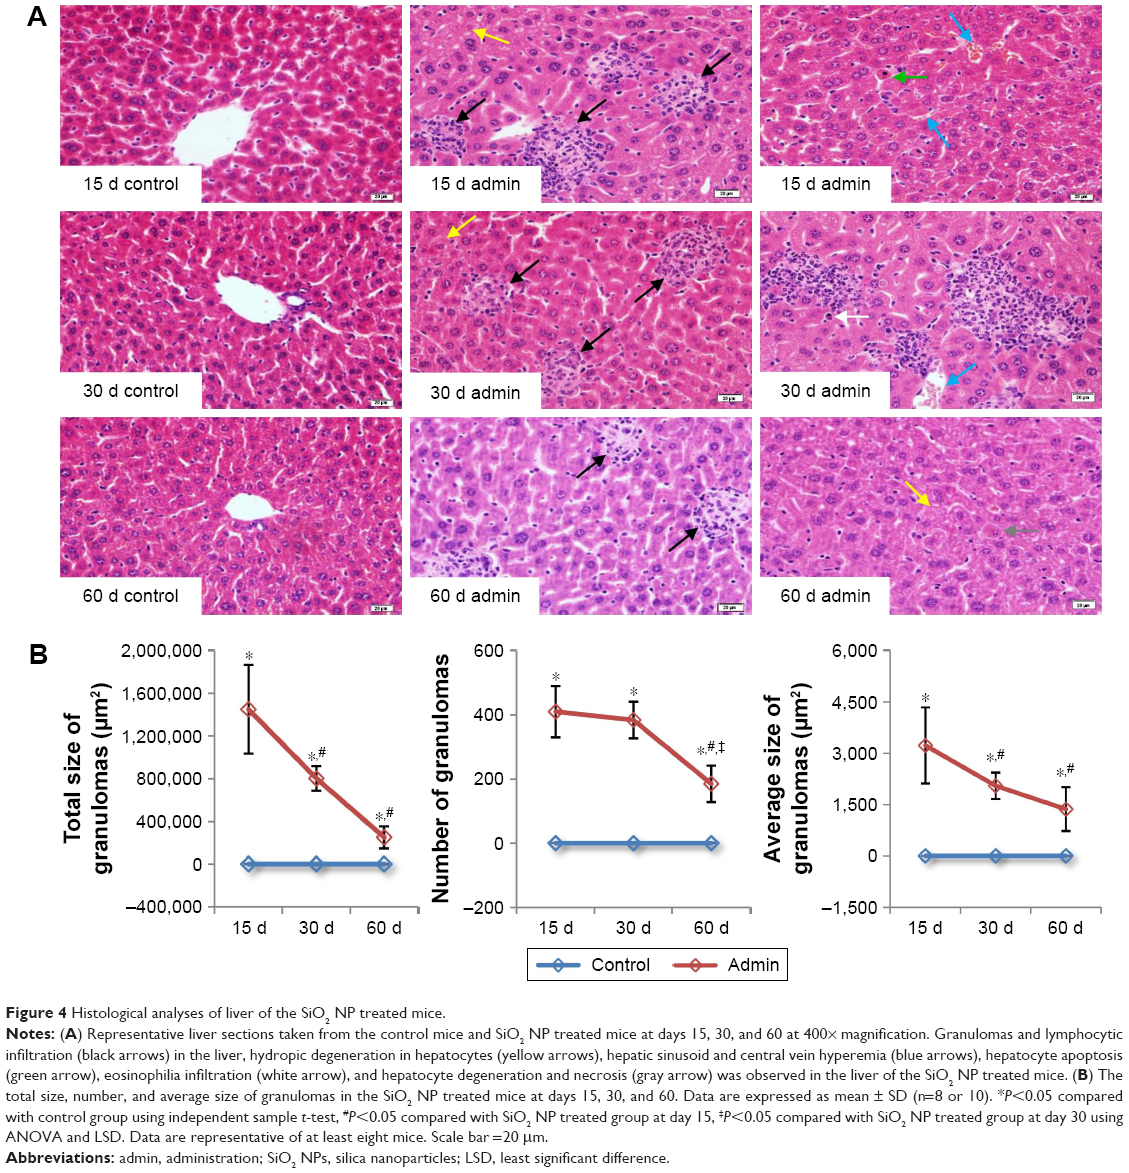 | Figure 4 Histological analyses of liver of the SiO2 NP treated mice. |
TEM imaging
The ultrastructural distribution of SiO2 NPs was shown in Figure 5. SiO2 NPs were mainly distributed in the Kupffer cells (KCs) and macrophages (Figure 5A and C), while a few SiO2 NPs were trapped in the hepatocytes, the hepatic stellate cells (HSCs), and the fibroblast cells (Figure 5E, I, and K). Besides, a large amount of SiO2 NPs were trapped in the inflammatory cells such as the neutrophils in the granulomas (Figure 5G). SiO2 NPs mainly persisted in membrane-enclosed vesicles called lysosomes in the cells. Figure 6 showed the abnormal ultrastructural changes in the liver in the SiO2 NP treated mice. The hepatocytes in the SiO2 NP treated mice appeared typical morphological changes of apoptosis, such as distorted nuclear membrane, increased nuclear membrane indentation with chromatin margination, crescent-shaped nucleus, condensation of mitochondria, and lipid droplet accumulation in the cytoplasm as well as vacuolization (Figure 6A, D, and G). Figure 6 also showed the typical changes of the granuloma with time. Firstly, several KCs aggregated together with the infiltration of the inflammatory cells, and led to the cellular granuloma formation at day 30 (Figure 6E), which turned out to be a fibrosis granuloma at day 60 with SiO2 NPs in the center and surrounded by a large amount of collagen fibers as well as fibroblast proliferation (Figure 6H). Additionally, nuclear condensation, lamellar body-like structure, vacuolization (Figure 6E), and cell necrosis and apoptosis was also observed in the cellular granuloma.
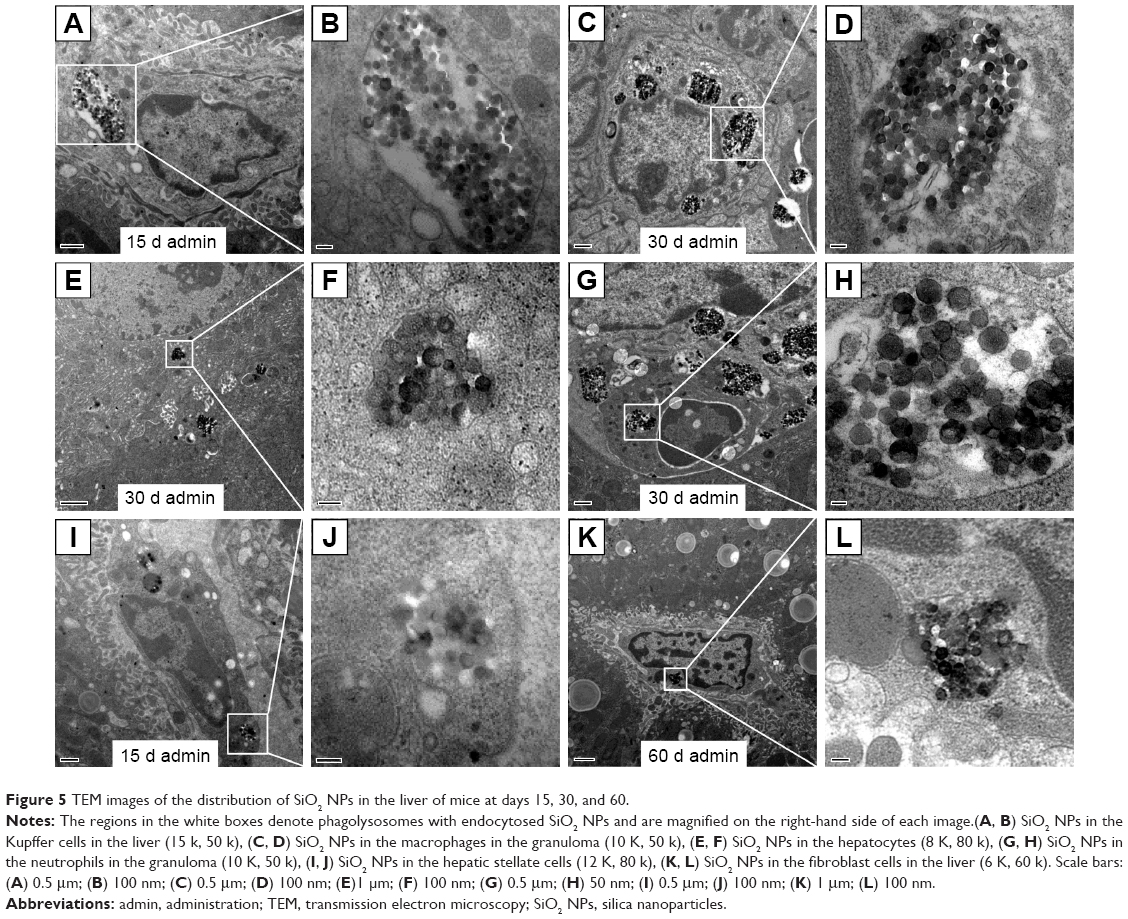 | Figure 5 TEM images of the distribution of SiO2 NPs in the liver of mice at days 15, 30, and 60. |
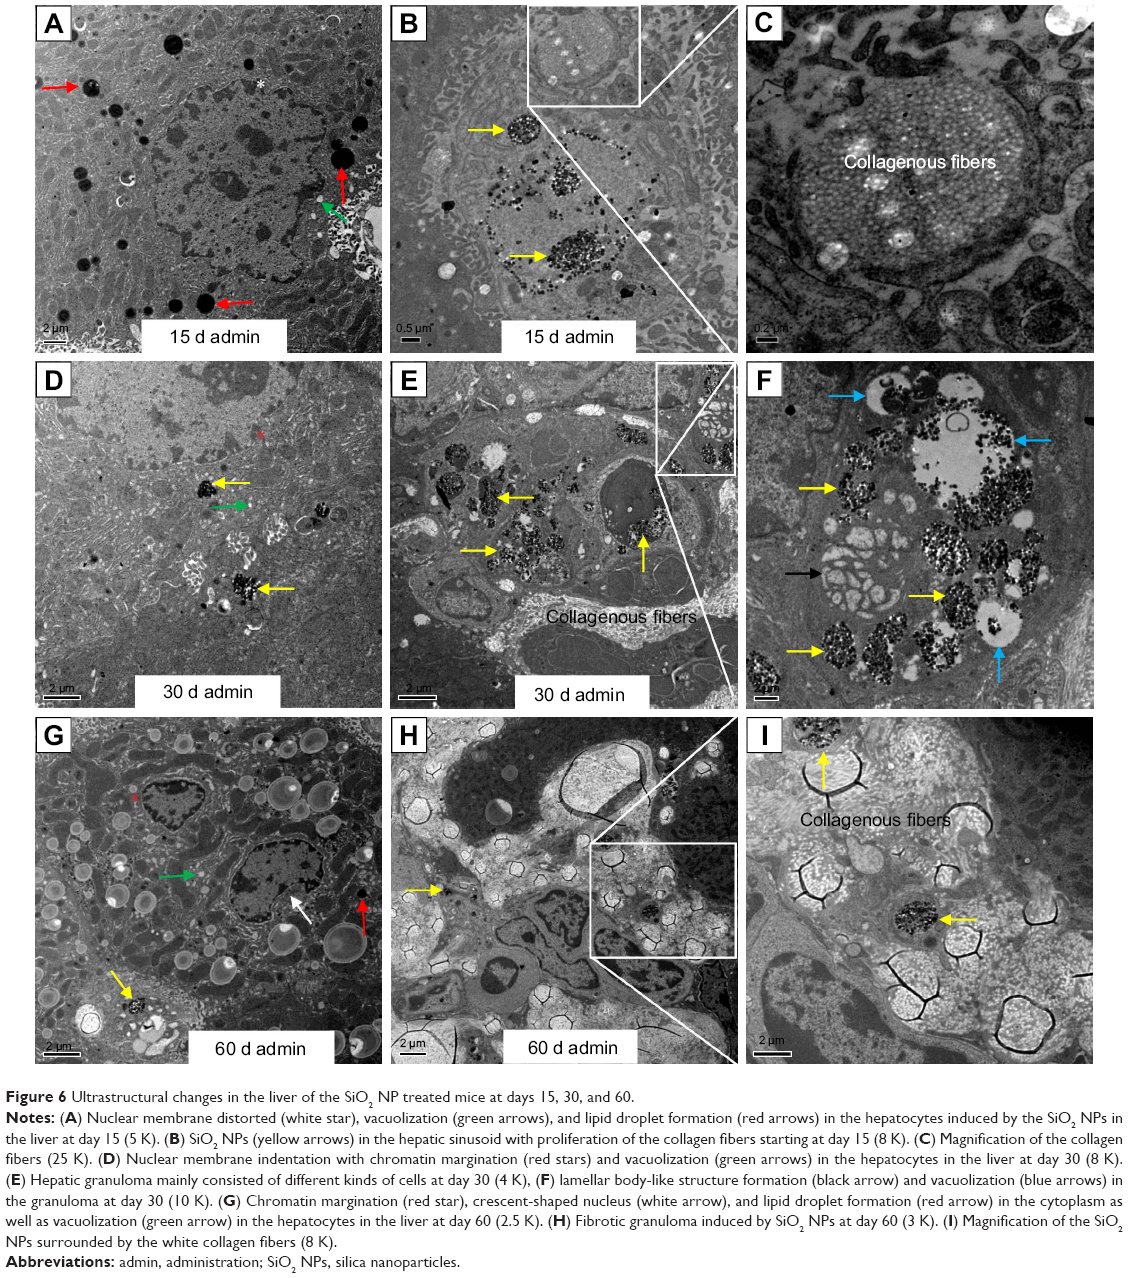 | Figure 6 Ultrastructural changes in the liver of the SiO2 NP treated mice at days 15, 30, and 60. |
Oxidative damage assessment
Figure 7 showed the results of evaluation of the oxidative damage in the liver by intravenous administration of SiO2 NPs in mice. As a product of lipid peroxidation, the MDA level in the liver in the SiO2 NP treated mice increased significantly compared with that in the control groups (P<0.05) at day 15 and day 30, and was 2.35-fold and 1.83-fold higher than that in the control groups, respectively. The MDA level was also higher than that in the control group at day 60 but with no significant difference. On the contrary, the defense systems against free radical attack, the activities of SOD and GSH-Px in the liver in the SiO2 NP treated mice both decreased at day 15 and day 30, and recovered at day 60. But only the activities of SOD and GSH-Px in the liver in the SiO2 NP treated mice decreased significantly compared with control group at day 15 (P<0.05).
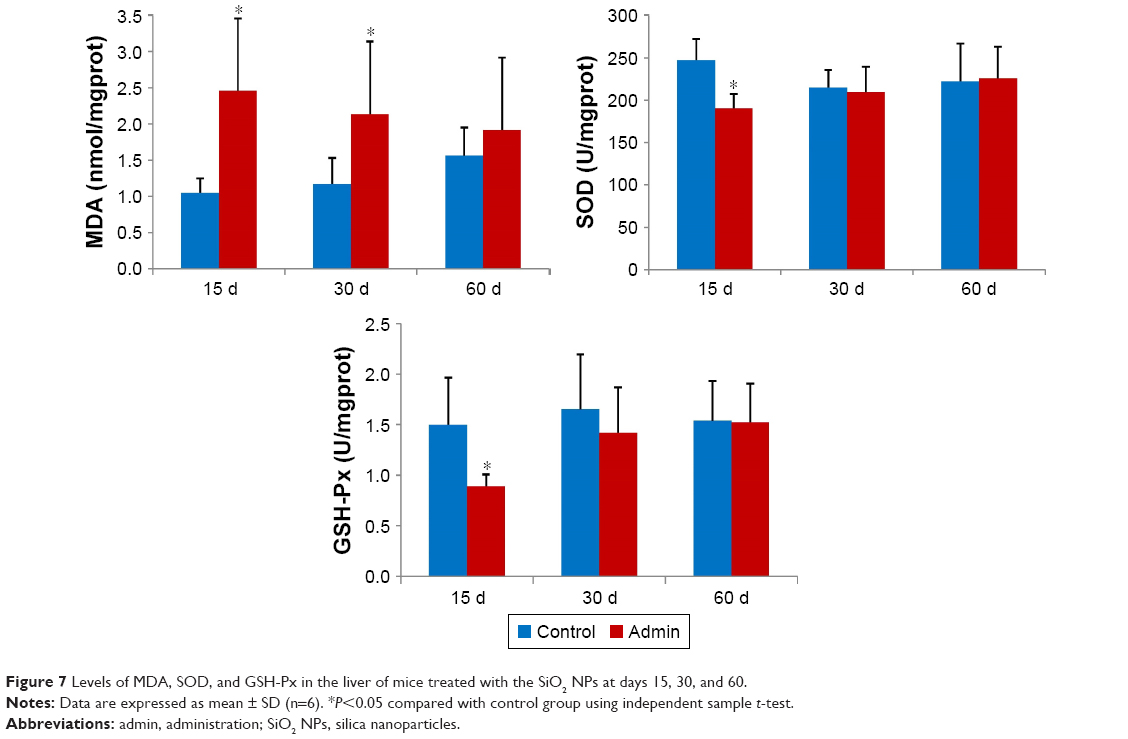 | Figure 7 Levels of MDA, SOD, and GSH-Px in the liver of mice treated with the SiO2 NPs at days 15, 30, and 60. |
Cell apoptosis detection
The DNA fragments in apoptotic cells were detected using the TUNEL assay. In the liver sections of control mice, the apoptotic cells were occasionally observed in the hepatic sinusoid and were mainly KCs (Figure 8A). In the SiO2 NP treated mice, a large amount of apoptotic cells were observed in the liver section, including hepatocytes in the liver parenchyma, KCs in the hepatic sinusoid, and KCs as well as inflammatory cells in the granulomatous lesion (Figure 8A). The positive cell numbers in the liver section decreased in a time-dependent manner in SiO2 NP treated mice (Figure 8B).
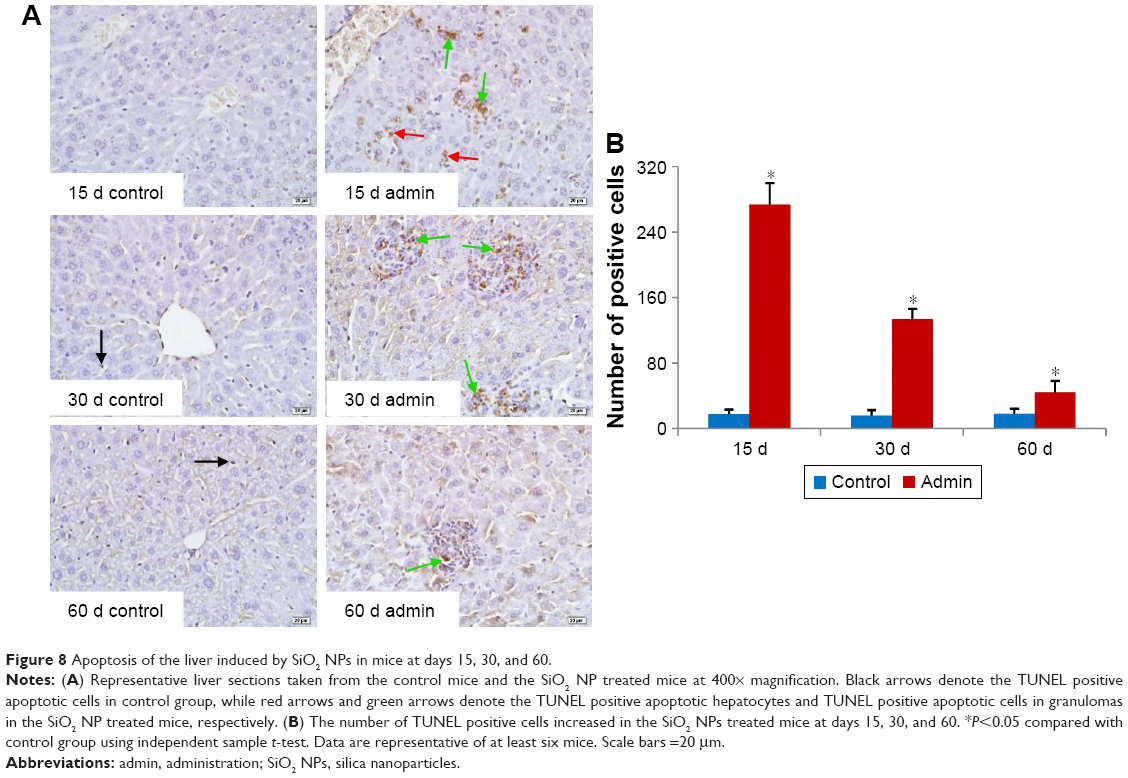 | Figure 8 Apoptosis of the liver induced by SiO2 NPs in mice at days 15, 30, and 60. |
Measurement of collagen fibers
Histopathological changes of fibrosis occurring in the SiO2 NP treated mice were shown in Figure 9A. The livers of mice treated with SiO2 NPs showed extensive accumulation of connective tissue resulting in the formation of continuous fibrotic septa, nodules of regeneration, and noticeable alterations in the central vein and around granulomatous lesions (Figure 9A), which was also observed under TEM (Figure 6). The hydroxyproline content, the marker of collagen accumulation, was elevated in the liver in the SiO2 NP treated mice, in the meantime the results indicated that the extent of fibrosis was aggravated in a time-dependent manner, and SiO2 NPs induced the HYP content which was elevated to 1.4-fold compared with control values at day 60 (Figure 9B).
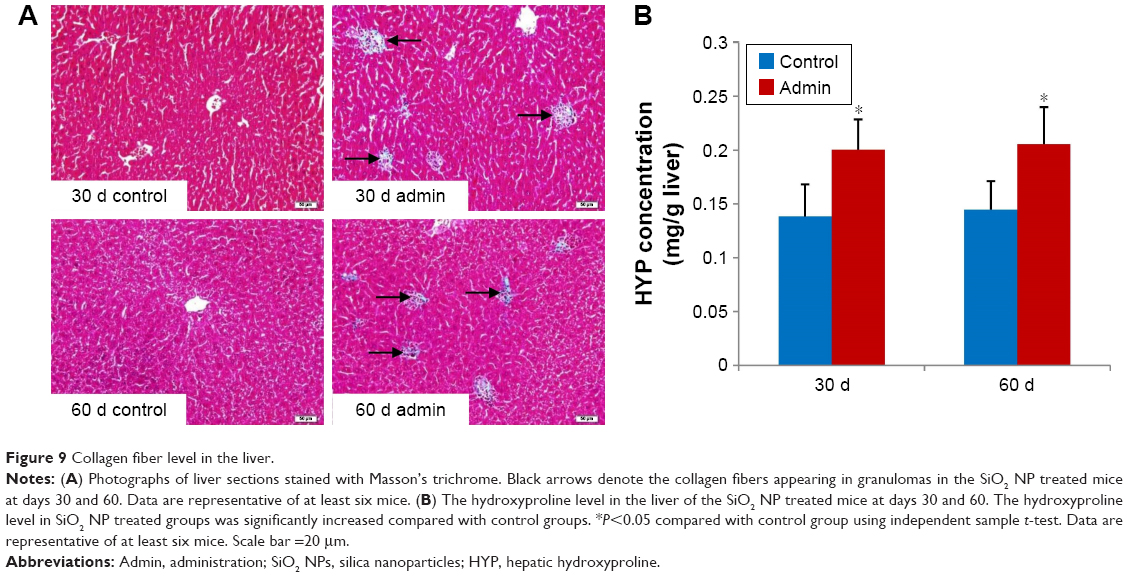 | Figure 9 Collagen fiber level in the liver. |
TGF-β1/Smad3 pathway protein expressions
Figure 10 showed the changes of TGF-β1/Smad3 pathway protein expressions in the livers induced by SiO2 NPs at day 30 and day 60. As shown in Figure 10A, intravenous administration of SiO2 NPs induced upregulation of protein expression of TGF-β1, Smad3, and p-Smad3 in the livers at day 30 and day 60. In order to confirm the results of Western blotting, we conducted immunohistochemical staining of p-Smad3 in the liver sections of mice. As shown in Figure 10B and C, in the liver sections of control mice, p-Smad3 was mainly expressed in the nucleus of hepatocytes with large nucleus or binucleated, while in the livers of SiO2 NP treated mice, p-Smad3 expression was observed not only in the hepatocytes, but also in the KCs and HSCs or myofibroblast in the hepatic sinusoid or in the granulomas.
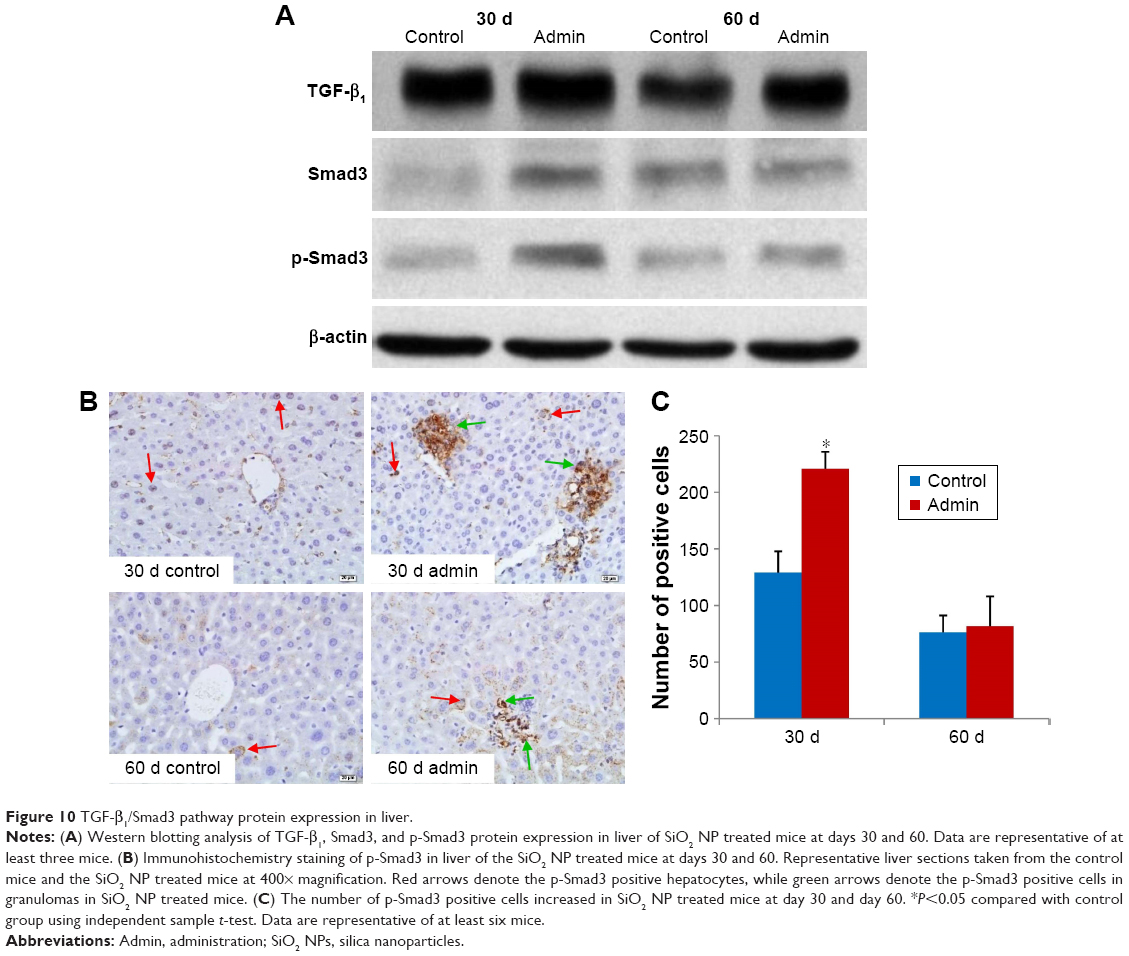 | Figure 10 TGF-β1/Smad3 pathway protein expression in liver. |
Discussion
In the present study, intravenous injection of SiO2 NPs induced hepatic granuloma formation, oxidative damage, and apoptosis. Oxidative damage and apoptosis activated TGF-β1/Smad3 signaling pathway and then resulted in hepatic fibrogenesis. This study provided important information for the hepatic toxicity evaluation and the biomedical and pharmaceutical application of SiO2 NPs.
The most important observation in the present study is liver fibrosis induced by intravenous exposure to SiO2 NPs. The liver fibrosis induced by SiO2 NPs was initiated from the granuloma formation. Granuloma is an innate immune response designed to isolate xenobiotics initiated by the phagocytosis of macrophages. Granuloma induced by nanomaterials through different exposure routes, including intratracheal instillation and intravenous injection, has been reported by several studies.9,16,17 In the previous study, we demonstrated that SiO2 NPs induced granuloma in the liver in a dose-dependent manner.7 In the early phase, the granuloma consists of different kinds of cells including macrophages, lymphocytes, and neutrophils, but in the late phase, during the HSC and fibroblast activation, accumulation of excessive extracellular matrix (ECM) contributes to the progression of liver fibrosis.
Oxidative damage is recognized as the most important toxic mechanism of nanomaterials, including SiO2 NPs. It is well known that SiO2 NPs induce ROS production and oxidative damage in different cell lines in a dose-dependent manner.12,18,19 This study demonstrated increased MDA level and decreased SOD and GSH-Px activities in the liver induced by the deposition of SiO2 NPs, indicating the elevation of ROS production and oxidative stress caused by SiO2 NPs. Because of the unsaturated bond and silicon-bonded hydroxyl groups on the particle surface, SiO2 NPs are prone to induce ROS generation and oxidative damage.20 Our previous studies indicated that SiO2 NPs could enter the cells and induce oxidative stress in different cell lines in a dose- and size-dependent manner.12,18,19 Park and Park reported that SiO2 NPs induced ROS generation and GSH levels decreased in macrophage cell line RAW 264.7 cells.21 Meanwhile, there is a substantial body of evidence indicating that oxidative damage is a common pathological feature of fibrosis, and plays an important role in the development of fibrogenesis under different pathological conditions.22 ROS could enhance the gene expression of TGF-β1 which is considered to be the most potent profibrogenic cytokine, and plays important roles in the development of fibrogenesis, and induces deposition of ECM in tissue injuries in many organs such as the heart, the lungs, the kidney, and the liver.23–26 ROS also mediates a series of profibrogenic effects of TGF-β1 including fibroblast migration and maintaining the myofibroblast phenotype.27,28 Azad et al found that ROS mediated fibroblast activation and collagen composition was induced by carbon nanotubes.29 In the present study, the oxidative damage induced by SiO2 NPs may trigger the expression of TGF-β1, thus activating the HSCs and fibroblasts, and contributing to the pathogenesis of liver fibrosis.
Accumulating evidence indicates that apoptosis may be linked to the development of fibrogenesis directly. It was shown that inhibition of caspase to reduce apoptosis could ameliorate tissue fibrosis.30 In this study, we observed that SiO2 NPs induced more TUNEL-positive hepatocytes and KCs in the experimental groups. It has been reported that persistent hepatocyte apoptosis led to liver fibrosis.31 The apoptotic hepatocyte cells would be effectively and rapidly engulfed by KCs in the liver, and the accumulation of apoptotic bodies in KCs would enhance the proinflammatory cytokine TNF-α in KCs, thereby speeding up hepatocyte apoptosis and inducing hepatic inflammation.32 Besides, phagocytosis of apoptotic hepatocytes would promote generation of TGF-β1 and thus accelerate liver fibrosis. We still observed prominent KC apoptosis in this study, which was also reported to be associated with liver fibrosis, through in turn activating HSCs by releasing TGF-β1.33
TGF-β1 has been shown to stimulate the proliferation and activation of fibroblasts and HSCs in the liver. Smad3 is the central mediator conveying signals from receptors for TGF-β1 to the nucleus, and p-Smad3 is a mark of activation for the TGF-β1/Smad3 signaling pathway.34–36 The activation of TGF-β1/Smad3 signaling pathway led to the expression of profibrogenic genes.37 So above all, in the present study, intravenous injection of SiO2 NPs induced oxidative damage and apoptosis in the liver, which activated TGF-β1/Smad3 signaling pathway and contributed to liver fibrosis. But the mechanism needs to be further explored.
Besides, when we studied the toxicity and mechanism of nanoparticles, we should also pay attention to reducing the toxicity of nanoparticles. Surface modification of nanoparticles has been recognized as one important way to increase the stability and reduce the toxicity of nanoparticles. It was reported that SiO2 NPs modified with amine functional groups induced less serious lung inflammation and possessed better biocompatibility.38 Lu et al found that amino and carboxyl surface modification mitigated the hepatic toxicity of SiO2 NPs.39 However, there is a lack of more meticulous and systemic studies about the effects of surface modification on the toxicity of SiO2 NPs. Indeed, we are conducting a comparative study of PEG-SiO2 NPs and naked SiO2 NPs in our lab.
In the present study, the level of hepatic fibrosis gradually deteriorated as the granulomas, oxidative damage, and apoptosis in the liver was gradually relieved within the observation period. Further study is needed to explore the related mechanisms. It is also noteworthy that liver function remained in a deteriorated condition in the SiO2 NP treated mice at the end of this study. So above all, in biomedical and pharmaceutical application, attention should be paid to the profibrogenic effects and hepatic toxicity of amorphous SiO2 NPs.
Conclusion
In conclusion, we investigated the hepatic fibrosis and related mechanisms induced by intravenous injection of SiO2 NPs in vivo. In the observation period, SiO2 NPs were distributed in the hepatocytes, KCs, HSCs, and fibroblast cells, and induced oxidative damage and apoptosis, thus activating the TGF-β1/Smad3 signaling pathway, thereby activating HSCs and fibroblast cells to initiate and promote liver fibrosis. Thus, the impairment of liver function and profibrogenic effects induced by SiO2 NPs in biomedical and pharmaceutical application is noteworthy. It was confirmed that SiO2 NPs could cause fibrosis via oxidative stress and apoptosis for the first time. Further mechanisms in hepatic fibrosis, and how to alleviate or avoid liver injury in intravenous exposure to SiO2 NPs needs to be studied in the near future.
Acknowledgment
The authors acknowledge financial support from National Natural Science Foundation of China (no 81602876) and Special Project of Beijing Municipal Science & Technology Commission (KZ201410025022).
Disclosure
The authors report no conflicts of interest in this work.
References
National Institute of Environmental Health Sciences, National Institutes of Health, U.S. Department of Health and Human Services. National Toxicology Program (NTP). Chemical Information Review Document for Silica Flour [CAS No.14808-60-7]. Research Triangle Park, NC: National Institute of Environmental Health Sciences, National Institutes of Health, U.S. Department of Health and Human Services; 2009. Available from: https://ntp.niehs.nih.gov/ntp/noms/support_docs/silicaflour_oct2009.pdf. Accessed June 22, 2017. | ||
Neophytou AM, Yiallouros P, Coull BA, et al. Particulate matter concentrations during desert dust outbreaks and daily mortality in Nicosia, Cyprus. J Expo Sci Environ Epidemiol. 2013;23(3):275–280. | ||
OECD.org [homepage on the Internet]. Series on the safety of manufactured nanomaterials No. 27-ENV/JM/MONO(2010)46. OECD; 2010. Available from: http://www.oecd.org/science/nanosafety/. Accessed June 22, 2017. | ||
Saba TM. Physiology and physiopathology of the reticuloendothelial system. Arch Intern Med. 1970;126(6):1031–1052. | ||
Linkov I, Satterstrom FK, Corey LM. Nanotoxicology and nanomedicine: making hard decisions. Nanomedicine. 2008;4(2):167–171. | ||
Kumar R, Roy I, Ohulchanskky TY, et al. In vivo biodistribution and clearance studies using multimodal organically modified silica nanoparticles. ACS Nano. 2010;4(2):699–708. | ||
Yu Y, Li Y, Wang W, et al. Acute toxicity of amorphous silica nanoparticles in intravenously exposed ICR mice. PLoS One. 2013;8(4):e61346. | ||
Nishimori H, Kondoh M, Isoda K, Tsunoda S, Tsutsumi Y, Yagi K. Histological analysis of 70-nm silica particles-induced chronic toxicity in mice. Eur J Pharm Biopharm. 2009;72(3):626–629. | ||
Nishimori H, Kondoh M, Isoda K, Tsunoda S, Tsutsumi Y, Yagi K. Silica nanoparticles as hepatotoxicants. Eur J Pharm Biopharm. 2009;72(3):496–501. | ||
van der Zande M, Vandebriel RJ, Groot MJ, et al. Sub-chronic toxicity study in rats orally exposed to nanostructured silica. Part Fibre Toxicol. 2014;11:8. | ||
Liu T, Li L, Teng X, et al. Single and repeated dose toxicity of mesoporous hollow silica nanoparticles in intravenously exposed mice. Biomaterials. 2011;32(6):1657–1668. | ||
Sun L, Li Y, Liu X, et al. Cytotoxicity and mitochondrial damage caused by silica nanoparticles. Toxicol In Vitro. 2011;25(8):1619–1629. | ||
Iwaisako K, Hatano E, Taura K, et al. Loss of Sept4 exacerbates liver fibrosis through the dysregulation of hepatic stellate cells. J Hepatol. 2008;49(5):768–778. | ||
Kivirikko KI, Laitinen O, Prockop DJ. Modifications of a specific assay for hydroxyproline in urine. Anal Biochem. 1967;19(2):249–255. | ||
Duan J, Yu Y, Yu Y, et al. Silica nanoparticles enhance autophagic activity, disturb endothelial cell homeostasis and impair angiogenesis. Part Fibre Toxicol. 2014;11;50. | ||
Tseng MT, Lu X, Duan X, et al. Alteration of hepatic structure and oxidative stress induced by intravenous nanoceria. Toxicol Appl Pharmacol. 2012;260(2):173–182. | ||
Osmond-McLeod MJ, Poland CA, Murphy F, et al. Durability and inflammogenic impact of carbon nanotubes compared with asbestos fibres. Part Fibre Toxicol. 2011;8:15. | ||
Li Y, Sun L, Jin M, et al. Size-dependent cytotoxicity of amorphous silica nanoparticles in human hepatoma HepG2 cells. Toxicol In Vitro. 2011;25(7):1343–1352. | ||
Duan J, Yu Y, Yu Y, et al. Silica nanoparticles induce autophagy and endothelial dysfunction via the PI3K/Akt/mTOR signaling pathway. Int J Nanomedicine. 2014;9:5131–5141. | ||
Napierska D, Thomassen LC, Lison D, Martens JA, Hoet PH. The nanosilica hazard: another variable entity. Part Fibre Toxicol. 2010;7(1):39. | ||
Park EJ, Park K. Oxidative stress and pro-inflammatory responses induced by silica nanoparticles in vivo and in vitro. Toxicol Lett. 2009;184(1):18–25. | ||
Liu RM, Gaston Pravia KA. Oxidative stress and glutathione in TGF-beta-mediated fibrogenesis. Free Radic Biol Med. 2010;48(1):1–15. | ||
Yoshioka K, Takemura T, Murakami K, et al. Transforming growth factor-β protein and mRNA in glomeruli in normal and diseased human kidneys. Lab Invest. 1993;68(2):154–163. | ||
Friedman SL. Seminars in medicine of the Beth Israel Hospital, Boston. The cellular basis of hepatic fibrosis. Mechanisms and treatment strategies. N Engl J Med. 1993;328(25):1828–1835. | ||
Border WA, Noble NA. Transforming growth factor β in tissue fibrosis. N Engl J Med. 1994;331(19):1286–1292. | ||
Coker RK, Laurent GJ. Pulmonary fibrosis: cytokines in the balance. Eur Respir J. 1998;11(6):1218–1221. | ||
Jiang F, Liu GS, Dusting GJ, Chan EC. NADPH oxidase-dependent redox signaling in TGF-β-mediated fibrotic responses. Redox Biol. 2014;2:267–272. | ||
Liu XX, Zhou HJ, Cai L, et al. NADPH oxidase-dependent formation of reactive oxygen species contributes to transforming growth factor β1-induced epithelial-mesenchymal transition in rat peritoneal mesothelial cells, and the role of astragalus intervention. Chin J Integr Med. 2014;20(9):667–674. | ||
Azad N, Iyer AK, Wang L, Liu Y, Lu Y, Rojanasakul Y. Reactive oxygen species-mediated p38 MAPK regulates carbon nanotube-induced fibrogenic and angiogenic responses. Nanotoxicology. 2013;7(2):157–168. | ||
Lee CG, Cho SJ, Kang MJ, et al. Early growth response gene 1-mediated apoptosis is essential for transforming growth factor beta1-induced pulmonary fibrosis. J Exp Med. 2004;200(3):377–389. | ||
Takehara T, Tatsumi T, Suzuki T, et al. Hepatocyte-specific disruption of Bcl-xL leads to continuous hepatocyte apoptosis and liver fibrotic responses. Gastroenterology. 2004;127(4):1189–1197. | ||
Guicciardi ME, Gores GJ. Apoptosis: a mechanism of acute and chronic liver injury. Gut. 2005;54(7):1024–1033. | ||
Liu C, Tao Q, Sun M, et al. Kupffer cells are associated with apoptosis, inflammation and fibrotic effects in hepatic fibrosis in rats. Lab Invest. 2010;90(12):1805–1816. | ||
Shi Y, Massagué J. Mechanisms of TGF-β signaling from cell membrane to the nucleus. Cell. 2003;113(6):685–700. | ||
Kubiczkova L, Sedlarikova L, Hajek R, Sevcikova S. TGF-β – an excellent servant but a bad master. J Transl Med. 2012;10:183. | ||
Chen JL, Shang QH, Hu W, Liu C, Mao WH, Liu HQ. Role of TGF-β1/Smads pathway in carotid artery remodeling in renovascular hypertensive rats and prevention by Enalapril and Amlodipine. J Geriatr Cardiol. 2012;9(2):185–191. | ||
Dooley S, ten Dijke P. TGF-β in progression of liver disease. Cell Tissue Res. 2012;347(1):245–256. | ||
Morris AS, Adamcakova-Dodd A, Lehman SE, et al. Amine modification of nonporous silica nanoparticles reduces inflammatory response following intratracheal instillation in murine lungs. Toxicol Lett. 2016;241:207–215. | ||
Lu X, Ji C, Jin T, Fan X. The effects of size and surface modification of amorphous silica particles on biodistribution and liver metabolism in mice. Nanotechnology. 2015;26(17):175101. |
 © 2017 The Author(s). This work is published and licensed by Dove Medical Press Limited. The
full terms of this license are available at https://www.dovepress.com/terms
and incorporate the Creative Commons Attribution
- Non Commercial (unported, 3.0) License.
By accessing the work you hereby accept the Terms. Non-commercial uses of the work are permitted
without any further permission from Dove Medical Press Limited, provided the work is properly
attributed. For permission for commercial use of this work, please see paragraphs 4.2 and 5 of our Terms.
© 2017 The Author(s). This work is published and licensed by Dove Medical Press Limited. The
full terms of this license are available at https://www.dovepress.com/terms
and incorporate the Creative Commons Attribution
- Non Commercial (unported, 3.0) License.
By accessing the work you hereby accept the Terms. Non-commercial uses of the work are permitted
without any further permission from Dove Medical Press Limited, provided the work is properly
attributed. For permission for commercial use of this work, please see paragraphs 4.2 and 5 of our Terms.