
Back to Journals » Journal of Multidisciplinary Healthcare » Volume 19
Short-Term Associations Between Ambient Air Pollution and Outpatient and Emergency Visits for Hypertension: A DLNM-Based Time-Series Analysis in Baise, Guangxi, China
Authors Xin M  , Liang J, Shang M, Guo R, Deng S, Wei X
Received 10 October 2025
Accepted for publication 15 January 2026
Published 24 January 2026 Volume 2026:19 573334
DOI https://doi.org/10.2147/JMDH.S573334
Checked for plagiarism Yes
Review by Single anonymous peer review
Peer reviewer comments 5
Editor who approved publication: Professor Charles V Pollack
Mengdong Xin, Jiancheng Liang, Mingmei Shang, Rui Guo, Shusong Deng, Xiaoxiao Wei
School of Public Health, Youjiang Medical University for Nationalities, Baise, Guangxi, People’s Republic of China
Correspondence: Jiancheng Liang, School of Public Health, Youjiang Medical University of Nationalities, No. 98 Chengxiang Road, Youjiang District, Baise, Guangxi, 533000, People’s Republic of China, Email [email protected]
Background: Despite growing evidence that short-term ambient air pollution increases hypertension risk, data from China’s border regions are limited; this study quantifies the association between daily pollutant concentrations and daily emergency and outpatient visits for hypertension in Baise, a southern border city.
Methods: We collected hypertension case data from two tertiary hospitals in Baise City (1 Jan 2020– 30 Dec 2022) and concurrent local air pollutant and meteorological data, and used a distributed lag non-linear model (DLNM) to assess pollutant effects on outpatient and emergency visits, with subgroup analyses by sex, age, and season.
Results: Every 10 μg/m3 increase in PM2.5 (lag06), PM10 (lag06), NO2 (lag06), and every 100 μg/m3 increase in CO (lag04), the risk of hypertension outpatient/emergency department visits increased by 3.2%, 2.8%, 14.8%, and 3.0%, respectively. Exposure–response curves were approximately linear without a clear threshold. There was no statistically significant effect modification by sex or age, whereas associations were stronger in the cold season than in the warm season.
Conclusion: Short-term exposure to pollutants such as PM2.5, PM10, NO2, and CO is significantly associated with increased outpatient and emergency visits for hypertension, exhibiting a lag effect. During cold seasons, sensitivity to environmental pollutants among hypertensive patients markedly increases.
Keywords: air pollutants, DLNM, relative risk, hypertension outpatient and emergency visits
Introduction
Hypertension (HTN), a significant worldwide health concern, is a principal contributor to the heightened illness load.1 Relevant studies indicate that in 2023, there are more than 1.28 billion persons with hypertension globally, with 82% living in low and middle-income countries.2 In the United States, the direct medical costs associated with hypertension amount to US$1,497 per person per year, while in nations with poor and moderate incomes, this burden is even heavier.3,4 In China, about one-third of adults suffer from hypertension, and the prevalence increases significantly with age, exceeding 50% in the 70–74 age group.5 The Baise region, located on the southern border of China, faces a more prominent issue with the burden of hypertension due to the relatively lagging development of social health services.6
An increasing amount of epidemiological research has been done in recent years to examine the connection between air pollution and hypertension. Studies in the United Kingdom, Seoul in South Korea, Tehran in Iran, Guangzhou, and Shijiazhuang in China have shown a correlation between air pollutants and hypertension.7–11 However, most of these studies are concentrated in developed countries or central cities of developing countries, and the results often vary. These differences are related to the different mixtures of air pollutants and socio-demographic conditions in each city.12 Similar research evidence is very limited in border cities of developing countries. Additionally, past studies have mainly used generalized additive models to analyze the impact of real-time exposure levels on diseases, overlooking the delayed effects.
Baise City is situated in the western part of the Guangxi Zhuang Autonomous Region, at the southern border of China, where it lies at the intersection of two countries and three provinces (or regions). The city possesses a subtropical monsoon climate, distinguished by ample sunshine and warmth, including prolonged summers and brief winters. Covering a spatial extent of 36,300 km2, Baise constitutes a prefecture-level city in southwestern China characterized by a predominantly Zhuang ethnic presence (accounting for over 80% of its population) and functioning as a strategic resource base for the national aluminum industry, with its industrial output contributing 12% to the country’s total primary aluminum production. The city had 3.562 million permanent residents as of the end of 2022.13 Baise City’s air quality ranks in the upper-middle tier among Chinese cities. Due to the unique geographical location, industrial structure, and social demographic conditions of Baise City, the results of other studies may not be applicable. This study employed a distributed lag non-linear model (DLNM) to investigate the short-term association between exposure to air pollutants and hypertension outpatient and emergency outpatient and emergency department visits in Baise City from 2020 to 2022. The primary objective is to systematically analyze the relationship between air pollutant levels and outpatient and emergency visits for hypertension. By meticulously examining the association between fluctuations in specific pollutant concentrations and patient visit frequency, the study aims to elucidate the impact of short-term air quality changes on hypertension outpatient and emergency visits. The findings will provide evidence-based support for developing targeted public health policies and interventions to reduce the societal burden of hypertension.
Materials and Methods
Air Pollution and Meteorological Information
Air pollution data for Baise City from January 1, 2020 to December 31, 2022 were obtained from the Statistics Center of the Department of Ecology and Environment of Guangxi Zhuang Autonomous Region (http://sthjt.gxzf.gov.cn/). The daily average concentrations of PM2.5, PM10, SO2, NO2, and CO, and the daily maximum 8-hour average ozone concentration (O38h) are the six major air pollutants examined in this study. All measurements adhere to the Chinese National Air Quality Control Standards (GB3095-2012). Daily meteorological data for the same time were also gathered from the China Meteorological Data Network (http://data.cma.cn/) for Baise City due to the possibility of nonlinear mixed effects from meteorological elements, as mentioned in other studies.14,15 Among the climatic factors examined and adjusted were the daily average temperature and relative humidity. All data collection activities were conducted simultaneously at 12 national meteorological stations and three national air quality monitoring stations. Site distribution is shown in Figure S1. All three monitoring stations are located far from pollution sources, urban traffic, and buildings to ensure that the monitoring data accurately reflects the actual air pollution levels in our study area. Therefore, data obtained from these stations can represent the overall level of air pollution across the city. The missing rate for meteorological and atmospheric pollutant data is below 5%. Missing values are imputed using the average of the preceding and following dates.
Case Data Collection
Case data of hypertensive patients, including gender, age, visit date, and diagnosis codes, were collected from the Affiliated Hospital of Youjiang Medical University for Nationalities and the Southwest Hospital Affiliated to Youjiang Medical University for Nationalities during the study period. Both institutions rank among the largest and best-equipped comprehensive tertiary hospitals in Baise City. Together they operate three campuses, have a combined capacity exceeding 4,400 beds, and record over one million outpatient and emergency visits each year. The two hospitals have advanced and complete electronic medical record (EMR) systems. They are regional medical centers with patients from all districts and counties in Baise City. Cases with codes I10-I15 (hypertensive disorders) were included in this study, whereas non-permanent inhabitants of Baise City were excluded, following the International Classification of Diseases, 10th version (ICD-10) as the criterion for case selection. The dataset includes all outpatient and emergency visits recorded at the two hospitals.
Statistical Analysis
Spearman correlation analysis was conducted on daily hypertension outpatient and emergency visits about air pollutants and meteorological factors to identify and exclude those air pollutant factors not associated with hypertension outpatient and emergency visits. To prevent multicollinearity, when the absolute value of the correlation coefficient between two factors exceeded 0.7, these factors were not included simultaneously in the subsequent modeling.16,17 Considering the total population of Baise City, the daily hypertension outpatient and emergency visits of residents are a rare event, the data are highly dispersed, and the hypertension outpatient and emergency visits exhibit a nonlinear relationship with the concentration of air pollutants.18 Therefore, this study utilized the quasi-Poisson regression of the generalized additive model (GAM) combined with the DLNM.19,20
The core idea of DLNM is to flexibly describe the nonlinear and lagged effects in the exposure-response relationship through cross-basis function (cross-basis) and, at the same time, to reduce the interference of confounding variables on causality estimation by incorporating them into the model as control variables, which is suitable for dealing with complex time series data.20 In our study, we quantitatively assessed air pollutant-residential hypertension outpatient and emergency visits by using the environmental pollutant factors associated with the number of daily hypertension outpatient and emergency visits as the independent variables and the number of daily hypertension outpatient and emergency visits as the dependent variable, as well as controlling for the effects of confounding effects such as long-term trends in time, seasonality, and the influence of meteorological factors through the natural cubic spline (NS) function.21,22 The core model is as follows:23,24

Here, t denotes the date of a hypertension outpatient and emergency visits, L represents the lagged day count, β is the matrix coefficient, α indicates the intercept term, and Xt,L is the cross-term basis function matrix for air pollutants. Yt represents the number of hypertension outpatient and emergency visits on day t. The ns term represents the natural cubic spline function (ns). Temt and rht denote the temperature and relative humidity on day t, respectively. Timet is the time variable. Dow (the value was 1 to 7) represents the sequence from Monday to Sunday, and Hol (categorical variable) is used to adjust for the day-of-week effect and holiday effect, respectively. Degrees of freedom were selected using the Quasi-Akaike information criterion (Q-AIC).25 In this study, the degrees of freedom for the time variable were set to 7df/year to control for long-term and seasonal trends. The degrees of freedom for both mean temperature and relative humidity were set to 3 to account for the confounding effects of meteorological factors. Research indicates that the lagged effects of air pollutants on the cardiovascular system typically do not exceed 7 days.18,26 Consequently, the maximum lag duration in this study was set at seven days, and the model was fitted to investigate the impacts of cumulative multi-day delays (from lag01 to lag07) and single-day lags (from lag0 to lag7). After the model was constructed, the Relative Risk (RR) and 95% Confidence Interval (CI) of hypertension outpatient and emergency visits were calculated using the median concentration of ambient pollutants as the reference value for each 10 μg/m3 increase in PM2.5, PM10, SO2, NO2, and O38h (and each 100 μg/m3 increase in CO).
Given the subtropical monsoon climate of the region, characterized by long, hot summers and short, mild winters, the annual temperature distribution in the study area actually exhibits a bimodal pattern. There is no continuous, distinct “hot” season that can be clearly distinguished from the broader “warm season.” During the warm season, temperatures remain consistently elevated, exerting a uniform influence on human behavior and physiological responses. Conversely, a distinct “cold season” is clearly delineated. This warm/cold dichotomy aligns with the region’s established climatic pattern. It represents a commonly employed methodology in regional epidemiological studies to control for the strong, differential confounding effects of temperature, particularly regarding cardiovascular health outcomes.27,28 The analysis was stratified by gender (male, female), age (<65 years, ≥65 years), and season (cold season: November to April of the following year, warm season: May to October), and intergroup differences were compared using the Z-test based on the analysis results to assess the susceptibility of different populations.29 The formula for the Z-test is as follows:
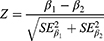
Among them, β1 and β2 are the estimated effects for the two subgroups, SEβ1 and SEβ2 are the corresponding standard errors for the two subgroups. Finally, the stability of the model was tested using the dual-pollutant model and by altering the degrees of freedom in time.
IBM SPSS Statistics 26.0 software was used to characterize and analyze the data for Spearman correlation statistically; P < 0.05 was deemed statistically significant. The “dlnm” package in R software version 4.3.4 was used to fit the model.
Results
Basic Information
This research project encompassed 58,139 hypertensive patients ranging in age from 3 to 98 years old, with an average age of 51.1 years. On average, 53 patients visit the outpatient and emergency departments of the two hospitals each day. Male patients accounted for 54.31% of the total, while female patients constituted 45.69%. Patients under 65 years old comprised 53.45% of the cohort, with those aged 65 and above representing 46.55%. As shown in Table 1.
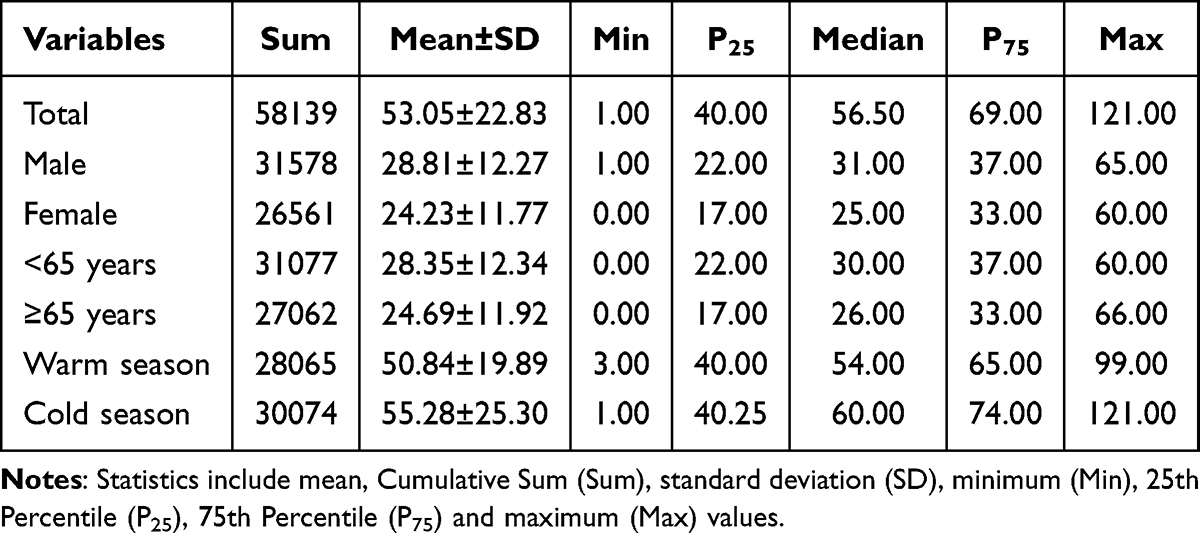 |
Table 1 Daily Counts of Hypertension Outpatient and Emergency Visits in Baise, China, 2020–2022 |
As shown in Table 2, AQI, PM2.5, PM10, SO2, NO2, CO, and O38h had average values of 48.04, 28.57 μg/m3, 49.30 μg/m3, 12.42 μg/m3, 16.63 μg/m3, 820.00 μg/m3, and 58.15 μg/m3, respectively. The average values for the climatic variables, temperature and relative humidity, were 20.51°C and 77.84%, respectively. During the 1,096 days covered by this study, a total of 468 days failed to meet air quality standards based on the Air Quality Index (AQI) criteria (defined as days with AQI > 50), accounting for 42.7% of the total days.
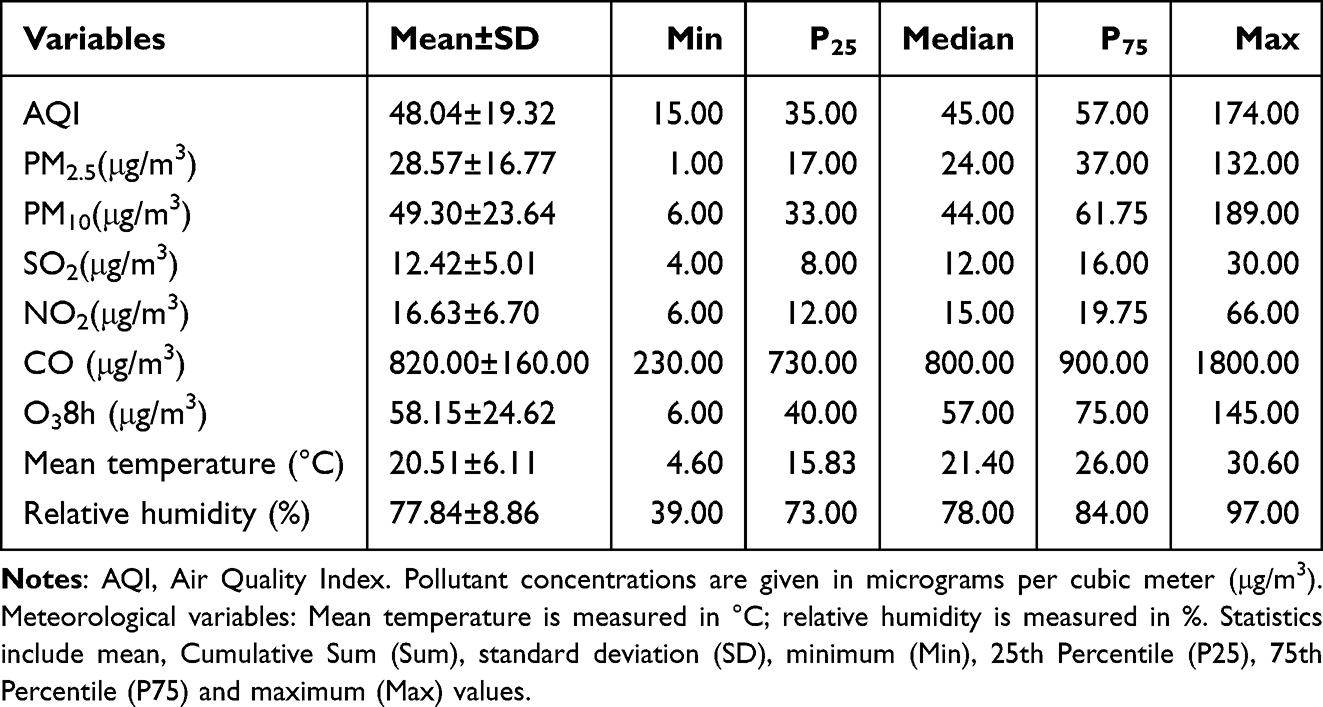 |
Table 2 Summary Statistics of Daily Air Pollutant Concentrations and Meteorological Variables in Baise, China, 2020–2022 |
The time series for daily total hypertension outpatient and emergency visits and airborne pollutants levels during the course of the investigation are shown in Figure 1. There are noticeable seasonal variations in the concentrations of PM2.5, PM10, NO2, and CO, which are lower in summertime and fall and higher in the winter and spring. In contrast, the levels of O38h show an inverse pattern, with higher concentrations in the warmer months. SO2, however, does not demonstrate a distinct seasonal trend.
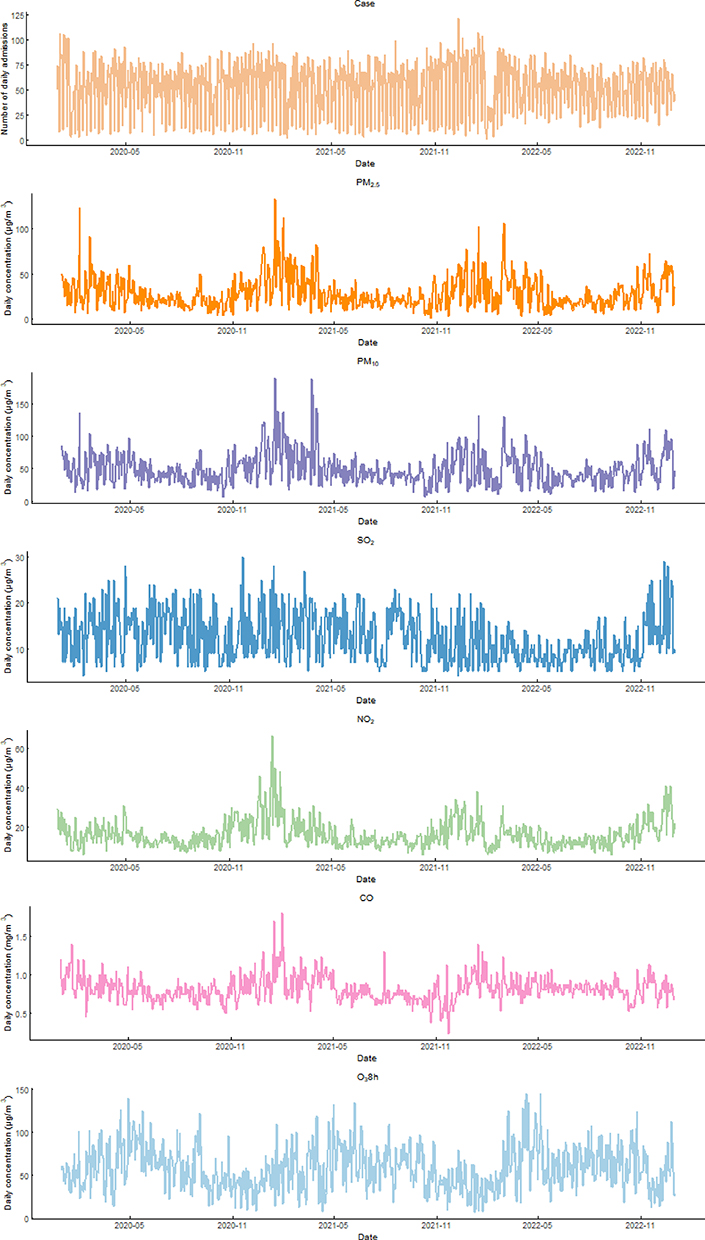 |
Figure 1 Time series of hypertension outpatient and emergency visits and air pollution concentrations in Baise, China, 2020–2022. |
Analysis of the Correlation Between Hypertension Outpatient and Emergency Visits and Air Pollutants, Meteorological Factors
Table 3 displays the correlation between hypertension outpatient and emergency visits and both air pollutants and meteorological factors. Notably, the correlations between SO2 and O38h with hypertension outpatient and emergency visits were not statistically significant (P > 0.05). As a result, only PM2.5, PM10, NO2, and CO were considered as exposure factors for air pollutants. PM2.5, PM10, and NO2 show strong correlations with each other (|r| > 0.7), so any two of these factors were not included in the model simultaneously.
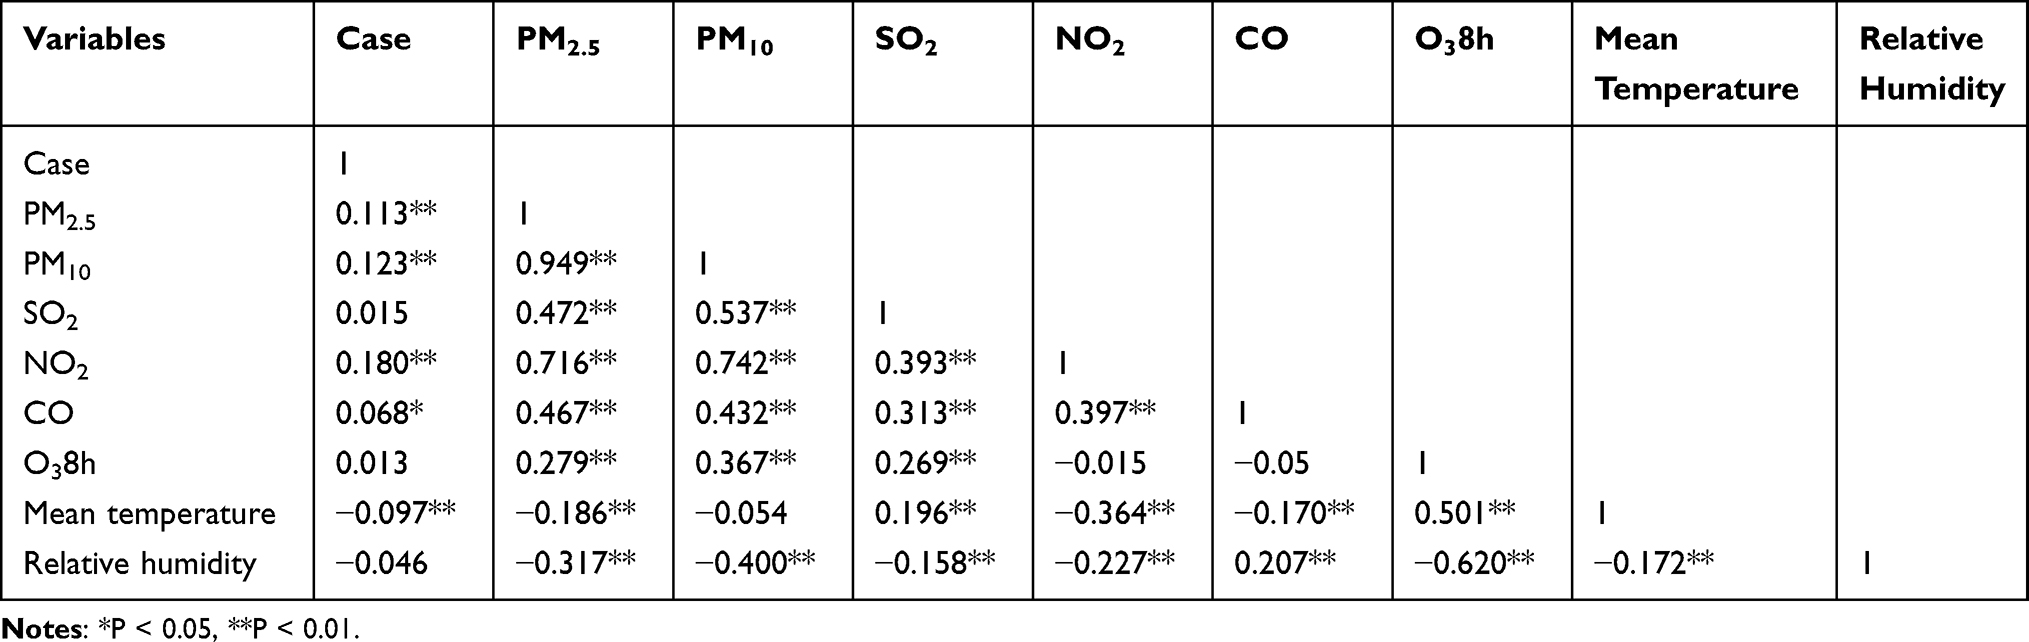 |
Table 3 Spearman Rank Correlations Among Daily Hypertension Visits, Air Pollutant Concentrations, and Meteorological Variables in Baise, 2020–2022 |
The Impact of Short-Term Exposure to Air Pollutants on Hypertension Outpatient and Emergency Visits
Exposure-Response Curves
The exposure-response curves between hypertension outpatient and emergency visits at lag07 and air pollution are shown in Figure 2. The curves for PM2.5, PM10, NO2, and CO exhibit nearly linear relationships, with no evident threshold for the relative risk of hypertension outpatient and emergency visits. As the concentrations of these pollutants rise, the cumulative relative risk increases correspondingly.
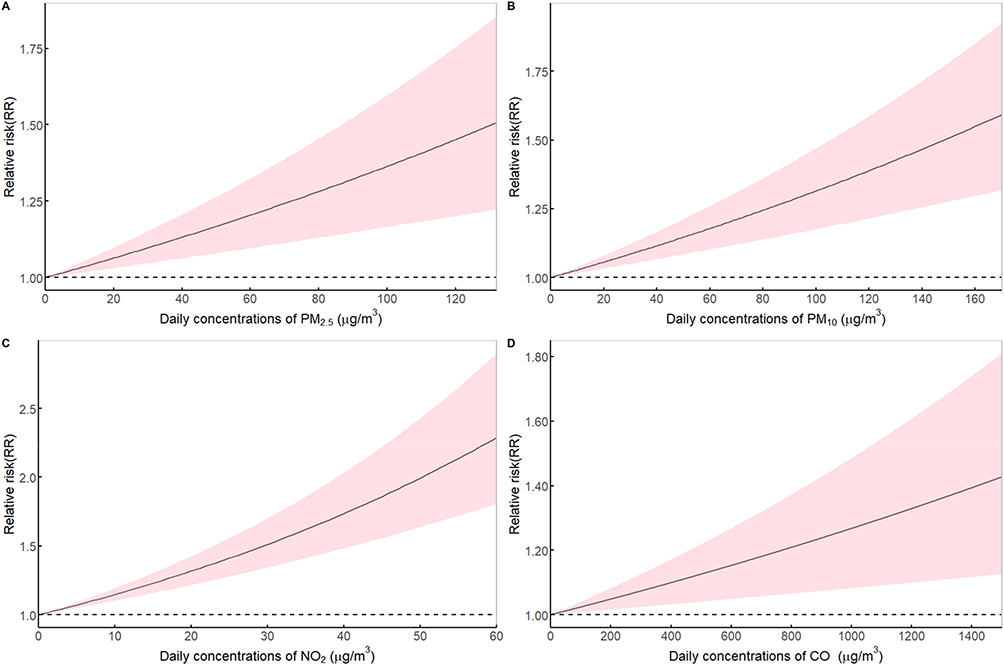 |
Figure 2 The air pollution exposure-response curves with hypertension outpatient and emergency visits at lag07. (A) PM2.5, (B) PM10, (C) NO2, (D) CO. |
The Impact and Lag (Cumulative) Effects of Different Air Pollutants
Table 4 shows the RR and 95% CI for the number of hypertension outpatient and emergency visits at different lag times for every 10 μg/m3 rise in the concentration of air pollutants (and for every 100 μg/m3 increase in CO concentration). PM2.5 has an adverse effect on hypertension outpatient and emergency visits from lag01 to lag07 days. Among these, the most significant impact was observed on lag 06, with an RR value of 1.032 (95% CI: 1.015, 1.048). PM10 had adverse effects on lag0, lag1, lag4, lag5, and lag01 to lag07 days, with the most significant impact on lag06 days, with an RR value of 1.028 (95% CI: 1.016, 1.039). NO2 showed adverse effects on lag0, lag1, lag4, and from lag01 to lag07 days, with the most significant impact occurring on lag06, where the RR value was 1.148 (95% CI: 1.104, 1.194). CO had an adverse effect on lag1, lag2, and from lag01 to lag06 days, with the most significant impact observed on lag04, with an RR value of 1.030 (95% CI: 1.016, 1.045).
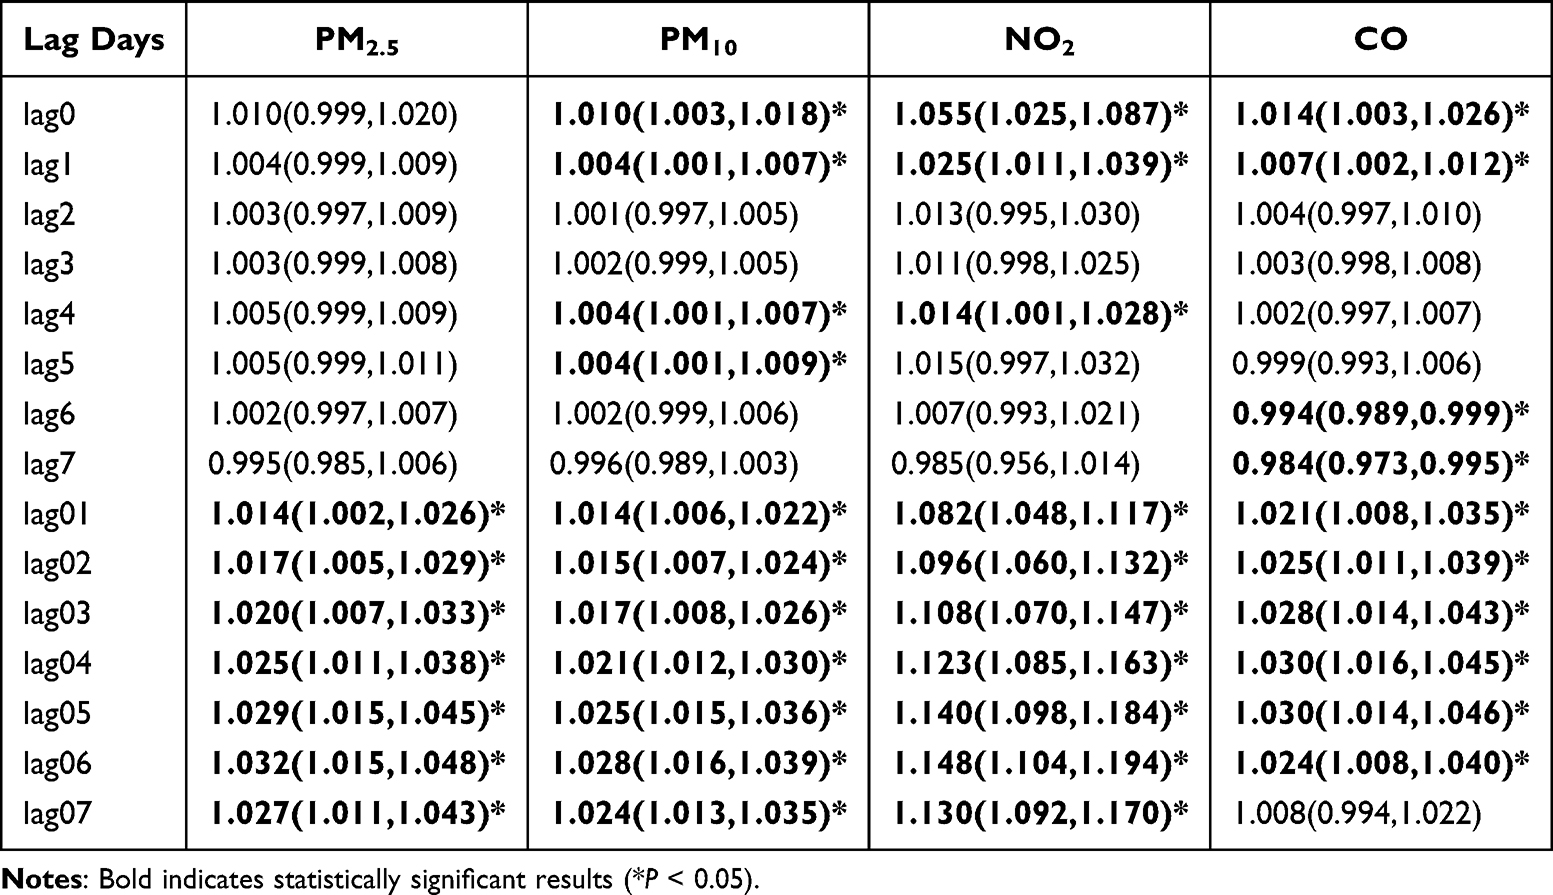 |
Table 4 Relative Risk (95% Confidence Interval) of Hypertension Outpatient and Emergency Visits Associated with a 10 μg/m3 Rise in Air Pollutants (and 100 μg/m3 in Carbon Monoxide) as per the Single-Pollutant Model |
The Impact of Air Pollutants on Hypertension Outpatient and Emergency Visits in Different Subgroups of the Population
Gender Subgroup
Figure 3 and Table S1 show the relative risk (RR) and 95% confidence interval (CI) for the number of hypertension-related emergency and outpatient visits across different genders in the single-pollutant model. The findings show that although there are slight differences in the relative risk of hypertension for the two subgroups exposed to the four air pollutants, these differences are not statistically significant (P > 0.05).
 |
Figure 3 Relative risk (95% CI) of hypertension outpatient and emergency visits stratified by sex for each 10 μg/m3 increase in air pollutant concentration (each 100 μg/m3 increase in CO) in single-day lags and cumulative lags. (A) PM2.5, (B) PM10, (C) NO2, (D) CO. |
Age Subgroup
Figure 4 and Table S2 show the relative risk (RR) and 95% confidence interval (CI) for the number of hypertension emergency and outpatient visits across different age groups in the single-pollutant model. Four air pollutants, PM2.5, PM10, NO2, and CO, have adverse effects on hypertension across different age groups, but the differences in these adverse effects between the two subgroups are not statistically significant (P > 0.05).
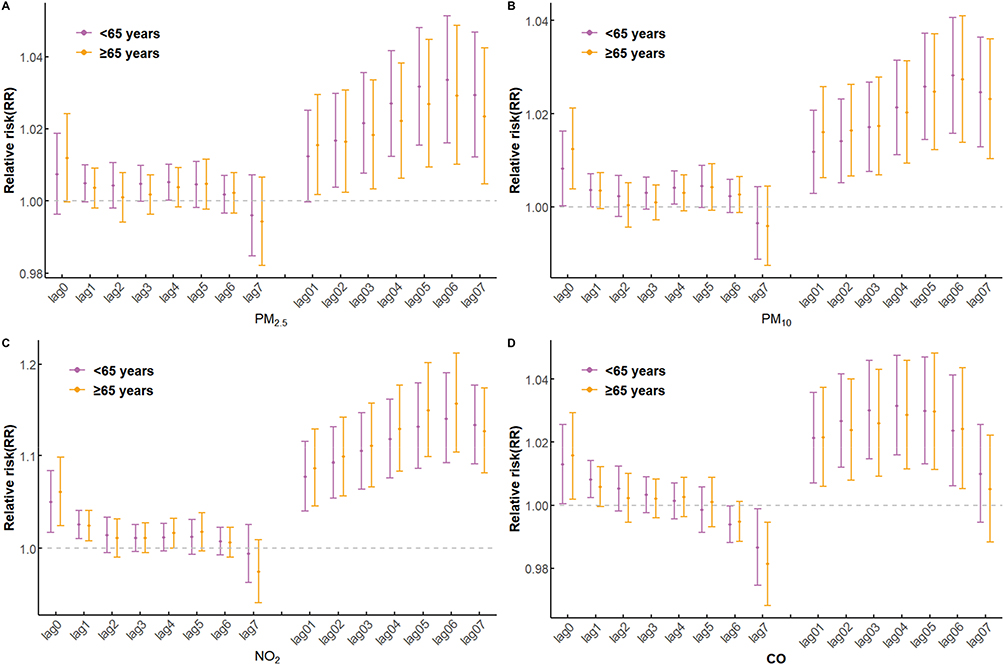 |
Figure 4 Relative risk (95% CI) of hypertension outpatient and emergency visits stratified by age for each 10 μg/m3 increase in air pollutant concentration (each 100 μg/m3 increase in CO) in single-day lags and cumulative lags. (A) PM2.5, (B) PM10, (C) NO2, (D) CO. |
Seasonal Subgroup
Figure 5 and Table S3 show the relative risk (RR) and 95% confidence interval (CI) for the number of hypertension-related emergency and outpatient visits across different seasons in the single-pollutant model. Research findings indicate that air pollution exhibits significant seasonal variation in its impact on hypertension outpatient and emergency visits (P < 0.05). In particular, during the cold season, as opposed to the warm season, the effects of PM2.5, PM10, NO2, and CO on HTN are more noticeable. The most significant adverse impacts are reported at lag 06 for PM2.5, PM10, and CO, and at lag05 for NO2, with corresponding relative risk (RR) values of 1.038 (95% CI: 1.017, 1.060), 1.034 (95% CI: 1.019, 1.050), 1.176 (95% CI: 1.120, 1.234), and 1.041 (95% CI: 1.021, 1.061).
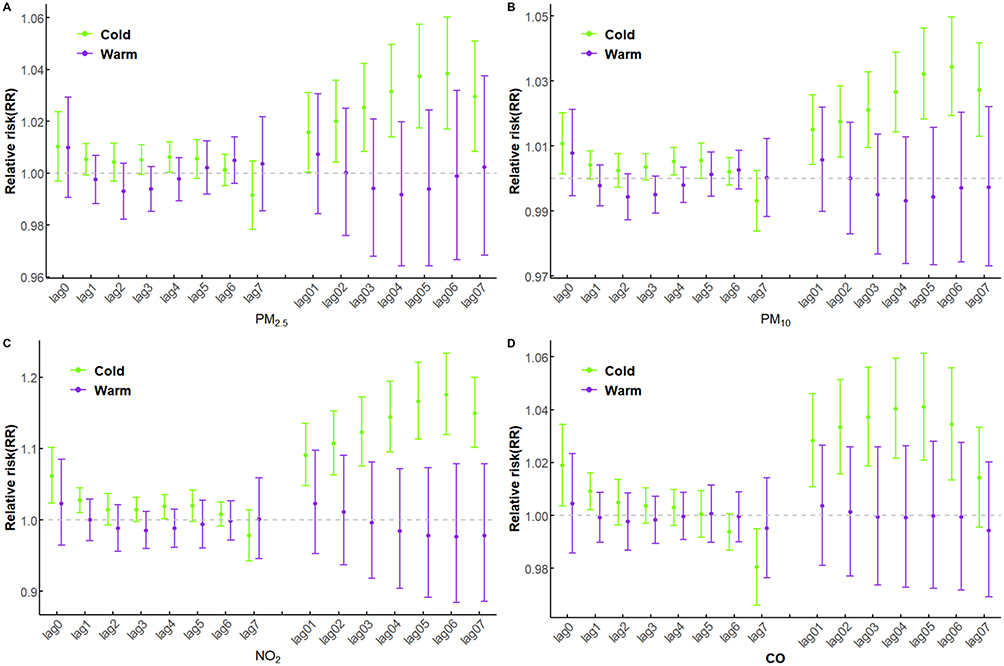 |
Figure 5 Relative risk (95% CI) of hypertension outpatient and emergency visits stratified by season for each 10 μg/m3 increase in air pollutant concentration (each 100 μg/m3 increase in CO) in single-day lags and cumulative lags. (A) PM2.5, (B) PM10, (C) NO2, (D) CO. |
Model Sensitivity Analysis
Table S4 presents the results showing changes in the relative risk (RR) values for hypertension outpatient and emergency visits corresponding to a 10 μg/m3 increase in PM2.5, PM10, and NO2 concentrations (as well as a 100 μg/m3 increase in CO concentration) calculated using both single-pollutant and dual-pollutant models. Due to the strong correlation between PM2.5, PM10, and NO2, PM2.5, PM10, and NO2 will not coexist simultaneously in the model, with only two of them present at a time. After incorporating other pollutants into the model, all pollutants maintained a significantly stable association with the relative risk of hypertension outpatient and emergency visits at lag07 days. Table S5 shows the results of evaluating the model’s robustness by changing the time freedom from 6 to 10, with no significant change in the effect estimates. The above results indicate that the relationship between air pollution derived from the model and the hypertension outpatient and emergency visits is stable and reliable, with a good model fit.
Discussion
This study covers 58,139 cases of hypertension treated in two hospitals in Baise City from January 2020 to December 2022. The study findings suggest that short-term exposure to PM2.5, PM10, NO2, and CO is significantly associated with visits to outpatient clinics and emergency departments for hypertension. The relationship between air pollutants and the number of hypertension outpatient and emergency visits varies by season, with no statistically significant differences between genders or age groups. Since this study is a retrospective ecological study, this implies that such associations do not constitute strong causal relationships.
Research has found that increases in environmental concentrations of PM2.5, PM10, NO2, and CO are all associated to varying degrees with rising numbers of outpatient and emergency visits for hypertension. The outcomes of this study are generally comparable to those of other cities, but there are differences in the extent of the impact. For example, a study from Fuzhou, China, showed that for every 10 μg/m3 increase in the concentrations of PM2.5, PM10, NO2, and CO, the hospital admission rates for individuals with HTN increased by 0.56%, 0.31%, 1.18%, and 0.03%, respectively.30 A research report from Isfahan, Iran, indicates that for every 10 μg/m3 increase in PM10 concentration, the risk of hospital admissions related to HTN increases significantly by 2.11%.31 A study in Ahvaz, Iran, indicates that for every 10 μg/m3 increase in NO2 concentration, the risk of hospital admission for HTN increases by a ratio of 1.026 (95% CI: 1.007, 1.045).26 These differences in the extent of the impact may be related to Baise City’s location on the southwestern border, its unique social demographic conditions, and varying levels of air pollution, or it could be due to Baise City’s relatively lower socioeconomic status and average education level compared to inland central cities, resulting in lower living standards and health literacy.32,33 Therefore, further discussion is needed on research related to similar border cities.
In terms of lag effects, this study found that the adverse effects of PM2.5, PM10, and NO2 were strongest at lag06 days, while the lag effect of CO was strongest at lag04 days. This differs from previous research findings. Song et al discovered in Shijiazhuang that the effects of PM2.5, PM10, NO2, and CO were most significant at lag06, lag06, lag03, and lag04, respectively.11 Liu et al, in their study in Lanzhou, found that the adverse effects of PM2.5 and PM10 were most significant at lag07. At the same time, those of NO2 and CO were most significant at lag1.18 The reason for this disparity may be that the majority of residents in Baise City are ethnic minorities. Different populations have varying susceptibilities to diseases.34 The differences in the sources and composition of pollutants may also play a role. For instance, in Lanzhou, particulate matter (PM) primarily comprises mixed pollution from traffic and coal combustion, including fat-soluble substances such as Polycyclic Aromatic Hydrocarbons (PAHs). These components remain in the alveoli for extended periods, resulting in prolonged metabolic clearance and a longer timeframe required to accumulate their toxic effects.35 In contrast, Baise contains industrial aluminum dust (eg, fluoride), which has high solubility and may reduce the lung retention time, potentially accelerating the peak of cumulative toxicity compared to Lanzhou.36
Exposure-response curves play a vital role in assessing the impact of environmental factors on non-communicable diseases. This study identified an approximately linear relationship between the concentrations of PM2.5, PM10, NO2, and CO and the relative risk of hypertension outpatient and emergency visits. However, limited literature examines the exposure-response relationship between air pollutants and HTN. For instance, in a previous study conducted in Lanzhou, the exposure-response curves for NO2 and CO were relatively stable compared to the findings in this study.18 This may be because the high exposure in Lanzhou City leads to adaptive responses in the body, which weaken the effect of pollutants per unit concentration increment and manifests itself as a flattening of the curve; at the same time, Baise City is located in a border area with a high percentage of ethnic minorities among the inhabitants, and the genetic factors and the low availability of healthcare resources may exacerbate the effects of pollution exposure.37
Identifying potentially susceptible subgroups holds significant implications for public health. After stratification by gender and age, this study found no significant differences in the association between PM2.5, PM10, NO2, and CO across the two groups. These results differ from some previous studies. For example, the Lanzhou study found that PM2.5 and PM10 had a greater impact on hypertension in women than in men, while NO2 and CO had a more significant effect on men. Additionally, individuals aged ≥65 years exhibited heightened sensitivity to the adverse effects of PM2.5, PM10, SO2, and CO.18 A Fuzhou study indicated more substantial impacts of PM2.5 and PM10 on males,30 but the Yichang study found no evidence of gender playing a role in the relationship between ambient air pollution and cardiovascular disease.38 These differences may relate to regional variations in lifestyle factors such as dietary habits and outdoor activity duration.39,40 Additionally, the effects of air pollutants on the cardiovascular system often operate through common pathways like inflammation and oxidative stress. Biological responses to these mechanisms may be similar across different demographic groups, potentially explaining the lack of significant effect differences.41
The seasonal stratification analysis showed that the impact of PM2.5, PM10, NO2, and CO on hypertension outpatient and emergency visits was more substantial during the cold season, with all differences being statistically significant. This is similar to the findings of a study in Shenzhen.42 The proportion of polycyclic aromatic hydrocarbons (PAHs) and heavy metals in PM produced by residential coal combustion is elevated in the cold season, and these components can exacerbate vascular endothelial damage by inducing oxidative stress and inflammatory responses;35 at the same time, it has been shown in a study that an increase in outdoor recreational activities reduces the level of patient’s BP, and that residents’ outdoor activities are significantly lower in the cold season compared to the warm season, which may also contribute to the existence of hypertension outpatient and emergency visits seasonal differences in hospital may also be one of the reasons.43
Hypertension is a chronic disease caused by the combined effects of multiple factors, primarily influenced by genetics, environment, diet, and other factors. Its pathogenesis involves multiple pathways. However, existing research indicates that air pollutants primarily affect blood pressure through four pathways. First, environmental pollutants stimulate inflammatory responses and oxidative stress within the body, leading to vascular endothelial dysfunction and elevated blood pressure;44,45 second, pollutants can enter the bloodstream, impairing vasodilation function and thereby increasing blood pressure;46 Third, pollutants stimulate the sympathetic nervous system, simultaneously affecting blood pressure and activating the hypothalamic-pituitary-adrenal axis, thereby elevating blood pressure through sodium and water retention and vasoconstriction mechanisms;47,48 Fourth, certain trace elements in environmental pollutants can regulate blood pressure by rapidly inducing hypomethylation of specific genes.49 Due to variations in the subcomponents of environmental pollutants and trace element concentrations across different regions, this may explain the discrepancies observed in epidemiological evidence regarding the impact of air pollutants on hypertension across different areas.
Industrial emissions significantly increase the burden of cardiovascular disease. A study from Yichang provides empirical evidence by comparing cardiovascular disease (CVD) outpatient visits before and after industrial relocation along the Yangtze River: relocating heavily polluting industries away from the river improved local air quality. It significantly reduced CVD outpatient demand, demonstrating that strict industrial relocation policies along the river can simultaneously achieve environmental improvements and cardiovascular health benefits.38 Given the documented improvements in air quality and cardiovascular health following the relocation of heavy industries along the Yangtze River in Yichang, similar policy approaches could be considered for the aluminum industry layout in Baise City. For instance, high-emission aluminum plants could be gradually relocated to areas with lower river density and reduced exposure risks for residents. Concurrently, measures such as installing industrial air-filtration systems and implementing process improvements to curb emissions could be adopted to mitigate pollution and alleviate the health burden on surrounding communities.
This study also has limitations. First, similar to most previous studies, it used average concentrations measured at fixed monitoring stations as indicators of personal exposure levels. Due to the spatial variability of air pollutants, this approach may introduce bias into exposure assessment results.50 Seconds, the inclusion of data from only one city, Baise, limits the extrapolation of conclusions. Third, it should be noted that although the overall sample size is adequate, the reduction in sample size after stratification may decrease the power of the study. Fourth, the time series includes the COVID-19 pandemic period. Although we have made every effort to control for long-term and seasonal variations in the data and ensure model robustness, this may still lead to underestimated effects in the results. Caution should be exercised when extrapolating findings. However, this study captures the temporary shifts in healthcare-seeking behavior during a significant public health crisis. It provides valuable real-time evidence for post-pandemic healthcare resource forecasting and planning, with conclusions that hold greater practical significance than simple extrapolations based on historical data.
In the future, we will integrate personal exposure monitoring technologies to reduce measurement errors and assess individual heterogeneity in exposure-dose relationships. Simultaneously, we will conduct comparative studies across multiple cities or regions, incorporating diverse pollution characteristics to enhance the generalizability of findings. Furthermore, we will introduce mechanistic research measures—through biomarker detection or combined with ambulatory blood pressure monitoring—to investigate the physiological pathways by which short-term pollution exposure affects blood pressure. This will strengthen causal associations and improve intervention feasibility.
Conclusion
The present study shows that short-term increases in ambient PM2.5, PM10, NO2, and CO are positively associated with higher rates of hypertension-related visits. The most significant effects were observed at lag06 for PM2.5, lag06 for PM10, lag04 for NO2, and lag06 for CO. Subgroup analyses indicated that these associations were significantly stronger during the cold season than the warm season, while no statistically significant differences were found by age or sex. These findings underscore the importance of timely air-quality monitoring and public health advisories—particularly in cold months to reduce acute hypertension risk through individual protective measures and targeted interventions. Overall, this study adds evidence linking short-term ambient air pollution to hypertension morbidity in a developing border city and highlights implications for environmental health policy; further research is warranted to clarify causal mechanisms and to evaluate the effectiveness of mitigation strategies.
Abbreviations
PM2.5, particulate matter <2.5 μm in aerodynamic diameter; PM10, particulate matter <10 μm in aerodynamic diameter; SO2, sulfur dioxide; NO2, nitrogen dioxide; CO, carbon oxide; O38h, daily 8-hour mean concentrations of ozone; AQI, Air Quality Index; HTN, hypertension; GAM, generalized additive model; DLNM, distributed lag non-linear models; RR, relative risk; CI, confidence interval; Q-AIC, Quasi-Akaike information criterion.
Data Sharing Statement
The datasets generated and/or analyzed during the current study are not publicly available but can be obtained from the corresponding author upon reasonable request.
Institutional Review Board Statement
The Youjiang Medical University for Nationalities Medical Ethics Committee approved the study protocol (Approval No. 2023120401). This study was conducted in accordance with the Declaration of Helsinki.
Informed Consent Statement
Since this study is a retrospective ecological study using aggregated data and does not involve personal privacy, the requirement for informed consent was waived with the approval of the Medical Ethics Committee of Youjiang Medical University for Nationalities.
Acknowledgments
The authors acknowledge the contribution and collaboration of all those who participated in this study.
Author Contributions
All authors made a significant contribution to the work reported, whether that is in the conception, study design, execution, acquisition of data, analysis and interpretation, or in all these areas; took part in drafting, revising or critically reviewing the article; gave final approval of the version to be published; have agreed on the journal to which the article has been submitted; and agree to be accountable for all aspects of the work.
Funding
This work was supported by the Innovation Project of Guangxi Graduate Education “Correlation of Air Quality and Meteorological Variables with Cardiovascular Disease Hospitalizations in Baise City (2020–2022)” [YCSW2024541].
Disclosure
The authors declare that they have no competing interests in this work.
References
1. Mills KT, Stefanescu A, He J. The global epidemiology of hypertension. Nat Rev Nephrol. 2020;16(4):223–15. doi:10.1038/s41581-019-0244-2
2. Schutte AE, Srinivasapura Venkateshmurthy N, Mohan S, et al. Hypertension in low-and middle-income countries. Circulation Research. 2021;128(7):808–826. doi:10.1161/CIRCRESAHA.120.318729
3. Chay J, Jafar TH, Su RJ, et al. Cost‐effectiveness of a multicomponent primary care intervention for hypertension. J Am Heart Assoc. 2024;13(8):e033631. doi:10.1161/JAHA.123.033631
4. Lu M, Li D, Hu Y, et al. Persistence of severe global inequalities in the burden of hypertension heart disease from 1990 to 2019: findings from the global burden of disease study 2019. Bmc Public Health. 2024;24(1):110. doi:10.1186/s12889-023-17573-9
5. Lewington S, Lacey B, Clarke R, et al. The burden of hypertension and associated risk for cardiovascular mortality in China. JAMA Intern Med. 2016;176(4):524–532. doi:10.1001/jamainternmed.2016.0190
6. Qin J, Yao Y, Wang Q. Analysis on the current situation of health development in Guangxi. Soft Sci Health. 2020;34(4):8–13. doi:10.3969/j.issn.1003-2800.2020.04.002
7. Zhang S, Qian ZM, Chen L, et al. Exposure to air pollution during pre-hypertension and subsequent hypertension, cardiovascular disease, and Death: a trajectory analysis of the UK Biobank cohort. Environ Health Perspect. 2023;131(1):17008. doi:10.1289/EHP10967
8. Choi Y, Kim S, Kang S, et al. Short-term effects of air pollution on blood pressure. Sci Rep-Uk. 2019;9(1):20298. doi:10.1038/s41598-019-56413-y
9. Khajavi A, Tamehri Zadeh SS, Azizi F, et al. Impact of short- and long-term exposure to air pollution on blood pressure: a two-decade population-based study in Tehran. Int J Hyg Envir Heal. 2021;234:113719. doi:10.1016/j.ijheh.2021.113719
10. Lin X, Du Z, Liu Y, et al. The short-term association of ambient fine particulate air pollution with hypertension clinic visits: a multi-community study in Guangzhou, China. Sci Total Environ. 2021;774:145707. doi:10.1016/j.scitotenv.2021.145707
11. Song J, Lu M, Lu J, et al. Acute effect of ambient air pollution on hospitalization in patients with hypertension: a time-series study in Shijiazhuang, China. Ecotox Environ Safe. 2019;170:286–292. doi:10.1016/j.ecoenv.2018.11.125
12. Aturinde A, Farnaghi M, Pilesjö P, et al. Spatial analysis of ambient air pollution and cardiovascular disease (CVD) hospitalization across Sweden. Geohealth. 2021;5(5):e2020GH000323. doi:10.1029/2020GH000323
13. Baise City Bureau of Statistics, National Bureau of Statistics Baise Investigation Team. 2022 Baise City national economic and social development statistical bulletin. Youjiang Daily. 2023 Apr 25; Sect 3.
14. Chen H, Cheng Z, Li M, et al. Ambient air pollution and hospitalizations for ischemic stroke: a time series analysis using a distributed lag nonlinear model in Chongqing, China. Front Public Health. 2022;9:762597. doi:10.3389/fpubh.2021.762597
15. Wu Z, Chen C, He Y, et al. Association between air pollution exposure and outpatient visits for dermatomyositis in a humid subtropical region of China: a time-series study. Environ Geochem Hlth. 2023;45(8):6095–6107. doi:10.1007/s10653-023-01616-6
16. Yu J, Zhu A, Liu M, et al. The correlation between daily temperature, diurnal temperature range, and asthma hospital admissions in Lanzhou city, 2013-2020. Bmc Public Health. 2024;24(1):2454. doi:10.1186/s12889-024-19737-7
17. Niu Y, Gao Y, Yang J, et al. Short-term effect of apparent temperature on daily emergency visits for mental and behavioral disorders in Beijing, China: a time-series study. Sci Total Environ. 2020;733:139040. doi:10.1016/j.scitotenv.2020.139040
18. Liu Y, Dong J, Zhai G. Association between air pollution and hospital admissions for hypertension in Lanzhou, China. Environ Sci Pollut R. 2022;29(8):11976–11989. doi:10.1007/s11356-021-16577-5
19. Gasparrini A. Modeling exposure-lag-response associations with distributed lag non-linear models. Stat Med. 2014;33(5):881–899. doi:10.1002/sim.5963
20. Gasparrini A, Scheipl F, Armstrong B, et al. A penalized framework for distributed lag non-linear models. Biometrics. 2017;73(3):938–948. doi:10.1111/biom.12645
21. Bell ML, Samet JM, Dominici F. Time-series studies of particulate matter. Annu Rev Publ Health. 2004;25(1):247–280. doi:10.1146/annurev.publhealth.25.102802.124329
22. Ho FK, Cole TJ. Non-linear predictor outcome associations. BMJ Medicine. 2023;2(1):e396. doi:10.1136/bmjmed-2022-000396
23. Li Y, Du J, Lin S, et al. Air pollution increased risk of reproductive system diseases: a 5-year outcome analysis of different pollutants in different seasons, ages, and genders. Environ Sci Pollut R. 2022;29(5):7312–7321. doi:10.1007/s11356-021-16238-7
24. Zhou Y, Ji A, Tang E, et al. The role of extreme high humidex in depression in chongqing, China: a time series-analysis. Environ Res. 2023;222:115400. doi:10.1016/j.envres.2023.115400
25. Dziak JJ, Coffman DL, Lanza ST, et al. Sensitivity and specificity of information criteria. Brief Bioinform. 2020;21(2):553–565. doi:10.1093/bib/bbz016
26. Dastoorpoor M, Sekhavatpour Z, Masoumi K, et al. Air pollution and hospital admissions for cardiovascular diseases in Ahvaz, Iran. Sci Total Environ. 2019;652:1318–1330. doi:10.1016/j.scitotenv.2018.10.285
27. Yu J, Zhu A, Liu M, et al. Association between air pollution and cardiovascular disease hospitalizations in Lanzhou City, 2013–2020: a time series analysis. GeoHealth. 2024;8(1):e2022GH000780. doi:10.1029/2022GH000780
28. Zhu A, Liu M, Yu J, et al. Association between air pollution and hypertension hospitalizations: a time series analysis in Lanzhou. BMC Public Health. 2024;24(1):3260. doi:10.1186/s12889-024-20740-1
29. Liu J, Yu W, Pan R, et al. Association between sequential extreme precipitation-heatwaves events and hospitalizations for schizophrenia: the damage amplification effects of sequential extremes. Environ Res. 2022;214:114143. doi:10.1016/j.envres.2022.114143
30. Jiang Y, Chen J, Wu C, et al. Temporal cross-correlations between air pollutants and outpatient visits for respiratory and circulatory system diseases in Fuzhou, China. Bmc Public Health. 2020;20(1):1131. doi:10.1186/s12889-020-08915-y
31. Nouri F, Taheri M, Ziaddini M, et al. Effects of sulfur dioxide and particulate matter pollution on hospital admissions for hypertensive cardiovascular disease: a time series analysis. Front Physiol. 2023;14:1124967. doi:10.3389/fphys.2023.1124967
32. Hu X, Knibbs LD, Zhou Y, et al. The role of lifestyle in the association between long-term ambient air pollution exposure and cardiovascular disease: a national cohort study in China. Bmc Med. 2024;22(1):93. doi:10.1186/s12916-024-03316-z
33. Adeke AS, Chori BS, Neupane D, et al. Socio-demographic and lifestyle factors associated with hypertension in Nigeria: results from a country-wide survey. J Hum Hypertens. 2024;38(4):365–370. doi:10.1038/s41371-022-00673-1
34. Ho FK, Gray SR, Welsh P, et al. Ethnic differences in cardiovascular risk: examining differential exposure and susceptibility to risk factors. Bmc Med. 2022;20(1):149. doi:10.1186/s12916-022-02337-w
35. Barbosa JF, Rocha BA, Souza MCO, et al. Polycyclic aromatic hydrocarbons (PAHs): updated aspects of their determination, kinetics in the human body, and toxicity. J Toxicol Environ Health B Crit Rev. 2023;26(1):28–65. doi:10.1080/10937404.2022.2164390
36. Schlesinger RB, Snyder CA, Chen LC, et al. Clearance and translocation of aluminum oxide (alumina) from the lungs. Inhal Toxicol. 2000;12(10):927–939. doi:10.1080/08958370050137996
37. Chi GC, Hajat A, Bird CE, et al. Individual and neighborhood socioeconomic status and the association between air pollution and cardiovascular disease. Environ Health Perspect. 2016;124(12):1840. doi:10.1289/EHP199
38. Wang W, Ming X, Chen L, et al. Impact of short-term exposure to ambient air pollution on cardiovascular disease outpatient visits: a time-series study in Yichang, China. Environ Health. 2025;24(1):63. doi:10.1186/s12940-025-01219-x
39. Xiao X, Qin Z, Lv X, et al. Dietary patterns and cardiometabolic risks in diverse less-developed ethnic minority regions: results from the China Multi-Ethnic Cohort (CMEC) Study. The Lancet Regional Health-Western Pacific. 2021;15:100252. doi:10.1016/j.lanwpc.2021.100252
40. Wan S, Pan D, Su M, et al. Association between socio-demographic factors, lifestyle, eating habits and hypertension risk among middle-aged and older rural Chinese adults. Nutr Metab Cardiovasc Dis. 2024;34(3):726–737. doi:10.1016/j.numecd.2023.11.012
41. Miller MR. Oxidative stress and the cardiovascular effects of air pollution. Free Radic Biol Med. 2020;151:69–87. doi:10.1016/j.freeradbiomed.2020.01.004
42. Zhang Y, Zhang L, Wei J, et al. Size-specific particulate air pollution and hospitalization for cardiovascular diseases: a case-crossover study in Shenzhen, China. Atmos Environ. 2021;251:118271. doi:10.1016/j.atmosenv.2021.118271
43. Arija V, Villalobos F, Pedret R, et al. Physical activity, cardiovascular health, quality of life and blood pressure control in hypertensive subjects: randomized clinical trial. Health Qual Life Outcomes. 2018;16(1):184. doi:10.1186/s12955-018-1008-6
44. Brook RD, Rajagopalan S. Particulate matter, air pollution, and blood pressure. J Am Soc Hypertens. 2009;3(5):332–350. doi:10.1016/j.jash.2009.08.005
45. Ho CC, Tsai MH, Chen YC, et al. Persistent elevation of blood pressure by ambient coarse particulate matter after recovery from pulmonary inflammation in mice. Environ Toxicol. 2019;34(7):814–824. doi:10.1002/tox.22749
46. Vidale S, Campana C. Ambient air pollution and cardiovascular diseases: from bench to bedside. Eur J Prev Cardiol. 2018;25(8):818–825. doi:10.1177/2047487318766638
47. Zhang X, Chen B, Fan X. Different fuel types and heating approaches impact on the indoor air quality of rural houses in Northern China. Procedia Eng. 2015;121:493–500. doi:10.1016/j.proeng.2015.08.1097
48. Li H, Cai J, Chen R, et al. Particulate matter exposure and stress hormone levels: a randomized, double-blind, crossover trial of air purification. Circulation. 2017;136(7):618–627. doi:10.1161/CIRCULATIONAHA.116.026796
49. Chen R, Meng X, Zhao A, et al. DNA hypomethylation and its mediation in the effects of fine particulate air pollution on cardiovascular biomarkers: a randomized crossover trial. Environ Int. 2016;94:614–619. doi:10.1016/j.envint.2016.06.026
50. Mangia C, Gianicolo EA, Bruni A, et al. Spatial variability of air pollutants in the city of Taranto, Italy and its potential impact on exposure assessment. Environ Monit Assess. 2013;185(2):1719–1735. doi:10.1007/s10661-012-2663-4
 © 2026 The Author(s). This work is published and licensed by Dove Medical Press Limited. The
full terms of this license are available at https://www.dovepress.com/terms
and incorporate the Creative Commons Attribution
- Non Commercial (unported, 4.0) License.
By accessing the work you hereby accept the Terms. Non-commercial uses of the work are permitted
without any further permission from Dove Medical Press Limited, provided the work is properly
attributed. For permission for commercial use of this work, please see paragraphs 4.2 and 5 of our Terms.
© 2026 The Author(s). This work is published and licensed by Dove Medical Press Limited. The
full terms of this license are available at https://www.dovepress.com/terms
and incorporate the Creative Commons Attribution
- Non Commercial (unported, 4.0) License.
By accessing the work you hereby accept the Terms. Non-commercial uses of the work are permitted
without any further permission from Dove Medical Press Limited, provided the work is properly
attributed. For permission for commercial use of this work, please see paragraphs 4.2 and 5 of our Terms.