Back to Journals » Nature and Science of Sleep » Volume 13
Short Sleep Duration and Its Association with Obesity and Other Metabolic Risk Factors in Kuwaiti Urban Adults
Authors Al-Rashed F ![]() , Sindhu S
, Sindhu S ![]() , Al Madhoun A
, Al Madhoun A ![]() , Alghaith A, Azim R, Al-Mulla F
, Alghaith A, Azim R, Al-Mulla F ![]() , Ahmad R
, Ahmad R ![]()
Received 19 March 2021
Accepted for publication 12 July 2021
Published 24 July 2021 Volume 2021:13 Pages 1225—1241
DOI https://doi.org/10.2147/NSS.S311415
Checked for plagiarism Yes
Review by Single anonymous peer review
Peer reviewer comments 2
Editor who approved publication: Prof. Dr. Ahmed BaHammam
Fatema Al-Rashed,1 Sardar Sindhu,2 Ashraf Al Madhoun,2,3 Abdulwahab Alghaith,4 Rafaat Azim,1 Fahd Al-Mulla,3 Rasheed Ahmad1
1Immunology & Microbiology Department, Dasman Diabetes Institute, Dasman, Kuwait; 2Animal and Imaging Core Facility, Dasman Diabetes Institute, Dasman, Kuwait; 3Genetics and Bioinformatics Department, Dasman Diabetes Institute, Dasman, Kuwait; 4Royal College of Surgeons in Ireland, Dublin, Ireland
Correspondence: Fatema Al-Rashed; Rasheed Ahmad
Microbiology & Immunology Department, Dasman Diabetes Institute, Al-Soor Street, Kuwait, P.O. Box 1180, Dasman, 15462, Kuwait
Tel +965 2224 2999 Ext. 4335; 4311
Fax +965 2249 2406
Email [email protected]; [email protected]
Background: Efficient sleep duration and its quality are increasingly recognized as important contributors for maintaining normal body weight. However, lifestyle and social structure within the Arab-gulf region differ compared to those in the western world. This study was specifically conducted in Kuwait’s population to investigate the link between sleep quality (SQ) and obesity in the absence of sleep apnea (SA) onset.
Methods: SQ was measured by the Pittsburgh Sleep Quality Index (PQSI) in 984 participants, then verified in 60 individuals including 20 lean (Body mass index/BMI: 18.5– 24.9 kg/m2), 20 overweight (BMI: 25– 29.9 kg/m2) and 20 obese (BMI: ≥ 30 kg/m2) through actigraph worn over the right-hip for 7 consecutive days to characterize their sleep–wake cycle, rest-activity, and physical activity. Blood samples were collected for metabolic markers.
Results: 59.6% of participants reported a PSQI score higher than 5, with 57.6% of the participants reporting less than 6 hours of sleep per day. The data show that both SQ and sleep duration are considered inadequate in comparison to the international SQ standards. We found a significant association between SQ and obesity independent of age and sex. Actigraph data further supported the independent association of sleep duration on BMI within the population (p < 0.001). Additionally, total sleep time (TST) was found to significantly correlate with several other metabolic factors including diastolic blood pressure, elevated resting heart rate (RHR), triglycerides, total cholesterol, homeostatic model assessment for insulin resistance (HOMA-IR), C-peptide, and C-Reactive Protein (CRP) secretion. Further multiple-regression analysis showed a significant independent association between blood pressure (p < 0.03), HOMA-IR (p < 0.04), and C-peptide (p < 0.3) and sleep duration.
Conclusion: These findings suggest that sleep deprivation and disturbance could be indirect factors involved in the development of not only obesity in Kuwait but also other metabolic syndromes such as type 2 diabetes.
Keywords: sleep, Kuwait, obesity, PSQI
Introduction
Obesity prevalence has exponentially increased over the past five decades, and become a worldwide problem reaching pandemic proportions.1 According to the World Health Organization (WHO), there are approximately 1.9 billion overweight adults worldwide with a body mass index (BMI) of 25–29 kg/m2, of which, 650 million individuals are considered subjects with obesity with a BMI of 30 kg/m2 or higher.2 Obesity has been linked with many metabolic syndromes including hypertension, cardiovascular disease (CVD) and type 2 diabetes (T2D). Apart from affecting adult populations, obesity has also been identified as one of the causes of premature deaths.3–5 The prevalence of obesity in a population might be an outcome of genetic and environmental factors.6 In regard with environmental factors, lifestyle changes, especially the global trends of extensive consumption of processed foods have been the major driver of obesity pandemic. In Kuwait, the estimated prevalence of obesity and metabolic syndromes such as diabetes is reported to be 47.5% and 36.2%, respectively.7 One of the driven factors for such high prevalence in obesity in Kuwait is donated to the fast-socioeconomic growth that boomed in the country in the past few decades. Similar to the changes observed in other countries in the region, those rapid changes influenced eating habits by favoring the consumption of western style fast food8,9 as well as inducing bad sleep behavior in young population.10,11
Sleep is considered to play a major role in health maintenance. Sleep restriction or disorders my result in impaired metabolism and endocrine dysfunction.12 Increasing evidence over the past decades has pointed to the link between poor sleep quality (SQ) and increased BMI.13,14 Interestingly, the accumulating evidence supports obesity as a cause of sleep disturbance as well as the sleep disturbance as a cause of obesity. This relationship looks to be bidirectional with the evidence indicating that obesity can trigger onset of sleep apnea (SA); a sleep disorder in which breathing is repeatedly interrupted during sleep known to increase metabolic impairments.15–17 SA may lead to chronic sleep deprivation from constant nightly sleep interruptions and repeated episodes of shallow sleep.17 Both sleep quality and sleep duration might get impaired in individuals with obesity without SA.18 Other obesity-related pathological conditions that can affect sleep quality and duration include the irritable bowel syndrome, functional dyspepsia, asthma, nycturia, and osteoarticular pain.19 However, factors other than SA that may lead to chronic sleep deprivation have become common in the youth from modern societies. Chronic sleep deprivation is an alarming condition in individuals that has been associated with wide-range deleterious effects on health and wellbeing, including depression, anxiety, obesity, type-2 diabetes, and cardiovascular diseases.20–22 Notably, chronic sleep deprivation and inadequate SQ have been linked with obesity, insulin resistance and metabolic syndrome.23,24 Sleep deprivation is a risk factor for increased food intake, poor energy expenditure, weight gain and obesity.25,26 The visceral adipose tissue is the main source of secretion of proinflammatory cytokines including TNF-α, IL-1β, and IL-6 that lead to chronic low-grade inflammation.27 TNF-α, IL-1β, and IL-6 are reported to be involved in physiological regulation of sleep and expression following a circadian rhythm in both animals and humans.28 Importantly, adequate sleep is mandatory for homeostatic regulation of proinflammatory responses and prevent risks of obesity, diabetes, neuroendocrine, and cardiovascular diseases.4,29,30 Overall, the available literature points to a vicious cycle hinged on the interactions between obesity, proinflammatory cytokine and sleep abnormalities.
Regarding sleep disturbance as cause of obesity, the increased obesity prevalence in individuals with sleep restriction can be explained by a positive modulatory effect on caloric intake.31 Modern lifestyle plays a contributory role to modify the physiological chronobiology. The social jet-lag associated with a blunted sleep duration appears to be linked with enhanced risk of developing obesity or metabolic syndrome via excessive intake of high calorie foods rich in fat and carbohydrate.32 Obviously, as the food intake exceeds the energy expenditure, weight gain is the logical outcome. In addition to the dietary component, hormonal factors may also impact the sleep quality and level of obesity. The various hormones that can regulate the energy balance at brain level include insulin, leptin, ghrelin, melatonin, and cortisol.32,33 Importantly, the emerging paradigm supports that SA, obesity and impaired glucose homeostasis/insulin resistance are tightly intertwined. It is speculated that the mechanisms involved in the complex interplay include both directly weight-dependent such as excessive fat accumulation affecting respiratory efficiency, and indirectly weight-dependent such as hyperglycemia, secondary hyperinsulinemia, insulin resistance, leptin resistance, and other hormonal dysregulations often observed in individuals with obesity, T2D, and/or sleep disorders.17
Sleep is an important biological function as well as a biomarker for general health and pathological conditions. The structure, duration, and quality of sleep are altered by age and gender. Sleep duration measured using polysomnography was found to be shorter in the elderly as compared to young and middle-aged adults, however, this trend was not observed when individuals aged 60 were compared with those over 70 years of age, suggesting that the decline in sleep duration with advancing age was non-linear.34,35 Similarly, gender is another critical factor involved in modulation of sleep. In this respect, poor subjective sleep quality was reported in elderly women, compared to elderly men.36 Plausibly, different psychosocial factors can contribute to gender differences with regard to perception and evaluation of self-rating sleep quality. Other factors may include gender differences concerning brain maturation, NREM-REM distribution, or EEG features.37,38 Luca et al reported that older individuals, especially women, complained less about sleepiness and pathological sleepiness was significantly lower in this group compared to younger counterparts, whereas the sleep latency increased with age, in women only.11
Sleep disturbance does not only affect individuals with severe obesity but it also affects the individuals with moderate obesity, implying that there might be other mechanisms involved beyond excessive fat accumulation causing narrowing of the upper respiratory passages. In this regard, dietary intake has been reported to play a role in the sleep regulation as increased consumption of carbohydrate led to disordered sleep quality.39 Notably, high fiber intake and less saturated fat and sugar intake were associated with deeper and more restorative sleep, suggesting that diets could be useful in the management of sleep disorders.40 Interestingly, a cross-sectional study including 172 middle-aged adults reported that good sleepers had lower BMI and waist circumference and higher adherence to the Mediterranean diet than poor sleepers. In these individuals, PSQI associated positively with BMI/waist circumference but negatively with adherence to the Mediterranean diet.41 Similarly, Castellucci et al reviewed the studies that reported the association between obesity and sleep disturbances and vice versa, highlighting the nutritional strategies as a tool to improve SQ in patients with obesity and sleep disorder.42
Shorter sleep duration and poor SQ have been reported to correlate with obesity;43 however, there have been no studies specifically investigating the complex relationship between poor SQ, ie, sleep duration and sleep disturbance and the BMI of the general adult population in Kuwait in the absence of SA onset. Therefore, we herein investigated the relationship between risk factors such as diet, physical activity, sleep efficiency and obesity in Kuwaiti adults, ie, targeting the critical factors that are involved in the obesity epidemic in Kuwait.
Methods
Survey Study Design, Participants, Inclusion/Exclusion Criteria and Anthropometric Measurements
In the cross-sectional survey part of the study, a total of 1500 adult (>18 years) Kuwaiti adults were invited through social media or personal contact to be included in the survey study. Each participant was given a structured questionnaire to obtain information regarding sleep habits, sleep problems, use of medications, type of job (work status, working hours, job title, desk/non-desk job, etc), and demographic/anthropometric information (age, height, and weight). No personal identification information, such as name and date of birth, was collected from the participants. Regarding inclusion/exclusion criteria, all individuals were required to give informed consent for inclusion in the survey as well as provide their age, weight, and height. Those who failed to either sign informed consent or provide age, weight, and height information were excluded from the study. Those who self-reported liver, cardiopulmonary, or kidney condition were excluded from the study. To also exclude the possible sleep apnea cases, those who either self-identified suffering from this condition or those who indicated in PSQI survey that they could not breath comfortably, coughed or snored loudly once or twice a week were excluded from the study and, therefore, 984 individuals were finally included in the survey. A flowchart highlights the procedure of participants’ recruitment (Supplementary Figure S1). BMI was calculated from the self-reported weight and height information using the following formula: BMI = Weight (kg)/Height (m2). Participants were classified as lean (BMI = 18.5–24.9 kg/m2, N = 426), overweight (BMI = 25–29.9 kg/m2, N = 345), and those with obesity (BMI≥30 kg/m2, N = 213). With regard to obesity risk, 163 individuals were found to have class I/ low-risk obesity (BMI = 30–34.9 kg/m2), 39 with class II/ moderate-risk obesity (BMI = 35–39.9 kg/m2) and 11 with class III/ high-risk obesity (BMI≥40 kg/m2). Obesity classes were defined as follows: Class I: BMI = 30–34.9 kg/m2, Class II = 35–39.9 kg/m2, and Class III ≥ 40 kg/m2.
Questionnaire Parameters
Sleep quality was assessed using the global Pittsburgh Sleep Quality Index (PSQI) score, developed by researchers at the University of Pittsburgh, Pennsylvania.44 The PSQI is a validated self-reported questionnaire designed to provide a reliable and standardized measure of SQ, distinguishing the “good” from “poor” sleepers with the help of simple questions that are easy to complete in 5–10 min. The questionnaire consists of 18 items that under 7 main components: (i) subjective sleep quality, (ii) sleep latency, ie, the time it takes to fall asleep, (iii) sleep duration, (iv) habitual sleep efficiency, ie, the ratio of total sleep time to time in bed, (v) sleep disturbances, (vi) use of sleep-promoting medications, whether prescribed or the ones available over-the-counter, and (vii) daytime dysfunction, based on the past month. Each component of the questionnaire is scored from 0 to 3 (representing good to bad), yielding a global PSQI score ranging from 0 to 21, with higher scores indicating worse SQ.44 A global PSQI score greater than 5 has been found to have a sensitivity of 89.6% and specificity of 86.5% in differentiating good sleepers from poor sleepers.44,45 The PSQI survey was offered in both Arabic and English, in the form of a hard copy and an online electronic version. The Arabic version of the PSQI questionnaire used was validated by a bilingual individual for alignment with the version used earlier by Suleiman and Yates.46
Actigraph Study Design, Participants, Inclusion/Exclusion Criteria, and Anthropometric Measurements
For Actigraph (objective) study, we detriment the sample size using ClinCalc tool software (www.clincalc.com), based on the results of the survey study. The average PSQI score of 6.8±3.2 was used to guide the anticipated mean of 5, a statistical power (1-β) of 95% and a level of significance (α) of 5% were considered, which resulted in a minimally required sample size of 41 individuals for Actigraph study. Keeping a fair margin for possible dropouts, a total of 100 adult (>18 years) Kuwaiti individuals were reached randomly through word of mouth, flyers, or social media and were invited for participation in the study. Out of these, 92 persons agreed to participate in the study and were asked to sign the informed consent as well as fill out a comprehensive health screen questionnaire in order to be able to include individuals with normal liver, cardiopulmonary and kidney function as assessed through self-reporting. The exclusion criteria were physician-diagnosed diabetes, hypertension (>160/90 mmHg), anti-hypertensive therapy, a previous history of established coronary heart disease eg myocardial infarction, coronary artery bypass graft surgery, coronary angioplasty, a family history of early cardiac death (<40 years), diagnosed depression, and use of medications that could influence sleep quality or body weight due to effects on lipid or carbohydrate metabolism. Only 78 individuals met with the inclusion/exclusion criteria, out of which, 60 individuals completed the study since 18 individuals either decided to discontinue during the study or did not wear actigraph accelerometer for the minimum number of 4 nights required to establish the reliable sleep-wake patterns as reported in the literature.47 A flowchart summarizes the recruitment process of Actigraph study participants (Supplementary Figure S2). This study cohort comprised of lean (BMI=18.5–24.9 kg/m2), overweight (BMI=25–29.9 kg/m2), and those with obesity (BMI≥30 kg/m2), 20 each. With regard to obesity risk, 13 individuals were found to have class I/ low-risk obesity (BMI=30–34.9 kg/m2), 4 with class II/ moderate-risk obesity (BMI=35–39.9 kg/m2) and 3 with class III/ high-risk obesity (BMI≥40 kg/m2). Obesity classes were defined as follows: Class I: BMI = 30–34.9 kg/m2, Class II = 35–39.9 kg/m2, and Class III ≥ 40 kg/m2. For an objective sleep analysis, all participants were provided with Actigraph GT3X+ activity monitors, to be worn for seven consecutive days except while bathing. Participants wore the GT3x+ activity monitors over their hips. All participants were given a health questionnaire and also provided a prior training of how to record their sleep, activity, and food diaries during the study. In the physical activity laboratory, a standard protocol for all anthropometric assessments was carried out for all subjects wearing tight fitting swimsuits and by using the same equipment throughout the study. Measurements were made to the nearest 0.1 unit. Height (cm) was taken by instructing the volunteer to stand feet together, back and heels against the upright bar of the height scale. Head was also positioned upright against the backboard. The volunteer was requested to take a deep breath as the investigator applied a gentle, upward pressure under the angle of the mandible. Other investigator slid down the horizontal bar attached to the scale snugly close on the examinee’s head and measurements were taken. Body weight (kg) was measured using a beam balance and BMI was calculated as follows: BMI = weight (kg)/height (m2). Waist and hip circumferences (cm) were measured in duplicate using non-elastic tape. Waist circumference was measured at the minimum circumference horizontally between the iliac crest and the rib cage while the hip circumference was measured at the maximum protuberance of the buttocks, and the waist to hip ratio was calculated. The same investigator performed these measurements for all volunteers at every occasion. Whole body composition including percent body fat, soft lean mass, and total body water were measured using an IOI 353 Body Composition Analyzer (Jawon Medical, South Korea). Anthropometric and clinical characteristics of the study participants are summarized in Table 1.
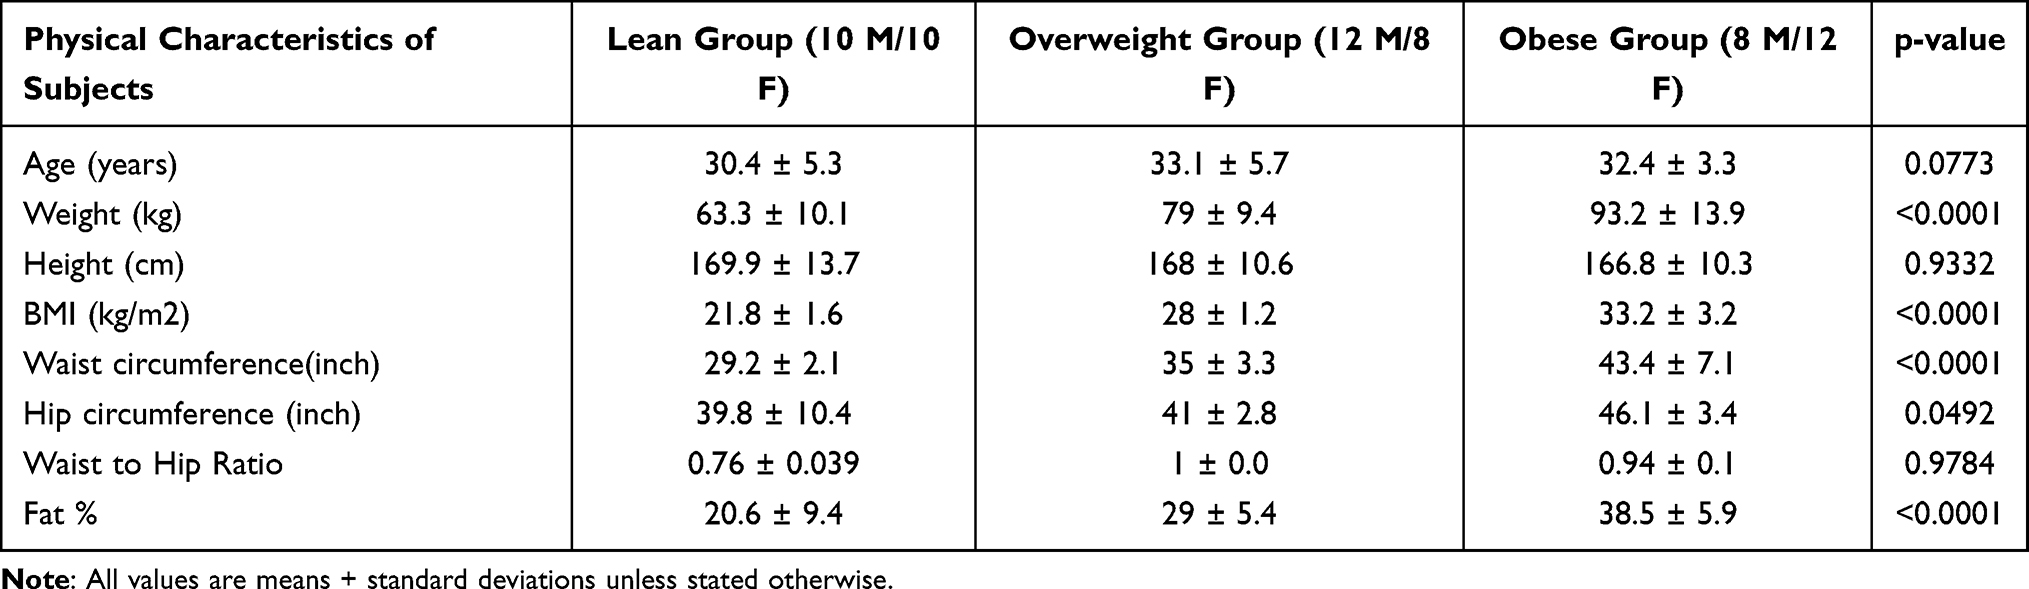 |
Table 1 Demographic Characteristics of Actigraph Study Population |
Ethical Approval
All participants were informed about the purpose of the study prior to their participation. A written informed consent was obtained from all study participants in accord with the ethical guidelines of the Declaration of Helsinki and study approval by the Kuwait Ministry of Health Ethical Board (Approval ID#: 2017/542) and Ethical Review Committee (ERC) of Dasman Diabetes Institute, Kuwait (Approval ID#: RA HM-2019-019).
Sleep Apnea (SA) Assessment
Each participant underwent a health screen to identify the medical history, including the presence of SA. Participants that self-identified having SA were excluded from the study. Participants were then given a second sleep questionnaire that contained the following questions: 1. How many times did you find it difficult to breathe comfortably (during the past month), 2. How many times did you cough or snore loudly (during the past month). If the participant answered with yes and identified either of these questions to accrue (more than three times a week), SA was considered to be involved and such individuals were excluded from the study.
Physical Activity (PA) Measurements
Actigraph activity monitor GT3X+ was used to measure both activity levels and sleep outcome. ACTi graphical activity was recorded using electronic tri-axial monitor (wGT3X-BT ActiGraph LLC, Pensacola, FL, USA). Subjects were advised to maintain their normal daily (habitual) PA levels during the study period. Accelerometers attached to elasticized belts were worn on the right-side of hips for seven consecutive days, except when bathing or other water activity. As reported previously, the actigraphy method enabled for a reliable and objective assessment of the daily PA.48,49 The accelerometer provided PA measurements including activity counts, vector magnitude, energy expenditure, step counts, activity intensity levels, and metabolic equivalents (METs). A one-min epoch was used, with activity counts assessed at 1-min intervals to ensure that the data from each participant included at least four days during which the accelerometer was worn for at least 60% period of the day. A non-wear time was considered as any block of time ≥60 min was found with the activity count equal to zero.
Freedson’s cut-offs50 were used to differentiate between the three PA intensity levels as light-intensity (100–1951 counts/min), moderate-intensity (1952–5724 counts/min), and vigorous-intensity (≥5725 counts/min) activities. All counts ≤99 counts/min were considered as a sedentary status. The data were expressed as mean intensity of each activity during the monitoring time, ie, total accelerometer counts per total monitoring time.
Assessment of Sleep Parameters
The use of actigraph GT3X+ was previously validated for sleep analysis relative to both polysomnography and Actiwatch.47,51 Sleep quality and duration were assessed objectively through the use of electronic tri-axial monitor (wGT3X-BT ActiGraph LLC, Pensacola, FL, USA) for seven consecutive days. Sleep quality parameters were calculated using one-min epoch, in zero-crossing mode. Based on prior research suggesting the minimum number of nights required to establish reliable sleep-wake patterns via actigraphy, participants with <4 nights of data were excluded from the analyses. Data were separated into sleep and wake periods using data of bedtimes and waketimes from daily sleep diaries and were further verified by visual inspection of the actigraphy tracings. The scoring was based on the Cole-Kripke algorithm to determine sleep and wake periods, and to derive the primary sleep outcomes, ie, sleep efficiency, wake after sleep onset (WASO, ie, periods of wakefulness occurring after defined sleep onset), and total sleep duration. Sleep outcomes were averaged across all nights during each assessment period to provide an assessment of the habitual sleep patterns across all available nights’ data. Sleep efficiency represents the total duration of objectively measured sleep divided by the total time in bed, as reported in sleep diaries and visual inspection of actigraphy records, with higher values indicating better sleep continuity. Sleep efficiency was analyzed as a continuous measure. WASO was defined as the total number of min scored as wake (based on movement) after sleep onset, based on the Cole-Kripke algorithm. WASO was analyzed as a continuous variable with higher values indicating longer WASO. Sleep duration is the total amount of time spent sleeping during the participant’s time in bed, assessed by actigraphy.
Measurement of Blood Metabolic Markers
Participants were asked for the lab visit after an overnight fasting for at least 10 hours. Three consecutive blood pressure measurements, along with heart rate, were taken for each individual. Blood samples were collected in 10 mL EDTA tubes (BD Vacutainer system, Plymouth, UK). Plasma was separated, aliquoted and stored at −80°C for further analysis. Blood glucose, cholesterol, high-density lipoprotein (HDL) cholesterol, and triglycerides were analyzed using cobas b 101 system (Roche Diagnostics). Quality control sera were used to monitor the accuracy and precision of the assays performed. Homeostatic model assessment of insulin resistance (HOMA-IR) index was used as a measure of insulin resistance and calculated from the basal (fasting) glucose and insulin concentrations using the following formula: HOMA-IR = fasting insulin (μU/L) × fasting glucose (nmol/L)/22.5
Dietary Monitoring and Analysis
All participants were given food diaries and were instructed to weigh and record their dietary intake of food and drinks on electronic scales (Salter Housewares, Kent, United Kingdom). A visual demonstration of how to use scales and diaries was given to each individual prior to the start of the study. All individuals were advised to maintain their normal dietary intake. Diaries were completed prior to the second visit. Food diaries’ data were analyzed using CompEat pro (Nutrition systems, Banbury, United Kingdom) and an average of the daily nutrient intake was calculated.
Enzyme-Linked Immunosorbent Assay (ELISA)
Commercially available ELISA kits were used for detection of plasma levels of fasting insulin, C-peptide (Mercodia, Uppsala, Sweden), C-reactive protein (CRP), and tumor necrosis factor-alpha (TNF-α) (R&D Systems, Minneapolis, USA), following instructions from the manufacturers.
Statistical Analysis
Data were analyzed using SPSS version 25 (SPSS, Inc., Chicago, IL) and Graph Pad Prism 7.01 (version 6.05; San Diego, CA, USA) and expressed as the mean ± standard deviation (SD). Group means were compared using either a two-tailed t-test when comparing between two groups or one-way ANOVA if more than two groups were analyzed. Linear relationships between two variables were assessed by determining Pearson’s correlation coefficient “r” values. A chi-squared test and Pearson’s correlation were used to see the direction and strength of the association between sleep quality and metabolic risk factors. The equality of distributions or data normality testing was done by Shapiro–Wilk test which has the best power for a given significance. All P-values ≤0.05 were considered statistically significant.
Results
Self-Reported Population Characteristics
The self-reported characteristics of study population are summarized in Table 2. There was a higher predominance of female to male subjects, ie, 66% to 33.9%, respectively. A majority of the participants (41.7%) belonged to the age group ranging from 21 to 30 years. The lean accounted for the majority 43.3%, followed by overweight (35%) and those with obesity (21.4%). The majority of the participants held a job (62.5%), followed by students (27.5%), retirees (5.1%) and unemployed (3.9%). Regarding the active or sedentary nature of jobs, 51.5% of the employed participants had desk jobs. The mean PSQI global score was 6.8 ± 3.2, with 59.6% participants having bad sleep (global PSQI score >5). Also, a majority of the participants (57.6%) reported fewer than 6 hours of sleep, which is less than the hours recommended by the National Sleep Foundation Report.52
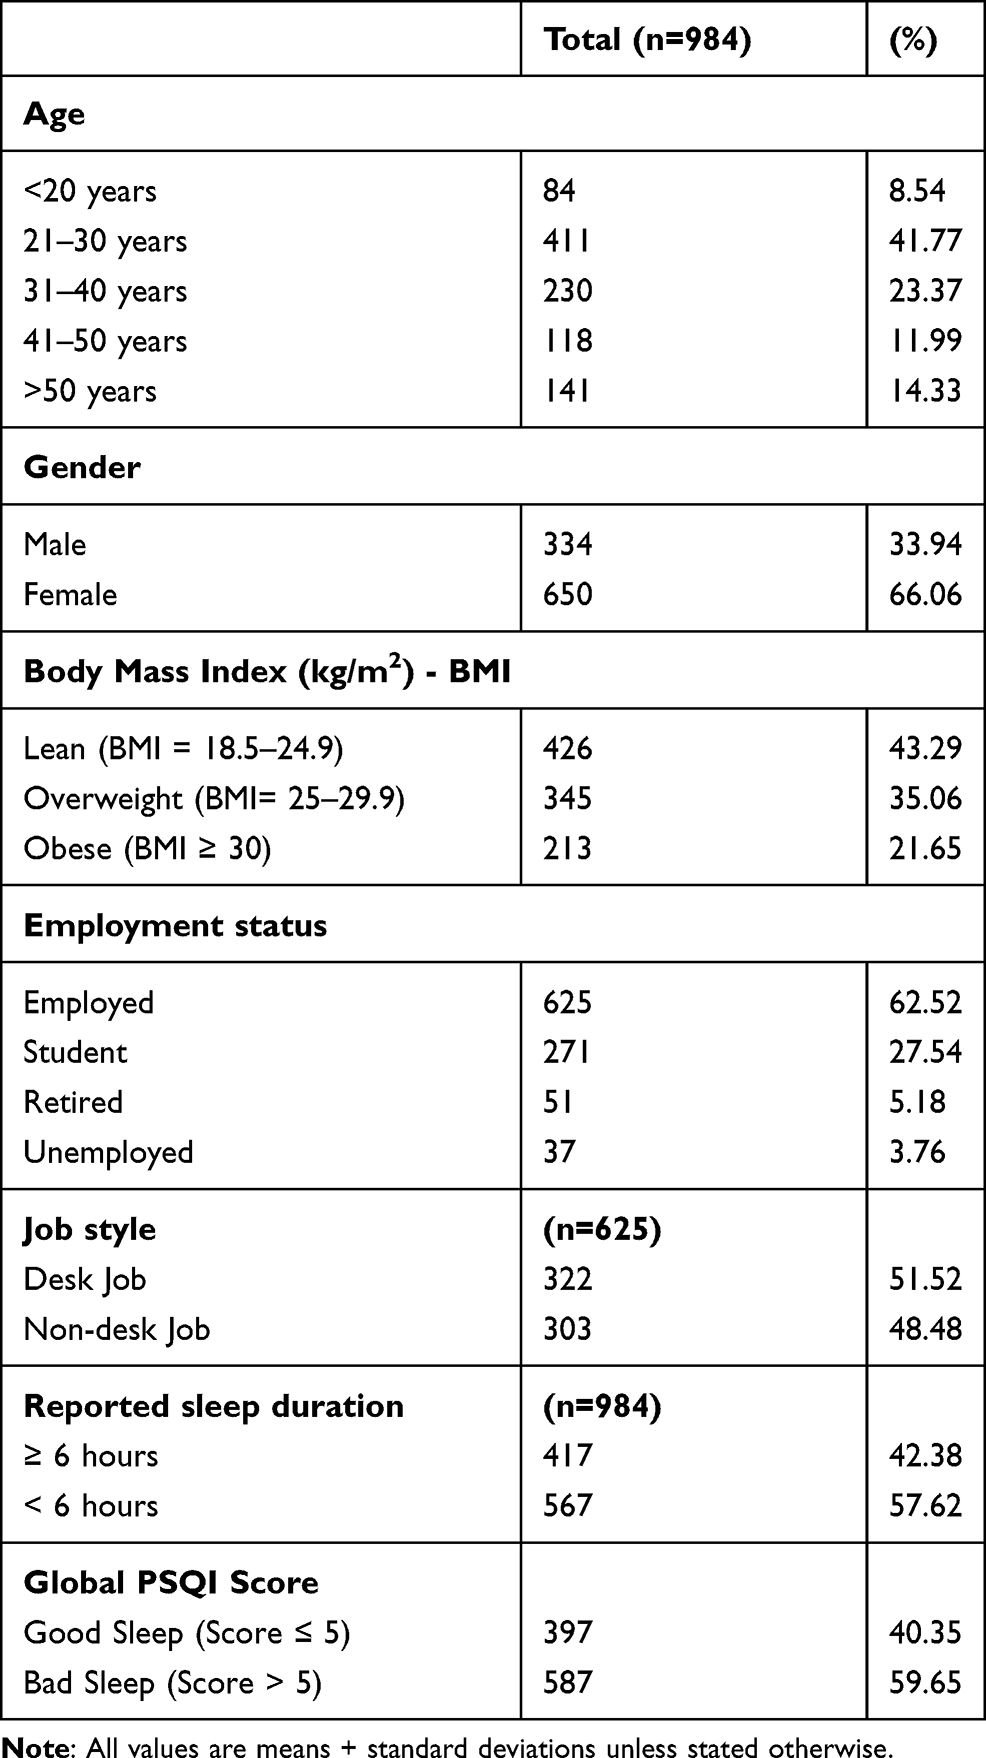 |
Table 2 Self-Reported Population Characteristics |
Effect of Personal Risk Factors on SQ
Since the personal characteristics can influence sleep habits, we investigated the effect of various risk factors like age, sex, BMI, job status, and job type (desk/non-desk job) on the global PSQI score (Figure 1). The reported data show that the global PSQI score was strongly influenced by BMI in both the overweight and subjects with obesity (p ≤ 0.0001) (Figure 1A). The global PSQI score was also influenced by age, however, only in 31–40 years and >50 years age groups (P < 0.01) (Figure 1B). However, no significant group differences were found with regard to gender (Figure 1C) and job type (Figure 1D). We further investigated the associations of global PSQI score with the BMI and age and found that only BMI had a significant positive association with PSQI score (r = 0.311, p ≤ 0.0001) (Figure 1E), whereas no association was found between age and PSQI (r = −0.022, P = 0.488) (Figure 1F).
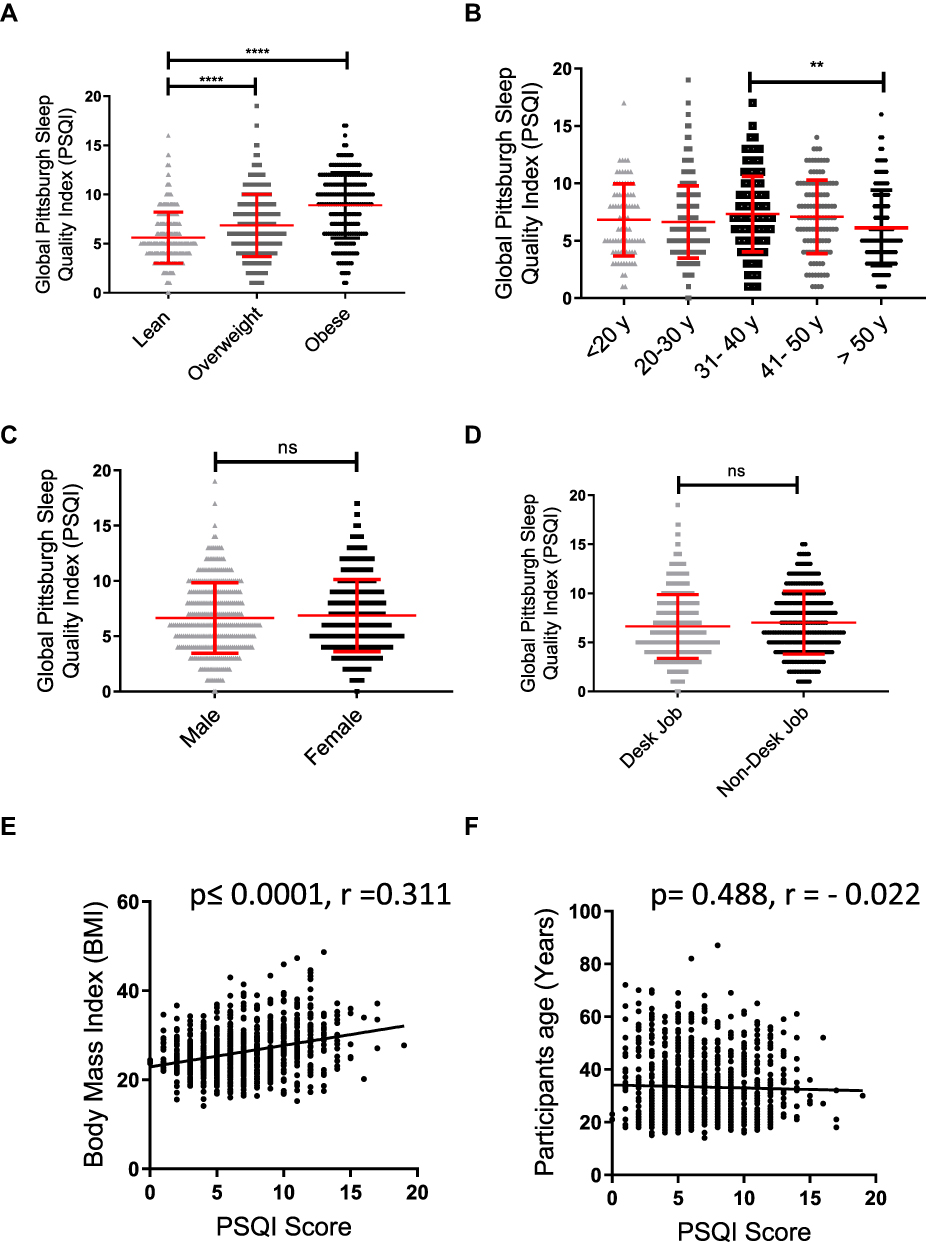 |
Figure 1 Effect of personal risk factors on sleep quality. A total of 984 individuals completed the self-reported questionnaires to help investigate the influence of personal risk factors on sleep quality, as assessed by the PSQI score across: (A) BMI groups defined as: lean (BMI < 25), overweight (BMI = 25–29.9) and obese (BMI ≥ 30); (B) Age groups; (C) Sex/gender; and (D) Job type (desk job/ non-desk job). All data are expressed as the mean ± SD. Statistical analysis was performed using one-way ANOVA (Tukey’s multiple comparisons test). Pearson’s correlation analysis was conducted between the global PSQI score and (E) BMI (kg/m2) or (F) Age (years). Each dot represents an individual value. **P < 0.01 was considered highly significant, and ****P< 0.0001 were considered extremely significant, ns was indicated as non-significant. |
Correlation Between PSQI Component Scores and BMI
To understand how the body mass index can influence the PSQI global score and its components, the study population was categorized into three groups as lean (BMI < 25), overweight (BMI = 25–29.9) and those with obesity (BMI ≥ 30). As previously shown, subjects with obesity had significantly higher global PSQI scores. It was further observed that the subjects with obesity also had a significantly shorter sleep duration (5.5 ± 1.6 hours, P ≤ 0.0001) than both the overweight (6.2 ± 1.6 hours) and lean (6.6 ± 1.4 hours) individuals (Figure 2A). The self-reported sleep duration was found to be negatively associated with BMI (r = −0.24, P ≤ 0.0001) (Figure 2B). We further investigated associations between BMI and other PSQI components (Table 3). Among PSQI components, sleep disturbance had the strongest association with obesity (r = 0.216, P ≤ 0.0001), followed by sleep latency (r = 0.180, P ≤ 0.0001) and use of medication (r = 0.178, P ≤ 0.0001); while, no association was found between the reported daytime function and BMI (P = 0.375).
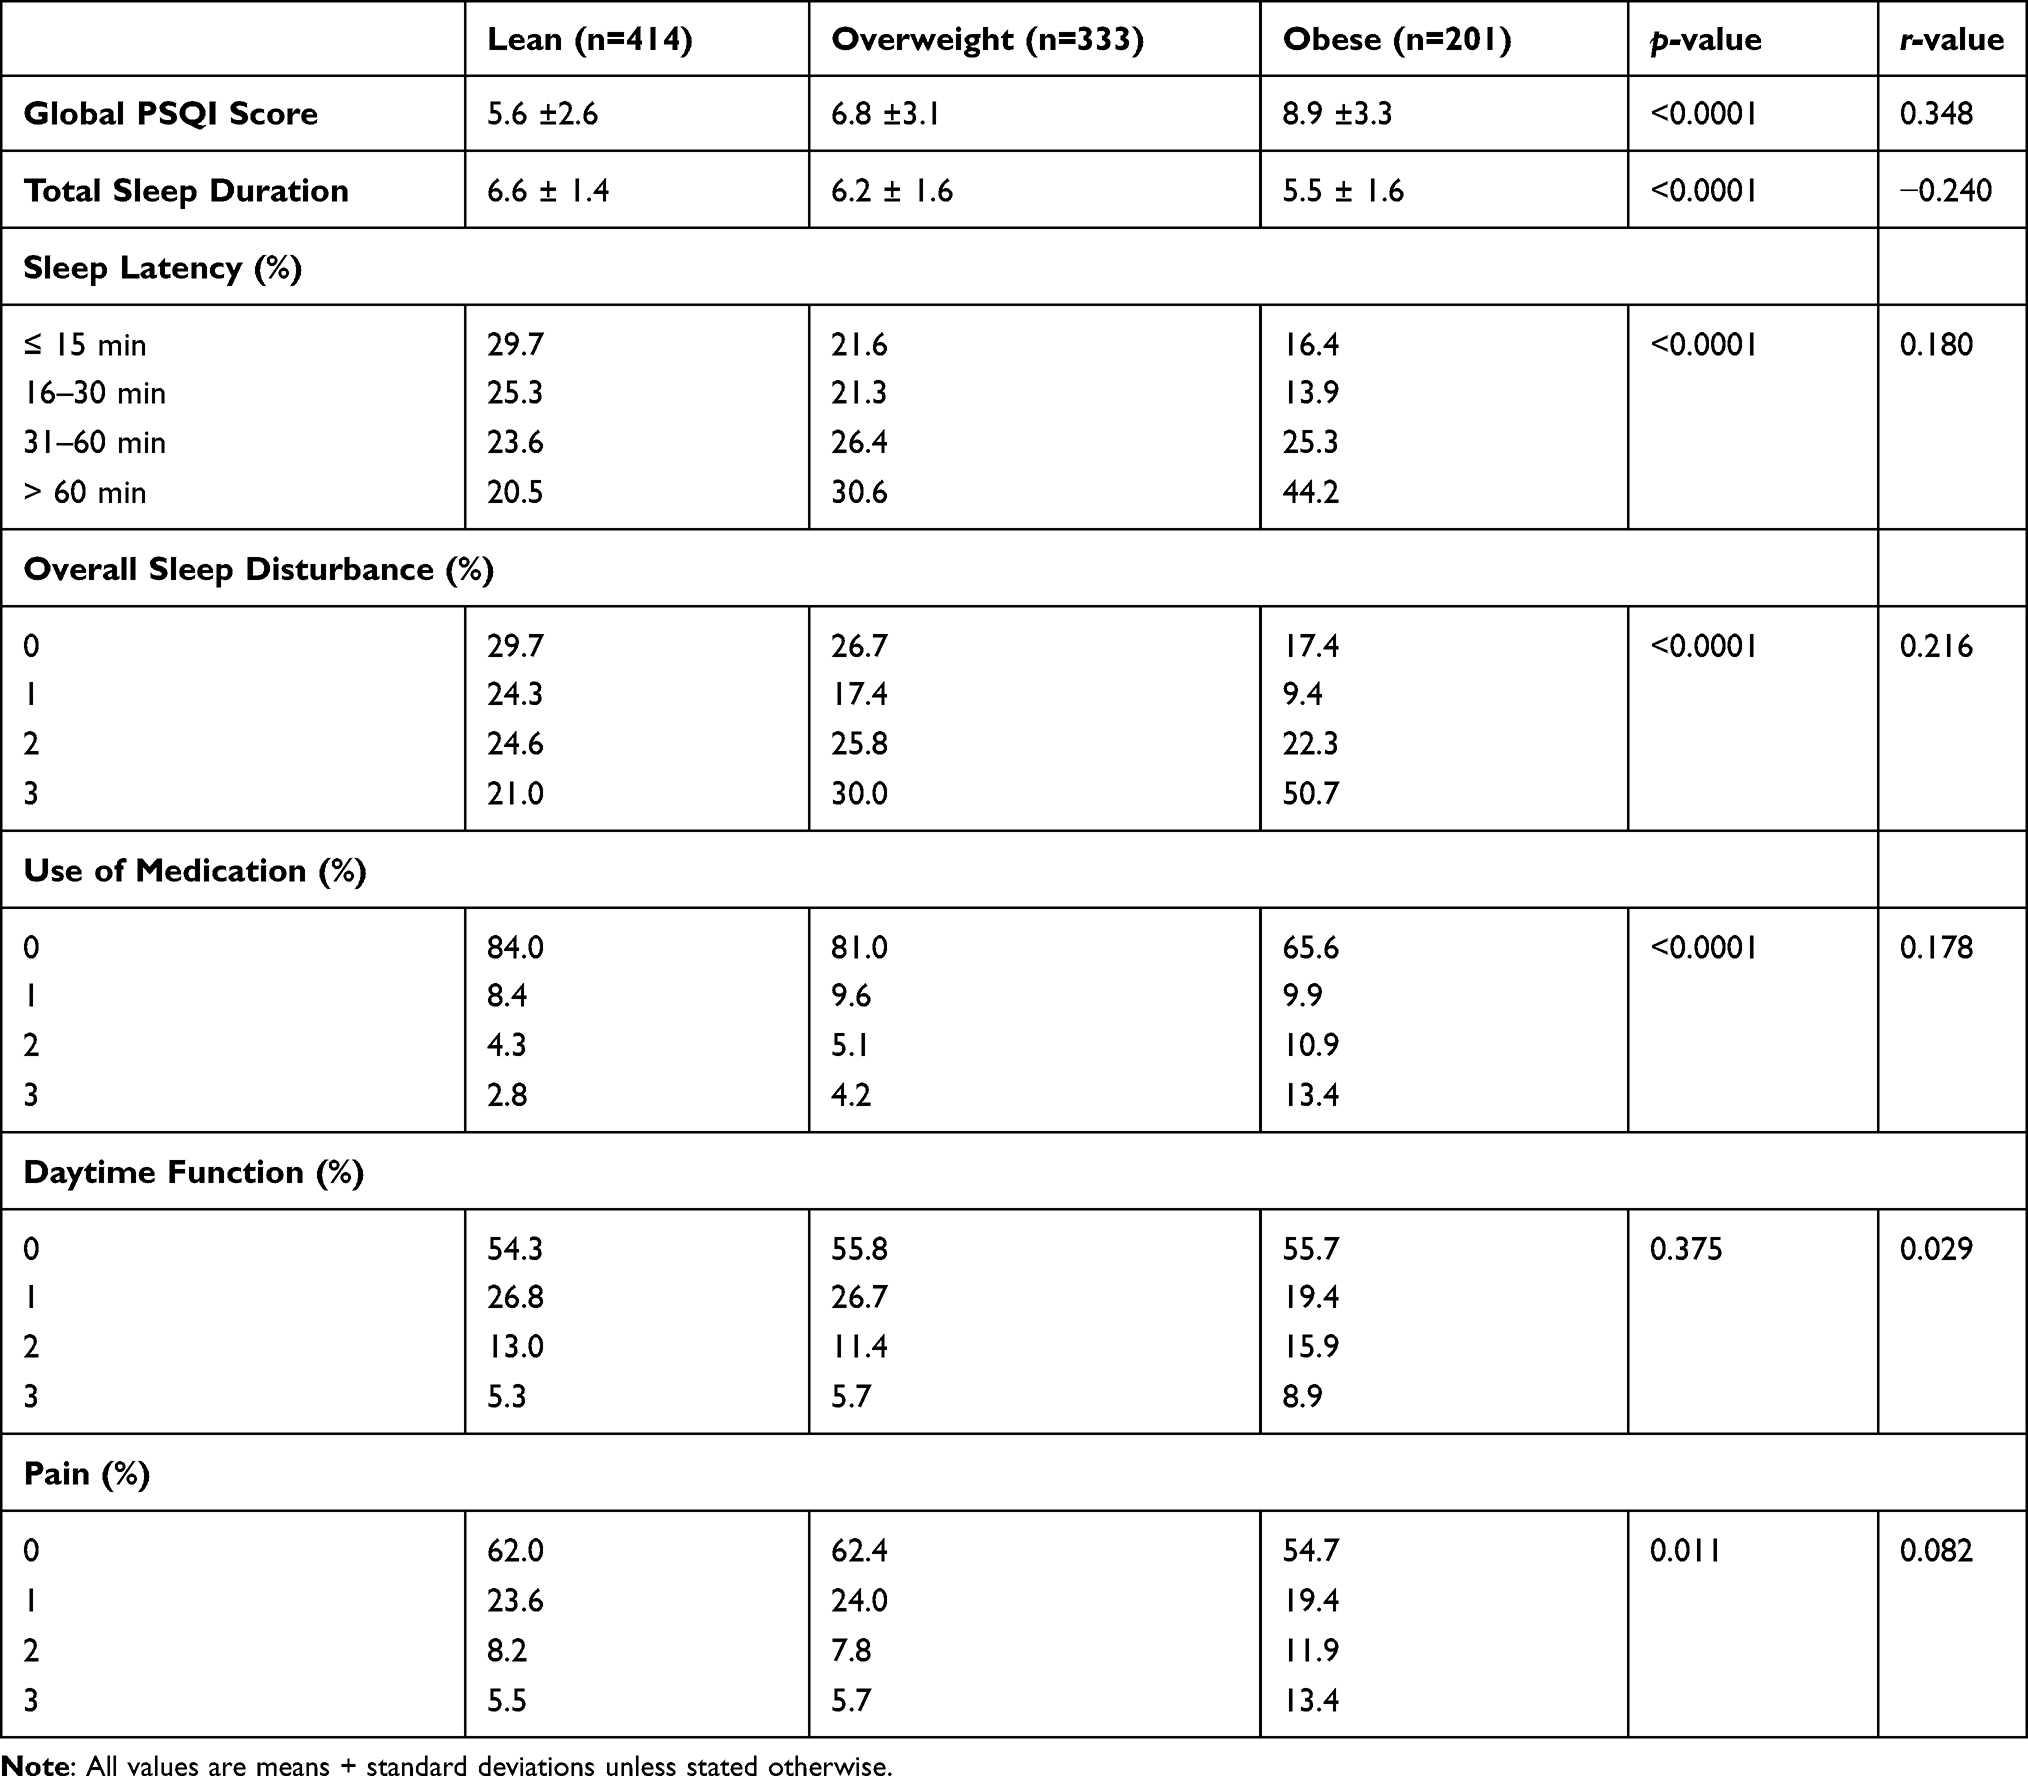 |
Table 3 Correlation Between BMI and PSQI Components |
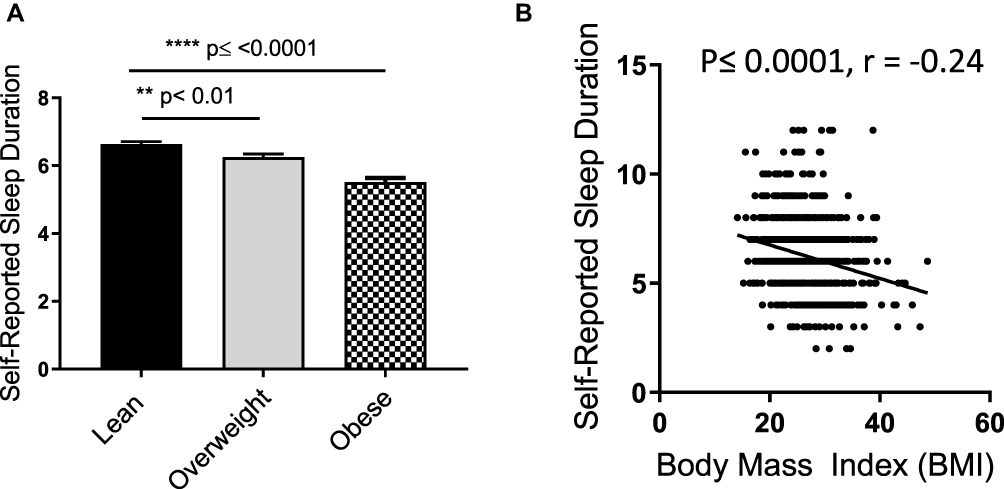 |
Figure 2 Effect of obesity on sleep duration. Participants were divided into three groups as: lean (BMI < 25), overweight (BMI = 25–29.9) and obese (BMI ≥ 30). (A) Self-reported sleep duration was compared between all three groups. (B) Pearson’s correlation analysis was conducted between self-reported sleep duration and the BMI of each individual. All data are expressed as the mean ± SD. Statistical analysis was performed using one-way ANOVA (Tukey’s multiple comparisons test). **P < 0.01 was considered highly significant, and ****P < 0.0001 were considered extremely significant. |
Taken together, the survey data suggest an association between sleep duration and obesity. To further verify these findings, we objectively measured sleep quality in a group of another 60 adult participants, classified as lean (18.5 to 24.9 kg/m2), overweight (25.0 and 29.9 kg/m2) and obese (≥30 kg/m2), over a period of seven consecutive days. There were no statistically significant differences in total calorie intake among groups (Supplementary Table S1) and they all showed equal physical activity levels (Supplementary Table S2). The participants differed based on weight, BMI, waist circumference, hip circumference, and fat percentage; with no significant differences with regard to age, height, and waist-to-hip ratio (Table 1). Using multiple-regression analysis, we investigated the dependency of obesity risk factors including total calorie intake, age, sedentary level and efficiency of sleep against BMI level (Table 4). In line with our survey-based self-reported data, we found that only the total sleep efficiency was independently associated with BMI (P = 0.0002). The sleep efficiency (%) calculated from the Actigraph data (Table 5), showed significant reduction with increase in BMI (Figure 3A); while, the total time in bed (min), regardless of sleeping status, did not differ significantly among the three groups (Figure 3B). Further analysis showed significantly shorter total sleep time (TST) in both overweight (P = 0.028) and subjects with obesity (P = 0.0009) as compared to lean group (Figure 3C). Our data also indicate that WASO was significantly higher in both overweight (P = 0.028) and subjects with obesity, compared to lean (P ≤ 0.0001) (Figure 3D), while the average number of awakening was significantly higher only in subjects with obesity (P=0.027) when compared to lean group (Figure 3E). There was no significant difference between groups regarding average awakening duration (Figure 3F). Regarding associations of BMI with the significantly changed sleep parameters, BMI had a negative association with overall sleep efficiency (r = - 0.58, P ≤ 0.0001) (Figure 4A) and with TST (r = - 0.52, P ≤ 0.0001) (Figure 4B); while BMI had a positive association with WASO (r = 0.55, P ≤ 0.0001) (Figure 4C) and with the number of awakenings per night (r = 0.43, P = 0.0008) (Figure 4D). We further found that only the TST (P = 0.0007) and WASO (P = 0.0079) were independently associated with BMI (Table 6). The effect of obesity onset on metabolic syndrome has been elucidated by us as well as other groups.53–56 In agreement with the previous reports, immuno-metabolic risk factors had elevated expression in overweight and in subjects with obesity as compared to their lean counterparts (Supplementary Table S3). Of note, strong associations were found between TST and obesity-related metabolic risk factors including diastolic blood pressure, elevated resting heart rate (HR), TG, total cholesterol, HOMA-IR, C-peptide, and CRP secretion (Figure 5). Multiple linear regression analyses further indicated that diastolic blood pressure (p < 0.03), HOMA-IR (p < 0.04), and C-peptide (p < 0.3) were independently associated with TST (Table 7).
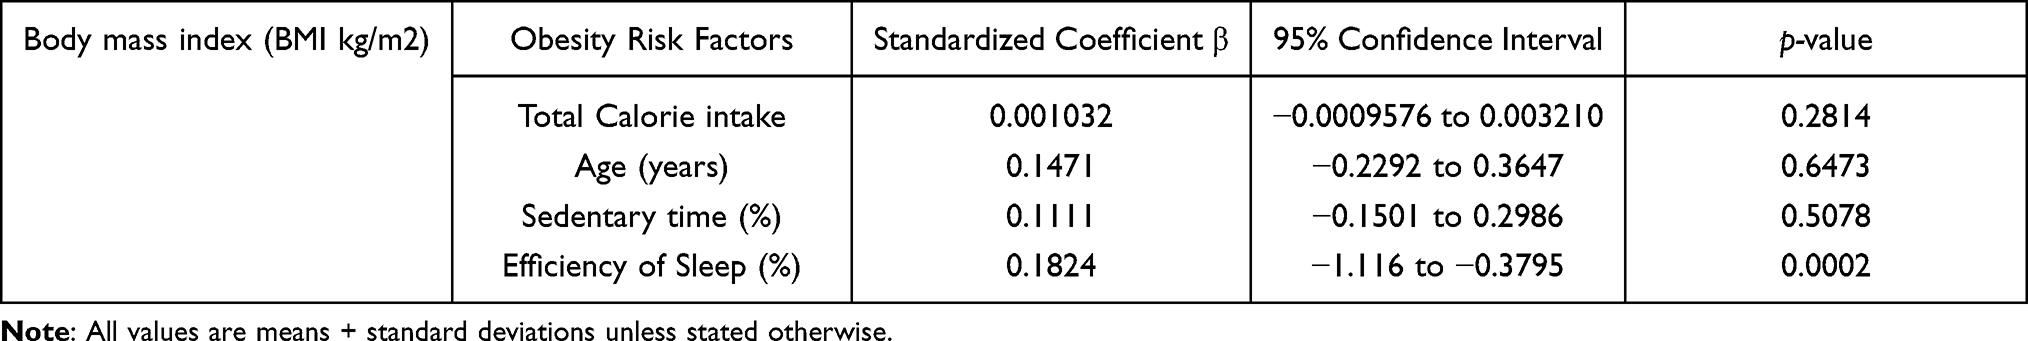 |
Table 4 Multiple Linear Regression Analysis of Obesity Risk Factors Vs BMI |
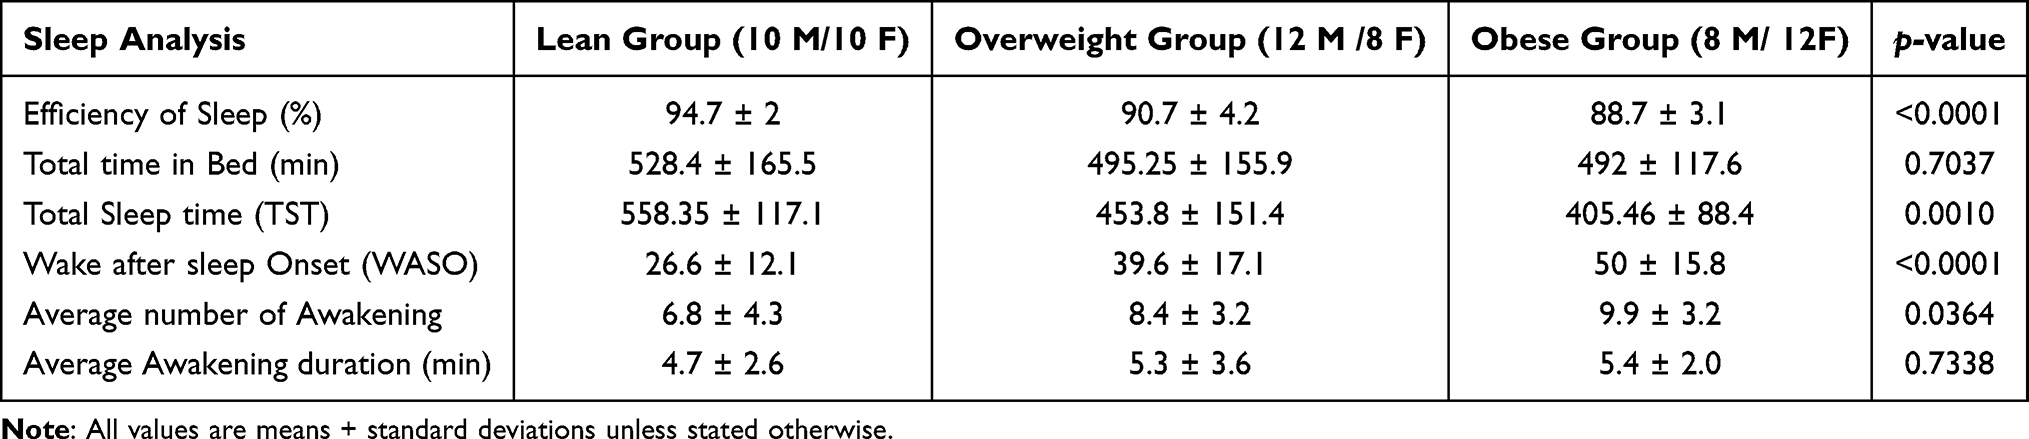 |
Table 5 Actigraphy Data |
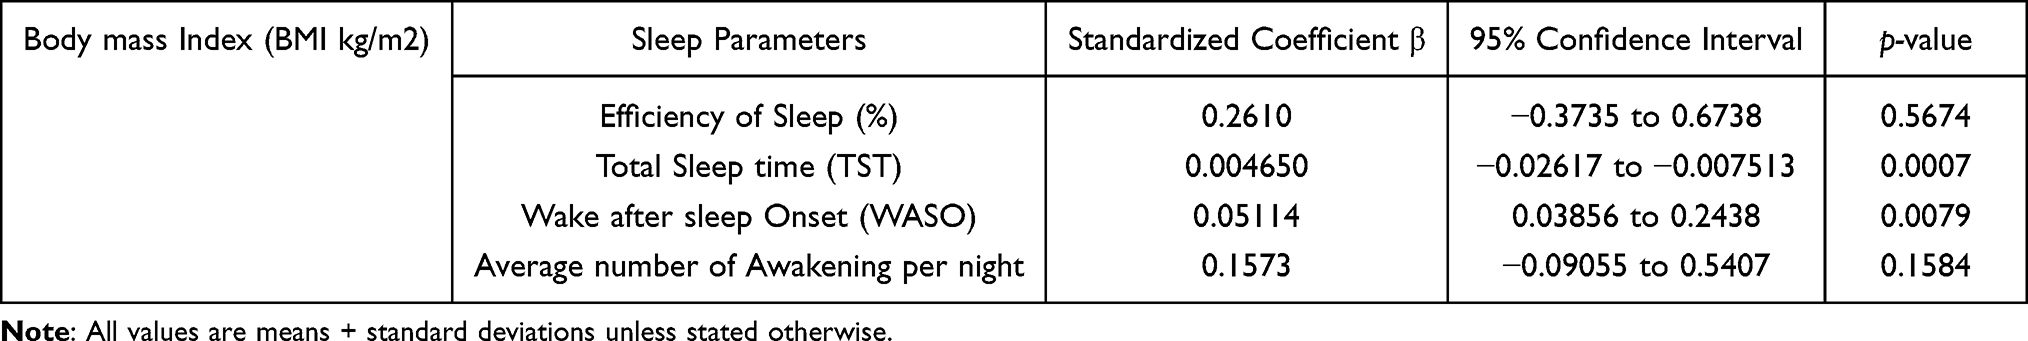 |
Table 6 Multiple Linear Regression Analysis of Sleep Parameters Vs BMI |
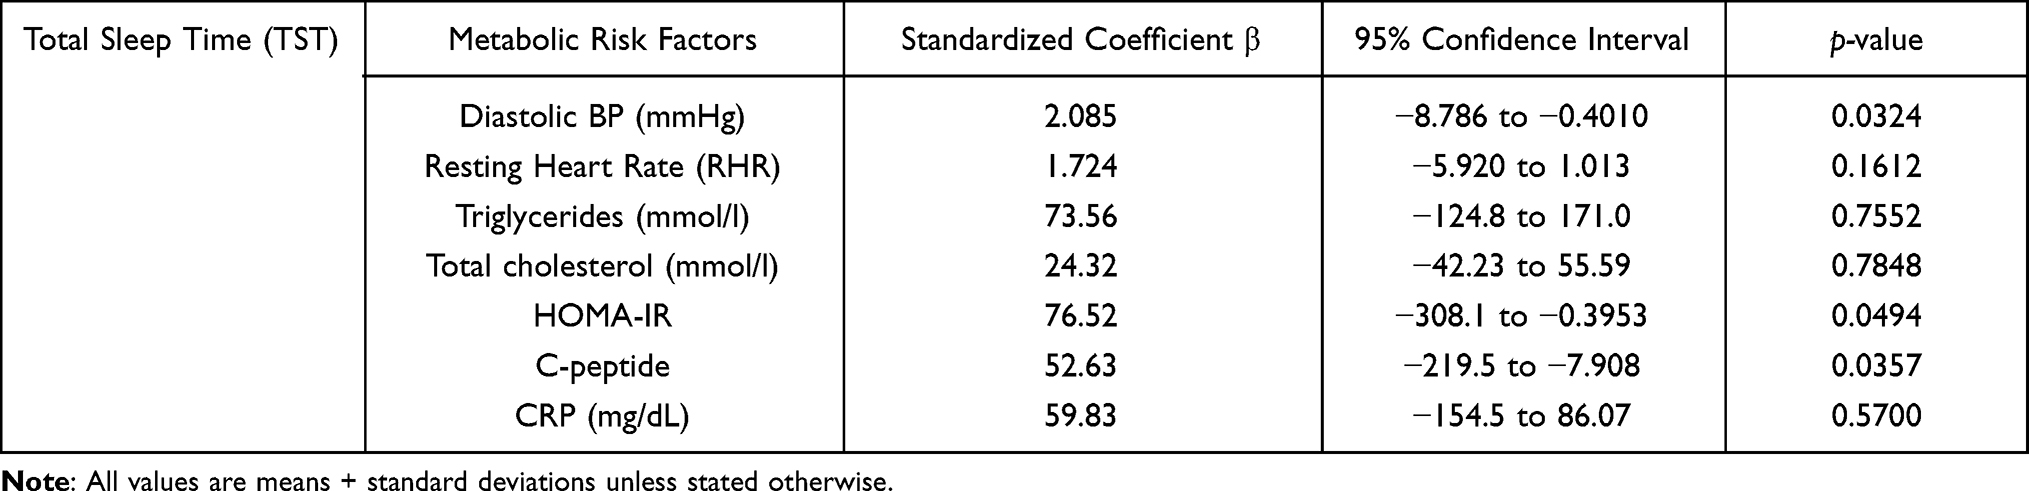 |
Table 7 Multiple Linear Regression Analysis of Sleep Parameters vs TST |
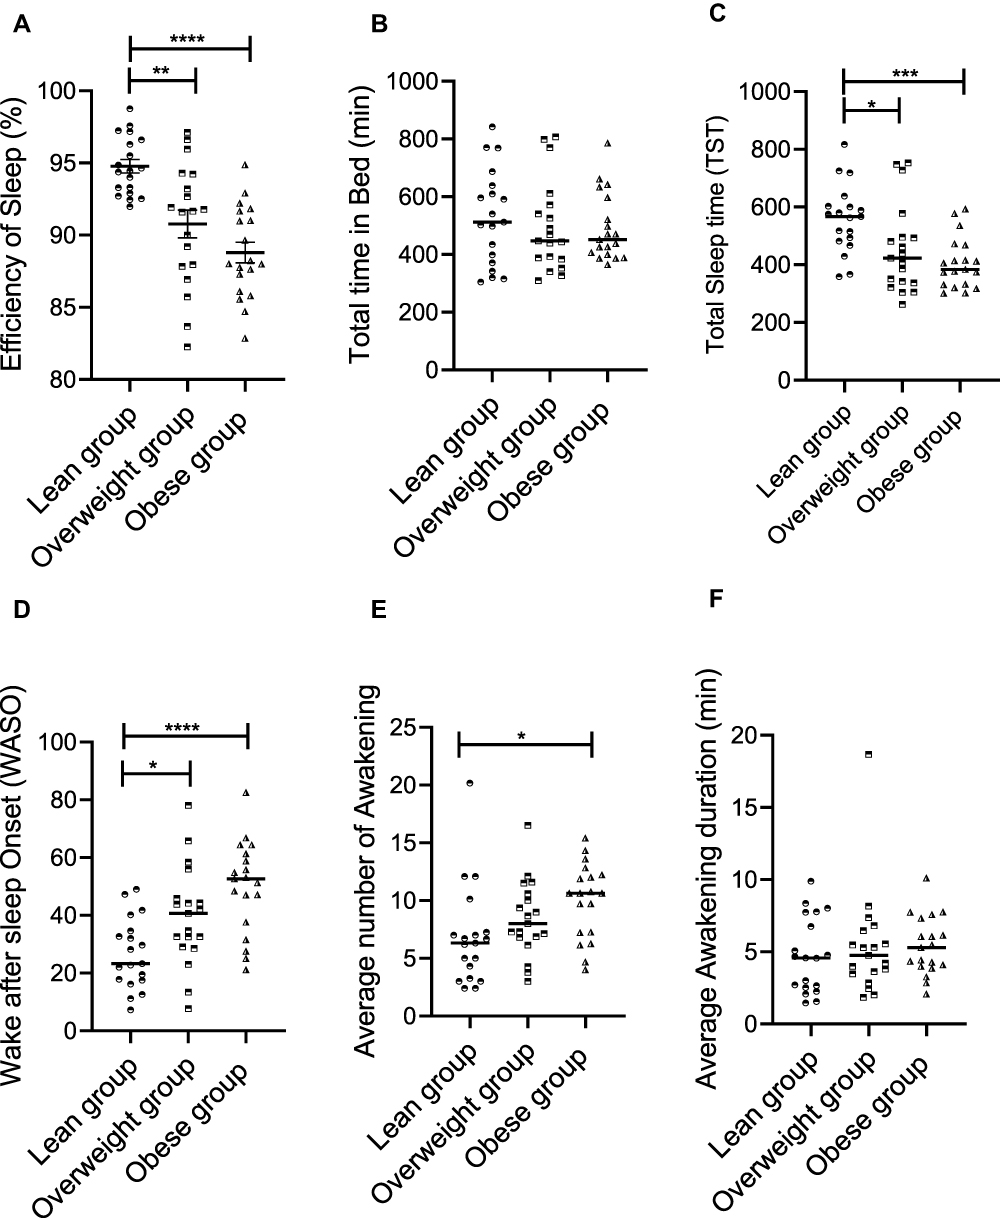 |
Figure 3 Objectively measured sleep analysis and its influence on BMI. A total of 60 participants had their sleep pattern monitored for 7 consecutive days through the use of Actigraph worn on the right hip. Participants were divided into three groups according to their BMI levels as before and their sleep efficiency and its components were compared in three BMI groups (lean, overweight, and obese). (A) total efficiency of sleep, (B) total time in bed, (C) total sleep time, (D) wake after sleep onset, (E) average number of awakening and (F) Average awakening duration. All data are expressed as the mean ± SD. Statistical analysis was performed using one-way ANOVA (Tukey’s multiple comparisons test). *P < 0.05 was considered statistically significant, **P < 0.01 was considered highly significant, and ***/****P < 0.001/P < 0.0001 were considered extremely significant. |
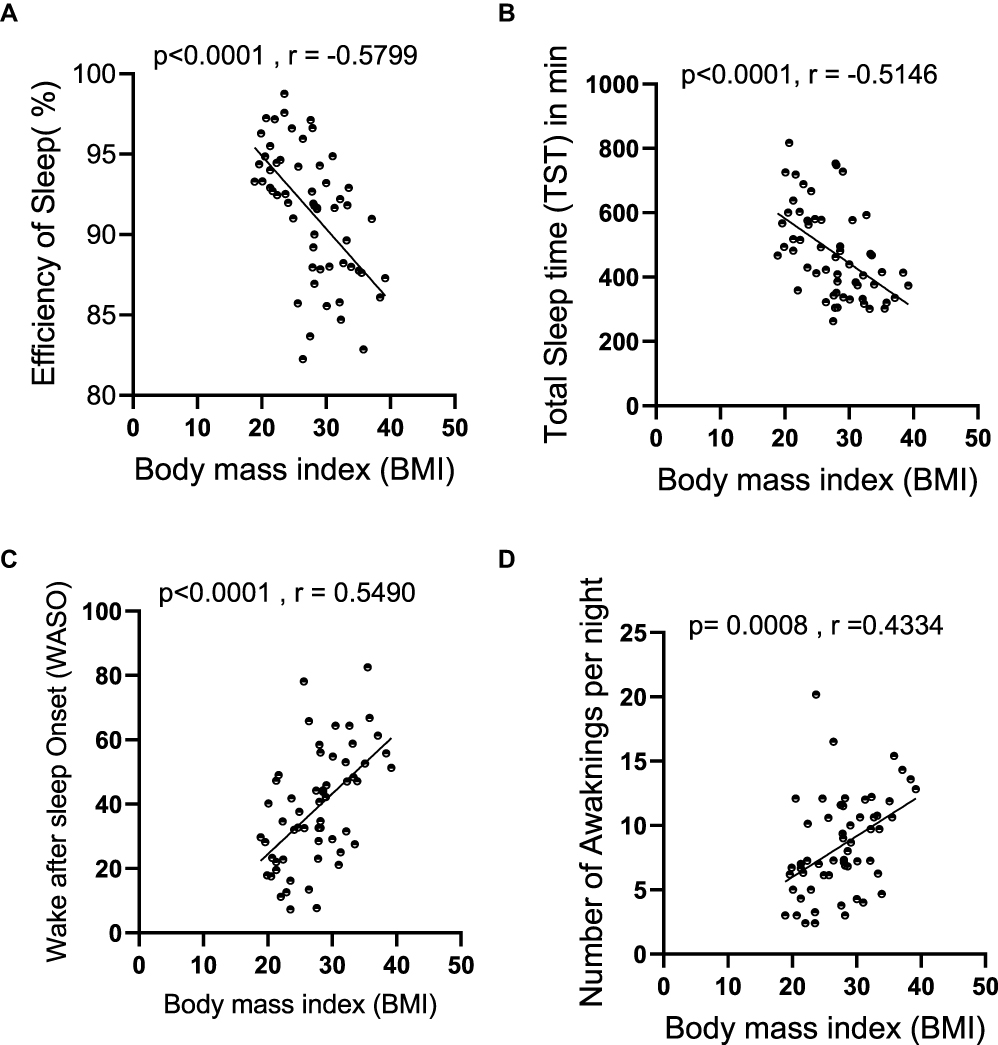 |
Figure 4 Correlation between sleep components and BMI. A total of 60 participants had their sleep pattern monitored for 7 consecutive days using Actigraphy. Participants were divided into three groups according to their BMI levels as lean (BMI ˂ 25 kg/m2), overweight (BMI = 25–29.9 kg/m2), and those with obesity (BMI ≥ 30 kg/m2), 20 each. Pearson’s correlation analysis was conducted between (A) efficiency of sleep, (B) total sleep time, (C) wake after sleep onset, and (D) number of awakening per night and the BMI of each individual. All data are expressed as the mean ± SD. Statistical analysis was performed using one-way ANOVA (Tukey’s multiple comparisons test). |
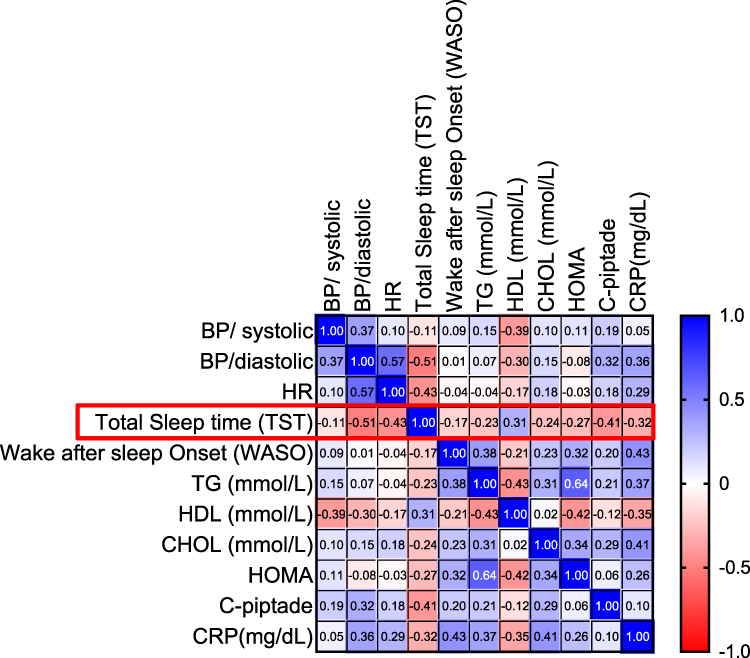 |
Figure 5 Correlation between sleep components and metabolic syndrome risk factors. A total of 60 participants had their sleep pattern monitored for 7 consecutive days using Actigraphy. Pearson’s correlation analysis is presented as heatmap showing the correlations of total sleep time (TST) and wake after sleep onset (WASO) with the known risk factors for metabolic syndrome. Darker shading indicates a greater degree of correlation, and correlations with p-values > 0.05 are displayed in white. |
Discussion
To our knowledge, this report represents one of the first studies to examine sleep habits and their association with obesity and other metabolic risk factors in a general sample of Kuwaiti urban adult population in the absence of SA onset. Since we basically aimed to investigate the life-style-induced effects of sleep deprivation, those with the SA were excluded from the study. SA is a medical condition associated with obesity and metabolic syndrome, triggered by the physical narrowing of the airway (physical factor) or as the brain sends impaired signals to the muscles that control breathing (behavioral factor).57 Among the 984 surveyed participants, the average night sleep duration was reported to be 6.28±1.6 hours per night, which is found to be slightly lower than the average sleep duration recommended as per the National Sleep Foundation Report.52 The poor sleep habits of our study population were further reflected by the calculated PSQI scores, with an average score of 6.8±3.2. However, when we objectively measured the sleep duration in another group of 60 participants, we found that total sleep duration was slightly longer than that found from the PSQI survey (6.7±1.4 hours), meeting with the minimally recommended by the national sleep foundation.52 A shorter sleep duration was shown previously to significantly increase the risk of developing T2D,4,58 cardiometabolic risks,59 dyslipidemia60 and other metabolic syndromes.61,62 Although it is still unclear how sleep duration may lead to metabolic conditions when paired with SA onset,17 it seems that sleep deprivation is becoming a worldwide problem. The disturbance of sleep and poor sleep quality may arise from a variety of psychosocial and biological factors. Personal risk factors such as age, sex and body weight have found to be linked with overall SQ.11 In our study, only the BMI was found to be positively correlated with the global PSQI score (r = 0.348, P ≤ 0.0001) in a weight-dependent manner, while other risk factors showed no significant effect on the global PSQI score. Further analysis of the relationship between individual PSQI components and obesity showed a significant association of obesity with sleep duration (r = −0.240, P ≤ 0.0001), sleep disturbance (r = 0.216, P ≤ 0.0001), sleep latency (r = 0.180, P ≤ 0.0001) and the use of medication (r = 0.178, P ≤ 0.0001). To verify these observations, we objectively measured the sleep efficiency in 60 healthy participants using actigraphy approach. Multiple regression analysis was performed to understand the influence of age, total calorie intake, sedentary behavior and sleep efficiency on BMI. In this concern, only the sleep efficiency was found to be independently associated with BMI, which recapitulated the trend from the PSQI data collected. To further investigate the influence of different sleep components on body weight, we divided the participates into three groups according to BMI as lean, overweight and obese. To this end, both TST and WASO were found to correlate with obesity (BMI) and obesity-related risk factors, in a weigh dependent manner. Our data also reveal a strong, direct association between sleep duration and glucose profile (as measured by HOMA-IR and C-peptide), which may explain, in part, high incidence of T2D in Kuwaiti adult population.63 These findings are supported by previous studies reporting the direct relationship between increased BMI and poor sleep quality, sleep disturbances and disordered eating.64,65 Although, the underlying mechanisms linking poor SQ and obesity still remain unclear, it is speculated that sleep disturbance and poor SQ lead to several alterations in body metabolism and endocrine system. In particular, stress response hormones such as ghrelin, cortisol and leptin are upregulated in sleep-deprived individuals.25,66 These hormones play a major role not only in maintaining energy balance at the cellular level but also influence the food preferences, leading to the increased food intake. Interestingly, prolonged sleep restriction, such as sleep duration of less than 6.5 hours, has been associated with the increased consumption of high-calorie food and beverages rich in sugar.9,67,68 Furthermore, insufficient sleep, sleep disturbances, and lower daytime functioning can be associated with sleepiness and fatigue which, in turn, may lead to reduced physical activity during the daytime.69 Together, these factors seem to favor a situation where the energy consumption surpasses energy expenditure, hence promoting obesity and obesity-related complications. However, it is noteworthy that in our actigraphy study population, we found no significant difference among groups with regard to calorie consumption and physical activity. We speculate that even though the physical activity measurements were objectively tracked via actigraphy in our study population, we still relied on self-reported food consumption diaries to obtain their nutritional information during the entire period of the study. One of the downsides of self-reporting procedure is that the respondents may not always feel motivated to provide the accurate information or sometimes there may be inadvertent errors and omissions in the data provided by the participants, all of which can negatively affect the reliability of such data.
Overall, we show that both SQ and sleep duration are found to be inadequate in Kuwaiti urban adult population, referring to the international SQ standards. The reported data provide the evidence that insufficient sleep might be a prevalent factor among the local adult population, especially in those with obesity. We identified a significant association between SQ, especially sleep duration, and obesity or its related factors, in the absence of SA onset. Notably, over the past decades, societal modernization has greatly impacted the life style of the population,70 and the prevalence of obesity and obesity-related complications have soared within the same time period in Kuwait, as reported by others as well.7 Since the obesity and sleeping disorders are tightly intertwined via a bidirectional mechanism,16 our findings may have critical translational significance for a country like Kuwait which is adversely afflicted by obesity pandemic. It may be interesting to further explore whether reducing obesity may improve sleep duration and quality and vice versa. Since the dietary intake has also been reported to play a role in the sleep regulation,39 using nutritional approach of eating healthy diets rich in fiber and low in fat and carbs may also be exploited as a tool to improve both sleeping disorders and obesity. Moreover, it would be interesting to see whether vitamin supplements, such as vitamin D, can also improve sleep duration and SQ as clinical studies in humans indicate that low levels of vitamin D are correlated with poor SQ and short sleep duration. Regulation of sleep-wake cycle by vitamin D may be explained by presence of vitamin D receptors in the brain regions that are involved in circadian rhythm and sleep regulation.71 However, our study is limited by certain caveats. First, this is a cross-sectional study. Second, the PSQI survey data represent a model of subjective analysis which involves risks of participant-stated misinformation. Third, actigraphy data (objective analysis) represent only a small population (60 participants) and, therefore, caution may be warranted while interpreting the results for generalizability. Also, we used self-reported questionnaires and food diaries, both of which are error prone and compromise the accuracy of the data obtained. Last but not least, self-diagnosis of SA, a condition known to induce both obesity and metabolic complications,17,22 may also hamper with the accuracy of the study findings. Therefore, further studies will be required, preferably longitudinal, comprising of larger cohorts, with repeated measures of both sleep and weight over time. Importantly, there is also a need for interventional studies, designed to manipulate the sleep duration to see whether poor sleep predisposes the Kuwaiti adult population to obesity.
Conclusion
In this study, we show that both sleep quality and duration correlate negatively with obesity and obesity-related risk factors. Sedentary lifestyle and dietary habits (overnutrition) are the major contributory factors to obesity epidemic in Kuwait. Hot climate and harsh ambient conditions during most part of the year favor the nighttime activities over daytime activities. Both inadequate sleep duration and poor SQ have been shown to influence food choices. We, therefore, believe that understanding sleep habits of Kuwaiti population and devising interventional strategies accordingly can help address the obesity epidemic in the country.
Acknowledgments
The authors would like to thank Dasman summer internship program students from Kuwait Medical University (2019) for participating in the collection of the survey reports.
Author Contributions
All authors made a significant contribution to the work reported, whether that is in the conception, study design, execution, acquisition of data, analysis and interpretation, or in all these areas; took part in drafting, revising or critically reviewing the article; gave final approval of the version to be published; have agreed on the journal to which the article has been submitted; and agree to be accountable for all aspects of the work.
Funding
This work was supported by grants (RH HM-2019-019) from Kuwait Foundation for the Advancement of Sciences (KFAS).
Disclosure
The authors declare that there are no conflicts of interest involved.
References
1. Blüher M. Obesity: global epidemiology and pathogenesis. Nat Rev Endocrinol. 2019;15(5):288–298.
2. Seidell JC, Halberstadt J. The global burden of obesity and the challenges of prevention. Ann Nutr Metab. 2015;66(Suppl 2):7–12.
3. Adams KF, Schatzkin A, Harris TB, et al. Overweight, obesity, and mortality in a large prospective cohort of persons 50 to 71 years old. N Engl J Med. 2006;355(8):763–778.
4. Spiegel K, Tasali E, Leproult R, Van Cauter E. Effects of poor and short sleep on glucose metabolism and obesity risk. Nat Rev Endocrinol. 2009;5(5):253–261.
5. Morselli LL, Guyon A, Spiegel K. Sleep and metabolic function. Pflugers Arch. 2012;463(1):139–160.
6. Burgess DJ. Keeping score with obesity. Nat Rev Genet. 2019;20(6):320–321.
7. Al Rashdan I, Al Nesef Y. Prevalence of overweight, obesity, and metabolic syndrome among adult Kuwaitis: results from community-based national survey. Angiology. 2010;61(1):42–48.
8. Honkala S, Behbehani JM, Honkala E. Daily consumption of sugary drinks and foods as a behavioural risk for health of adolescents in Kuwait. Oral Health Prev Dent. 2012;10(2):113–122.
9. Muscogiuri G, Barrea L, Aprano S, et al. Sleep quality in obesity: does adherence to the mediterranean diet matter? Nutrients. 2020;12:5.
10. Marco CA, Wolfson AR, Sparling M, Azuaje A. Family socioeconomic status and sleep patterns of young adolescents. Behav Sleep Med. 2011;10(1):70–80.
11. Luca G, Haba Rubio J, Andries D, et al. Age and gender variations of sleep in subjects without sleep disorders. Ann Med. 2015;47(6):482–491.
12. Pejovic S, Vgontzas AN, Basta M, et al. Leptin and hunger levels in young healthy adults after one night of sleep loss. J Sleep Res. 2010;19(4):552–558.
13. Taheri S. The link between short sleep duration and obesity: we should recommend more sleep to prevent obesity. Arch Dis Child. 2006;91(11):881–884.
14. Currie A, Cappuccio FP. Sleep in children and adolescents: a worrying scenario: can we understand the sleep deprivation-obesity epidemic? Nutr Metab Cardiovasc Dis. 2007;17(3):230–232.
15. Romero-Corral A, Caples SM, Lopez-Jimenez F, Somers VK. Interactions between obesity and obstructive sleep apnea: implications for treatment. Chest. 2010;137(3):711–719.
16. Muscogiuri G, Barrea L, Annunziata G, et al. Obesity and sleep disturbance: the chicken or the egg? Crit Rev Food Sci Nutr. 2019;59(13):2158–2165.
17. Pugliese G, Barrea L, Laudisio D, et al. Sleep apnea, obesity, and disturbed glucose homeostasis: epidemiologic evidence, biologic insights, and therapeutic strategies. Curr Obes Rep. 2020;9(1):30–38.
18. Resta O, Foschino Barbaro MP, Bonfitto P, et al. Low sleep quality and daytime sleepiness in obese patients without obstructive sleep apnoea syndrome. J Intern Med. 2003;253(5):536–543.
19. Dixon JB, Schachter LM, O’Brien PE. Sleep disturbance and obesity: changes following surgically induced weight loss. Arch Intern Med. 2001;161(1):102–106.
20. Adams ML, Katz DL, Shenson D. A healthy lifestyle composite measure: significance and potential uses. Prev Med. 2016;84:41–47.
21. Knutson KL, Van Cauter E. Associations between sleep loss and increased risk of obesity and diabetes. Ann N Y Acad Sci. 2008;1129:287–304.
22. Levy P, Tamisier R, Arnaud C, et al. Sleep deprivation, sleep apnea and cardiovascular diseases. Front Biosci (Elite Ed). 2012;4:2007–2021.
23. Koren D, Taveras EM. Association of sleep disturbances with obesity, insulin resistance and the metabolic syndrome. Metabolism. 2018;84:67–75.
24. Liu W, Zhang R, Tan A, et al. Long sleep duration predicts a higher risk of obesity in adults: a meta-analysis of prospective cohort studies. J Public Health (Oxf). 2019;41(2):e158–e68.
25. Hargens TA, Kaleth AS, Edwards ES, Butner KL. Association between sleep disorders, obesity, and exercise: a review. Nat Sci Sleep. 2013;5:27–35.
26. Markwald RR, Melanson EL, Smith MR, et al. Impact of insufficient sleep on total daily energy expenditure, food intake, and weight gain. Proc Natl Acad Sci U S A. 2013;110(14):5695–5700.
27. Hotamisligil GS. Inflammation and metabolic disorders. Nature. 2006;444(7121):860–867.
28. Opp MR, Kapas L, Toth LA. Cytokine involvement in the regulation of sleep. Proc Soc Exp Biol Med. 1992;201(1):16–27.
29. Van Cauter E, Holmback U, Knutson K, et al. Impact of sleep and sleep loss on neuroendocrine and metabolic function. Horm Res. 2007;67(Suppl 1):2–9.
30. Brum MC, Filho FF, Schnorr CC, Bottega GB, Rodrigues TC. Shift work and its association with metabolic disorders. Diabetol Metab Syndr. 2015;7:45.
31. Cain SW, Filtness AJ, Phillips CL, Anderson C. Enhanced preference for high-fat foods following a simulated night shift. Scand J Work Environ Health. 2015;41(3):288–293.
32. Pinto TF, de Bruin PFC, de Bruin VMS, Lopes PM, Lemos FN. Obesity, hypersomnolence, and quality of sleep: the impact of bariatric surgery. Obes Surg. 2017;27(7):1775–1779.
33. Leproult R, Van Cauter E. Role of sleep and sleep loss in hormonal release and metabolism. Endocr Dev. 2010;17:11–21.
34. Carrier J, Land S, Buysse DJ, Kupfer DJ, Monk TH. The effects of age and gender on sleep EEG power spectral density in the middle years of life (ages 20-60 years old). Psychophysiology. 2001;38(2):232–242.
35. Ohayon MM, Carskadon MA, Guilleminault C, Vitiello MV. Meta-analysis of quantitative sleep parameters from childhood to old age in healthy individuals: developing normative sleep values across the human lifespan. Sleep. 2004;27(7):1255–1273.
36. Li RH, Wing YK, Ho SC, Fong SY. Gender differences in insomnia–a study in the Hong Kong Chinese population. J Psychosom Res. 2002;53(1):601–609.
37. Dijk DJ, James LM, Peters S, Walsh JK, Deacon S. Sex differences and the effect of gaboxadol and zolpidem on EEG power spectra in NREM and REM sleep. J Psychopharmacol. 2010;24(11):1613–1618.
38. Mourtazaev MS, Kemp B, Zwinderman AH, Kamphuisen HA. Age and gender affect different characteristics of slow waves in the sleep EEG. Sleep. 1995;18(7):557–564.
39. Tan X, Alen M, Cheng SM, et al. Associations of disordered sleep with body fat distribution, physical activity and diet among overweight middle-aged men. J Sleep Res. 2015;24(4):414–424.
40. St-Onge M-P, Roberts A, Shechter A, Choudhury AR. Fiber and saturated fat are associated with sleep arousals and slow wave sleep. J Clin Sleep Med. 2016;12(1):19–24.
41. Muscogiuri G, Barrea L, Aprano S, et al. Sleep quality in obesity: does adherence to the mediterranean diet matter? Nutrients. 2020;12(5):1364.
42. Castellucci B, Barrea L, Laudisio D, et al. Improving sleep disturbances in obesity by nutritional strategies: review of current evidence and practical guide. Int J Food Sci Nutr. 2020;1–13.
43. Buscemi D, Kumar A, Nugent R, Nugent K. Short sleep times predict obesity in internal medicine clinic patients. J Clin Sleep Med. 2007;3(7):681–688.
44. Buysse DJ, Reynolds CF, Monk TH, Berman SR, Kupfer DJ. The Pittsburgh Sleep Quality Index: a new instrument for psychiatric practice and research. Psychiatry Res. 1989;28(2):193–213.
45. Sitasuwan T, Bussaratid S, Ruttanaumpawan P, Chotinaiwattarakul W. Reliability and validity of the Thai version of the Pittsburgh Sleep Quality Index. J Med Assoc Thai. 2014;97(Suppl 3):S57–67.
46. Suleiman KH, Yates BC. Translating the insomnia severity index into Arabic. J Nurs Scholarsh. 2011;43(1):49–53.
47. Cellini N, Buman MP, McDevitt EA, Ricker AA, Mednick SC. Direct comparison of two actigraphy devices with polysomnographically recorded naps in healthy young adults. Chronobiol Int. 2013;30(5):691–698.
48. De Vries SI, Van Hirtum HW, Bakker I, Hopman-Rock M, Hirasing RA, Van Mechelen W. Validity and reproducibility of motion sensors in youth: a systematic update. Med Sci Sports Exerc. 2009;41(4):818–827.
49. Corder K, Ekelund U, Steele RM, Wareham NJ, Brage S. Assessment of physical activity in youth. J Appl Physiol (1985). 2008;105(3):977–987.
50. Freedson PS, Melanson E, Sirard J. Calibration of the Computer science and applications, Inc Accelerometer. Med Sci Sports Exerc. 1998;30(5):777–781.
51. Rosenberger ME, Buman MP, Haskell WL, McConnell MV, Carstensen LL. Twenty-four hours of sleep, sedentary behavior, and physical activity with nine wearable devices. Med Sci Sports Exerc. 2016;48(3):457–465.
52. Hirshkowitz M, Whiton K, Albert SM, et al. National Sleep Foundation’s updated sleep duration recommendations: final report. Sleep Health. 2015;1(4):233–243.
53. Ahmad R, Al-Mass A, Al-Ghawas D, et al. Interaction of osteopontin with IL-18 in obese individuals: implications for insulin resistance. PLoS One. 2013;8(5):e63944.
54. Sindhu S, Thomas R, Kochumon S, et al. Increased adipose tissue expression of Interferon Regulatory Factor (IRF)-5 in obesity: association with metabolic inflammation. Cells. 2019;8:11.
55. Ansarimoghaddam A, Adineh HA, Zareban I, Iranpour S, HosseinZadeh A, Kh F. Prevalence of metabolic syndrome in Middle-East countries: meta-analysis of cross-sectional studies. Diabetes Metab Syndr. 2018;12(2):195–201.
56. Hernandez-Baixauli J, Quesada-Vázquez S, Mariné-Casadó R, et al. Detection of early disease risk factors associated with metabolic syndrome: a new era with the NMR metabolomics assessment. Nutrients. 2020;12:3.
57. Unnikrishnan D, Jun J, Polotsky V. Inflammation in sleep apnea: an update. Rev Endocr Metab Disord. 2015;16(1):25–34.
58. Martorina W, Tavares A. Real-world data in support of short sleep duration with poor glycemic control, in people with Type 2 diabetes mellitus. J Diabetes Res. 2019;2019:6297162.
59. Seo SH, Shim YS. Association of sleep duration with obesity and cardiometabolic risk factors in children and adolescents: a population-based study. Sci Rep. 2019;9(1):9463.
60. Gangwisch JE, Malaspina D, Babiss LA, et al. Short sleep duration as a risk factor for hypercholesterolemia: analyses of the National Longitudinal Study of Adolescent Health. Sleep. 2010;33(7):956–961.
61. Wang MH, Shi T, Li Q, et al. Associations of sleep duration and fruit and vegetable intake with the risk of metabolic syndrome in Chinese adults. Medicine (Baltimore). 2021;100(10):e24600.
62. Sagan KP, Andrysiak-Mamos E, Tyburski E, Sagan LM, Syrenicz A. Quality of life and sleep in patients with pituitary adenoma in relation to tumor type and compression of the optic chiasm. J Clin Med. 2021;10:9.
63. Alkandari A, Alarouj M, Elkum N, et al. Adult diabetes and prediabetes prevalence in Kuwait: data from the cross-sectional Kuwait diabetes epidemiology program. J Clin Med. 2020;9:11.
64. Vargas PA, Flores M, Robles E. Sleep quality and body mass index in college students: the role of sleep disturbances. J Am Coll Health. 2014;62(8):534–541.
65. Yeh SS, Brown RF. Disordered eating partly mediates the relationship between poor sleep quality and high body mass index. Eat Behav. 2014;15(2):291–297.
66. Broussard JL, Van Cauter E. Disturbances of sleep and circadian rhythms: novel risk factors for obesity. Curr Opin Endocrinol Diabetes Obes. 2016;23(5):353–359.
67. Felső R, Lohner S, Hollódy K, Erhardt É, Molnár D. Relationship between sleep duration and childhood obesity: systematic review including the potential underlying mechanisms. Nutr Metab Cardiovasc Dis. 2017;27(9):751–761.
68. Laudisio D, Barrea L, Pugliese G, et al. A practical nutritional guide for the management of sleep disturbances in menopause. Int J Food Sci Nutr. 2020;1–15.
69. Zimberg IZ, Dâmaso A, Del Re M, et al. Short sleep duration and obesity: mechanisms and future perspectives. Cell Biochem Funct. 2012;30(6):524–529.
70. Al-Sejari M. Sociocultural characteristic, lifestyle, and metabolic risk factors among a sample of Kuwaiti Male University Students. Am J Mens Health. 2017;11(2):308–317.
71. Muscogiuri G, Barrea L, Scannapieco M, et al. The lullaby of the sun: the role of vitamin D in sleep disturbance. Sleep Med. 2019;54:262–265.
 © 2021 The Author(s). This work is published and licensed by Dove Medical Press Limited. The
full terms of this license are available at https://www.dovepress.com/terms
and incorporate the Creative Commons Attribution
- Non Commercial (unported, 3.0) License.
By accessing the work you hereby accept the Terms. Non-commercial uses of the work are permitted
without any further permission from Dove Medical Press Limited, provided the work is properly
attributed. For permission for commercial use of this work, please see paragraphs 4.2 and 5 of our Terms.
© 2021 The Author(s). This work is published and licensed by Dove Medical Press Limited. The
full terms of this license are available at https://www.dovepress.com/terms
and incorporate the Creative Commons Attribution
- Non Commercial (unported, 3.0) License.
By accessing the work you hereby accept the Terms. Non-commercial uses of the work are permitted
without any further permission from Dove Medical Press Limited, provided the work is properly
attributed. For permission for commercial use of this work, please see paragraphs 4.2 and 5 of our Terms.