Back to Journals » International Journal of Nanomedicine » Volume 19
Shear Bond Strength to Enamel, Mechanical Properties and Cellular Studies of Fiber-Reinforced Composites Modified by Depositing SiO2 Nanofilms on Quartz Fibers via Atomic Layer Deposition
Authors Shu F, Chen H, Zhang Z ![]() , Dun Z, Lv W, Sun W, Liu M
, Dun Z, Lv W, Sun W, Liu M ![]()
Received 25 October 2023
Accepted for publication 13 February 2024
Published 5 March 2024 Volume 2024:19 Pages 2113—2136
DOI https://doi.org/10.2147/IJN.S446584
Checked for plagiarism Yes
Review by Single anonymous peer review
Peer reviewer comments 3
Editor who approved publication: Professor Eng San Thian
Fei Shu,* Hong Chen,* Zhihao Zhang, Zhiyue Dun, Weijin Lv, Wangxinyue Sun, Mei Liu
Department of Prosthodontics, The Affiliated Stomatological Hospital of Nanjing Medical University, Jiangsu Province Key Laboratory of Oral Diseases, Jiangsu Province Engineering Research Center of Stomatological Translational Medicine, Nanjing, People’s Republic of China
*These authors contributed equally to this work
Correspondence: Mei Liu, Department of Prosthodontics, The Affiliated Stomatological Hospital of Nanjing Medical University, Jiangsu Province Key Laboratory of Oral Diseases, Jiangsu Province Engineering Research Center of Stomatological Translational Medicine, Nanjing, People’s Republic of China, Tel +86-25-69593081, Fax +86-25-69593186, Email [email protected]
Introduction: Poor interfacial bonding between the fibers and resin matrix in fiber-reinforced composites (FRCs) is a significant drawback of the composites. To enhance the mechanical properties of FRC, fibers were modified by depositing SiO2 nanofilms via the atomic layer deposition (ALD) technique. This study aims to evaluate the effect of ALD treatment of the fibers on the mechanical properties of the FRCs.
Methods: The quartz fibers were modified by depositing different cycles (50, 100, 200, and 400) of SiO2 nanofilms via the ALD technique and FRCs were proposed from the modified fibers. The morphologies, surface characterizations of nanofilms, mechanical properties, and cytocompatibility of FRCs were systematically investigated. Moreover, the shear bond strength (SBS) of FRCs to human enamel was also evaluated.
Results: The SEM and SE results showed that the ALD-deposited SiO2 nanofilms have good conformality and homogeneity. According to the results of FTIR and TGA, SiO2 nanofilms and quartz fiber surfaces had good chemical combinations. Three-point bending tests with FRCs showed that the deposited SiO2 nanofilms effectively improved FRCs’ strength and Group D underwent 100 deposition cycles and had the highest flexural strength before and after aging. Furthermore, the strength of the FRCs demonstrated a crescendo-decrescendo tendency with SiO2 nanofilm thickness increasing. The SBS results also showed that Group D had outstanding performance. Moreover, the results of cytotoxicity experiments such as cck8, LDH and Elisa, etc., showed that the FRCs have good cytocompatibility.
Conclusion: Changing the number of ALD reaction cycles affects the mechanical properties of FRCs, which may be related to the stress relaxation and fracture between SiO2 nanofilm layers and the built-up internal stresses in the nanofilms. Eventually, the SiO2 nanofilms could enhance the FRCs’ mechanical properties and performance to enamel by improving the interfacial bonding strength, and have good cytocompatibility.
Keywords: atomic layer deposition, SiO2 nanofilms, surface modification, interfacial bonding
Graphical Abstract:

Introduction
Fiber-reinforced composite (FRC) is the most popular clinically used dental restorative material.1,2 It is commonly used for post-implant transitional restorations (crowns and bridges) and traumatic tooth fixation, as it meets patient functional and aesthetic requirements for dental restorations; moreover, it has the advantages of short chairside operation time, good patient experience, and less foreign body sensation.3 However, the rate of postoperative failure in clinical follow-up research remains considerably high.4,5 Ahmeda showed a Kaplan–Meier survival probability of 94.5% for FRC fixed partial denture, follow up periods ranged between 2 months and 8 years. FRC fracture and dislodgement occurred significantly more than other types of failures.6 Stress concentration occurs at the enamel/FRC interface. The stress transmitted to the FRC can be relieved by initiation of a crack and its propagation through the FRC, eventually leading to detachment and fracture.7 Tacken et al showed that when the FRC was used as an orthodontic retainer, FRC dislodgement and fracture remained the most common failure factors, accounting for 70% of all failures, after 24 months of follow-up.8
Therefore, it is crucial to enhance mechanical properties for improving the intraoral long-term service performance of FRC. As an organic/inorganic composite, the strength of the FRC depends not only on the strength of the fiber and resin complex but also on the strength of the interfacial bond between them. When the complex undergoes stress, a strong interface bond can effectively disperse stress and prevent crack propagation at the interface. The first structure to break down is the weakly bonded interface, which becomes the initiating point for composite failure, crack sprouting, and growth, ultimately leading to macroscopic material fracture and shed.9–11 Thus, modifications to increase the threshold for crack initiation and propagation within FRCs are essential. To improve the mechanical properties of organic/inorganic composite, it is crucial to increase the compatibility of the fiber–resin interface and enhance the chemical bond strength between them.
The FRC that is commonly used in clinical practice comprises quartz fibers and epoxy resin. Due to the high-temperature treatment and the encapsulation of various types of surface-wetting agents (mainly composed of organic substances) during the quartz fiber fabrication process, the number of reactive groups on the surface of quartz fibers is greatly reduced, which significantly reduces the reactivity of the fiber surface. Moreover, the quartz fibers and resin are not easily wettable due to the difference in modulus between them. This leads to insufficient interfacial bonding between the fibers and resin, and the mechanical properties of the complexes cannot fully meet the clinical requirements. Therefore, to obtain sufficient strength, the fibers are usually modified using physical (sandblasting, corona treatment, and plasma spraying) and chemical methods (silane coupling agent treatment, sol–gel treatment, and polymer grafting) to improve their surface affinity and wettability and obtain good interfacial bonding with resin.12–17 Bahramian et al introducing functional groups on the surface of the fibers by corona discharge to improve FRCs’ mechanical properties due to formation of good interfacial bonding between the fibers and resin. However, it was found that high corona energy may leading to the deformation and/or rupture of the fibers, thereby decreasing fiber strength and affecting the strength of the composite.13 The surface coatings formed by sol–gel treatment and polymer grafting have problems such as inhomogeneous grafting and demanding reaction conditions. Wang et al prepared silica sol (SS) to modify the quartz fibres, the SEM showed inhomogeneous grafting on fiber surface, which may leading to poor bonding of the substrate material with resin.18–20 Since dental FRCs are usually subject to hundreds of thousands of loading cycles of the masticatory system during use, the ideal compound should undergo sufficient stiffness and toughness maintenance as well as possess long-term fatigue resistance and service performance in wet environments, in order to resist cyclic mechanical loading of tens of thousands of cycles in the oral cavity.21 Therefore, the fiber surface should be modified such that it does not reduce the strength of the substrate material; furthermore, the material surface should be filled with a sufficient amount of reactive groups, thereby completing the chemical reaction between the fiber and silane coupling agent to form a good interfacial bond between the fiber and resin.
The diameter of quartz fiber monofilaments is only 6–8 µm, and each fiber bundle usually consists of 1000–2000 monofilaments; additionally, it is difficult to homogenize each quartz fiber surface using commonly used modification methods.22 The cardinal principle of ALD is to form a deposition film on the substrate by passing gas-phase precursors pulsed alternately into the reactor to adsorb and react chemically.23 Compared with other modification methods, such as sol-gel and vapor-phase hydrolysis, ALD has many advantages. First, it can significantly increase the number of active functional groups on the irregular surface via dense nanofilm deposition, which solves the problem of incomplete reaction due to irregular shapes.18,24 Second, the ALD temperature (150–300°C) is much lower than the high temperature involved in plasma spraying (2700–11,700°C), which does not damage the substrate but maintains its strength.25 Lastly, the ALD technique can be used to precisely control the thickness of the film at the nanometer level, and the deposited films are uniform and conformal.26 Therefore, this technique has become a focus of research by domestic and foreign scholars for enhancing the toughening of fibers, including organic fibers and natural silk proteins. Lee significantly improved the toughness of spider silk from 6 to 66 GPa by depositing TiO2 nanofilms on its surface using the ALD technique.27,28
Our previous study showed that SiO2 nanofilm deposition on the surface of ZrO2 using the ALD technique, with 3-dimethylaminosilane (TDMAS) and O3 as precursors, can significantly increase the number of reactive groups on the surface of ZrO2, which enhances the reaction between the surface of ZrO2 and the silane coupling agent. This modification improves the bonding strength of the interface between ZrO2 and resin, which increases the aging resistance of the composite. Furthermore, our previous study showed that the fatigue resistance of the material would decrease if the SiO2 nanofilm became too thick.29 This may be related to factors such as thermal and internal stress between the nanofilms.30
However, due to the specific of chewing movement, most researches on FRC primarily focus on the detection of their inherent performance but fail to simulate the failure modes of FRC in the oral cavity. In order to simulate the failure mode in vitro, we use human extracted anterior teeth with FRC bonded to enamel to determine the SBS of FRC. Therefore, in the present study, we aimed to regulate the thickness of SiO2 nanofilms deposited on quartz fibers by varying the number of ALD deposition cycles, investigate the effects of different ALD deposition cycles on the short- and long-term mechanical properties of FRC, and evaluate their cytotoxicity.
The null hypotheses in this experimental study were as follows:
Materials and Methods
Materials
High-strength fiberglass (diameter: 11 mm, Sinoma Technology Co., Ltd, China), resin matrix including bisphenol A-glycidyl methacrylate (Bis-GMA, AR, Sigma-Aldrich, City of Saint Louis, USA) and Methyl methacrylate (MMA; AR, Shanghai Titan Chemical Co., Ltd, China), a photoinitiator system including camphorquinone (CQ, Shanghai Chemical Technology Co., Ltd, China) and dimethylaminoethyl methacrylate (DMAEMA; AR, Shanghai Titan Chemical Co., Ltd, China), HCl (AR, Liyang Dongfang Chemical Reagent Co., Ltd, China), and 3-(trimethoxysilyl)propyl methacrylate (KH570, AR, Sigma-Aldrich, USA) were used without purification, chemically curing methyl methacrylate resin (New Century Dental, China), single bond universal (3M, America), dulbecco’s modified eagle medium (DMEM, KeyGEN BioTECH, China), Cell Counting Kit-8 (CCK-8; Beyotime Biotechnology Co., Ltd., Shanghai, China), LDH Assay Kit (Beyotime Biotechnology Co., Ltd., Shanghai, China), DCFH-DA (MedChemExpress, State of New Jersey, USA), Mouse IL-6 ELISA kit (Beyotime Biotechnology Co., Ltd., Shanghai, China), 4% paraformaldehyde (Biosharp, Anhui, China), phalloidine (APExBIO, Houston, USA), 4’,6-diamidino-2-phenylindole (DAPI; APExBIO, Houston, USA).
Preparation of Materials
Removal of the Infiltrating Agent of Fiberglass
The fiber volume content in the FRC was 60%.31 Due to the horizontal arrangement of fibers in FRCs, the sum of fiber areas on the cross-section also accounts for 60%. The quartz fiber used in the experiment was 195 tex. Each quartz fiber bundle was made of 53 strands. Six original yarns formed a combined yarn, and six combined yarns formed a fiber bundle. The diameter of a single filament was 7.7 µm, implying that the yarn had 1908 (6 × 6 × 53) filaments. Using the formulas below to calculate the number of fiber bundles of each FRC.


In formula (1), S is for cross-section area of monofilament, and d is for diameter of monofilament. Formula (2) dervices from formula (1), where x is for the sum number of all monofilaments in an FRC specimen. The n in formula (3) is for the number of fiber bundles. Hence, 27 bundles of quartz fibers were required for the preparation of each fiber resin complex specimen.
To fabricate FRCs, the quartz fibers were grouped into 27 bundles each, and each group was 10 cm long. The fiber specimens were placed in a vacuum drying oven, dried at 100°C for 24 h, and then removed and heated in an acetone solution at 50°C for 5 h. The fiber specimens were removed and washed with deionized water three times, for 5 min per time. The washed fiber specimens were placed again in a vacuum drying oven and dried at 100°C for 24 h. Thereafter, the wetting agent was removed from the quartz fibers.
Deposition of SiO2 Nanofilms via ALD on the Fiberglass Surface
The fiber specimens with wetting agent removed were randomly divided into six groups (Table 1), and the specimens of groups C–F were placed in the reaction chamber of the ALD equipment (MNT-S100OZ-L3S1, Jiangsu Mainadeweina Technology Co., Ltd., China), for SiO2 nanofilm deposition. The ALD reaction process was performed according to Scheme 1. First, 20 cycles of O3 (500 ms, 200°C) were passed on the quartz fiber surface to further activate it. The first precursor TDMAS (250 ms, 200°C) was then introduced to the reaction chamber to react with the -OH group on the SiO2 fiber surface to form an intermediate layer (-SiHN(CH3)2 or -SiHN=CH2). After 5 s, N2 (20 s, 20sccm) was passed to purge the reaction by-product (NH(CH3)2). After waiting for another 5 s, the second precursor O3 (500 ms, 50sccm, 200°C) was passed to continue the reaction with the intermediate layer to form SiO2. Finally, N2 (25 s, 20sccm) was passed again to purge the by-products of the reaction (NH(CH3)2). The base pressure of the reactor was 30 Pa. The quartz fibers of groups C–F were deposited with 50,100, 200 and 400 reaction cycles of SiO2, respectively.
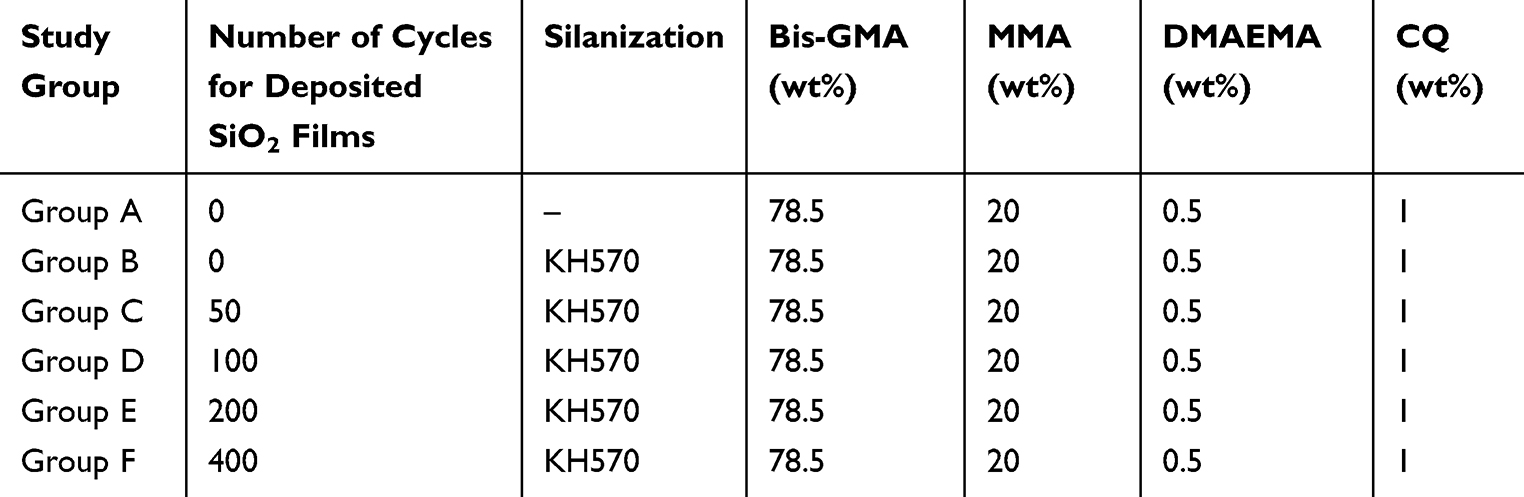 |
Table 1 Composition of Various Experimental Groups (n = 45 for Each Group) |
Scanning Electron Microscopy (SEM)
Several fiber specimens were randomly selected from each group of fibers with wetting agents, group A (fibers with wetting agent removed), and groups C–F (fibers with different thicknesses of SiO2 nanofilms). Moreover, SEM (MAIA3-TESCAN, Chech) was used to observe the surface microscopic morphology of the fiber specimens.
Spectroscopic Ellipsometry (SE)
Since the thickness of the irregular surface could not be measured using SE, SiO2 nanofilms were deposited on silicon wafers via 50, 100, 200, and 400 cycles, according to the fiber deposition process. The film thickness was measured using SE (M-2000v, J A Woollam, USA) at an incidence angle of 65° and the wavelength region from 200 to 2000 nm to indirectly reflect the thickness of SiO2 nanofilms.32,33
Silanization Treatment
The fiber specimens of groups B–F were placed in a beaker, and 1000 mL of cyclohexane, 0.4 g of propylamine, and 1 g of KH570 were added. After stirring magnetically for 30 min at room temperature, the solution was heated in a water bath at 65°C for 90 min. The solution was shaken every 15 min. The specimens were removed from the beaker and placed in a vacuum drying oven at 60°C for 24 h, dried under vacuum at 95°C for 2 h, and dried under vacuum at 85°C for 18 h to complete the silylation of the fibers.
Static Water Contact Angle (WCA) Measurements
Several fiber bundles from groups A–F were randomly selected. To form a uniform surface, all the fibers were laid on a glass slide; the specimen was flattened with another glass slide, and the slides were fixed on each end with glue. Subsequently, the WCA of the fiber surfaces was tested using a contact angle meter (Dataphysics OCA20, Germany).
Fourier Transform Infrared Spectroscopy (FTIR)
Several fibers from groups A–B and C–F, which did not undergo silanization, were randomly selected, and the fiber surface functional groups were examined by FTIR (iS Nicolet, USA). The FT-IR spectroscopy was performed in the range of 4000 to 600 cm−1 with 30 accumulations at 2 cm−1 resolution.
Thermogravimetric Analyses (TGA)
The experiments were conducted using a thermogravimetric analyzer (TA Instruments, USA). Several fiber bundles from groups B–F were randomly selected, and 5 mg of fiber was cut from each bundle. The bundles were placed in a reactor, and the temperature was increased from 0°C to 800°C at a rate of 10°C/min. The weight changes of the quartz fiber specimens were recorded as a function of temperature.
Fabrication of FRC
Bis-GMA (78.5 wt%), MMA (20 wt%), DMAEMA (0.5 wt%), and CQ (1 wt%) were weighed in proportion and stirred for 1 h at a constant temperature of 40°C on a magnetic stirrer to obtain liquid resin. Group A–F fibers were soaked in liquid resin for 4 h without light. The size of the FRC mold was 25 × 2 × 2 mm according to the ISO 10477:92 standard.31 To obtain FRCs, the fibers were straightened and shaped in the mold and cured at both ends and at the center for 60s using a light-curing lamp. Subsequently, the FRCs were stored at room temperature and protected from light for 2 weeks before use.Table 1 Composition of various experimental groups (n = 20 for each group).
Measurement of FS Before and After Aging
A three-point bending test was conducted according to the ISO 10477:92 standard.31 Half of the FRC specimens (n = 10) were aged for 50,000 cycles using thermal cycler, and experimental settings were the same as the SBS testing. The FRCs with (n = 10) and without aging (n = 10) were placed on the loading table of the universal material testing machine and subjected to a three-point bending load test at a span of 20 mm. The diameter of the loading head was 2 mm, and the loading speed was maintained at 1 mm/min until the specimens were cracked. The microcomputer recorded the FS values of specimens before and after aging. The following formula was used to calculate the bending strength:

In formula (4), F, L, B, and H represent the FS, maximum load, specimen span, specimen width, and specimen thickness, respectively.
Finally, the fractured experimental specimens were examined under SEM to observe the microstructures of the fractured surfaces as well as the cross-sectional and longitudinal sections.
For each group of specimens, the measured FS values were arranged in increasing order and assigned the labels i = 1, 2, 3, …, 10. Weibull analysis described the failure probability (Pf) as follows:

where σf, σθ, and m are the FS, scale parameter, and Weibull coefficient, respectively. The probability of failure was estimated as follows:

The following equation (7) was linearly transformed from the aforementioned equation using the least-squares method:

Measurement of SBS Before and After Aging
120 freshly sound human anterior teeth were isolated from the healthy patients which were extracted during the normal clinical treatment at the affiliated hospital of Stomatology, Nanjing Medical University. Informed consents were signed with the approval of the Ethics Committee of the affiliated hospital of Stomatology, Nanjing Medical University (permit number: PJ2023-074-001). All research studies have been performed in accordance with the principles stated in the Declaration of Helsinki. Teeth were cleaned and divided into 6 groups randomly, each group has 20 teeth.
Chemically curing methyl methacrylate resin was used to embed those teeth in PVC plastic pipes. On the labial surface of each tooth, a 2 × 2 mm sized standardized bonding area was isolated by medical adhesive tape. Firstly, 37.5% phosphoric acid was etched on enamel for 15s, rinse thoroughly with water, and then air dried for 5 s. Secondly, the dental adhesive was applied to the etched area repeatedly for 20s, gently blowed for 5s, and light cured for 10s. Finally, placed the composite resin on the standardized bonding area and a 2 × 2 mm sized segment of uncured fiber reinforcing composition was put horizontally on it, then light cured for 20s. The processed sample is showed in (Figure 1A and B), and specific operation process is shown in Figure S1.
 |
Figure 1 (A and B) are schematic diagram of the standard specimen; (C) schematic diagram of shear bond strength test. |
Half of the specimens (n = 10) were aged for 50,000 cycles using thermal cycler (XODC-800-II, Nanjing Xianou Instrument Manufacturing Co., Ltd., China). In each thermocycle, specimens were maintained in cold (5°C) and hot (55°C) tanks for 30s. The specimens with (n = 10) and without aging (n = 10) were placed on the loading table of the universal material testing machine. The shear load was applied parallelly and as close as possible to the interface between the enamel and adhesive resin (Figure 1C). The loading speed is 1 mm/min until failure occurred.
The stereomicroscopy (SMZ1000, Nikon, Japan) was used to evaluate the failure modes (10× magnification). The failure modes were divided into four types: ① adhesive failure between enamel and composite, ② cohesive failure within enamel, ③ cohesive failure within FRC, or ④ mixed failure if adhesive and cohesive fractures occurred simultaneously.11
Sorption and Solubility Test
Five FRC specimens were randomly selected from the group with the highest mechanical properties; the specimens were cleaned and dried in a drying oven for 24 h. Subsequently, each specimen was weighed (M1) and then immersed in artificial saliva (AS) at 37°C. At intervals of 1, 2, 3, and 4 weeks, the specimens were removed, wiped to remove excess liquid, weighed (M2), and immersed again in AS. After 4 weeks, each specimen was removed and dried again in the drying oven for 24 h. The weight of each specimen after the final drying (M3) was recorded. The absorbency (Wsp) was defined as the percentage increase in weight (M2-M1) with respect to the initial weight (M1) after immersion, whereas the solubility (Wsl) was defined as the percentage decrease in weight (M1-M3) with respect to the initial weight (M1) after immersion and drying. The actual value of absorbed water (AW) of FRC was defined as the sum of the absorbency and solubility. The equations (8) - (10) were used to calculate the abovementioned parameters:


Cell Viability Assays
Preparation of Eluted Specimens
In this experiment, the group with the highest mechanical properties was chosen as the experimental group. The FRC specimens were cleaned by ultrasonication in anhydrous ethanol for 5 min and then in deionized water for 10 min. The washing steps were repeated three times, after which the specimens were autoclaved. The sterile specimens were immersed in DMEM at the extraction ratio of 3 cm2/mL and incubated at 37°C with 5% CO2 for 1, 3, 5, and 7 days for subsequent cytotoxicity testing.34
CCK-8 Assay
CCK-8 assay was used to detect the cytotoxicity of the FRC specimens. Mouse fibroblast cells (L929 cells, American Type Culture Collection, America) were cultured in DMEM at 37°C and 5% CO2 until they reached the logarithmic growth phase. The medium was then discarded, and cells were seeded in 96-well plates at a density of 2000 cells/well and incubated at 37°C and 5% CO2 for 24 h. After the cells fully adhered to the plate walls, specimens eluted for 1, 3, 5, and 7 days were added to the plates. Specimens in the control group were incubated with DMEM only. After co-culture for 24 h, the CCK-8 solution was added to each well and incubated without light for 1 h. The optical density (OD) of each well at 450 nm was measured using an enzyme-labeled instrument (SpectraMax M2/M2e, Molecular Devices, Silicon Valley, USA).
LDH Assay
This experiment was conducted based on the principle of LDH release into the culture medium, and the cell membrane integrity was detected using an LDH assay kit. The experimental group was the same as that in the CCK-8 experiment. Moreover, a control group with maximum enzyme activity was added. The L929 cells were incubated with eluted specimens having different soaking times at 37°C and 5% CO2 for 24 h. Furthermore, 20 µL of lysis solution was added to the wells in the control group 1 h before measurements. Finally, 120 µL of supernatant and 60 µL of LDH assay working solution were added to each well, followed by incubation for 30 min at room temperature and without light. The OD of each well at 490 nm was measured.
Measurement of Reactive Oxygen Species (ROS) Levels
To further investigate the toxicity of eluted FRCs, DCFH-DA, an ROS probe, was used to quantify intracellular ROS levels. Cell inoculation and addition of eluted specimens were performed using the same methods as in the CCK-8 experiment. After incubation with eluted specimens for 24 h, DCFH-DA was added to each well under light-proof conditions and incubated at 37°C in a 5% CO2 incubator. After 2 h, the cells were washed three times with PBS, and the fluorescence intensity (FI) was measured at ex/em = 480/530 nm using an enzyme marker. Some cells were placed under an inverted fluorescence microscope (Leica, Germany) and intracellular fluorescence was observed with the same exposure time and gain value.
Cytokine Detection
To investigate whether the eluted specimens can induce an inflammatory response in the cells, cytokine assays were performed on the cells, which were grouped as described in the CCK-8 experiment. L929 cell supernatant was obtained after co-culture with the eluted specimens for 24 h. Fibroblast cytokine levels were measured using a Mouse IL-6 ELISA kit. Anti-IL-6-monoclonal antibodies were added to each well of the ELISA plate and incubated for 2 h. Thereafter, IL-6 specimens were conjugated with biotin, added to the wells, and kept at room temperature for 1 h. The specimens were rinsed thoroughly with the washing solution, and horseradish peroxidase was added; the specimens were then incubated for 20 min at room temperature without light. Finally, the chromogenic TMB (3,3’, 5.5;-tetramethylbenzidine) solution was added, and the absorbances of each well were read at 450 nm on an enzyme marker.
Fluorescence Confocal Imaging
To examine the morphology of the cells, L929 cells cultured with different eluted specimens were observed using laser confocal microscopy, and the cells were grouped as described in the CCK-8 experiment. Moreover, the cells were made to grow onto the cell climbing sheets before the experiment. Subsequently, the cells were incubated using the same procedure as in the CCK-8 experiment. After 24 h, the cells were fixed with 4% paraformaldehyde and treated with 5% Triton X-100 for 5 min. The specimens were incubated in phalloidin solution for 30 min and then stained with DAPI for 30s. Laser scanning confocal microscopy (LSCM; Leica, Germany) was used to obtain the confocal images of the cells.
Statistical Analysis
Data were presented as the mean ± standard deviation. Experiments were conducted separately at least three times. Means were analyzed by one-way analysis of variance (ANOVA). p-values less than 0.05 were considered significant.
Results
SEM
SEM was used to observe the surface characteristics of the quartz fibers that underwent different surface treatments. The surface of the fiber with the surface wetting agent (Figure 2A) shows the adhesion. After removing the wetting agent (Figure 2B), the fiber surfaces were smoother, with no obvious structural defects. Figure 2C–F show the surface morphology of group C–F fibers. With the increase in the number of ALD reaction cycles, the fiber surfaces became smooth and continuous, without obvious structural defects.
 |
Figure 2 Representative SEM photomicrographs of the fiberglass (×2000). (A) fiberglass with wetting agent (fiber surface wetting agents are shown in the frame). (B) fiberglass without wetting agent. (C) fiberglass with SiO2 nanofilms deposited via 50 ALD cycles. (D) fiberglass with SiO2 nanofilms deposited via 100 ALD cycles. (E) fiberglass with SiO2 nanofilms deposited via 200 ALD cycles. (F) fiberglass with SiO2 nanofilms deposited via 400 ALD cycles. |
SE
The thicknesses of ALD-deposited SiO2 nanofilms in groups C (50 cycles), D (100 cycles), E (200 cycles), and F fibers (400 cycles) were 3.1, 9.5, 14.8, and 24.6 nm, respectively. The film thickness was found to increase linearly with the number of ALD cycles, and the deposition rate was approximately 0.059 nm/cycle (Figure S2).
FTIR Analysis
Since the first-order derivative infrared (IR) spectra of quartz fibers and SiO2 nanofilms are almost identical, it is difficult to identify quartz fibers and SiO2 nanofilms with ordinary IR spectrograms. Thus, we subjected FTIR spectrograms to smoothing, baseline correction, normalization, and second-order derivative to increase the resolution. The second-order derivative spectra in FTIR are shown in Figure 3. Groups C–F represent the quartz fibers that have not been silanized after SiO2 nanofilm deposition. The characteristic absorption peaks of Si-O-Si bond were detected on the surfaces of fibers in groups A (1102.12 cm−1 and 990.27 cm−1) and B (1102.12 cm−1), which represented the SiO2 nanofilms on quartz fiber surfaces, whereas the characteristic absorption peaks of Si-O-Si bond of group B fibers were shifted to 982 cm−1 due to silanization. Moreover, the peak intensity of group C–F fibers at 990.27 cm−1 (Si-O-Si bond on the fiber surface) decreased, whereas the relative intensity of the Si-O-Si bond absorption peaks (1121.44 cm−1 and 956.52 cm−1) continued to increase, indicating characteristic absorption peaks of SiO2 nanofilms; furthermore, the subpeak of SiO2 plating was 981 cm−1.
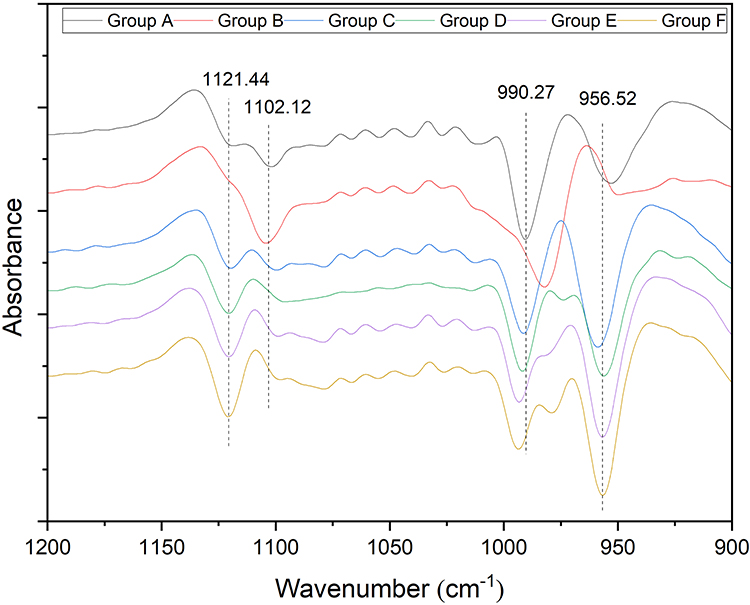 |
Figure 3 Fourier transform infrared spectra of six groups of fiberglass with different treatments. |
WCA
The WCA, which is defined as the angle at which the water–vapor interface intersects with the solid surface, can be used as a measurement value to indicate the wetting phenomenon. When the WCA is less than 90°, wetting occurs. When the WCA is greater than 90°, the surface is unwettable.
Figure 4 shows that only the unsilanized group A fibers had a WCA less than 90°, which means only the group A fiber surface exhibited hydrophilicity. The hydrophilicity of the surface of SiO2 is due to the formation of hydrogen bonds between silanol groups and water molecules.35 However, group B–F fibers showed hydrophobic organic groups (vinyl, amino, epoxy, mercapto groups, etc.) on the surface after silylation; thus, all group B–F fibers exhibited hydrophobicity (WCA > 90°), and group C–F fibers with surface modification showed better hydrophobicity than group B fibers (P < 0.05).
 |
Figure 4 Water contact angle image of group A–F fiber wettability. Bars denote the mean contact angle, and the whiskers indicate the standard deviation. Inside the bars, the mean contact angle is mentioned with the standard deviation in parentheses. Means indicated by the same lowercase letter are not significantly different (P < 0.05). a<0.0001; b, c<0.005. |
TGA
Figure 5 shows the TGA results. As the temperature increased, the quartz fibers underwent different degrees of weight loss. This result reflects the grafting rate of SiO2 on the surface of the quartz fibers and the stability of the bonding energy between resin and the fibers. The weight loss that occurred between 200°C and 350°C for each group of fibers involved a small amount of organic wetting agent remaining on the quartz fiber surface.36,37 In the 350–550°C temperature range, weight loss occurred in group B–F fibers after the removal of the wetting agent. The weight loss involved the silane bond generated via the reaction of the silane coupling agent, which was broken at high temperatures.31 The weight losses of group B–F fibers that occurred in the 350–550°C temperature range were 0.40%, 0.59%, 0.68%, 0.73%, and 0.72%, respectively.
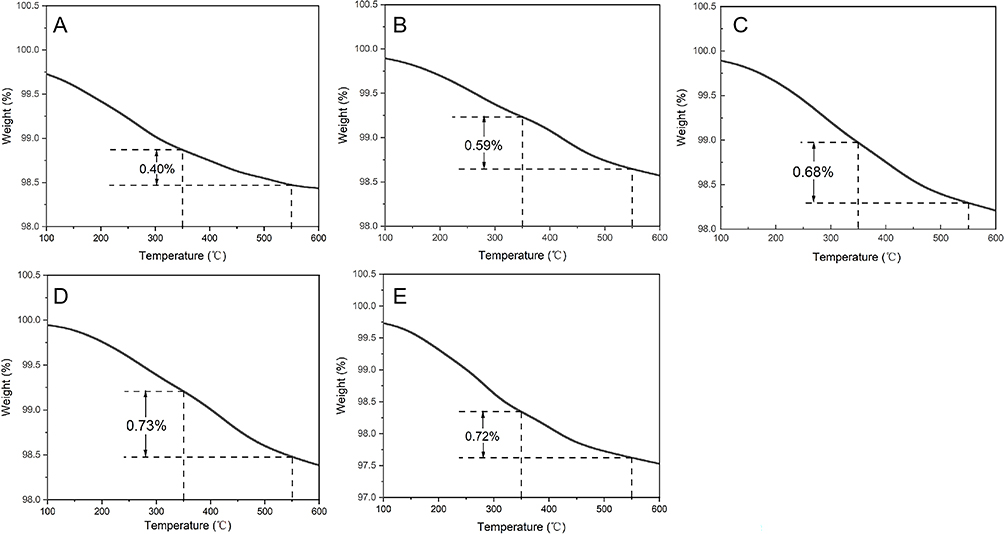 |
Figure 5 TG thermograms of group six groups of fiberglass with different treatment. (A) group B, (B) group C, (C) group D, (D) group E, (E) group F. |
FS of FRCs
Before aging, the bending strength of group A fibers, which did not undergo silanization, was lowest compared with those of the six groups of fibers (P < 0.05) (Table 2). The bending strength of group B fibers, which was silanized, was greater than that of group A fibers, but smaller than those of group C–F fibers, which underwent surface modification. Regarding the bending strengths of the groups of fibers with ALD-deposited SiO2 nanofilms, group C–D fibers showed an increasing trend, whereas group D–F fibers showed a decreasing trend. There is no significant difference between Group F with Group C or Group E (P > 0.05). Furthermore, group D fibers had the highest bending strength (P < 0.05), and group C–F fibers did not show a monotonic increase in bending strength with increasing cycle number (Figure 6).
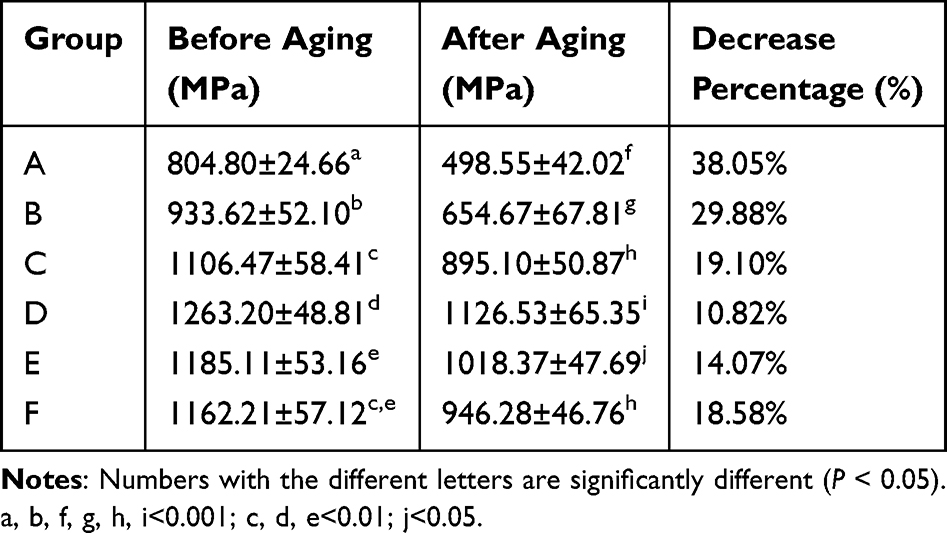 |
Table 2 Flexural Strength of FRC Obtained Before (n = 10) and After (n = 10) 50,000 Thermocycles |
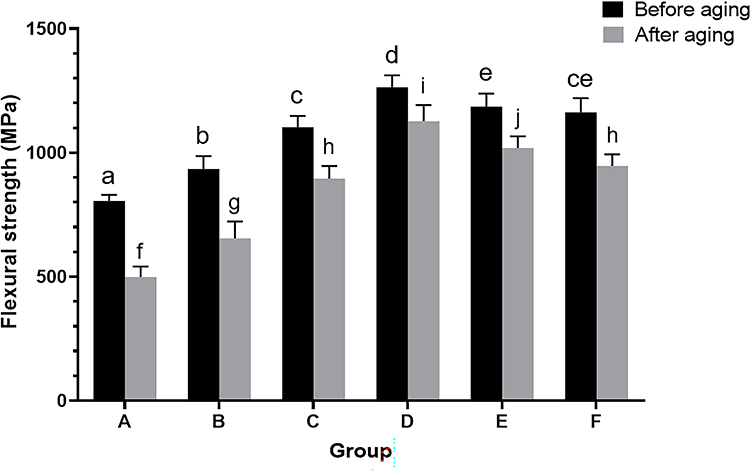 |
Figure 6 Flexural strength of fiber-reinforced composite before and after aging. The bar chart represents different flexural strengths of group A–F fibers before and after aging. Means indicated by different lowercase letters are significantly different (P < 0.05). a, b, f, g, h, i<0.001; c, d, e<0.01; j<0.05. |
After the aging experiments, the bending strength of fibers in all groups decreased by different degrees (P < 0.05). The bending strength of group A fibers without silanization decreased by 38.05%, followed by group B fibers with no SiO2 nanofilms, in which the bending strength decreased by 29.88% before and after aging (Table 2). The trend of bending strengths of group C–F fibers did not change after aging. Hence, the bending strength of group D fibers remained the highest after aging (P < 0.05), while Group C and Group F still did not have significant difference (P > 0.05). Moreover, the decrease in bending strength in group D fibers (10.82%) was the smallest compared with those of the other five groups of fibers.
Figure 7 shows the Weibull distribution plots of FRCs in each group. A higher Weibull modulus indicated a smaller error range and a greater structural reliability of the material. Among several groups of FRC specimens made of fibers deposited with SiO2 nanofilms, the Weibull modulus was highest in group D fibers before aging, suggesting that group D fibers were more reliable and had higher structural integrity compared with fibers from the other groups.38,39
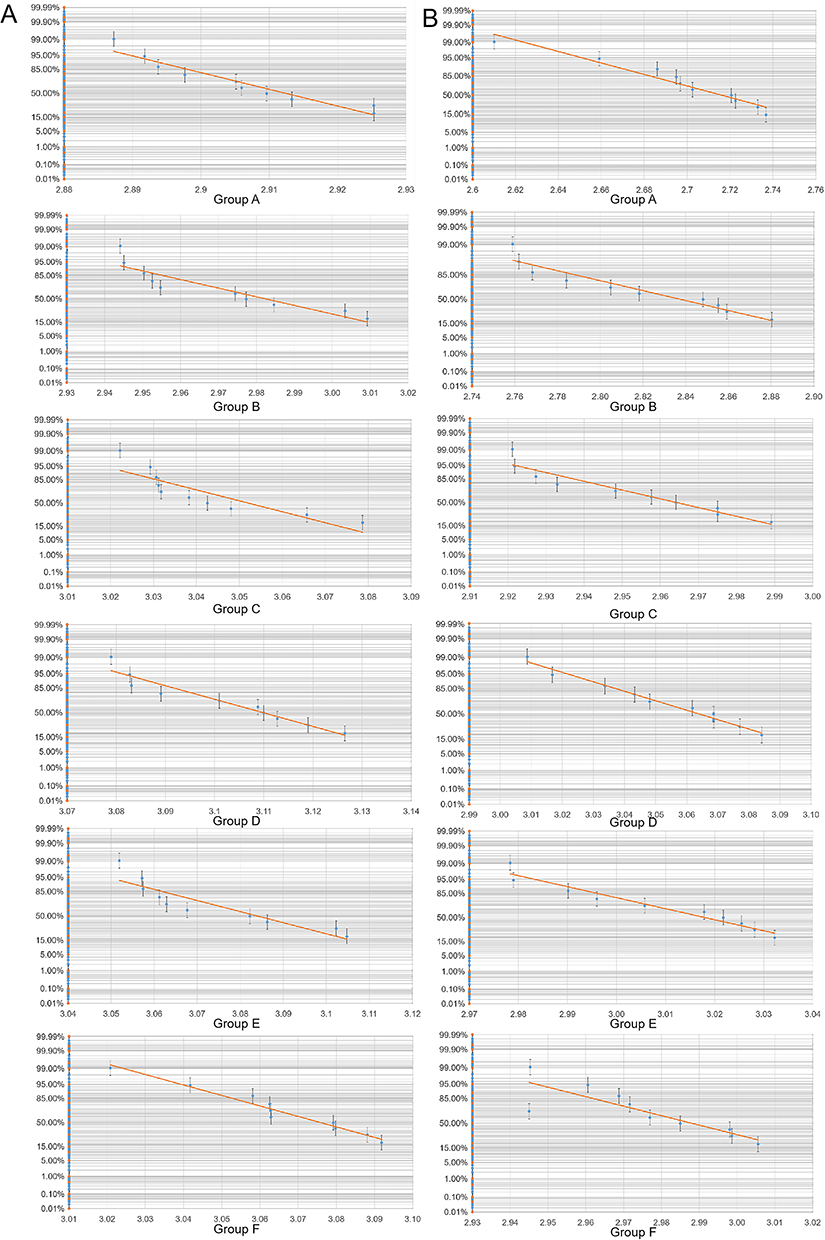 |
Figure 7 Weibull distribution plots for the flexural strength of the fiber-reinforced composite (FRC). (A) flexural strength of the FRC before aging. (B) flexural strength of the FRC after aging. |
Figure 8A1–F1 shows the SEM images of group A–F specimens after three-point bending in the fracture surface. The surfaces of group A fibers had almost no resin residue. Only a small amount of resin residues were found on a cross-section of group B fibers. Flakes of resin residues were found on the surface of group C fibers with ALD-deposited SiO2 nanofilms, and resin lumps were observed on the surfaces of group D–F fibers.
 |
Figure 8 (A1–F1): The fracture surface of fiber-reinforced composite made of group (A–F) fibers after three-point bending (×5000); (A2–F2): Representative SEM results (longitudinal views) of the fiber-reinforced composite made of group (A–F) fibers (×2000); (A3–F3): Representative scanning electron photomicrographs (cross-sectional views) of the fiber-reinforced composite made of group (A–F) fibers (×5000). |
Figure 8A2–F2 and A3–F3 show the longitudinal and cross-sectional SEM images of the FRC specimens prepared with group A–F fibers. As shown in Figure 8A2–F2, the fibers in each group were closely arranged and uniformly distributed in resin. There were some gaps at the interface between resin and group A–B quartz fibers; however, in group C–F fibers, there were no obvious gaps, and the bonding between quartz fibers and resin was stronger. A longitudinal section of group D fibers showed that resin wrapped the fibers closely, with no obvious boundary between them. A cross-section of group A–B fibers demonstrated a separation of resin from the fibers, with many obvious gaps between them. The gaps between resin and group C–F fibers were smaller than those between resin and group A and B fibers. In group D, resin tightly wrapped the fibers, whereas there were a few narrow gaps between resin and group C, E, and F fibers.
SBS of FRCs
The results of SBS are shown in Table 3 and Figure 9. Under shear load created a pealing of the glass fibers from their Bis-GMA bed, thereby decreases the SBS between FRC and the enamel.7 The SBS of group B, which undergoes silanization, was only greater than group A (P < 0.05). Among the group C–F, whose fibers underwent surface modification, groups D and E had greater SBS than others before and after aging (P < 0.05). Moreover, the decrease in SBS in groups D (8.47%) and E (9.63%) was the smallest compared with those of the other four groups. However, there are no statistical differences between groups D and E (P > 0.05).
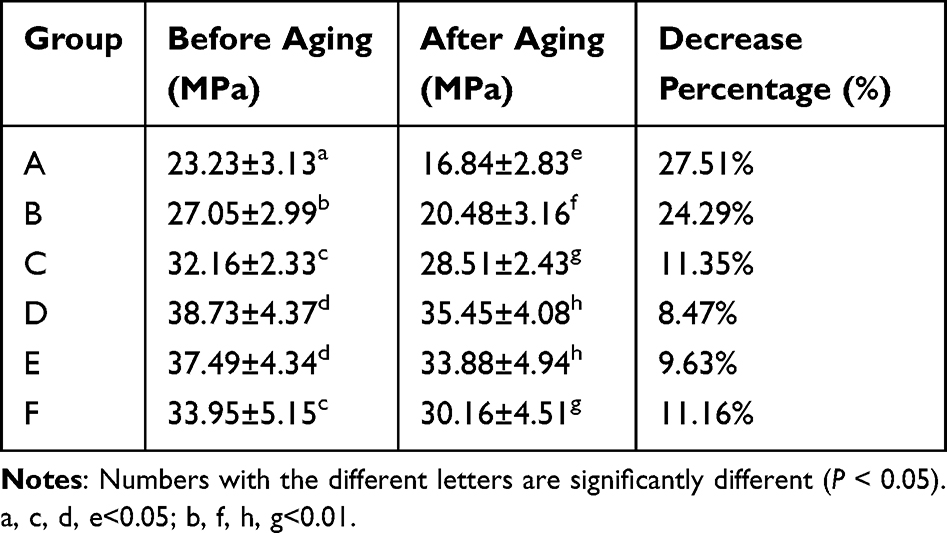 |
Table 3 SBS of FRCs Obtained Before (n = 10) and After (n = 10) 50,000 Thermocycles for Each Group |
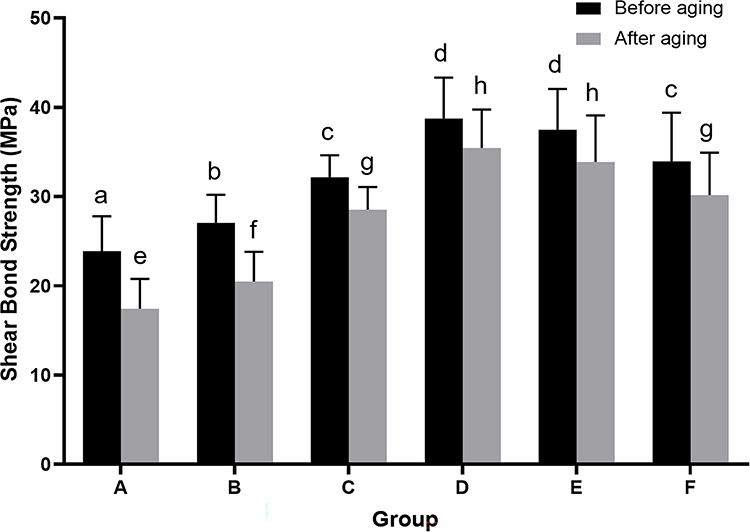 |
Figure 9 The SBS of FRC before and after aging. The bar chart represent different flexural strength of group A–F before and after aging. Means with the different letters are significantly different (P < 0.05). a, c, d, e<0.05; b, f, h, g<0.01. |
Figure 10 and Table S1 show the results of failure modes. In the present study, adhesive and mixed failures were the most common fracture modes. The proportion of cohesive failure in FRC is the highest in group A (60%) before aging, and the proportion increases to 90% after aging. After silanization treatment, the proportion of cohesive failure in FRC of group B (20%) decreases compared to group A. The group C-F underwent modification exhibits a further decrease in the proportion of cohesive failure in FRC (10%, 0%, 0%, 10% respectively). However, the proportion of cohesive failure in FRC of group C, E, and F increases after aging (30%, 10%, and 20% respectively), while group D remains at 0%. Figure 11 displays the SEM results of the 6 groups of FRC after cohesive failure. It can be observed that in group A, the resin extensively delaminates from the fiber–matrix interface, while in group B, numerous voids are visible at the interface. In the C-F group, a tighter bond is observed between the resin matrix and the fiber interface. In particular, the resin stripping only occurred on the surface portion in Group D.
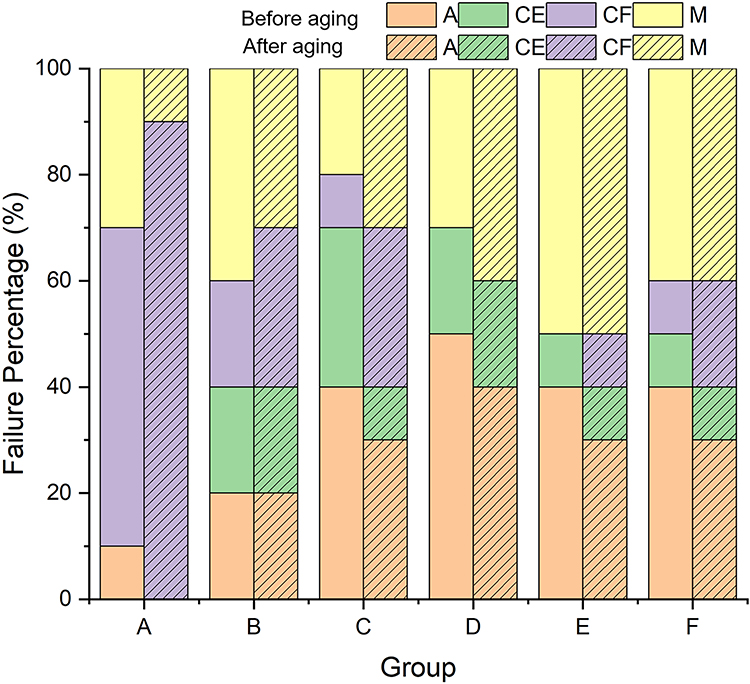 |
Figure 10 Failure pattern distribution of different groups tested (A: adhesive failure; CE: cohesive failure within enamel; CF: cohesive failure within FRC; M: mixed failure). |
 |
Figure 11 (A-F) Representative SEM photomicrographs of cohesive failure in FRC of 6 groups. (1000×). |
Sorption and Solubility Study in AS
In this experiment, group D specimens (n = 5) had the greatest mechanical properties were chosen for solubility and adsorption studies. The specimens immersed in AS underwent two reactions leading to weight change: water uptake and a dissolution of unreacted monomers and oligomers. An increase in specimen weight resulted from water uptake by the specimens, whereas a decrease in specimen dry weight was induced by a dissolution of monomers and oligomers. WS is the actual FRC water uptake, considering the dissolved monomers. There was no significant change in specimen weight with increase in specimen soaking time in AS (P < 0.05) (Figure 12). After 4 weeks of immersion in AS, the WS of the specimens was 1.4 wt%, indicating a considerably small change in FRC weight during the immersion process. This result reflects the adequate stability of the FRC in the oral cavity, which corroborated with the findings of Wang.40
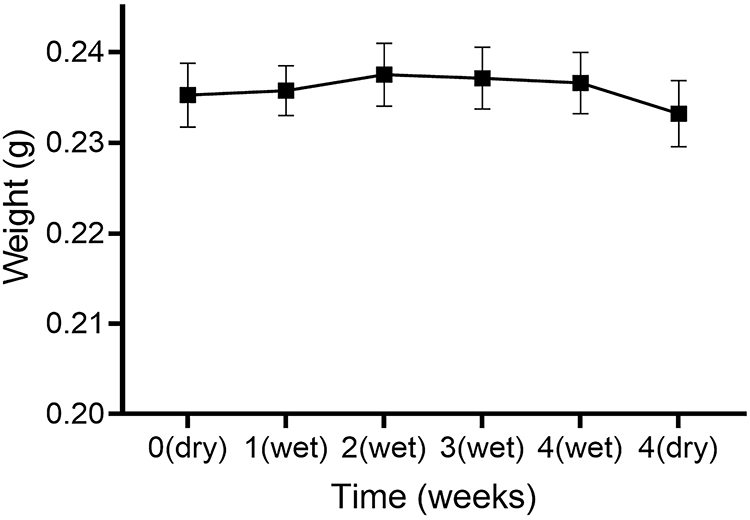 |
Figure 12 Weight change of the fiber-reinforced composite with the duration of soaking in artificial saliva. The use of “dry” and “wet” indicate that the specimens were tested after and before desiccation, respectively. |
Cellular Cytotoxicity
The group D specimens were chosen to be the experimental group as they had both the greatest FS and SBS. In this experiment, L929 cells were co-cultured with eluted specimens having different soaking times, and the proliferation ability of L929 cells was detected using the CCK-8 assay method. There were no significant between-group differences in OD values after 24 h of co-culture with L929 cells of eluted specimens on days 1, 3, 5, and 7 (P > 0.05) (Figure 13A). This result also proves that the eluted group D specimens did not affect L929 cells.
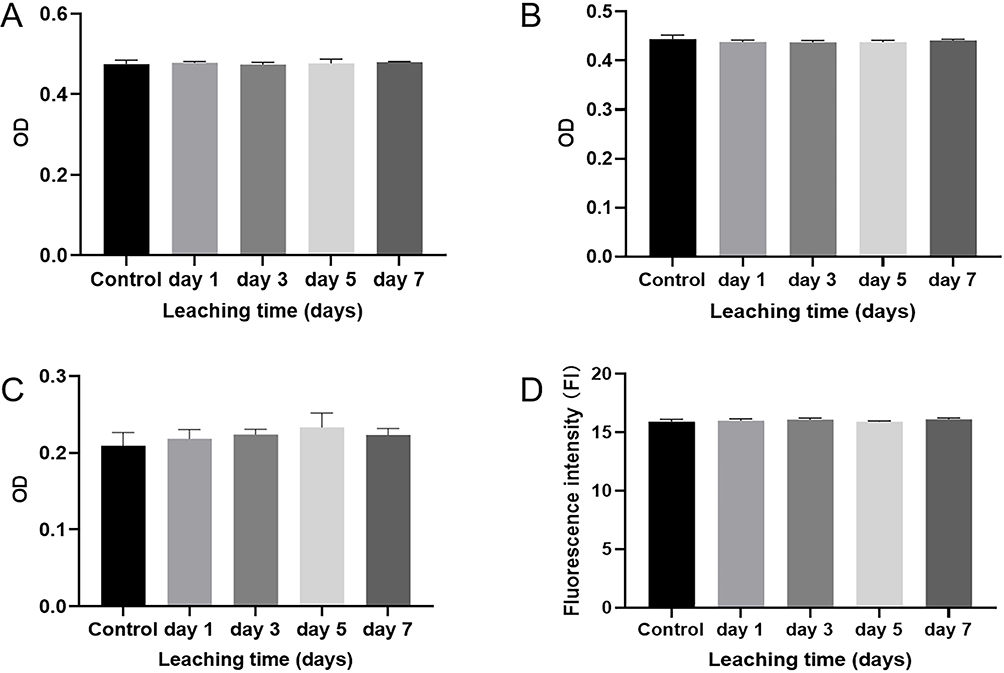 |
Figure 13 Cellular cytotoxicity at different concentrations for eluted group D specimens. (P > 0.05) (A) Cell counting kit-8, (B) lactate dehydrogenase, (C) Enzyme-linked immunosorbent assay, (D) Reactive oxygen species (ROS) fluorescence intensity. |
LDH, a cytoplasmic enzyme that is responsible for the conversion of pyruvate to lactate, is released from cells during cell membrane damage.41 The LDH assay results (Figure 13B) showed no significant between-group differences in OD values (P > 0.05). The results of this experiment confirmed that the eluted group D specimens had no damaging effect on L929 cell membranes.
IL-6, a pro-inflammatory cytokine, is released when cells are grown in the presence of an irritant.42 In this experiment, we measured IL-6 levels in L929 cell supernatant after co-culture with eluted specimens for 24 h (Figure 13C). ELISA analysis of the supernatant of cells exposed to different eluted specimens showed no significant increase in IL-6 levels in Group D fibers compared with control group fibers (P > 0.05).
ROS level reflects the intracellular oxidative stress state and is an important indicator of cell health. ROS can induce intracellular protein inactivation, lipid peroxidation, mitochondrial dysfunction, and ultimately apoptosis or necrosis.43 In this experiment, the ROS assay method was used to verify the biotoxicity of eluted FRC specimens on L929 cells; the FI results of cells are shown in Figure 13D. The specimens eluted for 1, 3, 5, and 7 days were co-cultured for 24 h, and there was no significant between-group difference in FI results (P > 0.05). The cells in each group were observed under an inverted fluorescence microscope, as shown in Figure 14. A small amount of green fluorescence was visible in the control group (Figure 14A), due to the presence of a small amount of ROS in the normal cells. Compared with the blank group, there was no significant difference in the amount of green fluorescence in each experimental group (Figure 14B–F).
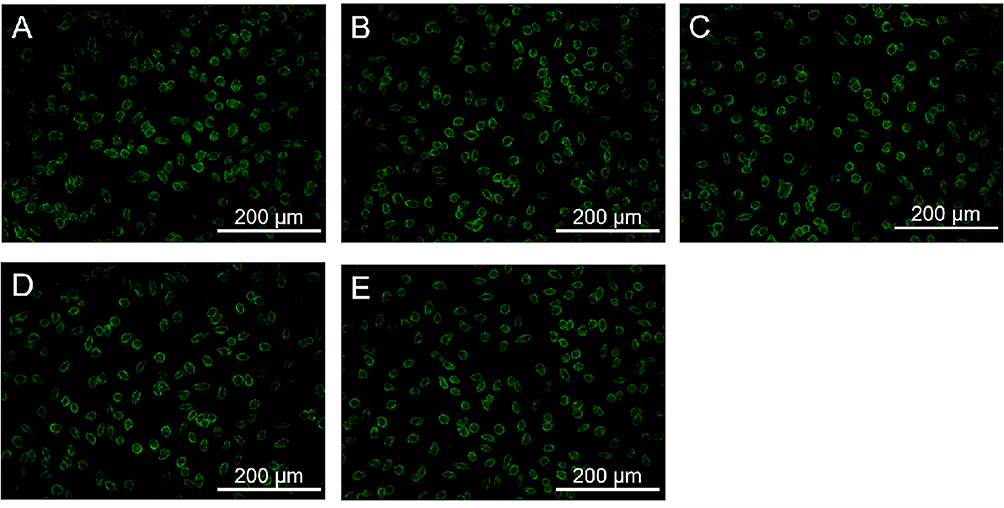 |
Figure 14 ROS fluorescence images of L929 co-culture with different concentrations of eluted group D fibers. (A) control group. (B) specimens eluted for 1 day. (C) specimens eluted for 3 days. (D) specimens eluted for 5 days. (E) specimens eluted for 7 days. |
Figure 15 shows the LSCM images of L929 cells incubated with eluted specimens for 24 h. The cells in both groups were in a good state and were sprawled on the surface of the specimens, implying a good cytocompatibility of the FRCs.
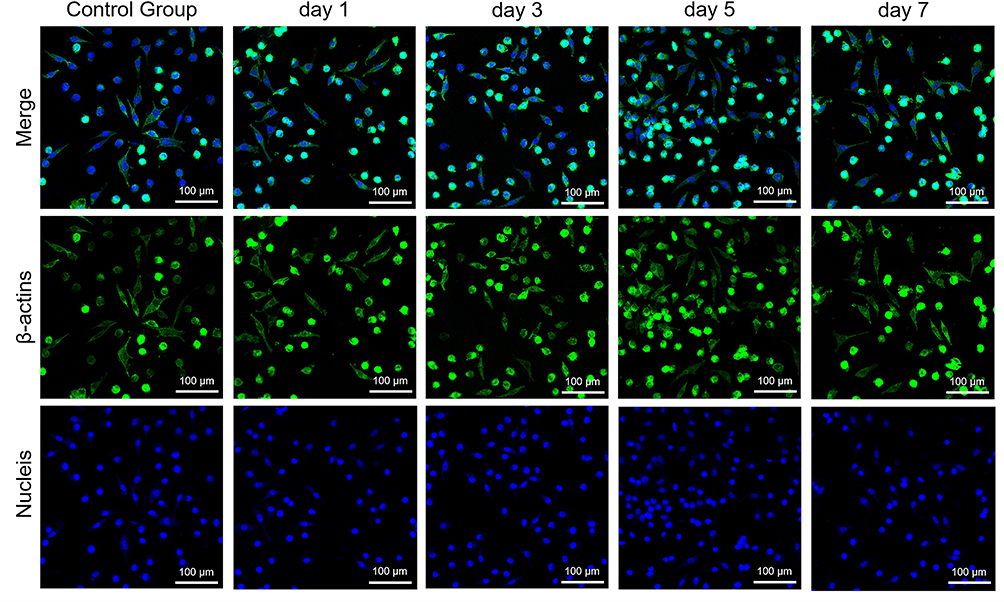 |
Figure 15 Laser scanning confocal microscopic images of L929 cells incubated with eluted group D specimens at different times (1, 3, 5, and 7 days) for 24 h. All images were taken under identical instrumental conditions and presented using the same intensity scale. |
Discussion
FRC is a multiphase material which incorporates reinforcing fibers to enhance its mechanical properties. Some researches showed that optimal reinforcement of FRC relies on an adequate interfacial bond between the two phases. This strong interface bonding ensures effective stress transfer between the fibers and the matrix and prevents interface failure mechanisms, such as shed and fracture.11 This experiment involved the use of ALD technology for SiO2 nanofilm deposition on quartz fiber surfaces to improve the interfacial bonding between quartz fibers and resin, thereby enhancing the strength and toughness of FRC and further strengthening its long service performance such as wear resistance as well as fracture and shedding prevention.
Figures 6 and 9 respectively depict the results of FS (three-point bending test) and SBS (SBS test) before and after aging of 6 groups. Group A fibers showed poor FS and SBS because they were not treated with silane coupling agent. The WCA results demonstrated that quartz fiber surfaces that underwent wetting agent removal were hydrophilic with poor wettability between the fibers and the hydrophobic resin; hence, the interfacial bond between group A fibers and resin was weakest, and the mechanical property of the FRC was poorest compared with those of the other fibers. In contrast, group B quartz fibers showed hydrophobic surfaces after treatment with the silane coupling agent (Figure 4); this hydrophobicity facilitated the adsorption of resin on the irregular fiber surface. In addition, an -OH group grafted to the fiber surface by the silane coupling agent formed a relatively strong Si-O bond with resin.16,44 Therefore, group B fibers were slightly stronger than group A fibers (P < 0.05), which is consistent with the findings of Jelena et al.7 The mechanical properties of group C–F fibers were generally better than those of group B fibers. On the one hand, the ALD-deposited SiO2 nanofilms increased the content of the -Si-OH, which enhanced the reaction between the silane coupling agent and the fiber, thereby improving the interfacial bonding strength between the fiber and resin. Moreover, SEM images showing transverse and longitudinal sections of the FRC revealed that ALD-modified fibers were more tightly bonded to resin. On the other hand, the nanoscale SiO2 films can fill the micron-scale defects on the fiber surface, which enhances the mechanical properties of the fiber.45 The results of failure modes show that FRC of group A has the highest percentage of cohesive failures in FRC both before and after aging (60% and 90% respectively). However, the proportion decreases in Group B, which further confirms that silanization can effectively enhance the interfacial bonding between the fibers and the resin.
ALD, a surface grafting technology, can be used to uniformly deposit substances on the surface of complex structures. The result of SEM shows that the surface of fibers with SiO2 nanofilms (group C–F fibers) is smooth and continuous, with no obvious defects compared with other modification methods such as sol-gel,12 and has no distinct changes in surface morphology from those of fibers before ALD (group A and B fibers). The damage to the substrate was minimal compared to the corona treatment.13 This may explain why ALD can achieve an adequate modification of the fiber surface, increase the number of surface reactive groups, and substantially improve the mechanical properties of FRC.27 FTIR analysis results confirmed Si-O-Si network formation on group C–F quartz fiber surfaces, by showing an increased intensity of the Si-O-Si absorption peak (1121.44 cm−1 and 956.52 cm−1), representing the SiO2 nanofilms, and the appearance of the subpeak of the SiO2 plating (981 cm−1). Furthermore, TGA results demonstrated that the relative weight of group C–F fibers decreased more than that of group B fibers, indicating that after depositing SiO2 nanofilms by ALD, the reactive groups on the fiber surface increased accordingly, which in turn enhanced the silylation process. The weight loss of group C fibers was lower than that of group D–F fibers, probably due to the incomplete surface deposition at the early stage of the ALD reaction.
The FS and SBS results show that the group C-F, which underwent ALD surface modification, exhibited a significant improvement in mechanical performance compared to groups A and B (P < 0.05). As strong interfacial bonding can effectively transmit the stress and prevent crack propagation through the FRCs. Weaker interfacial bond strength can result in adhesive failure, interface debonding, and crack formation, thereby impacting the mechanical properties. Therefore, we can infer that after surface modification, the interfacial adhesion strength between the fibers and resin matrix has been improved, thereby enhancing the SBS to the enamel and FS. This is beneficial for reducing the risk of FRC fracture and dislodgement. Moreover, the FS and SBS of Group D had an improvement of 56.96% and 66.72% compared with the unmodified Group A, it is a huge improvement compared with other ways of modification.12,13
However, theoretically, since ALD is a self-limiting saturation adsorption reaction, the number of surface –OH groups does not change with increase in the number of ALD reaction cycles. As the SiO2 nanofilm thickness increases, the mechanical properties of the FRC exhibit a crescendo-decrescendo tendency. Nevertheless, there are differences in the mechanical properties of group C–F fibers; since the external forces applied to the specimen are considerably high, the ALD-deposited film cannot withstand the tension and peel stresses, which leads to fractures between the film layers. The thinner the film, the easier it fractures.46 In addition, thicker coatings are associated with lower compressive stresses; thus, the stress relaxation process occurs as the coating grows,30 thereby weakening the properties of the deposited SiO2 nanofilms. As is shown in Figure 6, there is not any significant difference between Group C and Group F, although their underwent different number of ALD deposition cycles. We hypothesize that the 100 cycles of SiO2 nanofilm deposition (thickness of 9.5 nm) not only improve the bond strength but also provide a suitable buffer layer thickness during bond fracture induced by external forces. In contrast, higher thicknesses reduce the bond strength.
Zhang showed that compared with other modification methods, the thickness of ALD-deposited SiO2 nanofilms can be precisely controlled at the nanoscale, and the film thickness increases linearly with the number of ALD cycles.32,33 In the current study, SE findings also confirmed the abovementioned point. The thickness of the SiO2 nanofilms deposited at 200 °C demonstrated a linear relationship with a deposition rate of 0.059 ± 0.005 nm/cycle. This indicates that the number of ALD cycles can be precisely controlled to obtain the optimal nanofilm thickness for FRC strength enhancement.
FRC should have good aging resistance to withstand different oral environments. Thermal cycling is commonly used to test dental materials’ durability. As shown in Figures 6 and 9, generally, the mechanical properties of the specimens in each group degraded after aging. The mechanical property degradation of group A fibers was highest due to the difference in thermal expansion coefficients between the fibers and resin. This difference resulted in the occurrence of residual stress along the interface, which degraded the mechanical properties of the FRC.47 The mechanical properties of group B fibers also deteriorated due to the hydrolysis of the silane coupling agent at the fiber-resin bond interface. Nevertheless, the SBS and FS of group B fibers after aging remained higher than that of group A fibers due to the increased hydrophobicity of the fibers after the silane coupling agent treatment, which inhibits water diffusion into resin and improves the hydrolytic stability of FRC.40 The overall trend of the mechanical properties of the six groups of FRCs did not change before and after aging. Among the 6 groups, the reduction in SBS and FS of group D fibers was the lowest (8.47% and 10.82% respectively). Group D fibers had the highest mechanical properties both before and after aging. Regarding group C–F fibers, the decrease in mechanical properties after aging was related to the internal stresses accumulated in the SiO2 nanofilms, in addition to the hydrolysis of the silane coupling agent.48,49 Moisture can react with the strained Si-O bonds in the film to reset it to the minimum bond energy,30 thereby decreasing the bonding between the film layers as well as the interfacial bond strength between the fiber and resin.
The water adsorption of the FRC is related to the transformation achieved by the polymer and the nature of the network formed by the polymer.50 Excessive hygroscopicity degrades mechanical properties and decreases material resistance; the hydrolysis of chemical bonds produces similar effects, especially at the resin–fiber interface.51,52 The group D specimen, with the highest mechanical properties in this study, showed considerably little changes in moisture absorption (1.4 wt%), reflecting the good stability of the FRC.
In this study, the specimens were tested for biological toxicity via CCK-8 assay, LDH assay, ROS level measurement, and IL-6 detection. Only the eluted group D fibers were used for cytotoxicity experiments because they had the highest mechanical properties. The results showed that the eluted specimens neither affected cell proliferation nor damaged L929 cell membranes; moreover, the specimens did not stimulate the cells to produce ROS and IL-6, which are cytotoxic. In addition, the eluted specimens did not alter the cell morphology. Therefore, these experimental results indicated that the FRCs have an adequate biocompatibility, which provides a solid foundation for future clinical applications. However, the oral is a complex environment, and the in vitro experiments in this study cannot fully simulate the use of FRC. Further studies on the evaluation of their mechanical properties in the simulated oral environment are underway in our group with the aim of gaining a better understanding of this modified FRC.
Conclusion
(1) The mechanical properties of FRCs can be effectively improved by SiO2 nanofilm deposition on quartz fiber surfaces via ALD technology.
(2) Changing the number of ALD reaction cycles affects the mechanical properties of FRCs. The number of ALD reaction cycles increased with the thickness of SiO2 nanofilms on quartz fiber surfaces. However, the SBS and FS of the FRC do not exhibit a monotonic increasing trend with thickness. Instead, they reach optimal mechanical properties at a thickness of 9.5-nm-thick SiO2 nanofilms (after 100 cycles of deposition). This may be related to the stress relaxation and fracture between the films as well as the internal stresses accumulated in the films.
Ethics Approval and Informed Consent
Informed consents were signed with the approval of the Ethics Committee of the Affiliated Hospital of Stomatology, Nanjing Medical University (permit number: PJ2023-074-001). All research studies have been performed in accordance with the principles stated in the Declaration of Helsinki.
Acknowledgments
This work was supported by Jiangsu Province Capability Improvement Project through Science, Technology and Education-Jiangsu Provincial Research Hospital Cultivation Unit (YJXYYJSDW4), Jiangsu Provincial Medical Innovation Center (CXZX202227) and the National Natural Science Foundation of China [grant number 81701025].
Disclosure
The authors declare that they have no known competing financial interests or personal relationships that could have appeared to influence the work reported in this paper.
References
1. Al Amri MD, Kellesarian SV. Crestal bone loss around adjacent dental implants restored with splinted and nonsplinted fixed restorations: a systematic literature review. J Prosthodont. 2017;26(6):495–501. doi:10.1111/jopr.12556
2. Sobczak-Zagalska H, Emerich K. Best splinting methods in case of dental injury-A literature review. J Clin Pediatr Dent. 2020;44(2):71–78. doi:10.17796/1053-4625-44.2.1
3. Liu X, Zhang Y, Zhou Z, Ma S. Retrospective study of combined splinting restorations in the aesthetic zone of periodontal patients. Brit Dent J. 2016;220(5):241–247. doi:10.1038/sj.bdj.2016.178
4. Al Twal EQ, Chadwick RG. Fibre reinforcement of two temporary composite bridge materials—Effect upon flexural properties. J Dent. 2012;40(12):1044–1051. doi:10.1016/j.jdent.2012.08.012
5. Meiers JC, Freilich MA. Use of a prefabricated fiber-reinforced composite resin framework to provide a provisional fixed partial denture over an integrating implant: a clinical report. J Pros Thet Dent. 2006;95(1):14–18. doi:10.1016/j.prosdent.2005.10.020
6. Ahmed KE, Li KY, Murray CA. Longevity of fiber-reinforced composite fixed partial dentures (FRC FPD)-Systematic review. J Dent. 2017;61:1–11. doi:10.1016/j.jdent.2016.08.007
7. Khan AA, Zafar MS, Fareed MA, et al. Fiber-reinforced composites in dentistry - An insight into adhesion aspects of the material and the restored tooth construct. Dent Mater. 2023;39(2):141–151. doi:10.1016/j.dental.2022.12.003
8. Tacken MP, Cosyn J, De Wilde P, Aerts J, Govaerts E, Vannet BV. Glass fibre reinforced versus multistranded bonded orthodontic retainers: a 2 year prospective multi-centre study. Eur J Orthodont. 2010;32(2):117–123. doi:10.1093/ejo/cjp100
9. Flávia G, Leticia CCB, Caroline LM, Yoshio K, Roberto RB. Influence of polymeric matrix on the physical and chemical properties of experimental composites. Braz Oral Res. 2015;29(1):S1806. doi:10.1590/1807-3107BOR-2015.vol29.0128
10. Wolff D, Geiger S, Ding P, Staehle HJ, Frese C. Analysis of the interdiffusion of resin monomers into pre-polymerized fiber-reinforced composites.Dent Mater. 2012;28(5):541–547. doi:10.1016/j.dental.2011.12.001
11. Juloski J, Beloica M, Goracci C, et al. Shear bond strength to enamel and flexural strength of different fiber-reinforced composites. The Journal of Adhesive Dentistry. 2013;15(2):123–130. doi:10.3290/j.jad.a28362
12. Wang Y, Wang R, Habib E, et al. Surface modification of quartz fibres for dental composites through a sol-gel process. Mater Sci Eng C Mater Biol Appl. 2017;74:21–26. doi:10.1016/j.msec.2016.12.124
13. Niloofar B, Mohammad A, Mohammad RN. Ultra-high-molecular-weight polyethylene fiber reinforced dental composites: effect of fiber surface treatment on mechanical properties of the composites. Dent Mater. 2015;31(9):1022–1029. doi:10.1016/j.dental.2015.05.011
14. Xu X, Qiu P, Sun M, et al. Multifunctional epoxy resin-based composites with excellent flexural strength and X-ray imaging capacity using micro/nano structured QF-Bi2SiO5 fillers. J Mater Chem B. 2023;11(3):640–647. doi:10.1039/d2tb02377f
15. Fornaini C, Poli F, Merigo E, et al. Nanosecond pulsed fiber laser irradiation for enhanced zirconia crown adhesion: morphological, chemical, thermal and mechanical analysis. J Photoch Photobio B. 2021;219:112189. doi:10.1016/j.jphotobiol.2021.112189
16. Souza J, Fernandes V, Correia A, et al. Surface modification of glass fiber-reinforced composite posts to enhance their bond strength to resin-matrix cements: an integrative review. Clin Oral Invest. 2022;26(1):95–107. doi:10.1007/s00784-021-04221-y
17. Tanoue N, Sawase T, Matsumura H, McCabe JF. Properties of indirect composites reinforced with monomer-impregnated glass fiber. Odontology. 2012;100(2):192–198. doi:10.1007/s10266-011-0039-9
18. Yan Y, Ji Y, Yan J, et al. Atomic layer deposition SiO2 films over dental ZrO2 towards strong adhesive to resin. J Mech Behav Biomed. 2021;114:104197. doi:10.1016/j.jmbbm.2020.104197
19. Shi F, Li Y, Wang H, Zhang Q. Formation of core/shell structured polystyrene/anatase TiO2 photocatalyst via vapor phase hydrolysis. Appl Catal B. 2012;123:127–133. doi:10.1016/j.apcatb.2012.04.032
20. Joubert F, Musa OM, Hodgson DR, Cameron NR. The preparation of graft copolymers of cellulose and cellulose derivatives using ATRP under homogeneous reaction conditions. Chem Soc Rev. 2014;43(20):7217–7235. doi:10.1039/c4cs00053f
21. Vallittu PK. High-aspect ratio fillers: fiber-reinforced composites and their anisotropic properties. Dent Mater. 2015;31(1):1–7. doi:10.1016/j.dental.2014.07.009
22. Ellakwa AE, Shortall AC, Marquis PM. Influence of fiber type and wetting agent on the flexural properties of an indirect fiber reinforced composite. J Prosthet Dent. 2002;88(5):485–490. doi:10.1067/mpr.2002.129303
23. Biswas A, Bayer IS, Biris AS, Wang T, Dervishi E, Faupel F. Advances in top-down and bottom-up surface nanofabrication: techniques, applications & future prospects. Adv Colloid Interfac. 2012;170(1–2):2–27. doi:10.1016/j.cis.2011.11.001
24. Su CY, Wang LC, Liu WS, Wang CC, Perng TP. Photocatalysis and hydrogen evolution of Al- and Zn-Doped TiO2 nanotubes fabricated by atomic layer deposition. ACS Appl Mater Inter. 2018;10(39):33287–33295. doi:10.1021/acsami.8b12299
25. Roy AK, Baumann W, Konig I, et al. Atomic layer deposition (ALD) as a coating tool for reinforcing fibers. Anal Bioanal Chem. 2010;396(5):1913–1919. doi:10.1007/s00216-010-3470-9
26. George SM. Atomic layer deposition: an overview. Chem Rev. 2010;110(1):111–131. doi:10.1021/cr900056b
27. Lee SM, Pippel E, Gosele U, et al. Greatly increased toughness of infiltrated spider silk. Science. 2009;324(5926):488–492. doi:10.1126/science.1168162
28. Liyanage S, Acharya S, Parajuli P, Shamshina JL, Abidi N. Production and surface modification of cellulose bioproducts. Polymers-Basel. 2021;13(19):3433. doi:10.3390/polym13193433
29. Yan YX, Shu F, Chen H, et al. Reinforcement of bonding strength between dental Y-TZP and resin via nano-thin and conformal SiO2 films by atomic layer deposition. Adv. Mater. Interfaces. 2022;10(5):1–11. doi:10.1002/admi.202201910
30. Leterrier Y. Durability of nanosized oxygen-barrier coatings on polymers. Prog Mater Sci. 2003;48(1):1–55. doi:10.1016/S0079-6425(02)00002-6
31. Mei L, Jianshan C, Xiaokun H, et al. Enhanced properties of fiberglass-reinforced photocurable resin pile by introducing different fiberglass surface treatments and their biological evolution. RSC ADV. 2015;5(85):69690–69697. doi:10.1039/C5RA08964F
32. Mione MA, Vandalon V, Mameli A, Kessels W, Roozeboom F. Atmospheric-pressure plasma-enhanced spatial ALD of SiO2 studied by gas-phase infrared and optical emission spectroscopy. J Phys Chem C. 2021;125(45):24945–24957. doi:10.1021/acs.jpcc.1c07980
33. Zhang XY, Yang Y, Zhang ZX, et al. Deposition and characterization of RP-ALD SiO2 Thin films with different oxygen plasma powers. Nanomaterials-basel. 2021;11(5):1173. doi:10.3390/nano11051173
34. Landenberger P, Baumann L, Gerhardt-Szep S, Ruttermann S. The effect of new anti-adhesive and antibacterial dental resin filling materials on gingival fibroblasts. Dent Mater. 2021;37(9):1416–1424. doi:10.1016/j.dental.2021.06.013
35. Nagashio K, Yamashita T, Nishimura T, Kita K, Toriumi A. Electrical transport properties of graphene on SiO2 with specific surface structures. J Appl Phys. 2011;8(1):240–246. doi:10.1021/acsami.5b08479
36. Hu X, Liu M, Ji Y, et al. Enhanced mechanical properties and biosafety evaluation of surface-modified fiberglass-reinforced resin-based composite piles. J Mater Sci Mater Med. 2019;30(6):70. doi:10.1007/s10856-019-6269-z
37. Ren D, Li K, Chen L, et al. Modification on glass fiber surface and their improved properties of fiber-reinforced composites via enhanced interfacial properties. Compos Part B-Eng. 2019;177:107419. doi:10.1016/j.compositesb.2019.107419
38. Sinval AR, Susanne SS, Jack LF, Álvaro DB. Microstructural characterization and fracture behavior of a microhybrid and a nanofill composite. Dent Mater. 2008;24(9):1281–1288. doi:10.1016/j.dental.2008.02.006
39. Quinn JB, Quinn GD. A practical and systematic review of Weibull statistics for reporting strengths of dental materials. Dent Mater. 2010;26(2):135–147. doi:10.1016/j.dental.2009.09.006
40. Wang Y, Wang R, Habib E, et al. Surface modification of quartz fibres for dental composites through a sol-gel process. Mat Sci Eng C-Mater. 2017;74:21–26. doi:10.1016/j.msec.2016.12.124
41. Yu B, Tan L, Zheng R, Tan H, Zheng L. Targeted delivery and controlled release of Paclitaxel for the treatment of lung cancer using single-walled carbon nanotubes. Mat Sci Eng C Mater. 2016;68:579–584. doi:10.1016/j.msec.2016.06.025
42. Takamiya AS, Monteiro DR, Bernabe DG, et al. In vitro and in vivo toxicity evaluation of colloidal silver nanoparticles used in endodontic treatments. J Endod. 2016;42(6):953–960. doi:10.1016/j.joen.2016.03.014
43. Brieger K, Schiavone S, Miller FJ, Krause KH. Reactive oxygen species: from health to disease. Swiss Med Wkly. 2012;142:w13659. doi:10.4414/smw.2012.13659
44. Prado M, Marques JN, Pereira GD, Da SE, Simao RA. Evaluation of different surface treatments on fiber post cemented with a self-adhesive system. Mat Sci Eng C-Mater. 2017;77:257–262. doi:10.1016/j.msec.2017.03.141
45. Zinck P, Pay MF, Rezakhanlou R, Gerard JF. Mechanical characterisation of glass fibres as an indirect analysis of the effect of surface treatment. J Mater Sci. 1999;34(9):2121–2133. doi:10.1023/A:1004572112470
46. Grosskreutz JC. The fracture of surface coatings on a strained substrate. J Appl Phys. 1969;40(1):355–359. doi:10.1063/1.1657059
47. Druck CC, Pozzobon JL, Callegari GL, Dorneles LS, Valandro LF. Adhesion to Y-TZP ceramic: study of silica nanofilm coating on the surface of Y-TZP. Journal of biomedical materials research. Part B. Appl Biomater. 2015;103(1):143–150. doi:10.1002/jbm.b.33184
48. Zhu Z, Sippola P, Ylivaara O, et al. Low-temperature plasma-enhanced atomic layer deposition of SiO(2) Using Carbon Dioxide. Nanoscale Res Lett. 2019;14(1):55. doi:10.1186/s11671-019-2889-y
49. Shestaeva S, Bingel A, Munzert P, et al. Mechanical, structural, and optical properties of PEALD metallic oxides for optical applications. Appl Opt. 2017;56(4):C47–C59. doi:10.1364/AO.56.000C47
50. Pfeifer CS, Shelton ZR, Braga RR, Windmoller D, Machado JC, Stansbury JW. Characterization of dimethacrylate polymeric networks: a study of the crosslinked structure formed by monomers used in dental composites. Eur Polym J. 2011;47(2):162–170. doi:10.1016/j.eurpolymj.2010.11.007
51. Ferracane JL. Hygroscopic and hydrolytic effects in dental polymer networks. Dent Mater. 2006;22(3):211–222. doi:10.1016/j.dental.2005.05.005
52. Alshali RZ, Salim NA, Satterthwaite JD, Silikas N. Long-term sorption and solubility of bulk-fill and conventional resin-composites in water and artificial saliva. J Dent. 2015;43(12):1511–1518. doi:10.1016/j.jdent.2015.10.001
 © 2024 The Author(s). This work is published and licensed by Dove Medical Press Limited. The
full terms of this license are available at https://www.dovepress.com/terms
and incorporate the Creative Commons Attribution
- Non Commercial (unported, 3.0) License.
By accessing the work you hereby accept the Terms. Non-commercial uses of the work are permitted
without any further permission from Dove Medical Press Limited, provided the work is properly
attributed. For permission for commercial use of this work, please see paragraphs 4.2 and 5 of our Terms.
© 2024 The Author(s). This work is published and licensed by Dove Medical Press Limited. The
full terms of this license are available at https://www.dovepress.com/terms
and incorporate the Creative Commons Attribution
- Non Commercial (unported, 3.0) License.
By accessing the work you hereby accept the Terms. Non-commercial uses of the work are permitted
without any further permission from Dove Medical Press Limited, provided the work is properly
attributed. For permission for commercial use of this work, please see paragraphs 4.2 and 5 of our Terms.