Back to Journals » Journal of Multidisciplinary Healthcare » Volume 16
Serum Uric Acid Levels and Their Association with Renal Function Decline and Kidney Disease Progression in Middle-Aged and Elderly Populations: A Retrospective Cohort Study
Authors Luo Y ![]() , Wu Q, Meng R
, Wu Q, Meng R ![]() , Lian F
, Lian F ![]() , Jiang C, Hu M, Wang Y, Ma H
, Jiang C, Hu M, Wang Y, Ma H
Received 15 August 2023
Accepted for publication 30 October 2023
Published 9 November 2023 Volume 2023:16 Pages 3357—3366
DOI https://doi.org/10.2147/JMDH.S435537
Checked for plagiarism Yes
Review by Single anonymous peer review
Peer reviewer comments 2
Editor who approved publication: Dr Scott Fraser
Yingxian Luo, Qiong Wu, Runtang Meng, Fuzhi Lian, Chen Jiang, Meiyu Hu, Yaxin Wang, Haiyan Ma
School of Public Health, Hangzhou Normal University, Hangzhou, People’s Republic of China
Correspondence: Haiyan Ma, School of Public Health, Hangzhou Normal University, No. 2318, Yuhangtang Road, Yuhang District, Hangzhou, Zhejiang, 311121, People’s Republic of China, Email [email protected]
Objective: To evaluate the associations between serum uric acid (SUA) levels and estimated glomerular filtration rate (eGFR) and chronic kidney disease (CKD), with a focus on gender differences, and variations among women pre-and post-menopausal stages.
Design: A retrospective cohort study.
Setting: A large community-based survey was conducted every two years from 2010 to 2018 in Hangzhou, Zhejiang Province, Southeastern China.
Participants: 10,218 participants (40 years or above) without CKD at baseline who underwent three physical examinations were enrolled. CKD was defined as an eGFR of less than 60 mL/min/1.73m2.
Methods: Participants with SUA levels were divided into four groups (Q1-Q4) based on baseline SUA quartiles. The Q1 was the reference. By stratifying participants by gender, the relationships between SUA levels and eGFR were investigated using the generalized additive mixture model. The associations of SUA and the risk of incident CKD were examined using multivariate logistic regression models in the generalized estimating equation.
Results: After adjusting for confounding variables, a nonlinear association between SUA and eGFR was observed in females, while an approximately linear relationship was observed in males, suggesting that elevated SUA levels are associated with renal function decline. Furthermore, the highest quartile of SUA was associated with a 2.16-fold (95% CI: 1.31– 3.58) increased risk of CKD in males and a 2.76-fold (95% CI: 1.59– 4.78) increased risk in females, compared with the lowest quartile. And the spline curves demonstrated a U-shaped pattern, suggesting a potential threshold effect of SUA on the risk of CKD. Additionally, Subgroup analyses revealed significant associations between elevated SUA levels with CKD in postmenopausal women, but not in premenopausal women.
Conclusion: Elevated SUA levels are associated with an increased risk of CKD development and renal function decline in middle-aged and elderly individuals, particularly in postmenopausal women.
Keywords: uric acid, estimated glomerular filtration rate, chronic kidney disease, Chinese cohort
Introduction
In recent years, chronic kidney disease (CKD) has emerged as a major global public health problem and has been recognized as the tenth leading cause of death worldwide.1 According to the latest data from the World Health Statistics 2021, the worldwide adult prevalence of CKD is 7.1%, with particularly high prevalence rates, approximately 9.7%, observed in the Asia-Pacific region. CKD can significantly diminish patients’ quality of life and impose substantial medical and socio-economic burdens.2,3
Previous studies have extensively explored numerous risk factors associated with CKD, including hypertension, diabetes, obesity, hyperuricemia, hyperlipidemia, smoking, kidney infections, and inadequate medication.4–6 Among these risk factors, the relationship between high serum uric acid (SUA) levels and decreased kidney function has generated great interest. A comprehensive review article focuses on elucidating the underlying cellular and molecular pathophysiological mechanisms by which uric acid activates the NLRP3 inflammasome, resulting in kidney damage.7 Several prospective studies had stratified participants according to SUA levels and found a positive association between SUA levels and the prevalence of CKD.8–14 In a retrospective cohort study conducted in Japan, it was observed that deviations from normal serum urate levels could lead to a decline in estimated glomerular filtration rate among healthy Japanese men.15 However, relatively few studies have examined the association between SUA and early-stage decline in renal function, namely the association between SUA and a decrease in eGFR in individuals without CKD. Therefore, the use of new methods and models to further investigate or predict the association and strength of the relationship between SUA and CKD and decreased eGFR is necessary to shed more light on the relationship between SUA and kidney disease. Additionally, population-based studies have highlighted gender differences in the relationship between SUA and CKD,16–19 with women consistently found to have lower levels of SUA than men, because estrogen stimulates urinary urate excretion.17 Hence, SUA levels and CKD incidence may be different between men and women. Furthermore, some studies have suggested that women in their postmenopausal stage may be more susceptible to CKD and hyperuricemia.20,21 Despite these observations, little is known about the underlying mechanisms of these gender differences and the role of hormonal changes during menopause in the development of CKD. Therefore, it is necessary to investigate this link in middle-aged and elderly populations of both sexes, particularly women in their pre-and post-menopausal stages.
In this community-based population cohort study, we aimed to investigate the relationship between SUA levels and the prevalence of CKD and decreased kidney function in individuals without CKD, with a particular emphasis on gender differences and women in the pre-and post-menopausal stages. The insights generated by this research will be valuable for the prevention and treatment of CKD and declining renal function.
Methods
Study Design
We conducted a dynamic retrospective cohort study using data collected from participants who received free health check-ups at community health centers in China as part of the “Public Basic Health Services Project”. The study included 12,498 adults aged 40 years or older who underwent physical examinations at a health center located in Hangzhou, Zhejiang Province between May 2010 and December 2018. During the study period, participants underwent physical examinations biennially, with each participant having completed at least three physical examinations. After excluding those who had less than three times of physical examinations (n = 166), those with missing blood pressure (BP), SUA, FBG, TC, eGFR information (n=384), and those with eGFR<60 mL/min/1.73m2 at baseline (n=1730). Ultimately, a total of 10,218 participants were enrolled in the study, including 3773 males and 6445 females (Figure 1). The retrospective study was approved by the Ethics Committee of Hangzhou Normal University (Reference No. 20220009) and was conducted in accordance with the Helsinki Declaration. Informed consent was waived as the data received from the community health centers was anonymized by removing identification information.
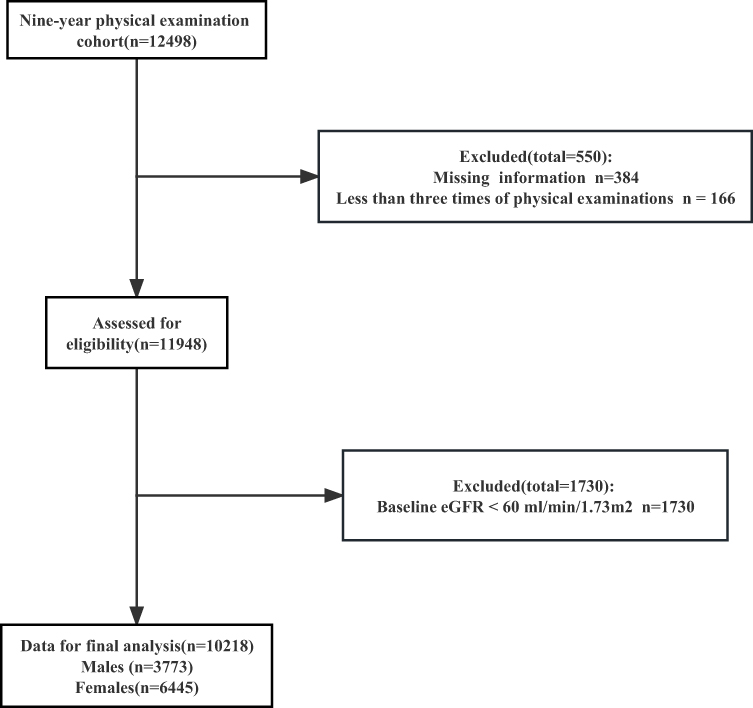 |
Figure 1 Flowchart of the participant inclusion. Abbreviation: eGFR, estimated glomerular filtration rate. |
Data Measurement
Each participant underwent an in-person interview conducted by a trained nurse using a standardized questionnaire to collect demographic information. Weight and height were measured using calibrated scales and a stadiometer. Blood pressure was measured using a calibrated mercury sphygmomanometer. Two consecutive measurements were taken with a 2-minute interval, and the average of the two readings was calculated as the final value.
Before venous blood sample collection, all participants were required to fast for at least eight hours. Serum creatinine, SUA, FBG, and TC levels were measured for each participant using standard clinical laboratory methods.
Diagnostic Criteria
Hypertension was defined as the presence of either SBP ≥ 140 mmHg or DBP ≥ 90 mmHg, or having been previously diagnosed with hypertension and currently receiving anti-hypertensive treatment. Hyperglycemia was defined as FBG ≥7.0 mmol/L or self-reported diabetes. Dyslipidemia was defined as TC ≥6.22 mmol/L.22 According to the BMI classification criteria of the Chinese population,23 obesity was defined as BMI ≥28 kg/m2. Hyperuricemia was defined as SUA ≥416μmol/L (70 mg/L) in men and SUA ≥357μmol/L (60 mg/L) in women. The CKD incident was defined as an eGFR of less than 60 mL/min/1.73m2. The modified equation for eGFR according to the Chinese eGFR Collaboration24 for Chinese patients with chronic diseases:

Statistical Analysis
The normality of continuous variables’ distribution was assessed using the Shapiro–Wilk tests. Continuous variables with normal distribution are presented as the mean ± standard deviation, while those with non-normal distribution are presented as the median (interquartile range). Categorical variables are expressed as frequency (percentages). The group differences for continuous variables were compared using Analysis of Variance (ANOVA) and the Kruskal–Wallis test, while the Chi-square test was used for categorical variables. Given the significant gender differences in SUA levels, all analyses were stratified by gender. SUA within the normal range was divided into four groups based on the SUA quartiles (Q1-Q4). Hyperuricemia was grouped as the fifth group. The detailed grouping information is SUA Q1 (SUA<237μmol/L), Q2 (237≤SUA<278μmol/L), Q3 (278≤SUA<325μmol/L), Q4 (325μmol/L≤SUA) for women, and Q1 (SUA<297μmol/L), Q2 (297≤SUA<348μmol/L), Q3 (348≤SUA<403μmol/L) and Q4 (403μmol/L≤SUA) for men, all using the first quartile (Q1) as the reference group. A generalized additive mixture effects model (GAMM) presented trends between SUA and eGFR. The model was adjusted for Age, BMI, FBG, SBP, DBP, TC, and Cr. The GEE models are used to account for correlation among responses from multiple time points per participant, using an exchangeable correlation matrix.25 In this study, crude odds ratios (ORs) and 95% confidence intervals (CIs) were calculated for CKD, controlling for SUA levels. In the multivariable models, variables such as age, BMI, and biological information were included to obtain adjusted ORs and 95% CIs. This approach allows for a more accurate assessment of the relationship between these variables and CKD, while controlling for other factors. Furthermore, stratified analyses were conducted while taking into account women’s menopausal status, age, and obesity status. All analyses were performed using SPSS version 26.0 and R software version 4.2.1. A two-sided p-value<0.05 was considered statistically significant.
Results
Baseline Characteristics of Participants
The baseline characteristics of the study participants are presented in Tables 1 and 2. A total of 10,218 participants (3773 men and 6445 women) aged 40 years and older were included, As the baseline SUA levels increased, SBP, DBP, FBG, TC, and Cr showed a trend towards an increase in both sexes and a decrease in eGFR. In addition, SUA levels were relatively high in older subjects of both sexes, and the proportion of obesity, hypertension, hyperglycemia, and dyslipidemia was higher in subjects with higher SUA levels compared with lower SUA levels.
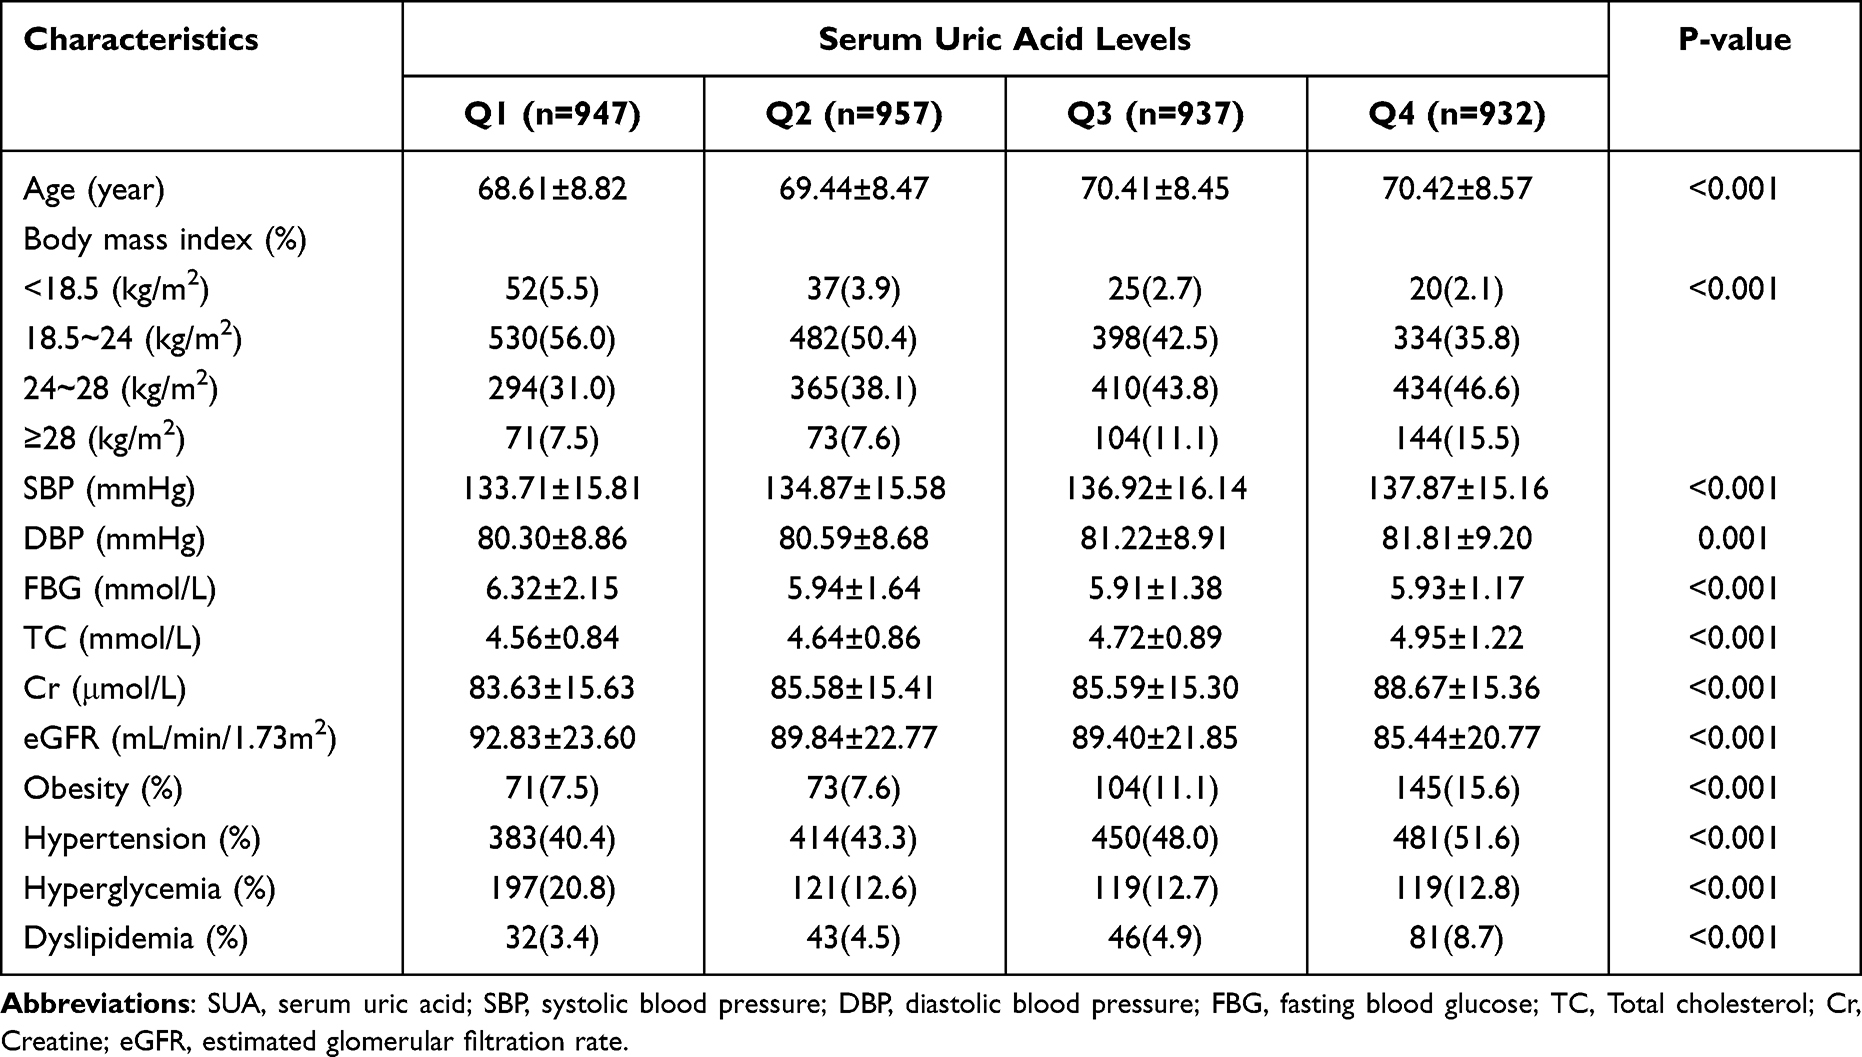 |
Table 1 Baseline Characteristics of the Men Participants According to Different SUA Levels |
 |
Table 2 Baseline Characteristics of the Women Participants According to Different SUA Levels |
A Strong Correlation Between Alterations in SUA and Fluctuations in eGFR
The GAMM analysis depicting the association between SUA and eGFR in individuals aged 40 and above, is illustrated in Figure 2. Following adjustment for age, BMI, SBP, DBP, FBG, and TC, a significant association between SUA and eGFR was observed. Notably, the SUA-eGFR association demonstrated a decreasing trend in both genders. Specifically, a nonlinear association (F=578.0, P<0.05) was observed in females, while an approximately linear relationship (F=169.3, P<0.05) was observed in males, suggesting that elevated SUA levels are associated with renal function decline.
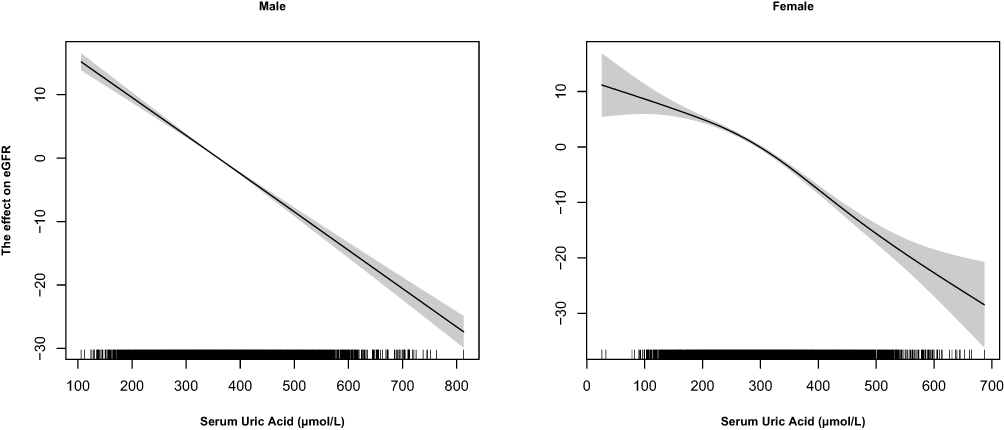 |
Figure 2 Effect of serum uric acid on estimated glomerular filtration rate. Abbreviation: eGFR, estimated glomerular filtration rate. |
Baseline SUA Levels and Risk of Incident CKD
During the follow-up period, 292 (2.9%) participants (155 men and 137 women) developed incident CKD. Models 1 and 2 showed significant associations of incident CKD with 4th quartiles of SUA. Model 3 showed a 2.16-fold (95% CI: 1.31–3.58, P= 0.003) increased risk of CKD in the highest SUA quartile for men and 2.76-fold (95% CI: 1.59–4.78, P< 0.001) for women compared to the lowest quartile (Table 3). Additionally, the population was categorized into four groups based on the mean and standard deviation of serum uric acid to investigate the relationship. Consistent findings were observed, as stated previously, and a detailed description of the groupings and results can be found in Table S1.
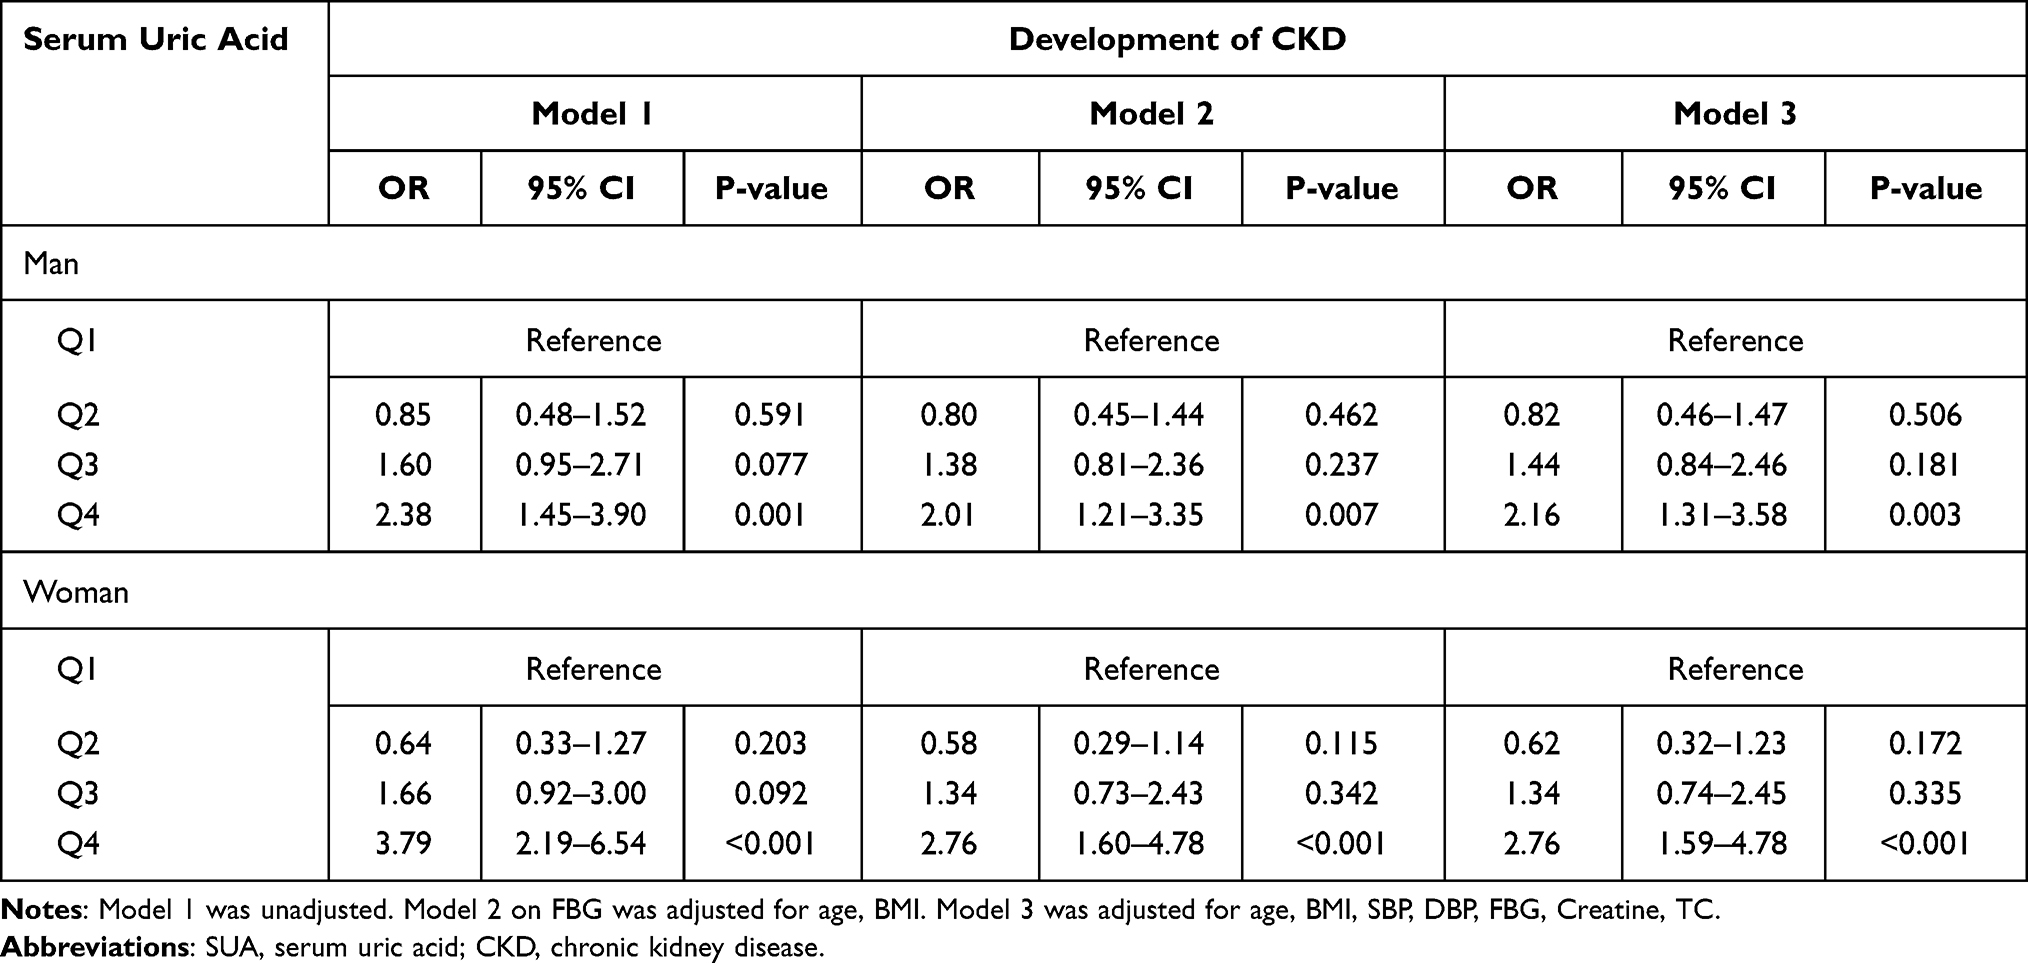 |
Table 3 Risks for the Incidence of CKD Development According to the Quartiles of Baseline SUA Levels |
Nonlinear Association Between SUA and the Development of CKD
Based on the point estimates of the odds ratios for Q2 in the aforementioned tables, which investigated baseline SUA and the progression of CKD being less than 1, it indicates a potential non-linear association between SUA and CKD progression. To visually depict this relationship, we generated spline curves presenting the risk of CKD in both men and women using SUA as a continuous variable (Figure 3), revealing a distinctive nonlinear association. Threshold and saturation effects analyses showed that the inflection point for SUA was 300μmol/L for males and 252μmol/L for females. Both higher and lower levels of SUA may contribute to an increased risk of developing CKD.
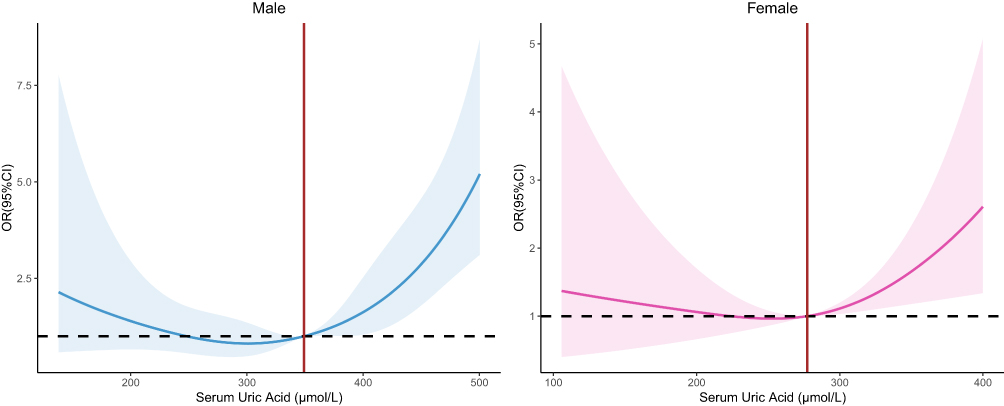 |
Figure 3 Risks for the incidence of CKD development according to SUA levels. Abbreviations: SUA, serum uric acid; eGFR, estimated glomerular filtration rate. |
Subgroup Analysis
We stratified men by age, using 65 years as the cutoff point, and found a significant association between high SUA levels and CKD in both age groups. Women were stratified by menopausal status, using 51 years as the cutoff point. Participants who were younger than 51 years did not exhibit a significant association between SUA and CKD. However, participants aged 51 years and above demonstrated a significant association between SUA levels and CKD. In the stratified analysis by body mass index (BMI), we observed a positive association between SUA and CKD only in the non-obese population, while no effect was found in the obese population (see Tables S2–S4).
Discussion
The results of our study are consistent with prior investigations on the adverse effects of elevated SUA levels on renal function. Specifically, we found that elevated SUA levels are associated with a linear reduction in eGFR in men and a non-linear reduction in women. Hyperuricemia may interfere with glomerulus blood flow and autoregulation, leading to inflammation, fibrosis, and urate deposition in the kidneys.26 This is consistent with prior research, as reported by Liu et al and Isabel O Oliveira et al, which demonstrated that elevated UA was associated with a decline in eGFR.27,28
Our study provides further evidence that higher baseline SUA levels are associated with an increased risk of incident CKD. In this context, our findings are consistent with those of previous research, including a population-based study by Ye et al14 and a national cohort study and updated meta-analysis by Wu et al.29 In particular, the latter study highlighted that higher baseline SUA levels were associated with an increased risk of CKD in middle-aged and older Chinese adults. This positive association was subsequently confirmed in a meta-analysis of several cohort studies. Moreover, several studies have identified SUA as a risk factor for the development of kidney disease in specific populations such as diabetic, non-diabetic, hypertensive, and non-hypertensive populations.11,30–34 Given that hyperuricemia can interact with other risk factors, such as metabolic syndrome, diabetes, and hypertension, to accelerate the progression of declining renal function,33,35–37 prompt identification of high-risk patients is crucial to reduce the burden of CKD. Furthermore, our study revealed a non-linear relationship between SUA levels and the risk of CKD. Particularly, low levels of uric acid were found to be associated with an increased risk of CKD. Supporting this finding, a cross-sectional study conducted on a Japanese population provided evidence linking hypouricemia to decreased renal function.38 It has been hypothesized that the decreased antioxidant capacity resulting from hypouricemia further elevates the risk of reduced renal function.39 This is consistent with previous studies indicating associations between hypouricemia and various inflammatory and degenerative diseases, such as acute graft-versus-host disease, Alzheimer’s disease, Huntington’s disease, Parkinson’s disease, and multiple sclerosis. These associations are considered to be a consequence of the reduced antioxidant capacity. Furthermore, considering the high incidence of hyperuricemia among middle-aged women,20,21 we stratified women by menopausal status. Our study confirmed a significant association between SUA levels and CKD in postmenopausal women, suggesting that SUA is an independent risk factor for CKD. Therefore, it is necessary to consider the impact of menopausal status on the association between SUA and CKD when developing prevention and treatment strategies.
There are a few limitations in our study. Firstly, the number of potentially observable confounders that could be included was small, such as smoking, alcoholic consumption, physical activity, and dietary habits, which may cause over-estimations on the associations between SUA and CKD in this study. Secondly, our study was based on a single-center investigation and included only adults aged 40 years and older residing in the community, which should be cautious when extrapolating our findings to other populations. Thirdly, the absence of drug histories regarding medications that can potentially influence uric acid levels, such as thiazide diuretics, allopurinol, and probenecid, poses a limitation in evaluating their impact on our findings. To further comprehend the relationship between SUA levels and the development of CKD, it is recommended for future research to prioritize the collection of medication data. Our study has several strengths, such as a large sample size, a long follow-up period, and a prospective design. Overall, our findings contribute to the growing body of evidence on the negative impact of elevated SUA on renal function and further emphasize the need for timely identification and management of high-risk patients to prevent the development of CKD.
Conclusion
This community-based retrospective cohort study reveals a significant association between SUA levels and a decline in GFR. Higher SUA levels were associated with an increased risk of incident CKD in Chinese middle-aged and elderly adults, particularly in postmenopausal women. These findings underscore the importance of monitoring SUA levels, in the prevention and management of CKD.
Data Sharing Statement
The datasets used and/or analyzed during the current study are available from the corresponding author on reasonable request.
Ethics Declarations
The study protocol was approved by the Ethics Committee of Hangzhou Normal University (Ethics Approval Number:20220009) and was conducted in accordance with the Helsinki Declaration. As the data were anonymized, the requirement for informed consent was waived. We confirm that the data accessed complied with relevant data protection and privacy regulations.
Acknowledgments
The authors would like to thank all community residents for participating in the present study, as well as the corresponding medical staff at the community health center for their assistance in this study.
Author Contributions
All authors made a significant contribution to the work reported, whether that is in the conception, study design, execution, acquisition of data, analysis and interpretation, or in all these areas; took part in drafting, revising or critically reviewing the article; gave final approval of the version to be published; have agreed on the journal to which the article has been submitted; and agree to be accountable for all aspects of the work.
Funding
This study was supported by a grant from the Preventive Medicine Discipline Construction Project of Hangzhou Normal University.
Disclosure
The authors report no conflicts of interest in this work.
References
1. Bikbov B, Purcell CA, Levey AS et al. Global, regional, and national burden of chronic kidney disease, 1990–2017: a systematic analysis for the Global Burden of Disease Study 2017. Lancet. 2020;395(10225):709–733. doi:10.1016/s0140-6736(20)30045-3
2. Aashima, Nanda, M, Sharma R, Jani C . The burden of chronic kidney disease in Asia, 1990–2019: examination of estimates from global burden of disease 2019 study. Nephrology. 2022;27(7):610–620. doi:10.1111/nep.14051
3. Ke C, Liang J, Liu M, Liu S, Wang C. Burden of chronic kidney disease and its risk-attributable burden in 137 low-and middle-income countries, 1990–2019: results from the global burden of disease study 2019. BMC Nephrol. 2022;23(1):17. doi:10.1186/s12882-021-02597-3
4. Kovesdy CP. Epidemiology of chronic kidney disease: an update 2022. Kidney Int Suppl. 2022;12(1):7–11. doi:10.1016/j.kisu.2021.11.003
5. Wang L, Xu X, Zhang M, et al. Prevalence of Chronic Kidney Disease in China: results from the Sixth China Chronic Disease and risk factor surveillance. JAMA Intern Med. 2023;183(4):298–310. doi:10.1001/jamainternmed.2022.6817
6. Lin CY, Hsieh MC, Kor CT, Hsieh YP. Association and risk factors of chronic kidney disease and incident diabetes: a nationwide population-based cohort study. Diabetologia. 2019;62(3):438–447. doi:10.1007/s00125-018-4788-7
7. Wang M, Lin X, Yang X, Yang Y. Research progress on related mechanisms of uric acid activating NLRP3 inflammasome in chronic kidney disease. Ren Fail. 2022;44(1):615–624. doi:10.1080/0886022x.2022.2036620
8. Sonoda H, Takase H, Dohi Y, Kimura G. Uric acid levels predict future development of chronic kidney disease. Am J Nephrol. 2011;33(4):352–357. doi:10.1159/000326848
9. Yamada T, Fukatsu M, Suzuki S, Wada T, Joh T. Elevated serum uric acid predicts chronic kidney disease. Am J Med Sci. 2011;342(6):461–466. doi:10.1097/MAJ.0b013e318218bd89
10. Mwasongwe SE, Fülöp T, Katz R, et al. Relation of uric acid level to rapid kidney function decline and development of kidney disease: the Jackson Heart Study. J Clin Hypertens. 2018;20(4):775–783. doi:10.1111/jch.13239
11. Son YB, Yang JH, Kim MG, Jo SK, Cho WY, Oh SW. The effect of baseline serum uric acid on chronic kidney disease in normotensive, normoglycemic, and non-obese individuals: a health checkup cohort study. PLoS One. 2021;16(1):e0244106. doi:10.1371/journal.pone.0244106
12. Toyama T, Furuichi K, Shimizu M, et al. Relationship between serum uric acid levels and chronic kidney disease in a Japanese Cohort with Normal or Mildly Reduced Kidney Function. PLoS One. 2015;10(9):e0137449. doi:10.1371/journal.pone.0137449
13. Tsai CW, Lin SY, Kuo CC, Huang CC . Serum uric acid and progression of kidney disease: a longitudinal analysis and mini-review. PLoS One. 2017;12(1):e0170393. doi:10.1371/journal.pone.0170393
14. Ye M, Hu K, Jin J, Wu D, Hu P, He Q. The association between time-mean serum uric acid levels and the incidence of chronic kidney disease in the general population: a retrospective study. BMC Nephrol. 2018;19(1):190. doi:10.1186/s12882-018-0982-6
15. Kuma A, Mafune K, Uchino B, Ochiai Y, Enta K, Kato A. Alteration of normal level of serum urate may contribute to decrease in estimated glomerular filtration rate decline in healthy Japanese men. Ren Fail. 2021;43(1):1408–1415. doi:10.1080/0886022x.2021.1988969
16. Yang Y, Zhou W, Wang Y, Zhou R. Gender-specific association between uric acid level and chronic kidney disease in the elderly health checkup population in China. Ren Fail. 2019;41(1):197–203. doi:10.1080/0886022x.2019.1591994
17. Nakayama S, Satoh M, Tatsumi Y, et al. Detailed association between serum uric acid levels and the incidence of chronic kidney disease stratified by sex in middle-aged adults. Atherosclerosis. 2021;330:107–113. doi:10.1016/j.atherosclerosis.2021.06.908
18. Ryoo JH, Choi JM, Oh CM, Kim MG. The association between uric acid and chronic kidney disease in Korean men: a 4-year follow-up study. J Korean Med Sci. 2013;28(6):855–860. doi:10.3346/jkms.2013.28.6.855
19. Chang PY, Chang YW, Lin YF, Fan HC. Sex-specific association of uric acid and kidney function decline in Taiwan. J Personal Med. 2021;11(5):415. doi:10.3390/jpm11050415
20. Cho SK, Winkler CA, Lee SJ, Chang Y, Ryu S. The prevalence of hyperuricemia sharply increases from the late menopausal transition stage in middle-aged women. J Clin Med. 2019;8(3):296. doi:10.3390/jcm8030296
21. Pei F, Zhou Z, Li Y, et al. Chronic kidney disease in Chinese postmenopausal women: a cross-sectional survey. Niger J Clin Pract. 2017;20(2):153–157. doi:10.4103/1119-3077.198314
22. Shan R, Ning Y, Ma Y, et al. Incidence and risk factors of hyperuricemia among 2.5 Million Chinese Adults during the years 2017–2018. Int J Environ Res Public Health. 2021;18(5):2360. doi:10.3390/ijerph18052360
23. Weng J, Ji L, Jia W, et al. Standards of care for type 2 diabetes in China. Diabetes Metab Res Rev. 2016;32(5):442–458. doi:10.1002/dmrr.2827
24. Zhang L, Wang F, Wang L, et al. Prevalence of chronic kidney disease in China: a cross-sectional survey. Lancet. 2012;379(9818):815–822. doi:10.1016/s0140-6736(12)60033-6
25. Lalonde TL, Wilson JR, Yin J. GMM logistic regression models for longitudinal data with time-dependent covariates and extended classifications. Stat Med. 2014;33(27):4756–4769. doi:10.1002/sim.6273
26. Johnson RJ, Sanchez Lozada LG, Lanaspa MA, Piani F, Borghi C. Uric acid and chronic kidney disease: still more to do. Kidney Int Rep. 2023;8(2):229–239. doi:10.1016/j.ekir.2022.11.016
27. Liu P, Liang Y, Cui S, et al. Association of uric acid with the decline in estimated glomerular filtration rate in middle-aged and elderly populations: evidence based on the China Health and Retirement Longitudinal Study. BMJ Open. 2023;13(5):e071771. doi:10.1136/bmjopen-2023-071771
28. Oliveira IO, Mintem GC, Oliveira PD, et al. Uric acid is independent and inversely associated to glomerular filtration rate in young adult Brazilian individuals. Nutr Metab Cardiovasc Dis. 2020;30(8):1289–1298. doi:10.1016/j.numecd.2020.04.016
29. Wu N, Xia J, Chen S, et al. Serum uric acid and risk of incident chronic kidney disease: a national cohort study and updated meta-analysis. Nutr Metab. 2021;18(1):94. doi:10.1186/s12986-021-00618-4
30. Hu G, Bai Y, Chen T, Tang S, Hu L. Threshold effects of serum uric acid on chronic kidney disease in US women without hypertension and diabetes: a cross-sectional study. Kidney Blood Press Res. 2019;44(5):1036–1049. doi:10.1159/000502183
31. Kaewput W, Thongprayoon C, Rangsin R, et al. Association between serum uric acid and chronic kidney disease in patients with hypertension: a multicenter nationwide cross-sectional study. J Evid Based Med. 2019;12(4):235–242. doi:10.1111/jebm.12364
32. Le HT, Le TT, Tran NMT, et al. Serum uric acid levels and risk of rapid decline of estimated glomerular filtration rate in patients with type 2 diabetes: findings from a 5-year prospective cohort study. Healthcare. 2021;9(10):1341. doi:10.3390/healthcare9101341
33. Pilemann-Lyberg S, Hansen TW, Tofte N, et al. Uric acid is an independent risk factor for decline in kidney function, cardiovascular events, and mortality in patients with type 1 diabetes. Diabetes Care. 2019;42(6):1088–1094. doi:10.2337/dc18-2173
34. Wang J, Yu Y, Li X, et al. Serum uric acid levels and decreased estimated glomerular filtration rate in patients with type 2 diabetes: a cohort study and meta-analysis. Diabetes Metab Res Rev. 2018;34(7):e3046. doi:10.1002/dmrr.3046
35. Hanai K, Tauchi E, Nishiwaki Y, et al. Effects of uric acid on kidney function decline differ depending on baseline kidney function in type 2 diabetic patients. Nephrol Dial Transpl. 2019;34(8):1328–1335. doi:10.1093/ndt/gfy138
36. Lee CL, Tsai SF. Author correction: association between mortality and serum uric acid levels in non-diabetes-related chronic kidney disease: an analysis of the National Health and Nutrition Examination Survey, USA, 1999–2010. Sci Rep. 2021;11(1):17771. doi:10.1038/s41598-021-97179-6
37. Zhang J, Lu X, Li H, Wang S. Serum uric acid and mortality in patients with chronic kidney disease: a systematic review and meta-analysis. Blood Purif. 2021;50(6):758–766. doi:10.1159/000513944
38. Wakasugi M, Kazama JJ, Narita I, et al. Association between hypouricemia and reduced kidney function: a cross-sectional population-based study in Japan. Am J Nephrol. 2015;41(2):138–146. doi:10.1159/000381106
39. Park JH, Jo YI, Lee JH. Renal effects of uric acid: hyperuricemia and hypouricemia. Korean J Intern Med. 2020;35(6):1291–1304. doi:10.3904/kjim.2020.410
 © 2023 The Author(s). This work is published and licensed by Dove Medical Press Limited. The
full terms of this license are available at https://www.dovepress.com/terms
and incorporate the Creative Commons Attribution
- Non Commercial (unported, 3.0) License.
By accessing the work you hereby accept the Terms. Non-commercial uses of the work are permitted
without any further permission from Dove Medical Press Limited, provided the work is properly
attributed. For permission for commercial use of this work, please see paragraphs 4.2 and 5 of our Terms.
© 2023 The Author(s). This work is published and licensed by Dove Medical Press Limited. The
full terms of this license are available at https://www.dovepress.com/terms
and incorporate the Creative Commons Attribution
- Non Commercial (unported, 3.0) License.
By accessing the work you hereby accept the Terms. Non-commercial uses of the work are permitted
without any further permission from Dove Medical Press Limited, provided the work is properly
attributed. For permission for commercial use of this work, please see paragraphs 4.2 and 5 of our Terms.