Back to Journals » Vascular Health and Risk Management » Volume 15
Serum untargeted lipidomic profiling reveals dysfunction of phospholipid metabolism in subclinical coronary artery disease
Authors Djekic D, Pinto R ![]() , Repsilber D, Hyotylainen T, Henein M
, Repsilber D, Hyotylainen T, Henein M
Received 22 January 2019
Accepted for publication 18 February 2019
Published 13 May 2019 Volume 2019:15 Pages 123—135
DOI https://doi.org/10.2147/VHRM.S202344
Checked for plagiarism Yes
Review by Single anonymous peer review
Peer reviewer comments 2
Editor who approved publication: Dr Konstantinos Tziomalos
Demir Djekic,1 Rui Pinto,2 Dirk Repsilber,3 Tuulia Hyotylainen,4 Michael Henein5–7
1Department of Cardiology, School of Medical Sciences, Örebro University, Örebro, Sweden; 2Department of Epidemiology and Biostatistics, School of Public Health, Faculty of Medicine, Imperial College London, London, UK; 3School of Medical Sciences, Faculty of Medicine and Health, Örebro University, Örebro, Sweden; 4Man-Technology-Environment Research Centre, School of Science and Technology, Örebro University, Örebro, Sweden; 5Department of Public Health and Clinical Medicine, Umeå University and Heart Centre, Umeå, Sweden; 6Molecular and Clinic Research Institute, St George University, London, UK; 7Institute of Environment, Health and Physical Sciences, Brunel University, London, UK
Purpose: Disturbed metabolism of cholesterol and triacylglycerols (TGs) carries increased risk for coronary artery calcification (CAC). However, the exact relationship between individual lipid species and CAC remains unclear. The aim of this study was to identify disturbances in lipid profiles involved in the calcification process, in an attempt to propose potential biomarker candidates.
Patients and methods: We studied 70 patients at intermediate risk for coronary artery disease who had undergone coronary calcification assessment using computed tomography and Agatston coronary artery calcium score (CACS). Patients were divided into three groups: with no coronary calcification (NCC; CACS: 0; n=26), mild coronary calcification (MCC; CACS: 1–250; n=27), or severe coronary calcification (SCC; CACS: >250; n=17). Patients’ serum samples were analyzed using liquid chromatography-mass spectrometry in an untargeted lipidomics approach.
Results: We identified 103 lipids within the glycerolipid, glycerophospholipid, sphingolipid, and sterol lipid classes. After false discovery rate correction, phosphatidylcholine (PC)(16:0/20:4) in higher levels and PC(18:2/18:2), PC(36:3), and phosphatidylethanolamine(20:0/18:2) in lower levels were identified as correlates with SCC compared to NCC. There were no significant differences in the levels of individual TGs between the three groups; however, clustering the lipid profiles showed a trend for higher levels of saturated and monounsaturated TGs in SCC compared to NCC. There was also a trend for lower TG(49:2), TG(51:1), TG(54:5), and TG(56:8) levels in SCC compared to MCC.
Conclusion: In this study we investigated the lipidome of patients with coronary calcification. Our results suggest that the calcification process may be associated with dysfunction in autophagy. The lipidomic biomarkers revealed in this study may aid in better assessment of patients with subclinical coronary artery disease.
Keywords: coronary artery calcification, coronary artery calcium score; lipidomics, triacylglycerol, lipids, atherosclerosis; autophagy
Introduction
Coronary artery disease (CAD)-related mortality has recently fallen in the Western World, particularly Sweden, because of lifestyle and treatment improvements resulting in less people smoke and a better control of blood pressure, diabetes, and dyslipidemia.1–3 Fast advances in interventional management of coronary disease with drug-eluting stents have also played an important role. Despite these achievements, CAD remains the leading cause of death in the West.4 Risk evaluation systems, for example Systematic COronary Risk Evaluation, Framingham Risk Score (FRS) and Pooled Cohort Equations, have also developed to predict individual’s risk for developing cardiovascular events, which plays a pivotal role in primary prevention.5,6 However, the evidence-based benefits for commencing treatment in asymptomatic individuals remains uncertain.
Coronary artery calcification (CAC) is a marker for subclinical coronary artery disease in patients with intermediate risk and has been shown to improve risk prediction of CAD events.7 CAC is accurately quantified by computed tomography (CT). However, its use in regular follow-up of patients is questionable because of the associated cost and radiation exposure.6 CAC has been shown to be related to conventional risk factors of atherosclerosis, including abnormally high cholesterol and triacylglycerols (TGs).8–12 Meta-analyses and genetic studies have also reported hypertriglyceridemia as independent predictor for CAD.13–15 However, the exact role of individual products of lipid metabolism in the calcification process remains undetermined. Because of the diverse composition and distribution of saturated and unsaturated fatty acids (FAs) in lipid headgroups, for example, glycerol (in TGs) and choline (in phosphatidylcholine [PC]), individual lipid molecules may differ in their functional properties.16
The aim of this study was to identify lipids, which are likely to be involved in the biochemical process of CAC and its severity. If found, they may help in generating novel hypothesis of CAC mechanisms and potentially serve as diagnostic biomarker candidates.
Material and methods
Patients
Seventy patients who presented to Umeå Heart Centre (elective patients) with chest pain and whose diagnostic coronary angiogram, performed within the 12 months prior to recruitment, excluded significant (>50%) coronary artery stenosis were included in this study. A research nurse explained the study protocol to the patient who signed an informed consent to participate in the study. No patient had prior myocardial infarction, coronary artery intervention, coronary artery bypass graft surgery, significant valvular heart disease (more than mild stenosis or regurgitation), chronic heart failure (left ventricular ejection fraction <45%), or renal failure (creatinine >130 µmol/L). The study was approved by the Regional Ethics Committee of Umeå (2012-307-32M)(08-11M) and was conducted in accordance with the Declaration of Helsinki.
All patients underwent multislice CT scan of the chest, from which coronary artery calcium score (CACS) was measured using the Agatston score,17 and they also completed a clinical questionnaire investigating lifestyle, prior clinical conditions, and medications. According to the CACS, the total cohort of patients was divided into the following subgroups: 26 patients with no coronary calcification (NCC), 27 with mild coronary calcification (MCC), CACS: 1-250, and 17 with severe coronary calcification (SCC), CACS: >250.
Blood sample storage
Blood samples were taken from the patients after an overnight fasting using the conventional venipuncture method, and the collected samples were kept in room temperature to clot, and then the serum was separated after conventional centrifugation. Samples were stored in −80°C in a dedicated freezer at the Academic Clinical Physiology Department, Umeå, for future biochemistry and metabolic profiling analysis. A tube from each patient was sent to the Swedish Metabolomics Center in Umeå, for analysis.
Metabolomics investigations and data collection and identification
Sample preparation
110 μL of organic solvent (2/1 v/v chloroform:methanol) was added to 20 μL of serum and the sample was shaken at 30 Hz for 2 mins, then let to stand at room temperature for 0.5–1 hrs. The sample was then centrifuged at 14,000 rpm and 4°C for 3 mins, then 50 µL of the organic phase was transferred to a microvial and 70 µL of internal standards was added (phosphatidylserine (PS)(17:0/17:0), phosphatidylglycerol (PG)(17:0/17:0), phosphatidylethanolamine (PE)(17:0/17:0), monoacylglycerol (MG)(17:0/0:0/0:0), diacylglycerols (DGs)(17:0/17:0/0:0), TG(17:0/17:0/17:0), PC(19:0/19:0), PC(17:0/0:0), TG(16:0/16:0/16:0), ceramide (Cer)(16:0). Quality control samples were also prepared by pooling 10 μL from each extract. All samples were stored at −80°C until analysis.
Liquid chromatography-mass spectrometry (LC-MS) analysis
The chromatographic separation was performed on an Agilent 1290 Infinity UHPLC-system connected to an Agilent 6550 Q-TOF mass spectrometer equipped with a jet stream electrospray ionization. 1 µL of the extracted serum was injected onto an Acquity UHPLC-Q-TOF-MS system. The samples were analyzed first in positive electrospray ionization polarity mode (ESI+) and then the instrument was switched to negative polarity mode (ESI−) and the samples were re-analyzed. In ESI+, the lipid species including TGs, DG, PC, PE, or sphingomyelins (SMs) are detected, whereas ESI– gives better sensitivity for phosphatidylinositols (PIs), PS, phosphatidic acids (PAs), ceramides, cardiolipins and nonesterified free fatty acids (FFAs).
Data extraction
MS data processing was performed using open-source software MZmine 2.18.18 Peaks were identified using a custom database search and normalized using lipid class-specific internal standards, and also utilizing MS/MS data. Unknown lipids were normalized with the closest eluting internal standard. The custom database used in this study was recently assessed as part of the NIST lipidomics ring study, which comprised 31 laboratories worldwide.19
Statistical analysis
We applied principal component analysis (PCA) on the data to have an overview of the CACS classes.20 We used orthogonal partial least squares discriminant analysis (OPLS-DA) to discriminate the 3 combinations of classes (NCC vs MCC; NCC vs SCC; MCC vs SCC) separately for the negative and positive modes. A model is considered statistically significant if it obtains relatively high Q2 values (according to cross-validation [CV]) with simultaneously low analysis of variance (ANOVA) and permutation test p-values (in this work α=0.05 for both). All variables were normalized to unit variance (z-scores).
Unpaired t-tests at the 95% confidence level were used to evaluate the statistical significance for lipid differences between the CACS classes. Benjamini–Hochberg correction with α=0.10 was used to control the false discovery rate (FDR).21 A logistic regression model (for each lipid) with a binary outcome was used to test models that were adjusted for age, sex, and use of statin medication. In order to be considered statistically significant, a variable had to present both a p-value of t-test <0.05 and an FDR p-value of <0.10. A trend of statistical significance was defined as either a p-value of t-test <0.05, or a p-value of <0.05 in the multivariate logistic regression models adjusted for age, sex, and statin treatment.
Fold changes were calculated using the median intensities of two CACS classes at a time. They were calculated as the highest median intensity among the two classes divided by the lowest of them. In case the class with lowest CACS has highest median intensity, the value is multiplied by −1.
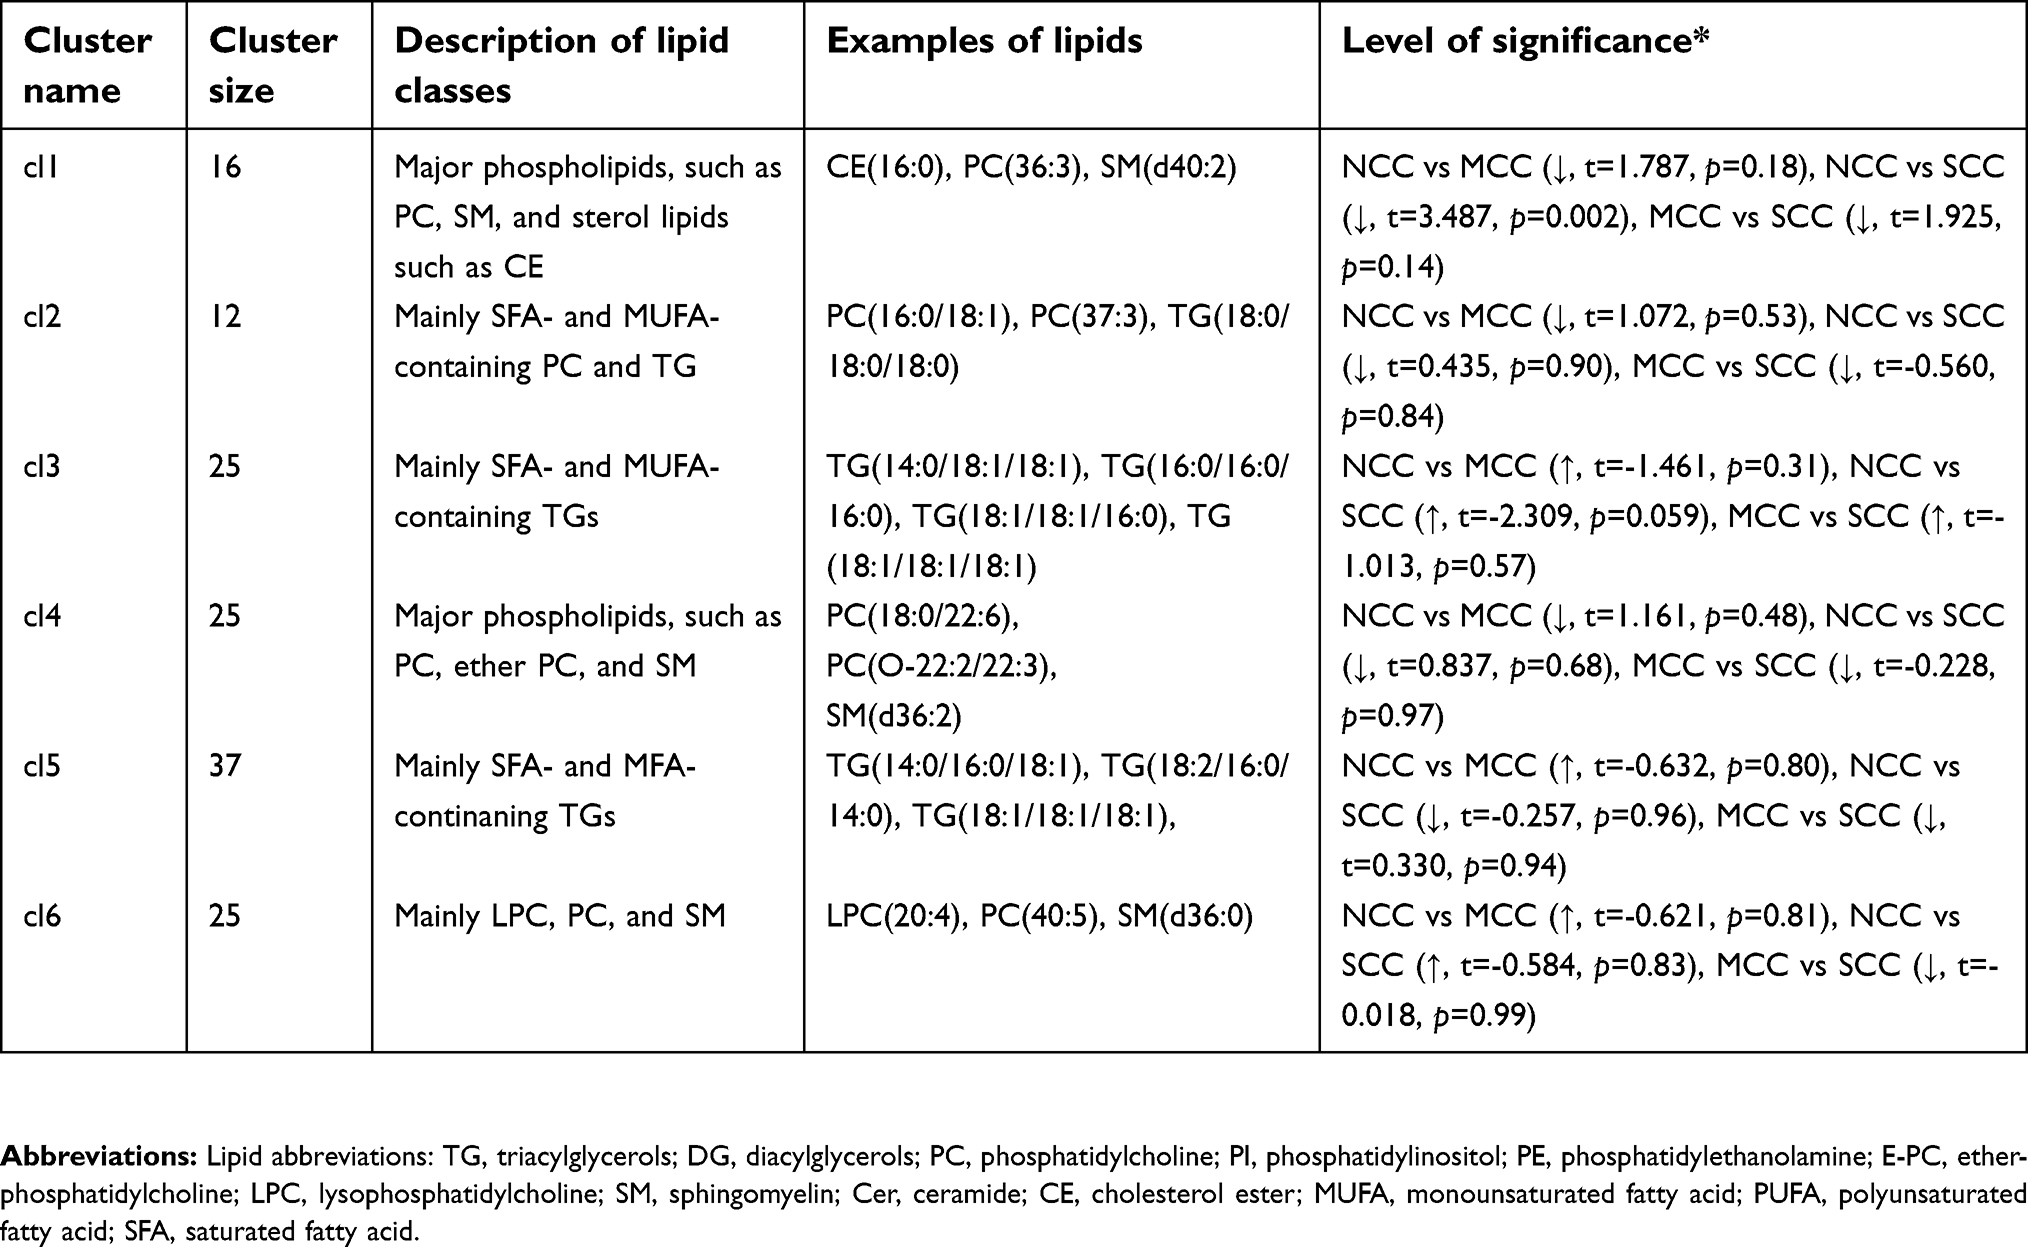
For cluster analysis, ESI+ data were scaled to zero mean and all variables were normalized to unit variance. K-means clustering was applied, to the scaled data, with cluster numbers based on silhouette scores, to group lipids with similar profiles across all samples. The analysis was performed using R software, version 3 (R Foundation for Statistical Computing, Vienna, Austria) using function “kmeans” with the default algorithm.22 The number of clusters (cl) was determined to n=6, based on the silhouette score using package NbClust.23 ANOVA was applied to explain the average lipid profile in each lipid cluster by age and calcification group. The age-corrected average cluster profiles are visualized as barplot with grouped bars and 95% CIs, based on the Tukey adjustment.
Results
A summary of patient clinical characteristics is presented in Table 1. The median CACS for MCC and SCC was 50 and 801, respectively. Individuals with SCC were older (mean age 67.1 vs 60.8 years, p=<0.001) and they were more likely to be males (64.7 vs 26.6%, p=0.03) compared to NCC. They were also more likely to have hypercholesterolemia (100 vs 50.0%, p=<0.001), often on statin and aspirin treatment (88.2 vs 38.5%, p=<0.001 and 76.5 vs 42.3%, p=0.011, respectively) and had higher mean creatinine levels (85.2 vs 69.4 µmol/L, p=0.04) compared with NCC. There was no significant difference in the reported family history of CAD, frequency of smoking, diabetes mellitus, body mass index, and systolic or diastolic blood pressures (p=>0.05) between the two groups.
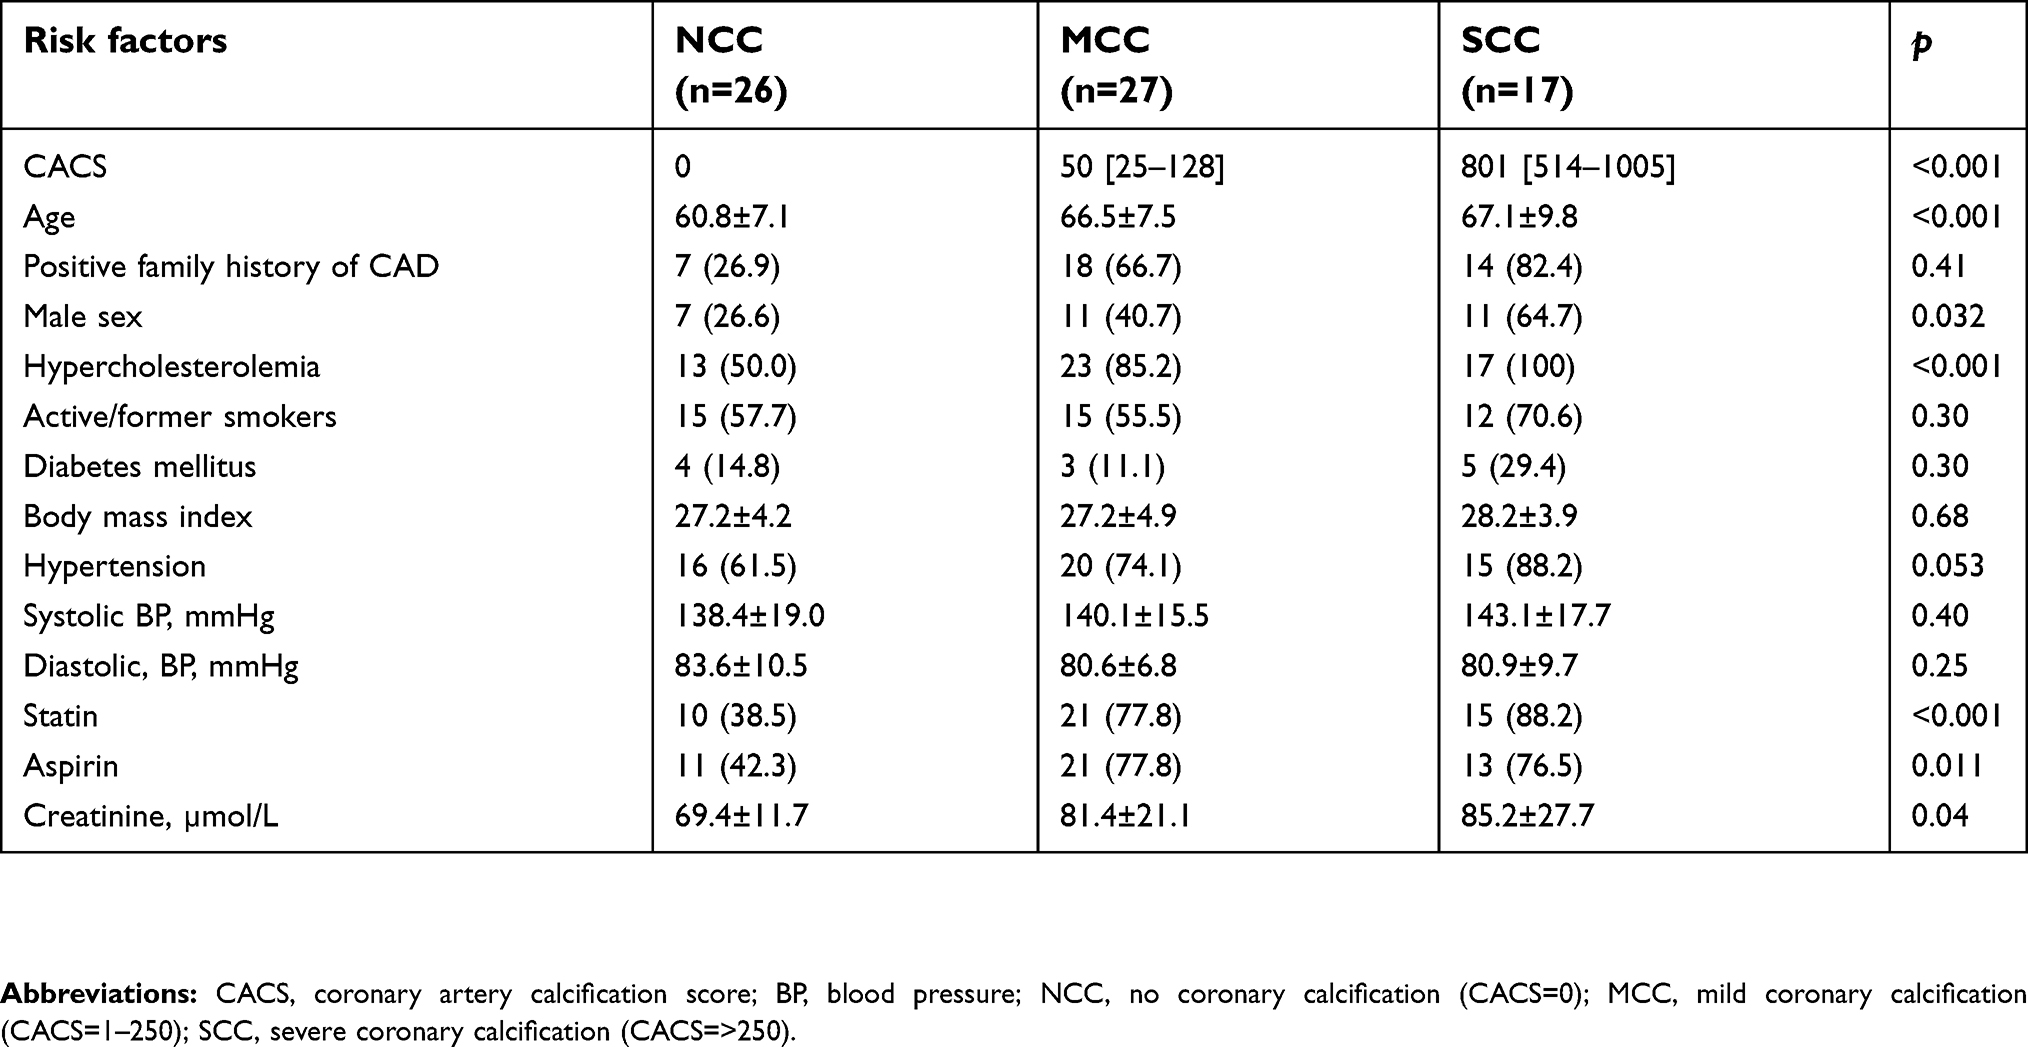 | Table 1 Clinical characteristics of patients according to severity of coronary artery calcification |
Identified lipids
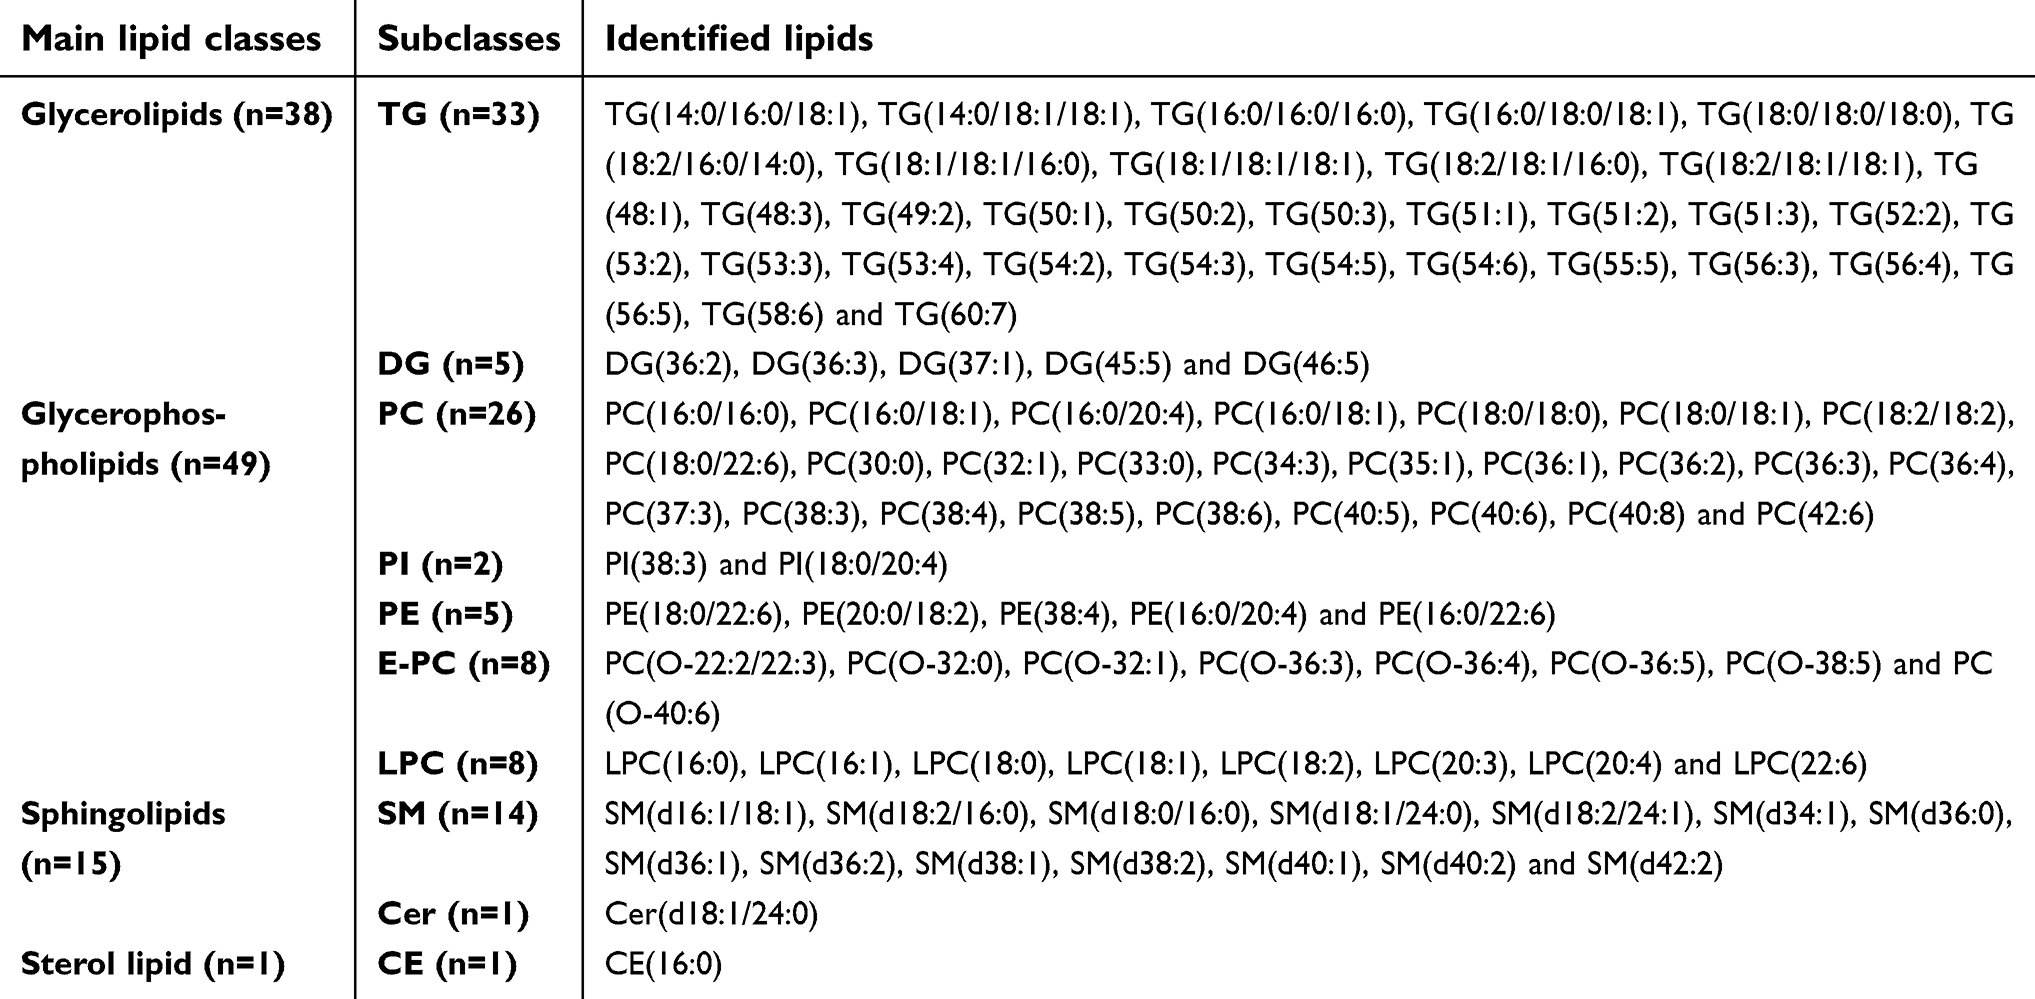
Details of the identified lipids in the main lipid classes are presented in Table S1. We identified a total of 103 lipids within the glycerolipid, glycerophospholipid, sphingolipid, and sterol lipid classes; specifically, 38 glycerolipids (33 TGs and 5 diacylglycerides [DG]), 49 glycerophospholipid (26 PC, 2 PI, 5 PE, 8 ether phosphatidylcholines [O-PC], 8 lyso-phosphatidylcholines [LPC]), 15 sphingolipid (14 SM, 1 Cer) and 1 sterol lipid classes (1 cholesteryl ester [CE]).
Overview of CAC classes using PCA
The results of PCA in positive and negative mode of the three groups (NCC, MCC, and SCC) are shown in Figure S1. In model A of ESI− including the three classes, there was a tendency toward a difference between NCC and SCC, while MCC class has a less evident boundary. That difference was more visible in model B when only classes NCC and SCC were modeled together. The lipids detected with ESI+ did not show a class separation in any of the models (C and D). The OPLS-DA model was not significant in ESI+ for SCC vs NCC (Table S2). As expected by inspection of the PCA results, the strongest OPLS-DA model was for the NCC vs SCC in ESI−. The model was significant based on CV-ANOVA (p=0.006) and the permutation test (p=0.004). OPLS-DA of MCC vs SCC in ESI− showed a weak model that was significant according to the permutation test (p=0.031) but not according to the CV-ANOVA (p=0.306). The weakest model in ESI− was observed for NCC vs MCC and was not significant by CV-ANOVA and permutation test. The model in ESI+ was not significant for NCC vs MCC. Inspection of the OPLS-DA loadings (not shown) showed results similar to the ones obtained using t-test.
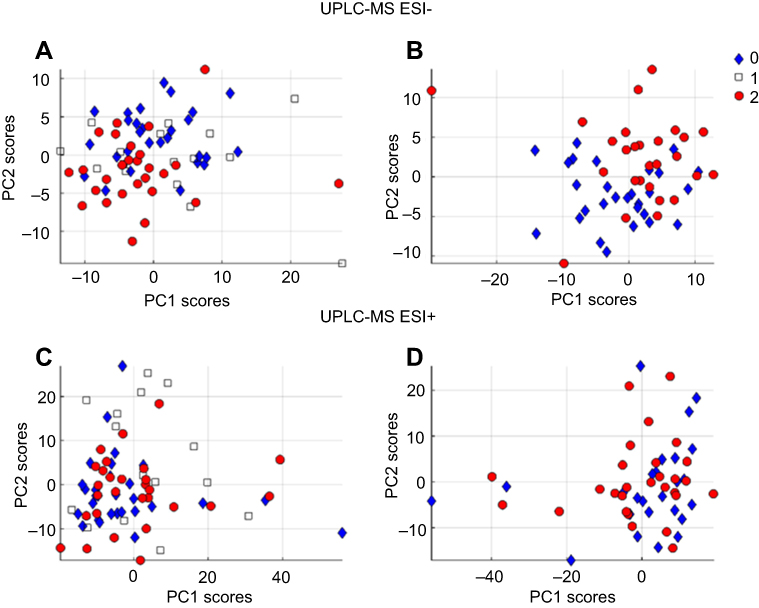 | Figure S1 PCA) score plots of: (A) PCA on negative mode of no coronary calcification (0), mild coronary calcification (1), and severe coronary calcification (2) groups. (B) PCA on negative mode data with NCC and SCC groups. (C) PCA on positive mode of NCC, MCC,and SCC groups. (D) PCA on positive mode of NCC and SCC. Abbreviations: PCA, principal components analysis; NCC, no coronary calcification; SCC, small coronary calcification; MCC, mild coronary calcification |
SCC vs NCC
PC(16:0/20:4) was higher in SCC compared to NCC (p=<0.001), even after accounting for FDR and the adjusted logistic regression model (Table 2). PC(18:2/18:2), PC(36:3), and PE(20:0/18:2) were lower in SCC in both the adjusted models and after FDR correction compared with NCC (Table 2).
 | Table 2 Identified lipids in main lipid classes with their corresponding subclasses |
There was no significant differences in the levels of the identified TGs (Table 2); however, some trends of altered levels in the clustering analysis (Figure 1; Table S3) were found, when comparing the SCC and NCC groups. A trend toward higher levels of cl3 containing lipids with mainly saturated and monounsaturated FA TGs in SCC compared to NCC was observed (p=0.059).
 | Figure 1 Mean lipid levels within each cluster presented as grouped barplots in no coronary calcification (0), mild coronary calcification (1), and severe coronary calcification (2). Positive mode data were obtained from lipidomics (UHPLC-MS) platforms. Error bars show Tukey-adjusted 95% CIs (*p=0.002 for the post-hoc test between subgroup 0 and 2). |
A trend toward lower levels of DG(36:2) and DG(36:3) in SCC compared with NCC was observed; however, these differences were not significant after FDR correction or in the adjusted models (Table 2). There was a trend for lower SM(d:34:1) and Cer(d18:1/24:0) in SCC compared to NCC (Table 2), which lost its significance in the adjusted model. CE(16:0) was lower in SCC compared to NCC, which lost significance after FDR correction (Table 2). In the clustering analysis, significantly lower levels of lipids (major phospholipids and cholesterol esters) in cl1 were found in SCC compared to NCC (p=0.002, Figure 1, Table S3).
SCC vs MCC
PC(16:0/20:4) was significantly higher in SCC compared to MCC even in the adjusted model and after FDR correction (Table 2). In contrast, PC(18:2/18:2) was lower in SCC compared to MCC. PC(32:1), PC(33:0), PC(35:1), and PC(38:4) were lower in SCC compared to MCC in the adjusted models but not after FDR correction. PE(20:0/18:2) had only a tendency to be lower in SCC (Table 2). Lower levels of SM(d18:2/24:1) and SM(d36:2) were found in SCC using the adjusted models but not following FDR correction (Table 2).
TG(49:2), TG(51:1), TG(54:5), and TG(56:8) tended to be lower in SCC compared to MCC (Table 2, Figure 2please relace figure 2 with the uploaded one). Although the difference of TG(51:1) between groups was significant in the adjusted model, none of the TGs was significantly different between groups after FDR correction. Similarly, DG(37:1) was lower in SCC compared to MCC, in the adjusted model, but not after FDR correction.
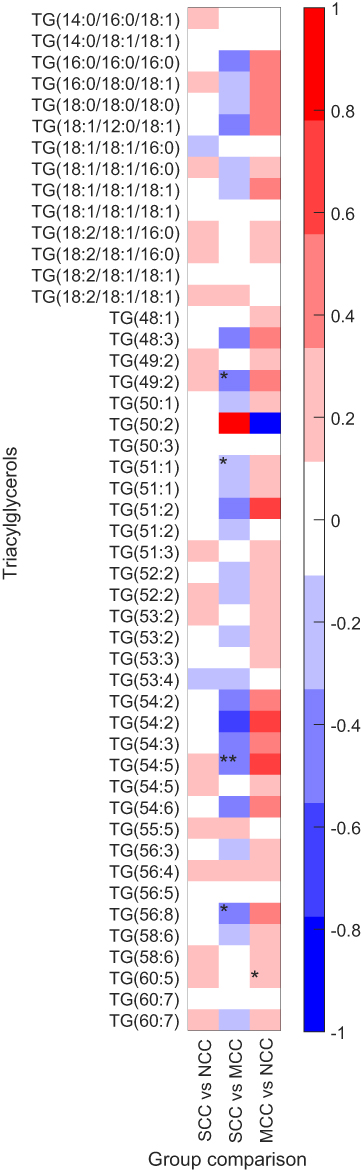 | Figure 2 Differences in triacylglycerol medians between SCC vs NCC, SCC vs MCC and MCC vs NCC. Data were log2-transformed previous to calculation.*p-value (unpaired t-test)<0.05. **p-value of logistic regression model adjusted for age, sex, and statin treatment <0.05.Abbreviations: TG, triacylglycerol, NCC, no coronary calcification (CACS=0); MCC, mild coronary calcification (CACS=1–250); SCC, severe coronary calcification (CACS=>250). |
MCC vs NCC
PC(16:0/20:4), PC(18:0/18:0), PC(30:0), PC(32:1), PC(33:0), PC(34:3), PC(35:1), PC(36:1), PC(37:3), PC(38:4), PC(40:5), and PC(40:8) were higher in MCC compared with NCC, but not after FDR correction. Only PC(40:5) level was different in the adjusted model.
SM(d18:0/16:0) and SM(d36:2) had only a tendency to be higher in MCC compared to NCC.
There were no differences in TG level between groups, although a trend for higher levels of TG(60:5) and DG(37:1) was observed in MCC (Table 2). DG(45:5) and DG(46:5) were lower in MCC compared to NCC in the adjusted model but not following FDR correction.
Discussion
In the present study, we investigated the lipidome of patients with no prior coronary events, angiographically nonobstructive CAD with various degrees of CAC, a marker of subclinical atherosclerosis, using the lipidomics technology. 103 lipids were identified within four main lipid classes, specifically 38 glycerolipids, 49 glycerophospholipids, 15 sphingolipids, and 1 sterol lipid. After adjustment for FDR and age, sex and statin treatment in the multivariate logistic regression model, only PC(16:0/20:4), PC18:2/18:2), PC(36:3) and PE(20:0/18:2), significantly discriminated patients with severe from patients with no calcification. If a relationship is found between any of the lipid species and CAC severity, it could conceptually be used as a biomarker for CAC severity, thus saving patients significant radiation and health care resources.
PEs belong to glycerophospholipid class, and they are consistently found on the inner leaflet of cell membranes and are the second most abundant phospholipid class, making up approximately 15–25% of the total phospholipids in mammalian cells. Functionally, they are associated with protein biogenesis, oxidative phosphorylation, membrane fusion, mitochondrial stability, and autophagy. Autophagy is a mechanism that involves breakdown of cellular components by lysosomes.24 The major subtype of autophagy is macroautophagy, in which, cytoplasmic content is sequestrated into a double membrane vesicle (autophagosome) that fuses with a lysosome for degradation and recycling. In atherosclerotic plaques, autophagosomes are presented in increased numbers in macrophages and is thought to play a protective role.25 The exact protective mechanism of autophagy in atherosclerosis is not entirely clear; however, mechanisms involving hydrolysis of stored cholesteryl ester droplets in macrophages and cholesterol efflux have been suggested.26 Deficiency of intracellular PE has been associated with a dysfunction of autophagy and formation of reactive oxygen species.27 Interestingly, we found lower levels of PE(20:0/18:2) in SCC compared to NCC patients. This suggests that the calcification process may be associated with dysfunction in autophagy and formation of reactive oxygen species.
PCs are also members of the glycerophospholipid class, and they are major components of cell membrane and are also involved in cell signaling and metabolism. Dysregulation of PC levels and increased activity and mass of PLA2 (enzyme that breaks down PC into a FAC and a lysophosphatidic acid) have been shown to be associated with CAD and CAC.28–32 PLA2 is secreted by inflammatory cells and circulates in blood bound to lipoproteins of low-density lipoprotein (LDL) cholesterol and contributes to plaque instability. Targeted inhibitory therapies of PLA2 have recently been investigated, and high levels of PC(16:0/20:4) containing arachidonic acid were identified in SCC.33,34 Findings were reproduced independently by Imperial College London and Swedish metabolomics center.35 These results suggest that CAC is associated with an inflammatory process. Similarly, in this study, PC(16:0/20:4) was found at higher levels in SCC compared with NCC.
PC level, in particular PC(32:1), PC(33:0), PC(35:1), PC(36:1) and PC(36:3) had a trend of an inverse relationship with CAC, a finding supported by previous studies that showed lower levels of the same number of carbon atoms containing PCs associated with cardiovascular disease.36–39 There was also, a trend of higher level of LPC(18:0) and LPC(22:6) and lower levels of LPC(16:0), LPC(16:1), LPC(18:1), LPC(18:2), LPC(20:3), and LPC(20:4) in SCC, again supported by similar findings that showed lower levels of LPC(16:0), LPC(18:2) and LPC(20:4) associated with CVD.39,40
CAC has been shown to be associated with dyslipidemia, for example total cholesterol and total TG, but not with any specific individual TGs. TGs have been shown to be related to CAD both in meta-analyses and in genetic studies.10–12,13,15,41 High TG levels are involved in the metabolic syndrome which is associated with a proinflammatory and prothrombotic state. Stored TGs in adipose tissue, skeletal muscle, and liver can be hydrolyzed into FFAs, which may promote atherosclerotic lesions through endothelial dysfunction, inflammation, and thrombosis mechanisms.42–45 In this study, we identified 33 different TG species with various FA composition and arrangement. We have found only a trend for higher levels of saturated and monounsaturated TGs (mainly 16-carbon fatty acyl, palmitic acid), a known mediator for arterial calcification.46 Although four identified TGs were lower in SCC compared to MCC, these differences did not hold after accounting for false discovery rate. TG with fatty acyls of 56 carbons and 6 double bonds (TG(56:6)) level has been shown to correlate with CAD development in diabetics.47 Bruneck study demonstrated that the addition of three lipids, including a TG with 54 carbons (TG(54:2)), to FRS improves the risk prediction of incident CVD events.48 TGs with low carbon number and double-bond content (eg, saturated and monounsaturated FAC) strongly predicted CAD events, particularly in type II diabetics.49
DGs are members of glycerolipid class and are structurally composed of two FAC linked to a glycerol molecule. They are produced on the plasma membrane by enzymatic hydrolysis of PI 4,5-bisphosphate and serve as intracellular signaling lipids that trigger proliferation, differentiation, migration, survival, and apoptosis.50 While inositol triphosphate triggers calcium ion mobilization from the smooth endoplasmic reticulum, DGs activate protein kinase C (PKC) which prevents vascular calcification.50 Indeed, our SCC patients showed a tendency to have lower levels of DG(36:2), DG(36:3), DG(37:1), DG(45:5) and DG(46:5).
Clinical implications
It is clinically acceptable that age, particularly in men, determines the formation of CAC irrespective of the presence or severity of other conventional risk factors for atherosclerosis.51 Our results show that specific lipids were able to differentiate between extremes of CAC severity. Specific biochemical mechanisms for CAC are likely to be invoked, a concept that needs to be further investigated. Once established specific treatment measures could be designed in order to avoid the development of severe hardening of arterial walls with their impact on coronary flow reserve and symptoms. Nevertheless, if identified and revalidated, biomarkers could assist in better stratification of patients with severe coronary calcification.
Limitations
This study has several limitations. First, there was a significant difference in levels of statin treatment between the CAC groups. Statins inhibit the rate-limiting step of cholesterol synthesis and have in previous studies been shown to be associated with CAC.52 Nevertheless, statins can alter the levels of individual lipid species; however, there is not much literature available of the changes in individual (intact) lipid species in circulation. Most studies have looked at the total FA amounts, showing that statin treatment lowers the overall FA levels, particularly in LDL fraction.53 As we observed both negative and positive associations of specific lipids and CAC, it is probable that some of the changes are caused by the CAC, rather than showing the effect of the statin treatment. However, it is difficult to fully evaluate whether the identified lipids that significantly differentiated patients with severe CAC and controls, was due to a difference in the underlying atherosclerotic process or statin treatment. Despite that this relationship remained significant after adjustment for both false discovery rate and statin treatment. Second, whether the identified potential biomarkers are directly causally related to calcification or if they are merely association, cannot be established without reproducing the same findings in a larger cohort, with targeted approaches. Finally, the trends toward lower levels of four TGs in severe CAC compared to mild CAC limits its clinical relevance, particularly because of the small samples studied.
Conclusion
In this study, we investigated the lipidome of patients with coronary calcification. Our results suggest that the coronary calcification process is associated with dysfunction in autophagy. The lipidomic biomarkers revealed in this study may aid in better assessment of patients with subclinical coronary artery disease.
Acknowledgments
This study was supported by grants from the Swedish Heart and Lung Foundation. We are very grateful to all the participants in the this study and the research staff at the Department of Cardiology, Umeå University Hospital.
Disclosure
The authors report no conflicts of interest in this work.
References
1. Szummer K, Wallentin L, Lindhagen L, et al. Improved outcomes in patients with ST-elevation myocardial infarction during the last 20 years are related to implementation of evidence-based treatments: experiences from the SWEDEHEART registry 1995–2014. Eur Heart J. 2017;38(41):3056–3065. doi:10.1093/eurheartj/ehx515
2. Yusuf S, Islam S, Chow CK, et al. Use of secondary prevention drugs for cardiovascular disease in the community in high-income, middle-income, and low-income countries (the PURE Study): a prospective epidemiological survey. Lancet. 2011;378(9798):1231–1243. doi:10.1016/S0140-6736(11)61215-4
3. Tunstall-Pedoe H, Vanuzzo D, Hobbs M, et al. Estimation of contribution of changes in coronary care to improving survival, event rates, and coronary heart disease mortality across the WHO MONICA Project populations. Lancet. 2000;355(9205):688–700.
4. Finegold JA, Asaria P, Francis DP. Mortality from ischaemic heart disease by country, region, and age: statistics from World Health Organisation and United Nations. Int J Cardiol. 2013;168(2):934–945. doi:10.1016/j.ijcard.2012.10.046
5. D’Agostino RB, Vasan RS, Pencina MJ, et al. General cardiovascular risk profile for use in primary care: the Framingham Heart Study. Circulation. 2008;117(6):743–753. doi:10.1161/CIRCULATIONAHA.107.699579
6. Goff DC
7. Peters SA, Den Ruijter HM, Bots ML, Moons KG. Improvements in risk stratification for the occurrence of cardiovascular disease by imaging subclinical atherosclerosis: a systematic review. Heart. 2012;98(3):177–184. doi:10.1136/heartjnl-2011-300747
8. Qamar A, Khetarpal SA, Khera AV, Qasim A, Rader DJ, Reilly MP. Plasma apolipoprotein C-III levels, triglycerides, and coronary artery calcification in type 2 diabetics. Arterioscler Thromb Vasc Biol. 2015;35(8):1880–1888. doi:10.1161/ATVBAHA.115.305415
9. Rajamannan NM, Moura L. The lipid hypothesis in calcific aortic valve disease: the role of the multi-ethnic study of atherosclerosis. Arterioscler Thromb Vasc Biol. 2016;36(5):774–776. doi:10.1161/ATVBAHA.116.307435
10. Wong ND, Kouwabunpat D, Vo AN, et al. Coronary calcium and atherosclerosis by ultrafast computed tomography in asymptomatic men and women: relation to age and risk factors. Am Heart J. 1994;127(2):422–430.
11. Mahoney LT, Burns TL, Stanford W, et al. Coronary risk factors measured in childhood and young adult life are associated with coronary artery calcification in young adults: the Muscatine Study. J Am Coll Cardiol. 1996;27(2):277–284.
12. Paramsothy P, Katz R, Owens DS, Burke GL, Probstfield JL, O’Brien KD. Age-modification of lipoprotein, lipid, and lipoprotein ratio-associated risk for coronary artery calcium (from the Multi-Ethnic Study of Atherosclerosis [MESA]). Am J Cardiol. 2010;105(3):352–358. doi:10.1016/j.amjcard.2009.09.040
13. Sarwar N, Danesh J, Eiriksdottir G, et al. Triglycerides and the risk of coronary heart disease: 10,158 incident cases among 262,525 participants in 29 Western prospective studies. Circulation. 2007;115(4):450–458. doi:10.1161/CIRCULATIONAHA.106.637793
14. Do R, Willer CJ, Schmidt EM, et al. Common variants associated with plasma triglycerides and risk for coronary artery disease. Nat Genet. 2013;45(11):1345–1352. doi:10.1038/ng.2795
15. Jørgensen AB, Frikke-Schmidt R, West AS, Grande P, Nordestgaard BG, Tybjærg-Hansen A. Genetically elevated non-fasting triglycerides and calculated remnant cholesterol as causal risk factors for myocardial infarction. Eur Heart J. 2013;34(24):1826–1833. doi:10.1093/eurheartj/ehs431
16. Djekic D, Nicoll R, Novo M, Henein M. Metabolomics in atherosclerosis. IJC Metab Endocr. 2015;8:26–30. doi:10.1016/j.ijcme.2014.11.004
17. Janowitz WR, Agatston AS, Viamonte M. Comparison of serial quantitative evaluation of calcified coronary artery plaque by ultrafast computed tomography in persons with and without obstructive coronary artery disease. Am J Cardiol. 1991;68(1):1–6.
18. Pluskal T, Castillo S, Villar-Briones A, Oresic M. MZmine 2: modular framework for processing, visualizing, and analyzing mass spectrometry-based molecular profile data. BMC Bioinformatics. 2010;11:395. doi:10.1186/1471-2105-11-395
19. Bowden JA, Heckert A, Ulmer CZ, et al. Harmonizing lipidomics: NIST interlaboratory comparison exercise for lipidomics using SRM 1950-Metabolites in Frozen Human Plasma. J Lipid Res. 2017;58(12):2275–2288. doi:10.1194/jlr.M079012
20. Jolliffe IT. Principal Component Analysis.
21. Benjamini Y, Hochberg Y. Controlling the false discovery rate: a practical and powerful approach to multiple testing. J R Stat Soc Series B Stat Methodol. 1995;57(1):289–300. doi:10.1111/rssb.1995.57.issue-1
22. Hartigan JA, Wong MA. A K-means clustering algorithm. J R Stat Soc Ser C Appl Stat. 1979;28:100–108.
23. Rousseeuw PJ. Silhouettes: a graphical aid to the interpretation and validation of cluster analysis. J Comput Appl Math. 1987;20:53–65. doi:10.1016/0377-0427(87)90125-7
24. Choi AM, Ryter SW, Levine B. Autophagy in human health and disease. N Engl J Med. 2013;368(19):1845–1846. doi:10.1056/NEJMc1303158
25. Verheye S, Martinet W, Kockx MM, et al. Selective clearance of macrophages in atherosclerotic plaques by autophagy. J Am Coll Cardiol. 2007;49(6):706–715. doi:10.1016/j.jacc.2006.09.047
26. Liao X, Sluimer JC, Wang Y, et al. Macrophage autophagy plays a protective role in advanced atherosclerosis. Cell Metab. 2012;15(4):545–553. doi:10.1016/j.cmet.2012.01.022
27. Rockenfeller P, Koska M, Pietrocola F, et al. Phosphatidylethanolamine positively regulates autophagy and longevity. Cell Death Differ. 2015;22:499. doi:10.1038/cdd.2014.219
28. Akiba S, Yoneda Y, Ohno S, Nemoto M, Sato T. Oxidized LDL activates phospholipase A2 to supply fatty acids required for cholesterol esterification. J Lipid Res. 2003;44(9):1676–1685. doi:10.1194/jlr.M300012-JLR200
29. Brilakis ES, Khera A, Saeed B, et al. Association of lipoprotein-associated phospholipase A2 mass and activity with coronary and aortic atherosclerosis: findings from the Dallas Heart Study. Clin Chem. 2008;54(12):1975–1981. doi:10.1373/clinchem.2008.107359
30. Oei HH, van der Meer IM, Hofman A, et al. Lipoprotein-associated phospholipase A2 activity is associated with risk of coronary heart disease and ischemic stroke: the Rotterdam Study. Circulation. 2005;111(5):570–575. doi:10.1161/01.CIR.0000154553.12214.CD
31. Pokharel Y, Sun W, Polfus LM, et al. Lipoprotein associated phospholipase A2 activity, apolipoprotein C3 loss-of-function variants and cardiovascular disease: the Atherosclerosis Risk in Communities Study. Atherosclerosis. 2015;241(2):641–648. doi:10.1016/j.atherosclerosis.2015.06.033
32. Garg PK, McClelland RL, Jenny NS, et al. Lipoprotein-associated phospholipase A2 and risk of incident cardiovascular disease in a multi-ethnic cohort: the multi ethnic study of atherosclerosis. Atherosclerosis. 2015;241(1):176–182. doi:10.1016/j.atherosclerosis.2015.05.006
33. White HD, Held C, Stewart R, et al. Darapladib for preventing ischemic events in stable coronary heart disease. N Engl J Med. 2014;370(18):1702–1711. doi:10.1056/NEJMoa1315878
34. Vorkas PA, Isaac G, Holmgren A, et al. Perturbations in fatty acid metabolism and apoptosis are manifested in calcific coronary artery disease: an exploratory lipidomic study. Int J Cardiol. 2015;197:192–199. doi:10.1016/j.ijcard.2015.06.048
35. Djekic D, Pinto R, Vorkas PA, Henein MY. Replication of LC-MS untargeted lipidomics results in patients with calcific coronary disease: an interlaboratory reproducibility study. Int J Cardiol. 2016;222:1042–1048. doi:10.1016/j.ijcard.2016.07.214
36. Meikle PJ, Wong G, Tsorotes D, et al. Plasma lipidomic analysis of stable and unstable coronary artery disease. Arterioscler Thromb Vasc Biol. 2011;31(11):2723–2732. doi:10.1161/ATVBAHA.111.234096
37. Sutter I, Klingenberg R, Othman A, et al. Decreased phosphatidylcholine plasmalogens–a putative novel lipid signature in patients with stable coronary artery disease and acute myocardial infarction. Atherosclerosis. 2016;246:130–140. doi:10.1016/j.atherosclerosis.2016.01.003
38. Sousa B, Melo T, Campos A, et al. Alteration in phospholipidome profile of myoblast H9c2 cell line in a model of myocardium starvation and ischemia. J Cell Physiol. 2016;231(10):2266–2274. doi:10.1002/jcp.25344
39. Paapstel K, Kals J, Eha J, et al. Inverse relations of serum phosphatidylcholines and lysophosphatidylcholines with vascular damage and heart rate in patients with atherosclerosis. Nutr Metab Cardiovasc Dis. 2018;28(1):44–52. doi:10.1016/j.numecd.2017.07.011
40. Fernandez C, Sandin M, Sampaio JL, et al. Plasma lipid composition and risk of developing cardiovascular disease. PLoS One. 2013;8(8):e71846. doi:10.1371/journal.pone.0071846
41. Mahendran Y, Vangipurapu J, Cederberg H, et al. Association of ketone body levels with hyperglycemia and type 2 diabetes in 9,398 Finnish men. Diabetes. 2013;62(10):3618–3626. doi:10.2337/db12-1363
42. Braun JE, Severson DL. Regulation of the synthesis, processing and translocation of lipoprotein lipase. Biochem J. 1992;287(Pt 2):337–347.
43. Mathew M, Tay E, Cusi K. Elevated plasma free fatty acids increase cardiovascular risk by inducing plasma biomarkers of endothelial activation, myeloperoxidase and PAI-1 in healthy subjects. Cardiovasc Diabetol. 2010;9:9. doi:10.1186/1475-2840-9-9
44. Barazzoni R, Zanetti M, Gortan Cappellari G, et al. Fatty acids acutely enhance insulin-induced oxidative stress and cause insulin resistance by increasing mitochondrial reactive oxygen species (ROS) generation and nuclear factor-κB inhibitor (IκB)-nuclear factor-κB (NFκB) activation in rat muscle, in the absence of mitochondrial dysfunction. Diabetologia. 2012;55(3):773–782. doi:10.1007/s00125-011-2396-x
45. Boden G, She P, Mozzoli M, et al. Free fatty acids produce insulin resistance and activate the proinflammatory nuclear factor-kappaB pathway in rat liver. Diabetes. 2005;54(12):3458–3465.
46. Brodeur MR, Bouvet C, Barrette M, Moreau P. Palmitic acid increases medial calcification by inducing oxidative stress. J Vasc Res. 2013;50(5):430–441. doi:10.1159/000354235
47. Alshehry ZH, Mundra PA, Barlow CK, et al. Plasma lipidomic profiles improve on traditional risk factors for the prediction of cardiovascular events in type 2 diabetes mellitus. Circulation. 2016;134(21):1637–1650. doi:10.1161/CIRCULATIONAHA.116.023233
48. Stegemann C, Pechlaner R, Willeit P, et al. Lipidomics profiling and risk of cardiovascular disease in the prospective population-based Bruneck study. Circulation. 2014;129(18):1821–1831. doi:10.1161/CIRCULATIONAHA.113.002500
49. Rhee EP, Cheng S, Larson MG, et al. Lipid profiling identifies a triacylglycerol signature of insulin resistance and improves diabetes prediction in humans. J Clin Invest. 2011;121(4):1402–1411. doi:10.1172/JCI44442
50. Borland SJ, Morris TG, Borland SC, et al. Regulation of vascular smooth muscle cell calcification by syndecan-4/FGF-2/PKCα signalling and cross-talk with TGFβ. Cardiovasc Res. 2017;113(13):1639–1652. doi:10.1093/cvr/cvx178
51. Nicoll R, Wiklund U, Zhao Y, et al. Gender and age effects on risk factor-based prediction of coronary artery calcium in symptomatic patients: a Euro-CCAD study. Atherosclerosis. 2016;252:32–39. doi:10.1016/j.atherosclerosis.2016.07.906
52. Djekic D, Angerås O, Lappas G, et al. Impact of socioeconomic status on coronary artery calcification. Eur J Prev Cardiol. 2018;25(16):1756–1764. doi:10.1177/2047487318792103
53. Meikle PJ, Wong G, Barlow CK, Kingwell BA. Lipidomics: potential role in risk prediction and therapeutic monitoring for diabetes and cardiovascular disease. Pharmacol Ther. 2014;143(1):12–23. doi:10.1016/j.pharmthera.2014.02.001
Supplementary materials
 | Table S1 Identified lipids in main lipid classes with their corresponding subclasses |
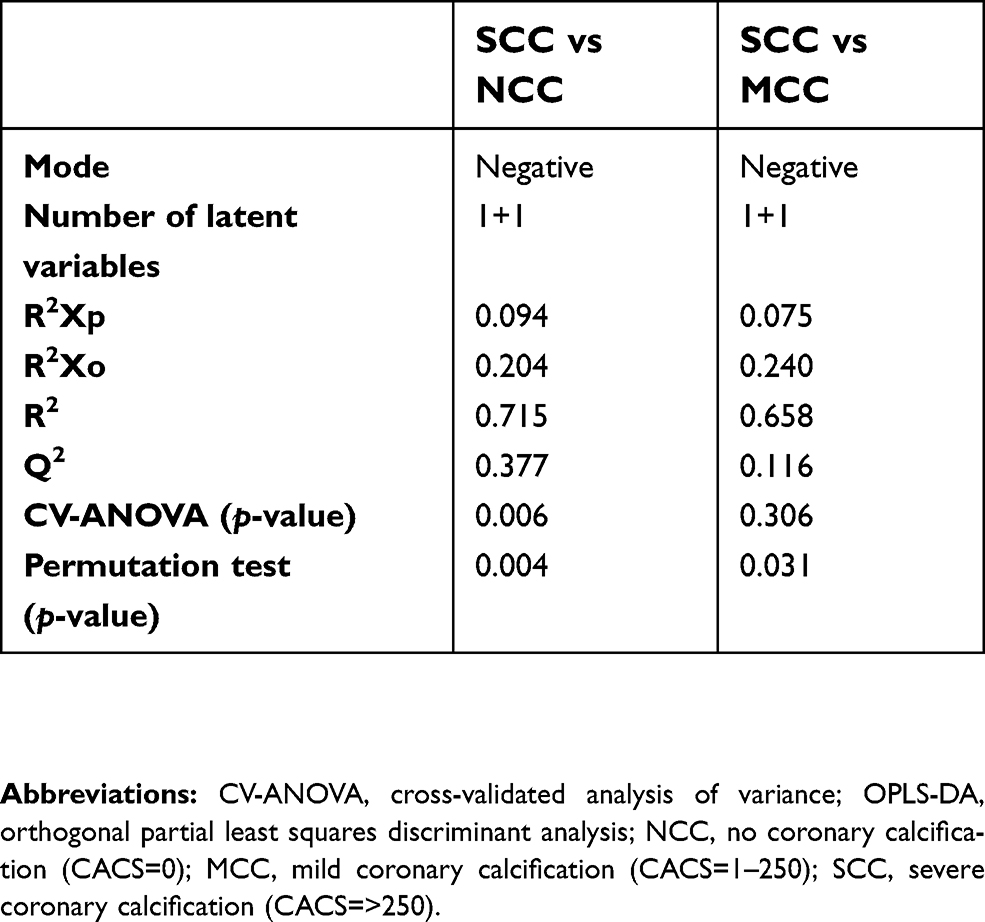 | Table S2 Statistics for OPLS-DA models of NCC vs SCC and MCC vs SCC using the negative mode data. |
 | Table S3 Description of lipid clusters obtained from positive mode data |
 © 2019 The Author(s). This work is published and licensed by Dove Medical Press Limited. The
full terms of this license are available at https://www.dovepress.com/terms
and incorporate the Creative Commons Attribution
- Non Commercial (unported, 3.0) License.
By accessing the work you hereby accept the Terms. Non-commercial uses of the work are permitted
without any further permission from Dove Medical Press Limited, provided the work is properly
attributed. For permission for commercial use of this work, please see paragraphs 4.2 and 5 of our Terms.
© 2019 The Author(s). This work is published and licensed by Dove Medical Press Limited. The
full terms of this license are available at https://www.dovepress.com/terms
and incorporate the Creative Commons Attribution
- Non Commercial (unported, 3.0) License.
By accessing the work you hereby accept the Terms. Non-commercial uses of the work are permitted
without any further permission from Dove Medical Press Limited, provided the work is properly
attributed. For permission for commercial use of this work, please see paragraphs 4.2 and 5 of our Terms.