
Back to Journals » Diabetes, Metabolic Syndrome and Obesity » Volume 18
Serum Soluble Asialoglycoprotein Receptor 1: A Potential Predictor Marker Linked to Type 2 Diabetes Mellitus, Demonstrating Positive Correlation With High Sensitive C-Reactive Protein
Authors Zhu H  , Zhong Z, Zhao G, Cao Y, Liu W, Guo Y, Jin J
Received 31 December 2024
Accepted for publication 24 February 2025
Published 28 February 2025 Volume 2025:18 Pages 663—675
DOI https://doi.org/10.2147/DMSO.S511208
Checked for plagiarism Yes
Review by Single anonymous peer review
Peer reviewer comments 3
Editor who approved publication: Dr Rebecca Baqiyyah Conway
Haifeng Zhu,1,* Ziyi Zhong,2,* Gaonian Zhao,1,* Yuan Cao,1 Wei Liu,1 Yawen Guo,1 Jing Jin1
1Rehabilitation Medicine Center, Taizhou People’s Hospital, Taizhou City, Jiangsu Province, People’s Republic of China; 2Endocrinology Department, Nanjing First Hospital, Nanjing City, Jiangsu Province, People’s Republic of China
*These authors contributed equally to this work
Correspondence: Jing Jin, Email [email protected]
Background: Asialoglycoprotein receptor 1 (ASGR1) deficiency has been implicated in enhancing liver insulin sensitivity and reducing systemic insulin resistance, thus highlighting its pivotal role in glucose metabolism. However, the association between serum soluble asialoglycoprotein receptor 1 (sASGR1) and type 2 diabetes mellitus (T2DM) remains elusive. Therefore, we conducted a study to delve into this association.
Methods: From July to October 2024, 220 newly diagnosed T2DM patients and an equal number of matched controls with normal glucose tolerance (NGT) were enrolled. Serum sASGR1 levels were quantified using ELISA, and the carotid artery and liver were assessed with ultrasound imaging.
Results: The median serum sASGR1 level was significantly higher in the T2DM group (6.58 ng/mL) compared to the NGT group (5.26 ng/mL). Notably, no significant difference in sASGR1 levels was observed between individuals with and without carotid atherosclerosis or fatty liver. In the NGT group, sASGR1 levels exhibited a positive correlation with high-sensitivity C-reactive protein (hs-CRP) and interleukin-6 (IL-6). Among T2DM patients, sASGR1 levels were positively associated with estimated glomerular filtration rate (eGFR), insulin resistance (as measured by HOMA-IR), triglycerides (TG), and hs-CRP, but negatively associated with creatinine (Cr). The linear regression analysis identified Cr as an independent negative factor and hs-CRP as an independent positive factor of serum sASGR1 levels. Logistic regression analysis indicated that the highest sASGR1 group had significantly higher odds of developing T2DM compared to the lowest group, even after adjusting for potential confounders. However, this significance was attenuated after further adjustment for hs-CRP. The area under the receiver operating characteristic (ROC) curve for sASGR1 was 0.610.
Conclusion: Serum sASGR1 levels are elevated in newly diagnosed T2DM patients and correlate positively with hs-CRP. However, sASGR1 demonstrates limited predictive value for the onset of T2DM. Further research is warranted to explore the potential role of sASGR1 in renal function, blood lipids, liver health, and arteriosclerosis.
Keywords: asialoglycoprotein receptor 1, type 2 diabetes mellitus, high- sensitive C-reactive protein, clinical diabetes, serum level assessment
Introduction
Type 2 Diabetes Mellitus (T2DM), distinguished by insulin resistance and inadequate insulin secretion, represents a widespread chronic metabolic disorder across the globe.1,2 As lifestyles evolve and population aging accelerates, the incidence of T2DM is steadily climbing worldwide, posing substantial challenges to healthcare systems.3,4 It is well-established that T2DM not only disrupts blood glucose levels but also exhibits strong correlations with various metabolic abnormalities and complications, including cardiovascular disease, kidney disease, and retinopathy.5,6 The chronic inflammatory state that characterizes T2DM is a key contributor to these complications, underscoring the importance of understanding the inflammatory pathways involved.7,8
Although various glucose-lowering therapies are available for management of T2DM, their efficacy in achieving desired outcomes remains limited. Reports indicate that despite receiving standard treatment, over 50% patients fail to achieve the target level for glycated hemoglobin.9 Consequently, there is a pressing need to explore novel potential therapeutic targets. Cytokines, serving as crucial mediators in immune and metabolic regulation, have emerged as a prominent focus in diabetes research.10
Asialoglycoprotein receptor 1 (ASGR1), a receptor highly and selectively expressed on hepatocytes, has garnered attention in recent years for its potential roles in cholesterol metabolism and cardiovascular disease treatment.11,12 Its soluble form, sASGR1, is implicated in inflammatory cascades, serving as an immune mediator and potentially contributing to chronic inflammation in various diseases.13 Given the close link between T2DM and metabolic abnormalities, and its tendency to lead to chronic complications, especially those affecting lipid metabolism, cardiovascular health, and inflammation,14,15 it is fascinating to consider whether ASGR1 might also contribute to the pathophysiology of T2DM.
Fatty liver disease, which is often associated with T2DM and closely linked to inflammation, is characterized by the accumulation of fat in the liver. This condition can progress to more severe liver diseases.16,17 Similarly, atherosclerosis, a major complication of T2DM, involves the buildup of plaque in the arteries, resulting in reduced blood flow and an increased risk of cardiovascular events.18 Therefore, elucidating the role of ASGR1 in these processes not only enhances our understanding of the pathophysiology of T2DM but also offers potential for the development of novel therapeutic strategies to tackle the complex interactions between metabolic derangements, inflammation, fatty liver disease, and atherosclerosis.
Recent research has demonstrated that ASGR1 deficiency enhances liver insulin sensitivity and mitigates systemic insulin resistance,19 and is also associated with reduced atherosclerosis.20,21 The dual role of ASGR1 in hepatic metabolism22,23 highlights its significant involvement in glucose metabolism, fatty liver disease, and atherosclerosis. However, there is a paucity of reports on serum sASGR1 levels. To address this gap, we devised an experiment to explore the correlation between serum levels of sASGR1 and T2DM, and to examine how these levels change in the presence of fatty liver disease and carotid atherosclerosis.
Materials and Methods
Study Subjects
From July 2024 to October 2024, 220 patients newly diagnosed with T2DM were consecutively recruited as the case group from Taizhou People’s Hospital, while recruitment plans for participants were also announced at Taizhou Third People’s Hospital, Sixiang People’s Hospital, and Ruici Medical Center. During the same period, a control group of individuals with normal glucose tolerance (NGT), matched for gender and age, was recruited from the same centers that participated in the case group recruitment. Using PASS 15 and based on previously measured data, we estimated the sample size by setting α at 0.05, power at 0.8, and accounting for a 10% dropout rate, resulting in a minimum total sample size of 406 participants. The diagnosis of diabetes followed the 2024 criteria established by the American Diabetes Association (ADA).24 Diabetes was defined as a fasting blood glucose (FBG) level of ≥7.0 mmol/L, or a 2-hour plasma glucose (2hPG) level of ≥11.1 mmol/L during an oral glucose tolerance test (OGTT), or a glycated hemoglobin (HbA1c) level of ≥6.5%. NGT was defined as an FBG level of <5.6 mmol/L, a 2hPG level of <7.8 mmol/L, and an HbA1c level of <5.7%. Inclusion criteria encompassed adults aged between 18 and 80 years who had not taken any medication in the past month. Exclusion criteria encompassed individuals diagnosed with other types of diabetes, those aged below 18 or above 80 years, individuals with a BMI of ≥35 kg/m² or <18.5 kg/m², smokers, those consuming alcohol exceeding 140g per week for males or 70g per week for females, pregnant or lactating women, individuals with a NYHA heart function classification of 2–4, those with viral hepatitis, immune hepatitis, cirrhosis, transaminase levels exceeding three times the upper limit of normal, an estimated glomerular filtration rate (eGFR) of <60 mL/(min·1.73m²), cancer patients, those with infections, and individuals with diabetic ketoacidosis. Furthermore, to accurately identify and include suitable participants, and primarily to minimize the interference of type 1 diabetes, newly diagnosed diabetes patients were required to undergo a fasting C-peptide (CP) test. Patients with CP levels below 200 pmol/L, a threshold adopted from the latest guidelines to assist in distinguishing between diabetes types,24 were excluded from the study. Alcohol consumption was estimated using standard drink units, with participants reporting average frequency and amount per occasion. The eGFR was calculated using the CKD-EPI equation.25 The study was approved by the Clinical Research Ethics Committee of Taizhou People’s Hospital (ethics approval number: KY-2024-072-01). The protocol was registered on the Chinese Clinical Trial Registry (ChiCTR) platform with the registration number ChiCTR2400086076. Written informed consent was obtained from the study participants before their enrolment. It should be noted that the initial consent did not include ultrasound examinations. However, during the experiment, many participants expressed a keen interest in receiving additional ultrasound scans. In response, we made these scans available on a strictly voluntary basis, and participants were explicitly informed that they had the right to decline to share their scan data, even after undergoing the examination. This study was conducted in strict adherence to the ethical principles outlined in the Declaration of Helsinki. All participants provided informed consent, and their rights, privacy, and safety were protected throughout the research process.
Data Collection
The participants’ medical histories were collected through face-to-face interviews, with supplementary information gathered via telephone inquiries. Skilled nurses at the physical examination center of Taizhou People’s Hospital conducted anthropometric measurements, which included weight (W), height (H), waist circumference (WC), and hip circumference (HC). Body mass index (BMI) was calculated as W/H², and the waist/hip ratio (WHR) was determined by dividing WC by HC. Following a 15-minute rest, blood pressure was measured twice on the right upper arm, with systolic blood pressure (SBP) and diastolic blood pressure (DBP) calculated as the average of these two measurements. Venous blood samples were collected after an overnight fast lasting more than 10 hours. Biochemical analyses were conducted in the laboratory of Taizhou People’s Hospital. Serum levels of glutamic-pyruvic transaminase (ALT), creatinine (Cr), fasting blood glucose (FBG), total cholesterol (TC), triglycerides (TG), high-density lipoprotein cholesterol (HDL), low-density lipoprotein cholesterol (LDL), and high sensitive C-reactive protein (hs-CRP) were assayed using a fully automated biochemical analyzer (Beckman Coulter AU5800, Brea, USA). HbA1c was measured by high-performance liquid chromatography (TOSOH HLC-723G8, Tokyo, Japan). Serum insulin (INS) and CP concentrations were determined using the chemiluminescence particle immunoassay method, with reagent kits provided by Abbott GmbH (Germany, item numbers 3L53/09p36 and 8K41/04T75, respectively). Interleukin-6 (IL-6) and sASGR1 concentrations were measured using the ELISA method, with ELISA kits provided by JiangLai Biotechnology (Shanghai, China, item numbers JL14113 and JL41965, respectively). Insulin resistance (IR) was assessed using the Homeostatic Model Assessment for Insulin Resistance (HOMA-IR) formula: HOMA-IR = (INS * FBG) / 22.5.26 Participants were advised to follow a mixed diet containing at least 150 grams of carbohydrates for three days prior to the oral glucose tolerance test (OGTT). During the OGTT, each participant consumed 75 grams of glucose dissolved in water within a five-minute period. A venous blood sample was then collected two hours after the initial sip of the sugar solution to measure the blood glucose level at that specific time point. Three ultrasound specialists conducted liver and neck vascular ultrasound scans, providing their individual assessments of the findings. Liver parenchymal echo enhancement, along with decreased clarity of intrahepatic structures, are key characteristics that assist in the diagnosis of fatty liver.27 Carotid artery intima-media thickness of ≥ 1.0 mm indicates intimal thickening, while localized thickening of > 1.5 mm may be classified as plaque formation.28 Any disputes arising from these evaluations were resolved collectively by the three specialists.
Data Analysis
To determine if the continuous variables adhered to a normal distribution, the Kolmogorov–Smirnov test was performed. These variables were subsequently presented as either the mean ± standard deviation (SD) or the median with the 25th percentile (P25) and 75th percentile (P75). For comparisons between two groups, the appropriate test—either the t-test or the Mann–Whitney U-test—was utilized, depending on the data’s distribution. Categorical variables were compared across groups using the chi-square test. Spearman correlation was utilized to explore the relationship between serum sASGR1 and other indicators. Stepwise linear regression was employed to identify the independent factors affecting serum sASGR1 levels. Logistic regression analysis was conducted to assess the association between sAGSR1 and the incidence of T2DM. Before performing regression analyses, skewed data were log-transformed to ensure normality. Receiver Operating Characteristic (ROC) curve analysis was conducted to assess the predictive value of various factors for the onset of T2DM. All statistical analyses were carried out using SPSS version 22.0, with a two-sided p-value < 0.05 considered statistically significant.
Results
The Characteristics of the Participants
As illustrated in Table 1, participants with T2DM had higher levels of WC, WHR, BMI, SBP, ALT, eGFR, TG, FBG, 2hPG, HbA1c, HOMA-IR, hs-CRP, and IL-6 compared to those with NGT. Conversely, serum Cr and HDL levels were lower in the T2DM group. There were no significant differences in gender distribution, age, DBP, AST, UA, TC, or LDL between the two groups.
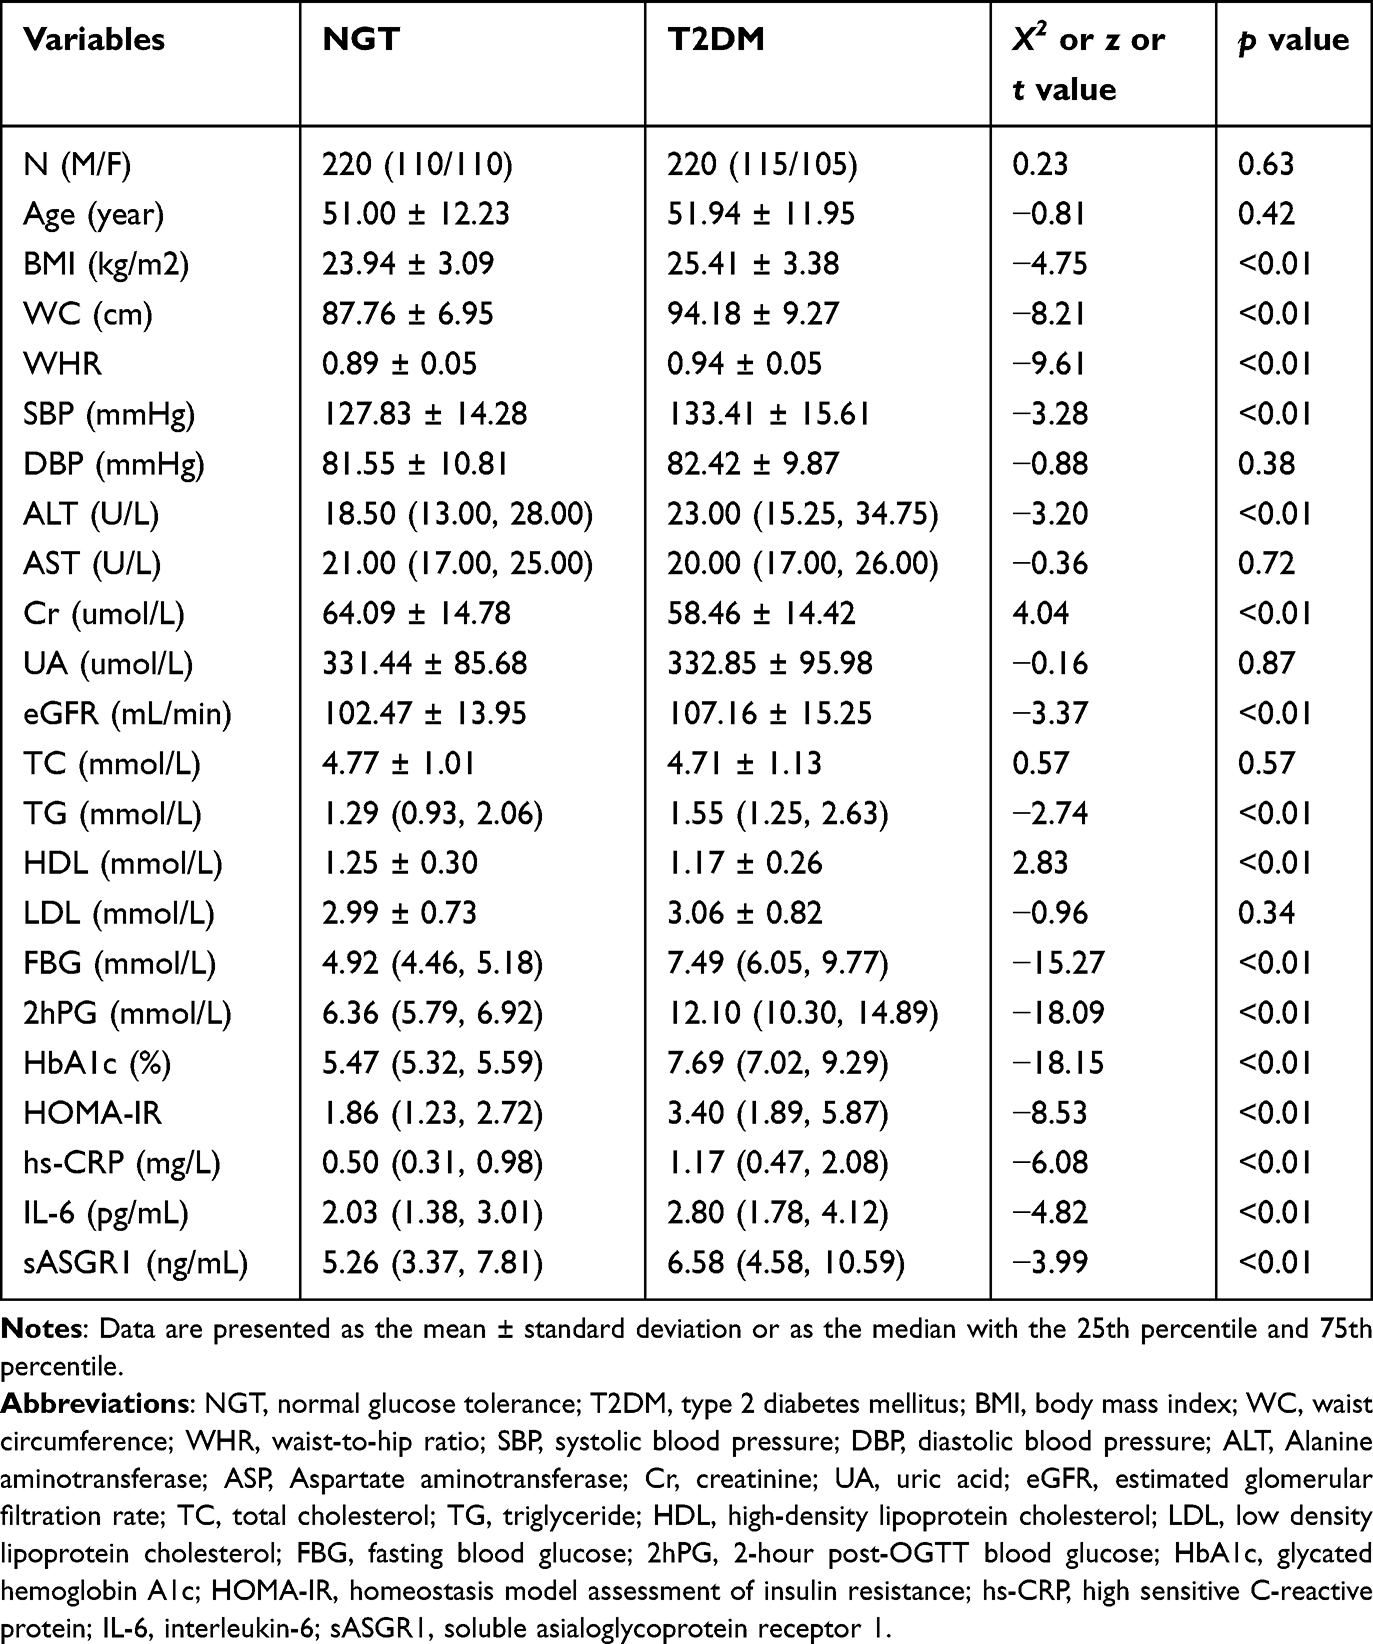 |
Table 1 Baseline Characteristics of the Participants |
Serum sASGR1 Levels and Ultrasonic Measurements Results
As depicted in Figure 1, the serum sASGR1 level in the NGT population is 5.26 (3.37, 7.81) ng/mL, lower than the 6.58 (4.58, 10.59) ng/mL observed in the T2DM population. Among the participants, 92.0% underwent liver ultrasound evaluation and 70.2% completed carotid ultrasound assessment, except two participants who declined to share their ultrasound results. The incidence rates of fatty liver and carotid artery stiffness were significantly higher in T2DM patients compared to the NGT group: 66.0% vs 31.7% and 32.4% vs 18.2%, respectively. Within the NGT group, 63 individuals had fatty liver and 136 did not; however, there was no significant difference in serum sASGR1 levels between these subgroups. Similarly, 22 individuals had carotid arteriosclerosis and 99 did not, with no significant difference in serum sASGR1 levels. In the T2DM group, 136 had fatty liver and 70 did not, but again, no significant difference in serum sASGR1 levels was observed. Likewise, 61 patients had carotid arteriosclerosis and 127 did not, with no significant difference in serum sASGR1 levels (Table S1).
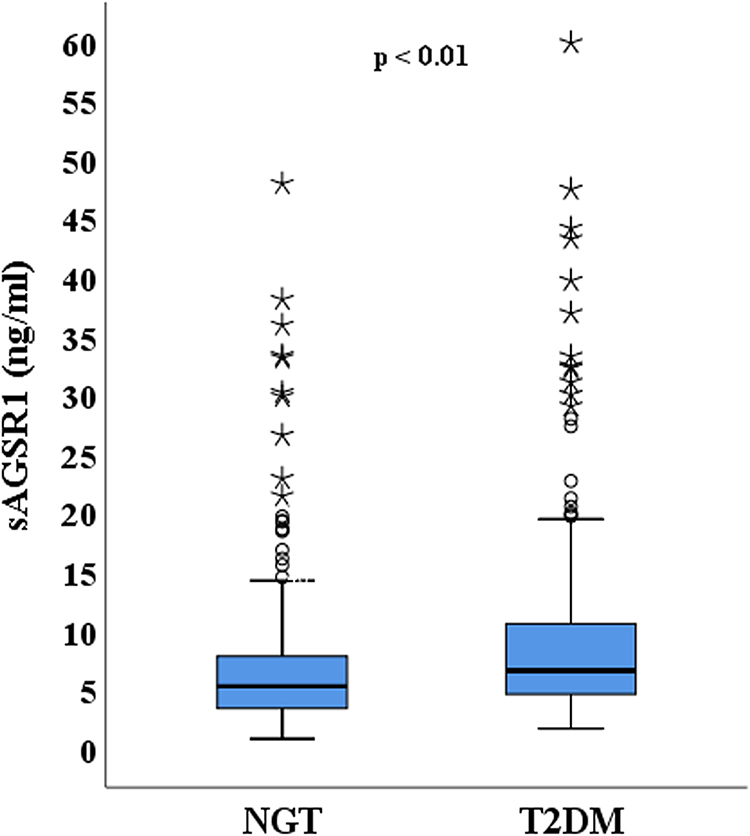 |
Figure 1 Comparison of Serum sASGR1 Levels between NGT and T2DM Populations. |
Exploring the Spearman Correlation Between sASGR1 and Diverse Variables
As shown in Table 2, sASGR1 demonstrated a positive, albeit weak to moderate, correlation with hs-CRP (ρ = 0.366, p < 0.01) and IL-6 (ρ = 0.154, p < 0.05) in individuals with NGT. In patients with T2DM, sASGR1 was found to be positively associated with eGFR (ρ = 0.157, p < 0.05), TG (ρ = 0.144, p < 0.05), HOMA-IR (ρ = 0.182, p < 0.01), and hs-CRP (ρ = 0.252, p < 0.01), indicating weak correlations. Additionally, a weak inverse relationship was observed between sASGR1 and Cr (ρ = −0.142, p < 0.05) in T2DM patients.
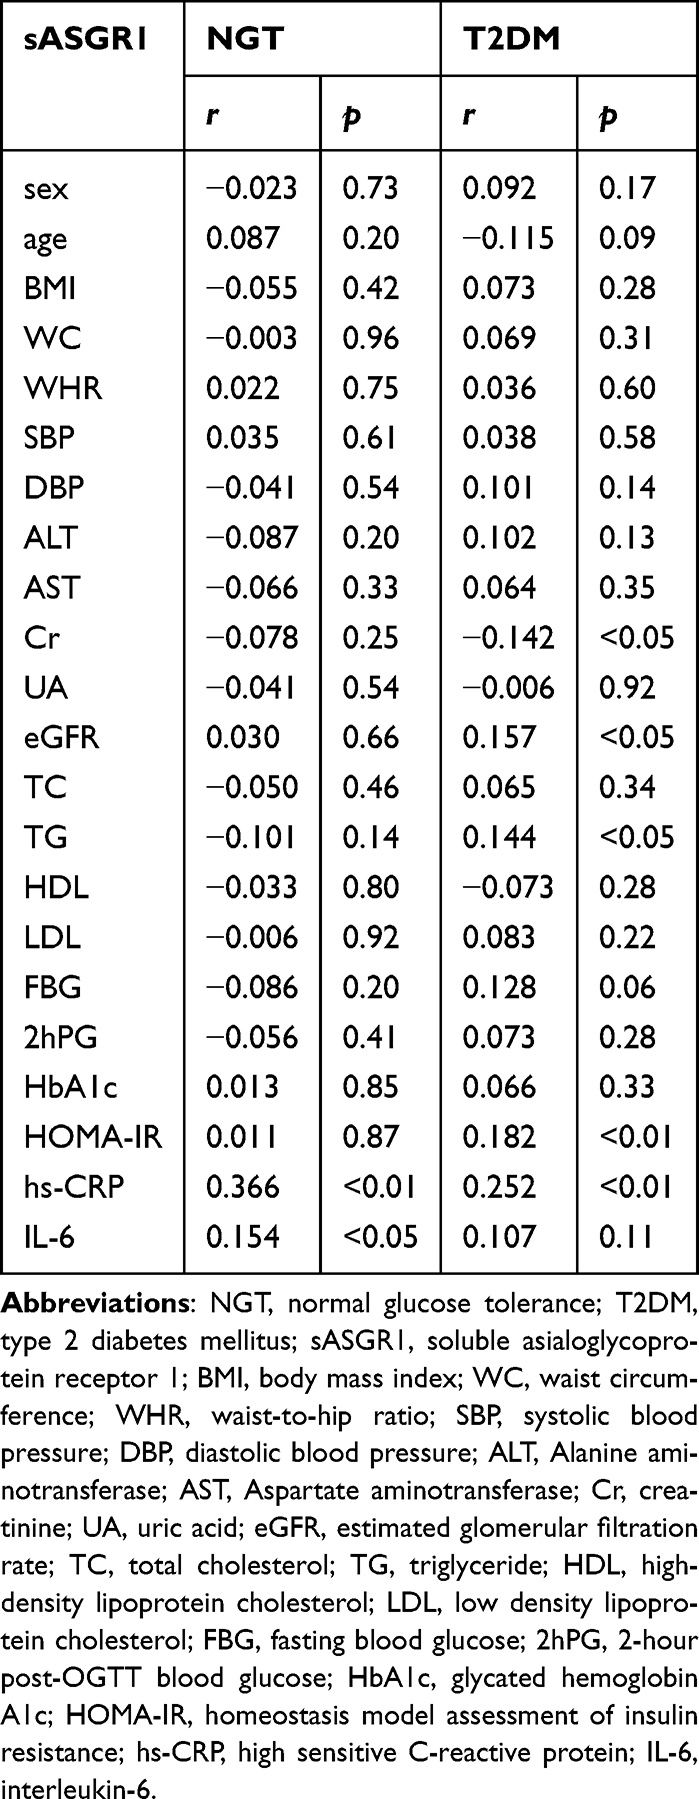 |
Table 2 Spearman Correlation Analysis Between sASGR1 and Various Variables |
Independent Predictors of sASGR1 Identified by Stepwise Linear Regression
A stepwise linear regression analysis was conducted with sASGR1 as the dependent variable and the other variables as independent variables. The results, as presented in Table 3, indicated that hs-CRP was positively correlated with serum sASGR1. Surprisingly, Cr emerged as a potential negative factor influencing serum sASGR1 levels.
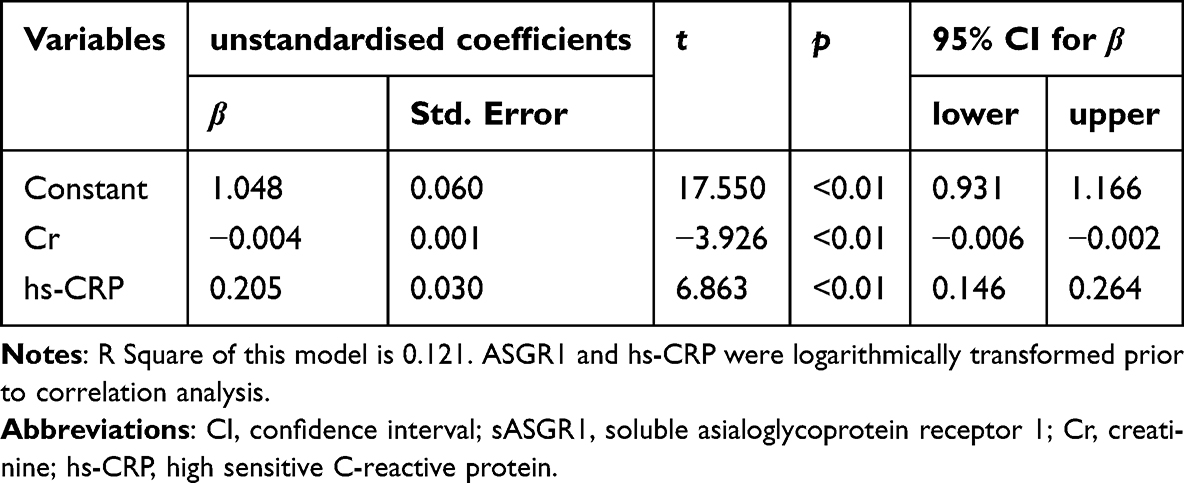 |
Table 3 Independent Predictors of sASGR1 Levels Identified Through Stepwise Linear Regression Analysis |
Logistic Regression Analysis of Serum sASGR1 Level and T2DM Incidence
According to the serum sASGR1 level, 440 participants were categorized into three groups: T1 (< 4.64 ng/mL), T2 (4.64–7.82 ng/mL), and T3 (> 7.82 ng/mL). The incidence of T2DM progressively increased with rising serum sASGR1 levels, reaching 39.5% in the T1 group, 47.9% in the T2 group, and 62.6% in the T3 group.
As shown in Table 4, it revealed that the incidence of T2DM in T3 group was significantly higher than that in T1 group, even after adjusting some factors including BMI, WHR, SBP, TG and Cr, as shown in models 1–6. However, this significance was diminished after the adjustment for hs-CRP. No statistically significant difference in the incidence of T2DM was observed between the T1 and T2 groups.
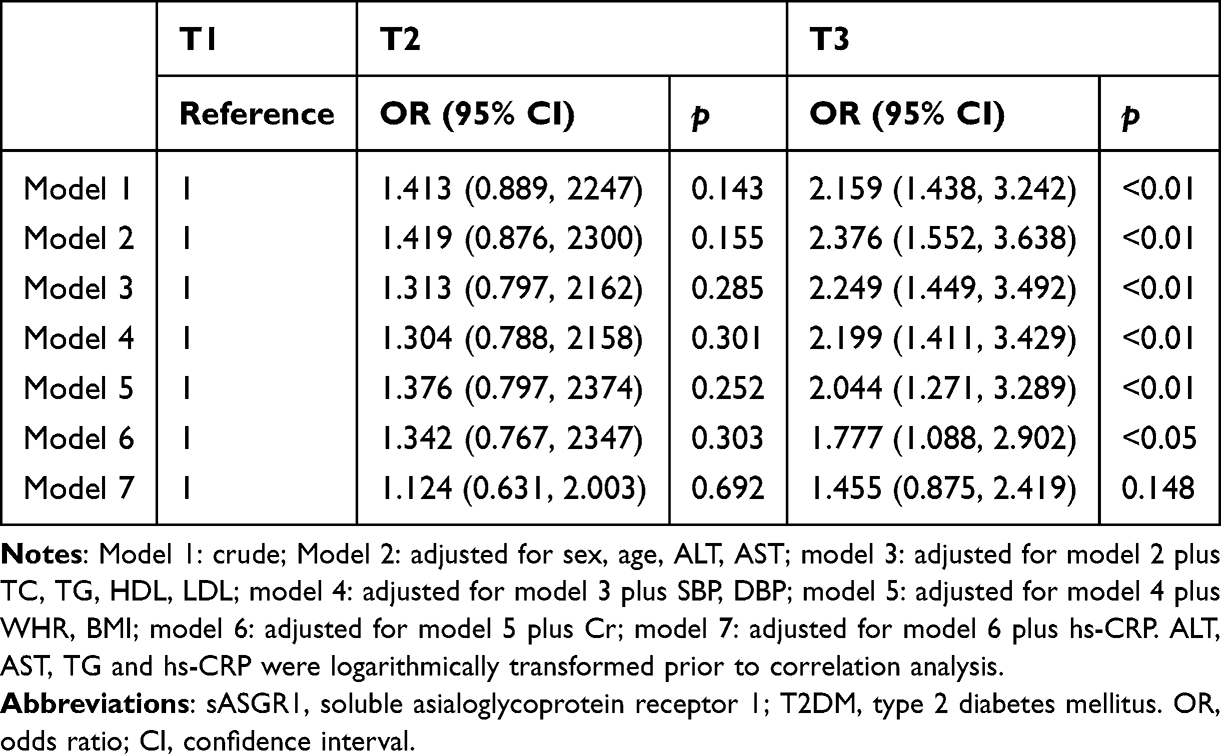 |
Table 4 Logistic Regression Analysis of the Association Between Serum sASGR1 Levels and T2DM Prevalence |
ROC Curve Analysis for Predicting the Incidence of T2DM Using Serum sASGR1 Levels
As shown in Figure 2, the Area under the curve (AUC) for sASGR1 was 0.610 (with a 95% confidence interval of 0.558–0.662, p<0.01).
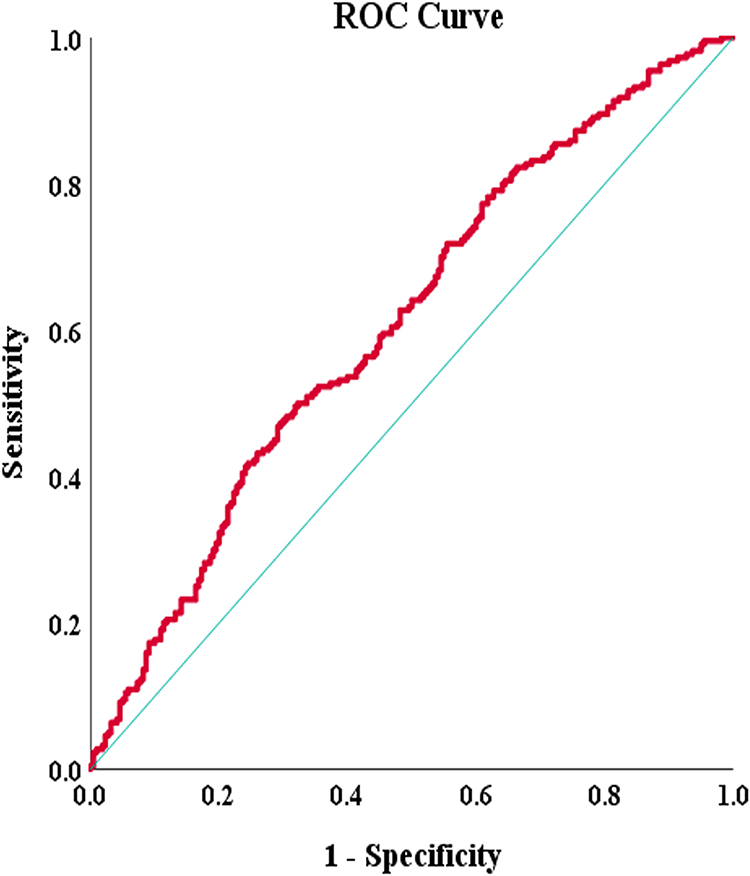 |
Figure 2 ROC Curve Analysis for Predicting T2DM Incidence Using Serum sASGR1 Levels. |
Discussion
In the present study, higher serum sASGR1 levels were found in newly diagnosed T2DM patients than individuals with NGT. Previous studies have indicated that ASGR1 deficiency enhances liver insulin signaling and mitigates systemic insulin resistance.19 However, ASGR1 deficiency results in decreased glycogen breakdown and gluconeogenesis, suggesting a favorable impact on glucose metabolism. Nevertheless, in the same experiment, after being fed a high-fat diet, AGSR1-/- mice exhibited similar blood glucose levels compared to wild-type mice and even demonstrated elevated blood glucose levels during the early stages of the glucose tolerance test.19 It was reported that the expression of ASGR1 in peripheral blood mononuclear cells was comparable between patients with both coronary artery disease (CAD) and diabetes and those with CAD alone. However, this expression was decreased in patients with both CAD and diabetes compared to healthy individuals.29 Few reports have focused on the link between serum sASGR1 levels and T2DM previously. The only indirect comparison available suggested higher serum sASGR1 levels in T2DM patients than non-diabetic individuals, aligning with our findings.30 In the present study, we observed that patients with newly diagnosed T2DM exhibited significantly higher serum sASGR1 levels compared to non-diabetic individuals. Furthermore, as serum sASGR1 levels increased, the prevalence of T2DM also rose notably, even after accounting for various confounding factors. Additionally, we identified a positive correlation between serum sASGR1 levels and HOMA-IR in newly diagnosed T2DM patients, indicating its potential unique role in insulin resistance, which warrants further investigation.
Although sASGR1 was found to be closely linked with T2DM, the ROC analysis indicated that sASGR1 has limited clinical value as a standalone biomarker for the disease, likely owing to the multifactorial pathogenesis of T2DM. Future studies could explore the combination of sASGR1 with other biomarkers to improve diagnostic accuracy. Moreover, we have observed a positive correlation between sASGR1 and hs-CRP levels, where elevated sASGR1 is linked to a higher incidence of T2DM. However, this association became insignificant after adjusting for hs-CRP, indicating that inflammation may be a confounding factor. Inflammation could potentially interact with sASGR1 or independently elevate the risk of T2DM. Consequently, the direct impact of sASGR1 on T2DM risk remains unclear. Larger and more rigorous studies are needed to clarify the role of sASGR1 in T2DM risk assessment, while taking inflammatory influences into consideration. We hope that our findings will inspire further research in this field.
It is noteworthy that a previous research team has reported on serum sASGR1 levels in two publications,12,30 nonetheless, their reported values were markedly lower than those observed in our study, despite using reagents from the same company. Three potential explanations for this discrepancy merit consideration. Firstly, while acknowledging that the possibility of experimental errors cannot be entirely dismissed, our laboratory personnel meticulously reviewed the instructions and strictly adhered to the protocols. Moreover, we sought the assistance of a technician from JiangLai Biotechnology to re-evaluate a subset of samples, with the results closely aligning with our initial findings. Secondly, the two studies involved distinct populations. Their primary focus was on patients with CAD, whereas our study centered on individuals with diabetes and those with NGT. Critically, to minimize potential confounding effects, we ensured that participants had no medication history for at least one month prior to their involvement and had not initiated any regular lifestyle interventions. This distinction was crucial when compared to the two previous studies.
Another notable discovery from this study unveiled a positive correlation between serum sASGR1 levels and specific inflammatory markers, namely hs-CRP in both the NGT group and the T2DM group, and IL-6 specifically in the NGT group. Prior research has established that ASGR1 promotes monocyte-to-macrophage differentiation by enhancing activating transcription factor 5 (ATF5) expression via the activation of the nuclear factor-kappa B (NF-κB) signaling pathway, ultimately triggering a systemic inflammatory response. Notably, ASGR1 deficiency significantly inhibited the lipopolysaccharide (LPS) -induced elevation of inflammatory cytokines in mouse plasma, particularly tumor necrosis factor-alpha (TNF-α), IL-6, and Interleukin-1 beta (IL-1β).22 A recent investigation also reported a remarkable positive association between serum sASGR1 levels and hs-CRP in CAD patients, which is consistent with our observations despite the distinct patient cohorts involved.12 We anticipate that the elucidation of ASGR1’s role in inflammation will emerge as a pivotal area of interest in forthcoming research endeavors.
The involvement of ASGR1 in lipid metabolism has been well-established, with a primary focus on the following key points: Firstly, ASGR1 deficiency enhances insulin induced gene 1 (INSIG1) expression, which in turn enhances the suppression of sterol-regulatory element binding proteins (SREBP) precursor, thereby influencing essential lipid metabolism networks.31 Additionally, ASGR1 inhibition suppresses the SREBP pathway via adenosine 5’-monophosphate - activated protein kinase (AMPK) activation, leading to a reduction in de novo cholesterol synthesis.32 Secondly, ASGR1 deficiency leads to the suppression of mechanistic target of rapamycin complex 1 (mTORC1) and activation of AMPK, accompanied by a reduction in the E3 ubiquitin ligase complex Breast Cancer 1 and its associated ring domain gene 1 (BRCA1/BARD1). Consequently, this leads to an elevated expression of liver X receptor (LXR) and ATP-binding cassette sub-family G member 5/8 (ABCG5/G8), ultimately facilitating cholesterol efflux.33 Furthermore, ASGR1 plays a crucial role in lipid distribution within the body. When ASGR1 is deficient, lipids are redirected from the bloodstream into adipose tissue, leading to increased fat accumulation in visceral adipose tissue and a subsequent decrease in blood lipids.23 Overall, ASGR1 occupies a pivotal position in lipid metabolism. In support of this, previous studies have revealed a significant positive correlation between serum levels of sASGR1 and LDL.30 However, in our experiments, it appears that the association between serum sASGR1 and lipid levels is not as pronounced as initially anticipated. Specifically, we only detected a weak positive correlation between serum sASGR1 and TG levels within the T2DM population. As discussed earlier, factors such as drug effects and population differences need to be taken into consideration to elucidate the reasons behind the divergence of our results from the serological test findings reported earlier.30 Additionally, the role of serum sASGR1 is intricate and distinct from that of liver ASGR1. While the binding of asialoglycoprotein to ASGR1 on the hepatocyte membrane triggers subsequent biological processes, circulating sASGR1 inhibits this binding. Nevertheless, it still forms a complex with sialic acid glycoprotein and enters the liver to exert its functional effects.34
The dual roles of ASGR1 in liver injury have been extensively explored. As previously discussed, ASGR1 deficiency appears to confer protection to the liver by stimulating lipid metabolism. Conversely, ASGR1 overexpression modulates the differentiation of monocytes into macrophages via the NF-κB/ATF5 pathway, thereby worsening liver injury.22 However, other studies indicate that ASGR1 plays a protective role in liver injury. ASGR1 deficiency elevates circulating golgi protein 73 (GP73) levels, facilitates the interaction between GP73 and binding immunoglobulin protein (BIP), triggers endoplasmic reticulum stress,35 and stimulates the hypertrophy of white adipose tissue, ultimately culminating in liver damage.23 ASGR1 deficiency exacerbates liver injury induced by a high-fat diet, whereas its overexpression alleviates such damage.20,21 In the current study, we did not observe any correlation between serum sASGR1 levels and either ALT or fatty liver. The significance of serum sASGR1, as well as its role in liver injury, is complex and multifaceted.
A substantial amount of researches have demonstrated that ASGR1 also plays a crucial role in atherosclerosis. ASGR1 deficiency results in decreased levels of plasma very-low-density lipoprotein (VLDL) and LDL, along with a significant reduction in the atherosclerotic lesion area.20,21 The absence of ASGR1 protects macrophages from atherosclerosis in vitro and diminishes plaque burden in vivo. Furthermore, heightened levels of ASGR1 in peripheral blood mononuclear cells (PBMCs) from clinical blood samples correlate with the presence of coronary artery plaques.36 ASGR1 deficiency appears to be associated with a lower risk of CAD.12,37,38 However, there are limited reports on the impact of ASGR1 on carotid plaques, which serve as a readily measurable marker of atherosclerosis. Hs-CRP, a marker of inflammation, plays a pivotal role in atherosclerosis by contributing to vascular wall damage, endothelial dysfunction, and oxidative stress, making it a robust predictor of cardiovascular disease risk in type 2 diabetics.39 Although we observed a positive correlation between serum levels of sASGR1 and hs-CRP, indicating a potential link to inflammation, our study did not uncover a definitive correlation between sASGR1 levels and the presence of carotid atherosclerosis. This may be due to the relatively low participation rate in our study, which limits the generalizability of our findings. Nonetheless, our results underscore the need for further investigation into the role of ASGR1 in carotid atherosclerosis.
The present study has revealed that serum sASGR1 levels are negatively correlated with Cr but positively correlated with eGFR in patients with newly diagnosed T2DM. Furthermore, serum Cr has been identified as an independent negative influencing factor of sASGR1. Notably, previous studies have overlooked the significance of ASGR1 in the kidneys, with one earlier report indicating no correlation between serum sASGR1 and Cr levels.30 Consequently, further validation is required to establish the definitive relationship between ASGR1 and renal function. A substantial body of research has demonstrated that disruptions in blood glucose40 and lipid metabolism,41 as well as oxidative stress42 and inflammatory responses,43 play pivotal roles in the progression of renal injury and fibrosis. One plausible explanation for this correlation is that sASGR1 may exert its influence in these very aspects. For instance, sASGR1 may exacerbate renal inflammation by activating the NF-κB pathway, triggering the production of pro-inflammatory cytokines and the influx of immune cells into the kidney, which are known to play pivotal roles in the development of renal diseases.42,43 However, these hypotheses remain to be tested in future studies.
In this study, we explored the correlation between serum sASGR1 and T2DM, along with their association with inflammatory markers. While our findings may offer new insights into the pathogenesis of T2DM, we acknowledge that our research has several limitations. Firstly, it would be highly interesting to investigate serum sASGR1 levels in pre-diabetic patients. Secondly, the small number of participants who underwent ultrasound examinations, particularly those assessing the carotid artery, diminishes the robustness of our findings. Thirdly, owing to constraints in our conditions, we were unable to assess the longitudinal variations in sASGR1 levels over time or in relation to disease progression, thereby limiting the applicability of our findings for monitoring T2DM. Fourthly, the cross-sectional design of our study precludes causal inferences, and we cannot determine whether elevated sASGR1 levels contribute to the onset of T2DM or are a result of the disease process. Fifthly, our study was conducted primarily in Taizhou City, Jiangsu Province, which may limit the generalizability of our findings to other ethnic or geographical populations. Future studies should include a more diverse participant pool to enhance the applicability of the results. Lastly, we observed a robust association between serum sASGR1 and Cr levels. Importantly, Cr levels were significantly lower in the T2DM group compared to the NGT group, which raises concerns about potential confounding factors and highlights the necessity for implementing strategies to address and minimize their impact. Perhaps future research will corroborate the associations between ASGR1 and T2DM, ASGR1 and inflammatory markers, as well as ASGR1 and renal function. Additionally, the impact of ASGR1 on blood lipids, liver damage, and arteriosclerosis presents an intriguing avenue for future research.
Conclusion
In this study, we found that serum sASGR1 levels were markedly elevated in newly diagnosed T2DM patients than in the NGT group. Moreover, sASGR1 demonstrated a positive correlation with hs-CRP, underscoring its potential involvement in inflammation and the pathogenesis of T2DM. Nevertheless, the predictive power of sASGR1 in anticipating the onset of T2DM is relatively constrained. Additionally, we observed no significant differences in serum sASGR1 levels between individuals with and without carotid artery stiffness, or between those with and without fatty liver disease.
Data Sharing Statement
The individual de-identified participant data from this study, including case report forms, laboratory test results, and clinical assessment records, have been uploaded to Mendeley Data and are accessible via the following DOI: 10.17632/7sfcrhdpfw.2. In addition, the study protocol, statistical analysis plan, and the statistical analysis code used in this study will also be made available. For further inquiries or assistance with accessing the data, please contact the corresponding author at [email protected]. These data and documents will be publicly available for an indefinite period starting from the date of publication of this paper.
Acknowledgments
Haifeng Zhu, Ziyi Zhong, and Gaonian Zhao are co-first authors for this study. We would like to express our heartfelt gratitude to Zhou XL, Sun XP, and Ni M for their inestimable help with participant recruitment. We are profoundly thankful to ZHOU NX and her team for their substantial contributions to the data measurement process. Finally, special thanks are extended to Professor Cheng XB for offering invaluable guidance throughout the paper revision stage.
Funding
There is no funding to report.
Disclosure
The authors report no conflicts of interest in this work.
References
1. Chen Q, Zhao X, Xu Z, Liu Y. Endoplasmic reticulum stress mechanisms and exercise intervention in type 2 diabetes mellitus. Biomed Pharmacother. 2024;177:117122. doi:10.1016/j.biopha.2024.117122
2. DeFronzo RA. From the triumvirate to the ominous octet: a new paradigm for the treatment of type 2 diabetes mellitus. Diabetes. 2009;58(4):773–795. doi:10.2337/db09-9028
3. Ong KL, Stafford LK, McLaughlin SA, et al. Global, regional, and national burden of diabetes from 1990 to 2021, with projections of prevalence to 2050: a systematic analysis for the global burden of disease study 2021. Lancet. 2023;402(10397):203–234. doi:10.1016/S0140-6736(23)01301-6
4. Safiri S, Karamzad N, Kaufman JS, et al. Prevalence, deaths and disability-adjusted-life-years (DALYs) due to type 2 diabetes and its attributable risk factors in 204 countries and territories, 1990-2019: results from the global burden of disease study 2019. Front Endocrinol. 2022;13:838027. doi:10.3389/fendo.2022.838027
5. Chen GC, Hukportie DN, Liu YJ, et al. Microvascular disease, cardiovascular health, and risk of coronary heart disease in type 2 diabetes: a UK biobank study. J Clin Endocrinol Metab. 2024;109(9):dgae100. doi:10.1210/clinem/dgae100
6. Liu YJ, Li FR, Han WW, et al. Relationship of microvascular complications and healthy lifestyle with all-cause and cardiovascular mortality in women compared with men with type 2 diabetes. Clin Nutr. 2024;43(4):1033–1040. doi:10.1016/j.clnu.2024.03.005
7. Meshkani R, Vakili S. Tissue resident macrophages: key players in the pathogenesis of type 2 diabetes and its complications. Clin. Chim Acta. 2016;462:77–89. doi:10.1016/j.cca.2016.08.015
8. Aktas G. Association between the prognostic nutritional index and chronic microvascular complications in patients with type 2 diabetes mellitus. J Clin Med. 2023;12(18):5952. doi:10.3390/jcm12185952
9. ElSayed NA, Aleppo G, Bannuru RR, American Diabetes Association Professional Practice Committee. 6. glycemic goals and hypoglycemia: standards of care in Diabetes—2024. Diabetes Care. 2024;47(S1):S111–S125. doi:10.2337/dc24-S006
10. Donath MY. Designer cytokine for the treatment of diabetes. Nat Metab. 2019;1(10):933–934. doi:10.1038/s42255-019-0130-z
11. Svecla M, Moregola A, Da Dalt L, et al. The impact of ASGR1 deficiency on lipid and lipoprotein metabolism during atherogenesis. Atherosclerosis. 2022;355:88. doi:10.1016/j.atherosclerosis.2022.06.492
12. Luo Q, Chen J, Yi Y, et al. The serum soluble ASGR1 concentration is elevated in patients with coronary artery disease and is associated with inflammatory markers. Lipids Health Dis. 2024;23(1):89. doi:10.1186/s12944-024-02054-8
13. Devarajan PV, Dandekar P, D’Souza AA editors. Targeted Intracellular Drug Delivery by Receptor Mediated Endocytosis. 39. Berlin, Germany:Springer;2019:1
14. Kaze AD, Santhanam P, Musani SK, Ahima R, Echouffo‐Tcheugui JB. Metabolic dyslipidemia and cardiovascular outcomes in type 2 diabetes mellitus: findings from the look AHEAD study. J Am Heart Assoc. 2021;10(7):e016947. doi:10.1161/JAHA.120.016947
15. Zhang H, Dellsperger KC, Zhang C. The link between metabolic abnormalities and endothelial dysfunction in type 2 diabetes: an update. Basic Res Cardiol. 2012;107:1–11. doi:10.1007/s00395-011-0237-1
16. Tanase DM, Gosav EM, Costea CF, et al. The intricate relationship between type 2 diabetes mellitus (T2DM), insulin resistance (IR), and nonalcoholic fatty liver disease (NAFLD). J Diabetes Res. 2020;2020(1):3920196. doi:10.1155/2020/3920196
17. Kosekli MA, Kurtkulagii O, Kahveci G, et al. The association between serum uric acid to high density lipoprotein-cholesterol ratio and non-alcoholic fatty liver disease: the abund study. Rev Assoc Med Bras. 2021;67(4):549–554. doi:10.1590/1806-9282.20201005
18. Poznyak A, Grechko AV, Poggio P, Myasoedova VA, Alfieri V, Orekhov AN. The diabetes mellitus–atherosclerosis connection: the role of lipid and glucose metabolism and chronic inflammation. Int J Mol Sci. 2020;21(5):1835. doi:10.3390/ijms21051835
19. Yu X, Tao J, Wu Y, et al. Deficiency of ASGR1 alleviates diet-induced systemic insulin resistance via improved hepatic insulin sensitivity. Diabetes Metab J. 2024;48(4):802–815. doi:10.4093/dmj.2023.0124
20. Zhang Y, Jiang X, Wang W, et al. ASGR1 deficiency inhibits atherosclerosis in western diet–fed ApoE−/− mice by regulating lipoprotein metabolism and promoting cholesterol efflux. Arterioscler Thromb Vasc Biol. 2024;12:1–21. doi:10.1161/ATVBAHA.124.321076
21. Xie B, Shi X, Li Y, et al. Deficiency of ASGR1 in pigs recapitulates reduced risk factor for cardiovascular disease in humans. PLoS Genet. 2021;17(11):e1009891. doi:10.1371/journal.pgen.1009891
22. Shi R, Wang J, Zhang Z, Leng Y, Chen AF. ASGR1 promotes liver injury in sepsis by modulating monocyte-to-macrophage differentiation via NF-κB/ATF5 pathway. Life Sci. 2023;315:121339. doi:10.1016/j.lfs.2022.121339
23. Svecla M, Da Dalt L, Moregola A, et al. ASGR1 deficiency diverts lipids toward adipose tissue but results in liver damage during obesity. Cardiovasc Diabetol. 2024;23(1):42. doi:10.1186/s12933-023-02099-6
24. ElSayed NA, Aleppo G, Bannuru RR, American Diabetes Association Professional Practice Committee. 2. diagnosis and classification of diabetes: standards of care in diabetes—2024. Diabetes Care. 2024;47(S1):S20–S42. doi:10.2337/dc24-S002
25. Buchkremer F, Segerer S. Estimating glomerular filtration rate: a systematic comparison of the new European kidney function consortium equation with the chronic kidney disease epidemiology collaboration equation. Clin Kidney J. 2021;14(1):448–450. doi:10.1093/ckj/sfaa264
26. Khalili D, Khayamzadeh M, Kohansal K, et al. Are HOMA-IR and HOMA-B good predictors for diabetes and pre-diabetes subtypes? BMC Endocr Disord. 2023;23(1):39. doi:10.1186/s12902-023-01291-9
27. Cui JY, Szeverenyi N, Zhang YN, et al. Liver fat imaging—a clinical overview of ultrasound, CT, and MR imaging. Br J Radiol. 2018;91(1089):20170959. doi:10.1259/bjr.20170959
28. Naqvi TZ, Lee MS. Carotid intima-media thickness and plaque in cardiovascular risk assessment. JACC Cardiovasc Imaging. 2014;7(10):1025–1038. doi:10.1016/j.jcmg.2013.11.014
29. Hamledari H, Sajjadi SF, Alikhah A, Boroumand MA, Behmanesh M. ASGR1 but not FOXM1 expression decreases in the peripheral blood mononuclear cells of diabetic atherosclerotic patients. J Diabetes Its Complications. 2019;33(8):539–546. doi:10.1016/j.jdiacomp.2019.05.008
30. Luo Q, Chen J, Su Y, et al. Correlation between serum soluble ASGR1 concentration and low-density lipoprotein cholesterol levels: a cross-sectional study. Lipids Health Dis. 2023;22(1):142. doi:10.1186/s12944-023-01910-3
31. Xu Y, Tao J, Yu X, et al. Hypomorphic ASGR1 modulates lipid homeostasis via INSIG1-mediated SREBP signaling suppression. JCI Insight. 2021;6(19):e147038. doi:10.1172/jci.insight.147038
32. Song J, Fang Y, Rao X, et al. Beyond conventional treatment: ASGR1 leading the new era of hypercholesterolemia management. Biomed Pharmacother. 2024;180:117488. doi:10.1016/j.biopha.2024.117488
33. Wang JQ, Li LL, Hu A, et al. Inhibition of ASGR1 decreases lipid levels by promoting cholesterol excretion. Nature. 2022;608(7922):413–420. doi:10.1038/s41586-022-05006-3
34. Liu J, Hu B, Yang Y, et al. A new splice variant of the major subunit of human asialoglycoprotein receptor encodes a secreted form in hepatocytes. PLoS One. 2010;5(9):1–13. doi:10.1371/journal.pone.0012934
35. Zhang Z, Leng XK, Zhai YY, et al. Deficiency of ASGR1 promotes liver injury by increasing GP73-mediated hepatic endoplasmic reticulum stress. Nat Commun. 2024;15(1):1908. doi:10.1038/s41467-024-46135-9
36. Pullen BJ, Vidanapathirana AK, Sandeman L, et al. Deletion of the asialyloglycoprotein receptor-1 causes athero-protective effects in vitro and in vivo. Circulation. 2022;146(S1):A13417–A13417. doi:10.1161/circ.146.suppl_1.13417
37. Yang G, Schooling CM. Genetically mimicked effects of ASGR1 inhibitors on all-cause mortality and health outcomes: a drug-target Mendelian randomization study and a phenome-wide association study. BMC Med. 2023;21(1):235. doi:10.1186/s12916-023-02903-w
38. Mazidi M, Wright N, Yao P, et al. Plasma proteomics to identify drug targets for ischemic heart disease. J Am Coll Cardiol. 2023;82(20):1906–1920. doi:10.1016/j.jacc.2023.09.804
39. Grigorescu ED, Sorodoc V, Floria M, et al. The inflammatory marker HSCRP as a predictor of increased insulin resistance in type 2 diabetics without atherosclerotic manifestations. Rev Chim. 2019;70(5):1791–1794. doi:10.37358/RC.19.5.7216
40. Reidy K, Kang HM, Hostetter T, Susztak K. Molecular mechanisms of diabetic kidney disease. J Clin Invest. 2014;124(6):2333–2340. doi:10.1172/jci72271
41. Jiang Y, Zhu X, Jordan K, et al. Dyslipidemia-induced renal fibrosis related to ferroptosis and endoplasmic reticulum stress. J Lipid Res. 2024;65(9):100610. doi:10.1016/j.jlr.2024.100610
42. Sharma K. Obesity, oxidative stress, and fibrosis in chronic kidney disease. Kidney Int Suppl. 2014;4(1):113–117. doi:10.1038/kisup.2014.21
43. Meng XM, Nikolic-Paterson DJ, Lan HY. Inflammatory processes in renal fibrosis. Nat Rev Nephrol. 2014;10(9):493–503. doi:10.1038/nrneph.2014.114
 © 2025 The Author(s). This work is published and licensed by Dove Medical Press Limited. The
full terms of this license are available at https://www.dovepress.com/terms
and incorporate the Creative Commons Attribution
- Non Commercial (unported, 3.0) License.
By accessing the work you hereby accept the Terms. Non-commercial uses of the work are permitted
without any further permission from Dove Medical Press Limited, provided the work is properly
attributed. For permission for commercial use of this work, please see paragraphs 4.2 and 5 of our Terms.
© 2025 The Author(s). This work is published and licensed by Dove Medical Press Limited. The
full terms of this license are available at https://www.dovepress.com/terms
and incorporate the Creative Commons Attribution
- Non Commercial (unported, 3.0) License.
By accessing the work you hereby accept the Terms. Non-commercial uses of the work are permitted
without any further permission from Dove Medical Press Limited, provided the work is properly
attributed. For permission for commercial use of this work, please see paragraphs 4.2 and 5 of our Terms.