")
Back to Journals » Neuropsychiatric Disease and Treatment » Volume 19
Serum Secreted Protein Acidic and Rich in Cysteine-Like 1 as a Biochemical Predictor for Prognosticating Clinical Outcomes After Acute Supratentorial Intracerebral Hemorrhage: A Prospective Cohort Study
Authors Huang J, Shao F, Chen B, Zheng G, Shen J, Qiu S
Received 14 October 2023
Accepted for publication 28 November 2023
Published 5 December 2023 Volume 2023:19 Pages 2709—2728
DOI https://doi.org/10.2147/NDT.S444671
Checked for plagiarism Yes
Review by Single anonymous peer review
Peer reviewer comments 2
Editor who approved publication: Dr Taro Kishi
Jianjun Huang,1 Fangping Shao,2 Bin Chen,1 Guanrong Zheng,1 Jia Shen,1 Shenzhong Qiu1
1Department of Neurosurgery, The First People’s Hospital of Fuyang District of Hangzhou City, Hangzhou, People’s Republic of China; 2Emergency Department, The First People’s Hospital of Fuyang District of Hangzhou City, Hangzhou, People’s Republic of China
Correspondence: Shenzhong Qiu, Department of Neurosurgery, The First People’s Hospital of Fuyang District of Hangzhou City, Hangzhou, People’s Republic of China, Email [email protected]
Background: Secreted protein acidic and rich in cysteine-like 1 (SPARCL1) regulates synaptic stability and is up-regulated during axonal regeneration. Here, serum SPARCL1 was determined for estimating severity and prognosticating early neurological deterioration (END) and functional outcomes of acute intracerebral hemorrhage (ICH).
Methods: In this prospective observational cohort study of 156 patients with supratentorial ICH, blood samples of 53 were acquired not only at admission but also ad days 1, 3, 5, 7 and 10. Another group of 53 healthy controls were recruited. The modified Rankin Scale (mRS) scores of 3– 6 at poststroke six months were regarded as poor prognosis.
Results: As opposed to controls, serum SPARCL1 levels were markedly elevated during the early ten days after ICH, with the highest levels at days 1 and 3. Admission serum SPARCL1 levels were independently correlated with National Institutes of Health Stroke Scale scores and hematoma volume, were significantly increased in the order of six-month mRS scores from 0 to 6 and were independently correlated with six-month mRS scores. Serum SPARCL1 levels were linearly related to risks of poor six-month prognosis and END under restricted cubic spline, had significant efficiency under receiver operating characteristic (ROC) curve and were independently associated with END and poor prognosis. Subgroup analysis confirmed that no interactions existed for associations of serum SPARCL1 levels with other variables, such as age, gender and some specific vascular risk factors. END and poor prognosis prediction models integrating serum SPARCL1 were displayed using the two nomograms. The poor prognosis prediction model, but END prediction model not, performed well under calibration curve, decision curve and ROC curve.
Conclusion: A substantial elevation of serum SPARCL1 levels during the early period after ICH is independently related to illness severity and poor neurological outcomes, thus signifying that serum SPARCL1 may appear as a prognostic biomarker of ICH.
Keywords: Secreted protein acidic and rich in cysteine-like 1, intracerebral hemorrhage, early neurologic deterioration, prognosis, severity, biomarkers
Introduction
Spontaneous intracerebral hemorrhage (ICH) is universally recognized as a very common cerebrovascular illness, and its mortality ranks the first among all brain strokes, including ischemic stroke and spontaneous subarachnoid hemorrhage.1 Acute lobar bleedings present a different clinical profile and a more severe early prognosis than acute deep subcortical hemorrhages and a non-hypertensive mechanism, namely cerebral amyloid angiopathy, predominates in the lobar location.2 During ICH, bleedings directly enter into the brain parenchyma, thereby destroying brain tissues.3 Alternatively, secondary brain injury is abruptly initialized, and a series of cascading events, including inflammatory reaction, oxidative response and cellular death, were promptly activated.4 Altogether, all brain injuries may lead to permanent neuronal destruction, subsequently damage neurological functions and even result in death among ICH patients.5 It is believable that early neurological deterioration (END) is very frequently observed during treatment for ICH and is closely relevant to poor prognosis of ICH patients.6 Undoubtedly, the National Institutes of Health Stroke Scale (NIHSS) is a very useful clinical severity scale, and hematoma volume is always applied in clinical work for estimating radiological severity of ICH.7,8 Noteworthily, a growing body of researchers have gradually paid close attention to the identification of some reliable biomarkers, which may shed light on the mechanisms of disease progression, as well as aid in severity assessment and prognosis prediction of ICH.9–11
Secreted protein acidic and rich in cysteine-like 1 (SPARCL1), also named as HEVIN, is a kind of matricellular protein and in humans is encoded by the SPARCL1 gene.12–14 It has been well known that SPARCL1, which is highly expressed in both astrocytes and neurons of animal and human brains, may participate in neuronal migration and synaptogenesis during development, thereby supporting neuronal integrity.15–18 During axonal regeneration after brain injury, SPARCL1 was markedly upregulated and could influence synaptic stability.15,16 Also, SPARCL1’s expressions were up-regulated dramatically in ischemic or hemorrhagic brain tissues of rats.19 Notably, there was a close correlation between serum SPARCL1 levels and severity indicated by baseline NIHSS score following acute ischemic stroke.20 Alternatively, serum SPARCL1 levels were independently related to in-hospital mortality and admission traumatic severity reflected by Glasgow coma scale scores among patients with severe traumatic brain injury.21 Herein, our study was designed to ascertain longitudinal change of serum SPARCL1 levels after acute ICH and further to discern its association with long-term functional outcome and END in a cohort of humans with acute ICH.
Materials and Methods
Study Design and Ethical Approval
Between January 2019 and July 2022, a clinical observational analytical study was performed at the First People’s Hospital of Fuyang District of Hangzhou City. This study included two sub-studies. The first sub-study was a cross-sectional study, in which serum SPARCL1 levels were gauged at admission and at days 1, 3, 5, 7 and 10 following ICH in ICH patients who were willing to accept blood collection at multiple time points; another group of healthy individuals were recruited as controls and serum SPARCL1 levels were measured at entry into study. This sub-study was aimed to explore dynamic change of serum SPARCL1 levels after ICH. The second sub-study was a prospective cohort study, in which admission serum SPARCL1 levels were detected in all ICH patients who consented to blood drawings at admission. This sub-study was designed to discover the role of serum SPARCL1 as a potential predictor of poor prognosis and END among patients with acute ICH. The current study complied with the guidelines of the Declaration of Helsinki and its amendments. Its protocol was endorsed by the Ethics Committee at the First People’s Hospital of Fuyang District of Hangzhou City (No. FYD2019011). Signed informed consent forms were acquired from the patients’ next of kins or controls themselves.
Participant Recruitments
All patients with ICH were consecutively recruited according to the enrollment criteria below: (1) age of eighteen years or older; (2) first-time ICH; (3) supratentorial bleedings; (4) primary ICH, but not including primary intraventricular hemorrhage; (5) non-surgical treatment for intracerebral hematoma; and (6) hospitalization within poststroke 24 hours. The exclusion criteria were: (1) other neurological diseases, such as strokes, tumors, infections, degenerative diseases and immune diseases; (2) other severe diseases in other organs, such as malignancies, liver cirrhosis, uremia, chronic obstructive pulmonary disease and ascites; and (3) some specific conditions, such as pregnancies, missed visits, incomplete data, refusal to participation and unavailable blood samples. Controls were composed of healthy physical examinees, who did not present with some chronic diseases, such as hypertension, chronic coronary disease and diabetes mellitus, as well as had normal results in conventional blood tests, such as leucocyte, glucose, sodium and creatinine.
Data Collections
The recorded demographical data were age and sex. The registered vascular risk factors included hypertension, diabetes mellitus, dyslipidemia, cigarette smoking and alcohol drinking. The collected specific medications were statins, anticoagulative agents and antiplatelet drugs. Hospital admission time was referred to as duration from the onset of stroke symptom to hospitalization. Blood-sampling time was deemed as duration between the stroke onset and blood-drawings. Arterial blood pressures, including systolic and diastolic, were determined non-invasively. Hematomas were divided into superficial and deep. Hematoma size was estimated by the equation 0.5×a×b×c.22 We also observed intraventricular or subarachnoidal extension of hematoma via head computerized tomography scan. Baseline NIHSS was considered as a clinical severity indicator for reflecting neurological function. An enhancement of four points or more in NIHSS score or death within 24 h following admission signified END.23 Poststroke six-month modified Rankin Scale (mRS) scores were estimated, the scores 3–6 meant a poor prognosis based on the neurological function status, and the score 6 indicates an all-cause death.24
Sample Collection and Measurement of Serum SPARCL1 Levels
In accordance with patients’ voluntary compliance principle, blood samples at admission could be obtained from all patients, and those at other time points (namely, at days 1, 3, 5, 7 and 10) were only acquired from a portion of patients. Controls’ blood specimens were collected when agreeing with entrance into our study. Participants were phlebotomized via the antecubital vein. About 5 mL of drawn venous blood was at once put into a gel-containing biochemistry tube and, after clot formation, was spun at 2000 × g for 10 min. Afterwards, the supernatants were separated and obtained serum samples were transferred into Eppendorf tubes and preserved at –80 ◦C refrigerator until further quantifications. Every three months, serum samples were thawed. For the quantitative measurement of SPARCL1 in human serum, a human SPARCL1 simple-step enzyme-linked immunosorbent assay kit (ab272478; Abcam) was applied. Its detection range changed between 39.06 pg/mL and 2500 pg/mL, detection sensitivity was 7.89 pg/mL, intra-assay coefficients of variation were <10% and inter-assay coefficients of variation were <10%. In accordance with the manufacturer’s instructions, the detections were done in duplicate by the same experienced practitioner, who was unaware of clinical data. The mean value of the two determinations were employed for further analysis.
Statistical Analysis
The used statistical softwares were SPSS software (version 23.0; SPSS Inc., Chicago, IL, USA) and R 3.5.1 software (https://www.r-project.org), and the utilized graphing software was GraphPad Prism 7.01 (GraphPad Software Inc., San Diego, California, USA). Qualitative data, which were summarized in form of frequencies (proportions), were compared between the two groups using the chi-square test or Fisher’s exact test where appropriate. As for quantitative data, the Kolmogorov–Smirnov test was at first employed to discern normal distribution. They, if normally distributed, were presented as mean (standard deviation, SD) and if non-normally distributed, as median (25th – 75th percentiles). Their differences between the two groups were assessed using the independent-sample Student’s t-test or Mann–Whitney U-test in accordance with data distribution patterns. Patients were divided into the two groups based on END occurrence and development of poor prognosis. Those factors, which were significantly different on univariate analyses, were entered into the binary multivariate logistic regression model to determine independent predictors of END and poor prognosis. The restricted cubic spline was constructed to investigate whether serum SPARCL1 levels were linearly correlated with risk of END or poor prognosis. Subgroup analysis was performed to determine whether interactions for associations existed between serum SPARCL1 levels and other factors, such as age, gender and some specific chronic diseases. Using the Kruskal–Wallis test, differences of serum SPARCL1 levels between controls and multiple time points of patients were ascertained. Friedman test was applied to describe temporal change of serum SPARCL1 levels following ICH. Using the Spearman test, bivariate correlations between serum SPARLC1 level and other variables, as well as between poststroke six-month mRS scores and other variables were evaluated. Therefore, the significantly correlated factors were forced into the multivariate linear regression model to determine variables, which were independently pertinent to mRS scores or serum SPARCL1 levels. Discriminatory efficiencies were assessed under the receiver operating characteristic (ROC) curve. Independent predictors of END and poor prognosis, which were derived from multifactor analysis, were combined to form the two prediction models. The nomograms were plotted to describe the models. Furthermore, the models were evaluated using ROC curve analysis, decision curve analysis and calibration curve analysis. A two-sided P < 0.05 signified statistically significant difference.
Results
Participant Characteristics
During the study period, an aggregate of 204 consecutively enrolled adult patients with first-onset primary supratentorial brain hemorrhage, underwent conservative treatment for intracerebral hematoma within poststroke 24 hours at our hospital. Thereafter, we excluded 48 patients with other neurological diseases (17 cases), other severe diseases in other organs (21 cases) or some specific conditions (10 cases). Finally, one hundred and fifty-six patients were analyzed statistically.
Among this group of 156 patients, 53 patients had their blood-sample collections at multiple time-points. In addition, a total of 53 controls were selected for comparing serum SPARCL1 levels after acute ICH. This cohort of 53 patients were aged from 44 to 85 years (mean, 64.1 years; SD, 11.8 years) and contained 27 males and 26 females. This host of controls were aged from 40 to 88 years (mean, 63.1 years; SD, 12.8 years) and included 29 males and 24 females. By comparison, mean age and gender percentage insignificantly differed between that portion of patients and controls (both P>0.05).
A total of 89 males and 67 females constituted this group of patients, who were aged from 42 to 85 years (mean, 61.7 years; SD, 11.2 years). As for vascular risk factors, hypertension, diabetes mellitus, dyslipidemia, cigarette smoking and alcohol drinking were found in 99, 34, 55, 60 and 66 patients, respectively. As regards specific medications, statins, anticoagulants and antiplatelet agents were orally taken by 45, 10, and 23 patients, respectively. Hospital admission time varied between 0.5 and 24.0 h (median, 8.5 h; percentiles 25th-75th, 5.5–14.3 h) since the onset of stroke symptom. Blood sampling time ranged from 1.5 to 26.0 h (median, 9.5 h; percentiles 25th-75th, 6.5–15.5 h) following stroke. Mean values of systolic arterial pressure and diastolic arterial pressure were 147.7 (range, 111–214 mmHg; SD, 23.4 mmHg) and 88.2 (range, 70–114 mmHg; SD, 9.8 mmHg), respectively. Concerning hematoma parameters, superficial hematomas, deep hematomas, intraventricular extension of hematoma and subarachnoidal extension of hematoma were revealed among 47, 109, 31 and 15 patients, respectively. NIHSS scores varied from 0 to 17 (median, 9; lower-upper quartiles, 6–11) and hematoma volume ranged from 2 to 39 mL (median, 10 mL; lower-upper quartiles, 6–21 mL).
Dynamic Change of Serum SPARCL1 Levels and Its Correlation with Illness Severity
In Figure 1, in contrast to controls, serum SPARCL1 levels of patients were substantially elevated at admission, peaked at day 1, plateaued at day 3, and thereafter were gradually reduced at day 5 until day 10, which during six time points after ICH were still significantly higher than those of controls (P<0.001).
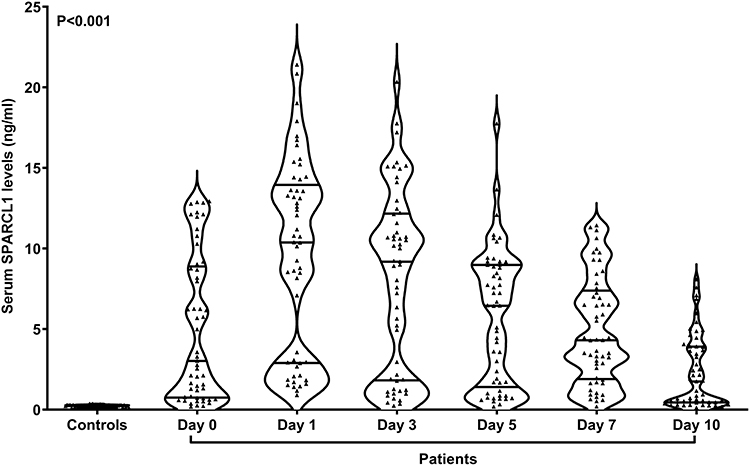 |
Figure 1 Serial changes of secreted protein acidic and rich in cysteine-like 1 levels in serum of patients with acute intracerebral hemorrhage. Serum secreted protein acidic and rich in cysteine-like 1 levels at admission and at days 1, 3, 5, 7 and 10 in patients were all substantially higher than those of controls, with the highest levels at days 1 and 3 after acute intracerebral hemorrhage among patients (P<0.001). Abbreviation: SPARCL1, secreted protein acidic and rich in cysteine-like 1. |
Baseline serum SPARCL1 levels were tightly correlated with admission NIHSS scores (P<0.001; Figure 2A) and hematoma volume (P<0.001; Figure 2B). Alternatively, serum SPARCL1 levels were also related to the presence of diabetes mellitus, intraventricular extension of hematoma and blood glucose levels (all P<0.05; Table 1). In the multivariate linear regression model, which incorporated NIHSS scores, hematoma volume, diabetes mellitus, intraventricular extension of hematoma and glucose levels, serum SPARCL1 levels were independently correlated with NIHSS scores (beta, 0.320; 95% confidence interval, 0.120–0.520; VIF, 2.633; P=0.002) and hematoma volume (beta, 0.145; 95% confidence interval, 0.052–0.239; VIF, 2.814; P=0.002).
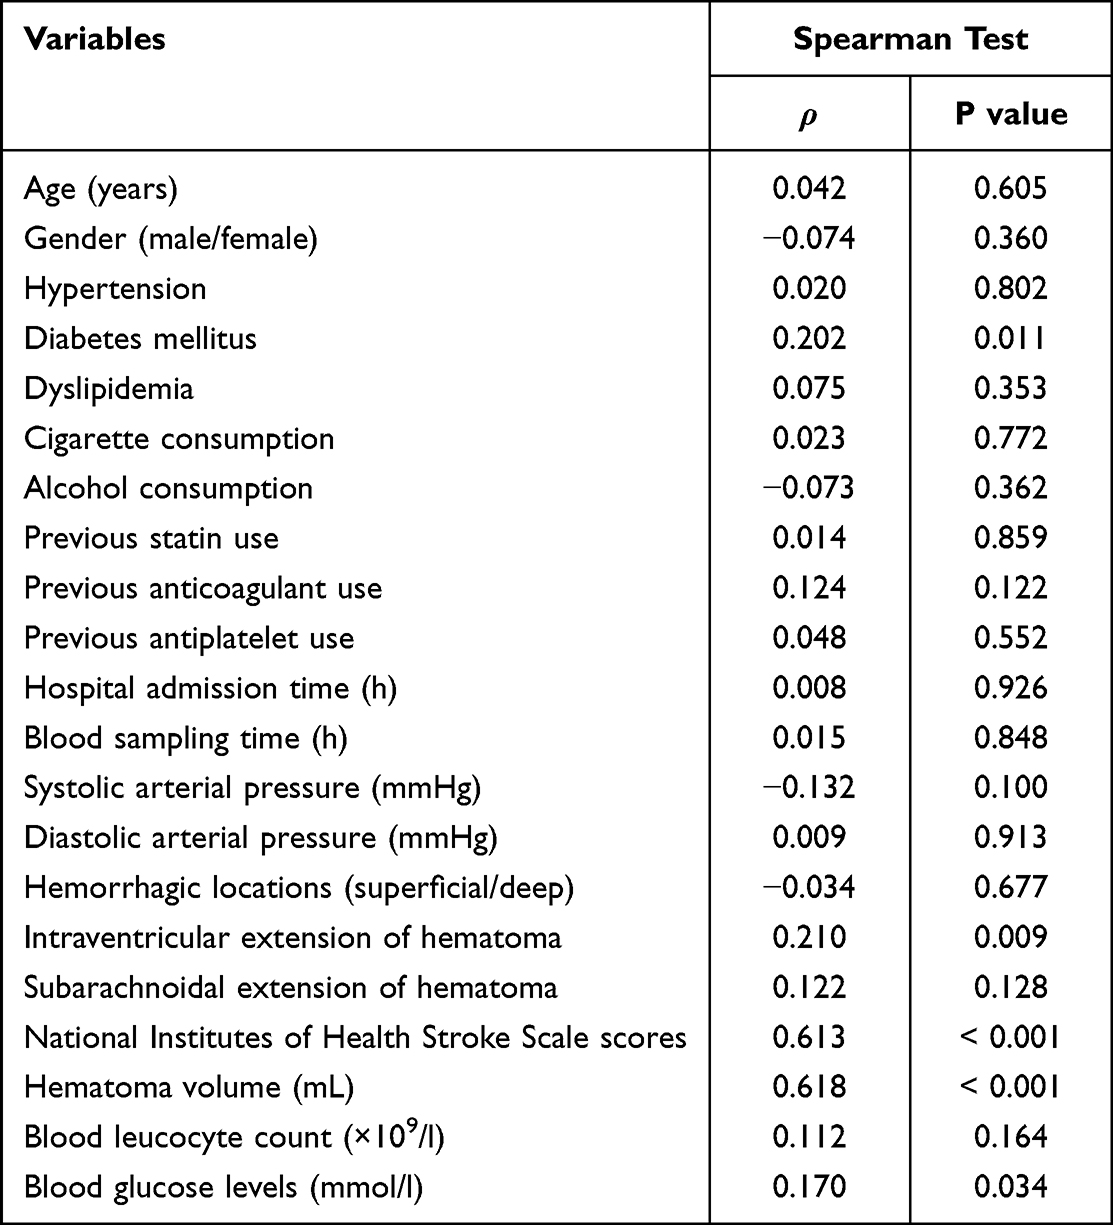 |
Table 1 Correlation Analysis of Serum Secreted Protein Acidic and Rich in Cysteine-Like 1 Levels After Acute Intracerebral Hemorrhage |
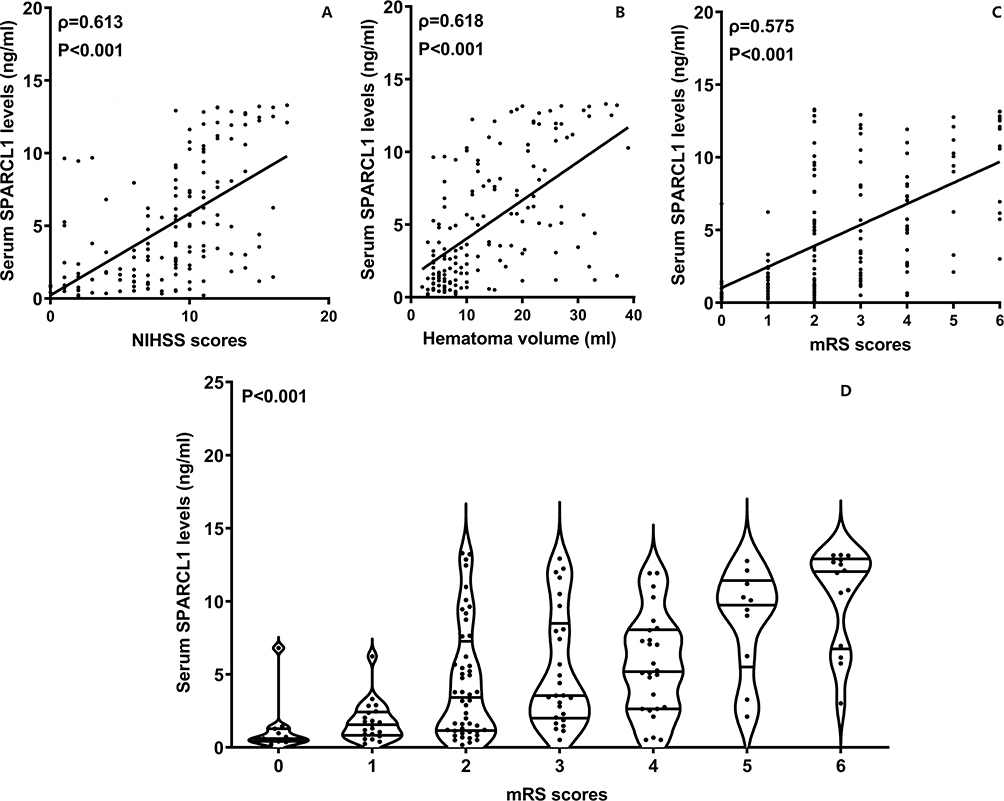 |
Figure 2 Relationship between serum secreted protein acidic and rich in cysteine-like 1 levels and severity in addition to six-month functional outcome after acute intracerebral hemorrhage in humans. (A): Relationship between serum secreted protein acidic and rich in cysteine-like 1 levels and National Institutes of Health Stroke Scale scores after acute intracerebral hemorrhage in humans. Serum secreted protein acidic and rich in cysteine-like 1 levels were significantly correlative with National Institutes of Health Stroke Scale scores of patients with acute intracerebral hemorrhage (P<0.001). (B): Relationship between serum secreted protein acidic and rich in cysteine-like 1 levels and hematoma volume of patients with acute intracerebral hemorrhage. Serum secreted protein acidic and rich in cysteine-like 1 levels had substantial correlation with hematoma volume following human acute intracerebral hemorrhage (P<0.001). (C): Relation of serum secreted protein acidic and rich in cysteine-like 1 levels to modified Rankin scale scores at six months following acute intracerebral hemorrhage. There was a prominent correlation between serum secreted protein acidic and rich in cysteine-like 1 levels and poststroke six-month modified Rankin scale scores (P<0.001). (D): Differences in terms of serum secreted protein acidic and rich in cysteine-like 1 levels among patients grouped based on modified Rankin scale scores at six months after acute intracerebral hemorrhage. Serum secreted protein acidic and rich in cysteine-like 1 levels were significantly lowest in patients with poststroke six-month modified Rankin scale score 0, followed by the scores from 1 to 5, and were substantially highest among those with the score 6 (P<0.001). Abbreviations: SPARCL1, secreted protein acidic and rich in cysteine-like 1; NIHSS, National Institutes of Health Stroke Scale; mRS, modified Rankin scale. |
Baseline Serum SPARCL1 Levels and Functional Outcome at Poststroke Six Months
Poststroke 6-month mRS scores varied from 0 to 6, with a median value of 2 (lower-upper quartiles, 2–4), and the scores from 0 to 6 were observed in 11, 21, 48, 26, 26, 10, and 14 patients, respectively. In Figure 2C, serum SPARCL1 levels were dramatically positively related to mRS scores, which was deemed as a continuous variable (P<0.001). And serum SPARCL1 levels were markedly elevated with increasing mRS scores from 0 to 6 (P<0.001; Figure 2D). As listed in Table 2, mRS scores had statistically significant correlation with age, intraventricular extension of hematoma, NIHSS scores, hematoma volume, blood glucose levels and serum SPARCL1 levels (all P<0.05). The abovementioned six factors were forced into the multivariate model and subsequently it was found that serum SPARCL1 levels (beta, 0.125; 95% confidence interval, 0.065–0.184; VIF, 1.649; P=0.011), NIHSS score (beta, 0.130; 95% confidence interval, 0.056–0.205; VIF, 2.660; P=0.001) and hematoma volume (beta, 0.069; 95% confidence interval, 0.025–0.113; VIF, 1.095; P=0.002) were independently correlated with poststroke six-month mRS scores.
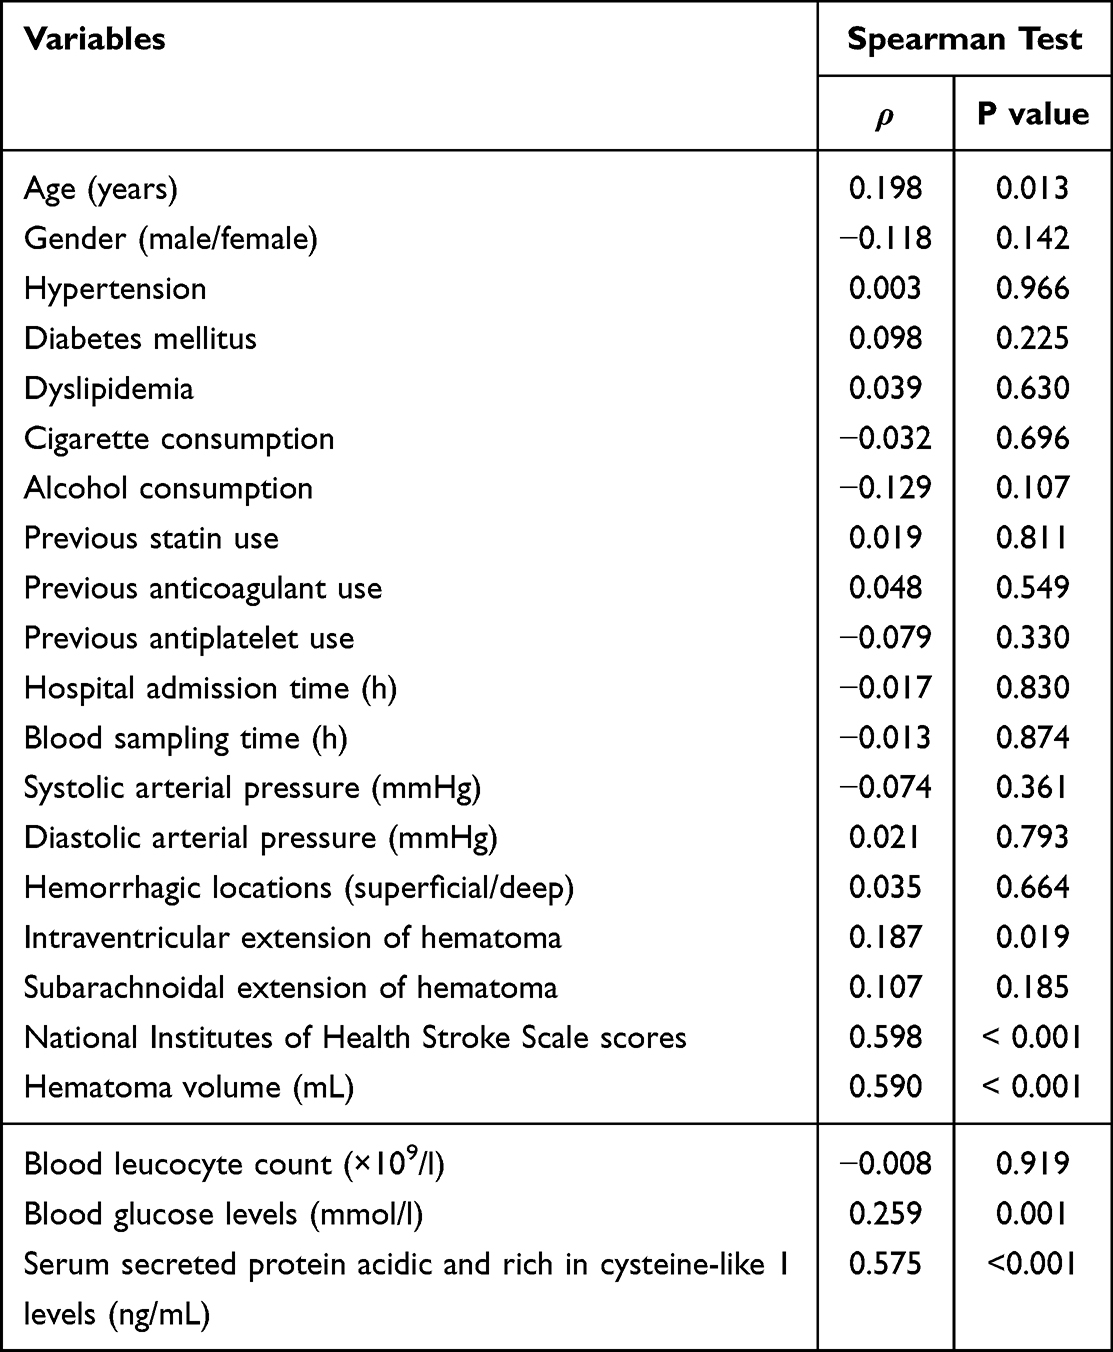 |
Table 2 Correlation Analysis of Six-Month Modified Rankin Scale Scores After Acute Intracerebral Hemorrhage |
In aggregate, seventy-six patients presented with poor prognosis (mRS scores of 3–6). As listed in Table 3, patients with a poor prognosis had substantially higher serum SPARCL1 levels than those with a good prognosis (P<0.001). Figure 3 shows that serum SPARCL1 levels efficiently predicted poor prognosis (P<0.001). Moreover, serum SPARCL1 levels above 2.04 ng/mL predicted poor prognosis with 88.16% sensitivity, 56.25% specificity, Youden index of 0.4441, positive predictive value of 65.7% and negative predictive value of 83.3%. As displayed in Figure 4, serum SPARCL1 levels were linearly correlated with risk of poor prognosis (P=0.061). As opposed to patients who presented with a good prognosis, those with a poor prognosis had significantly older age, a markedly higher proportion of intraventricular extension of hematoma, and substantially higher admission serum SPARCL1 levels, NIHSS scores, hematoma volume and blood glucose levels (all P<0.05; Table 3). The aforementioned significant variables were incorporated into the binary logistic regression model, and it was demonstrated that NIHSS scores (odds ratio, 1.312; 95% confidence interval, 1.116–1.542; P=0.001), hematoma volume (odds ratio, 1.098; 95% confidence interval, 1.017–1.149; P=0.013) and admission serum SPARCL1 levels (odds ratio, 1.132; 95% confidence interval, 1.006–1.275; P=0.040) emerged as the three independent predictors of poor prognosis. In Table 4, no interactions were found for associations of serum SPARCL1 levels with other variables, such as age, gender and chronic diseases (all P>0.05). Using independent predictors of poor prognosis, a prediction model was delineated in form of the nomogram (Figure 5). Under the calibration curve, the model kept stable (Figure 6). Under the decision curve, the model was of clinical effectiveness (Figure 7). Noteworthily, the model exhibited the strongest predictive efficiency, as compared with other variables and even combination of NIHSS scores and hematoma volume (all P<0.05; Figure 8).
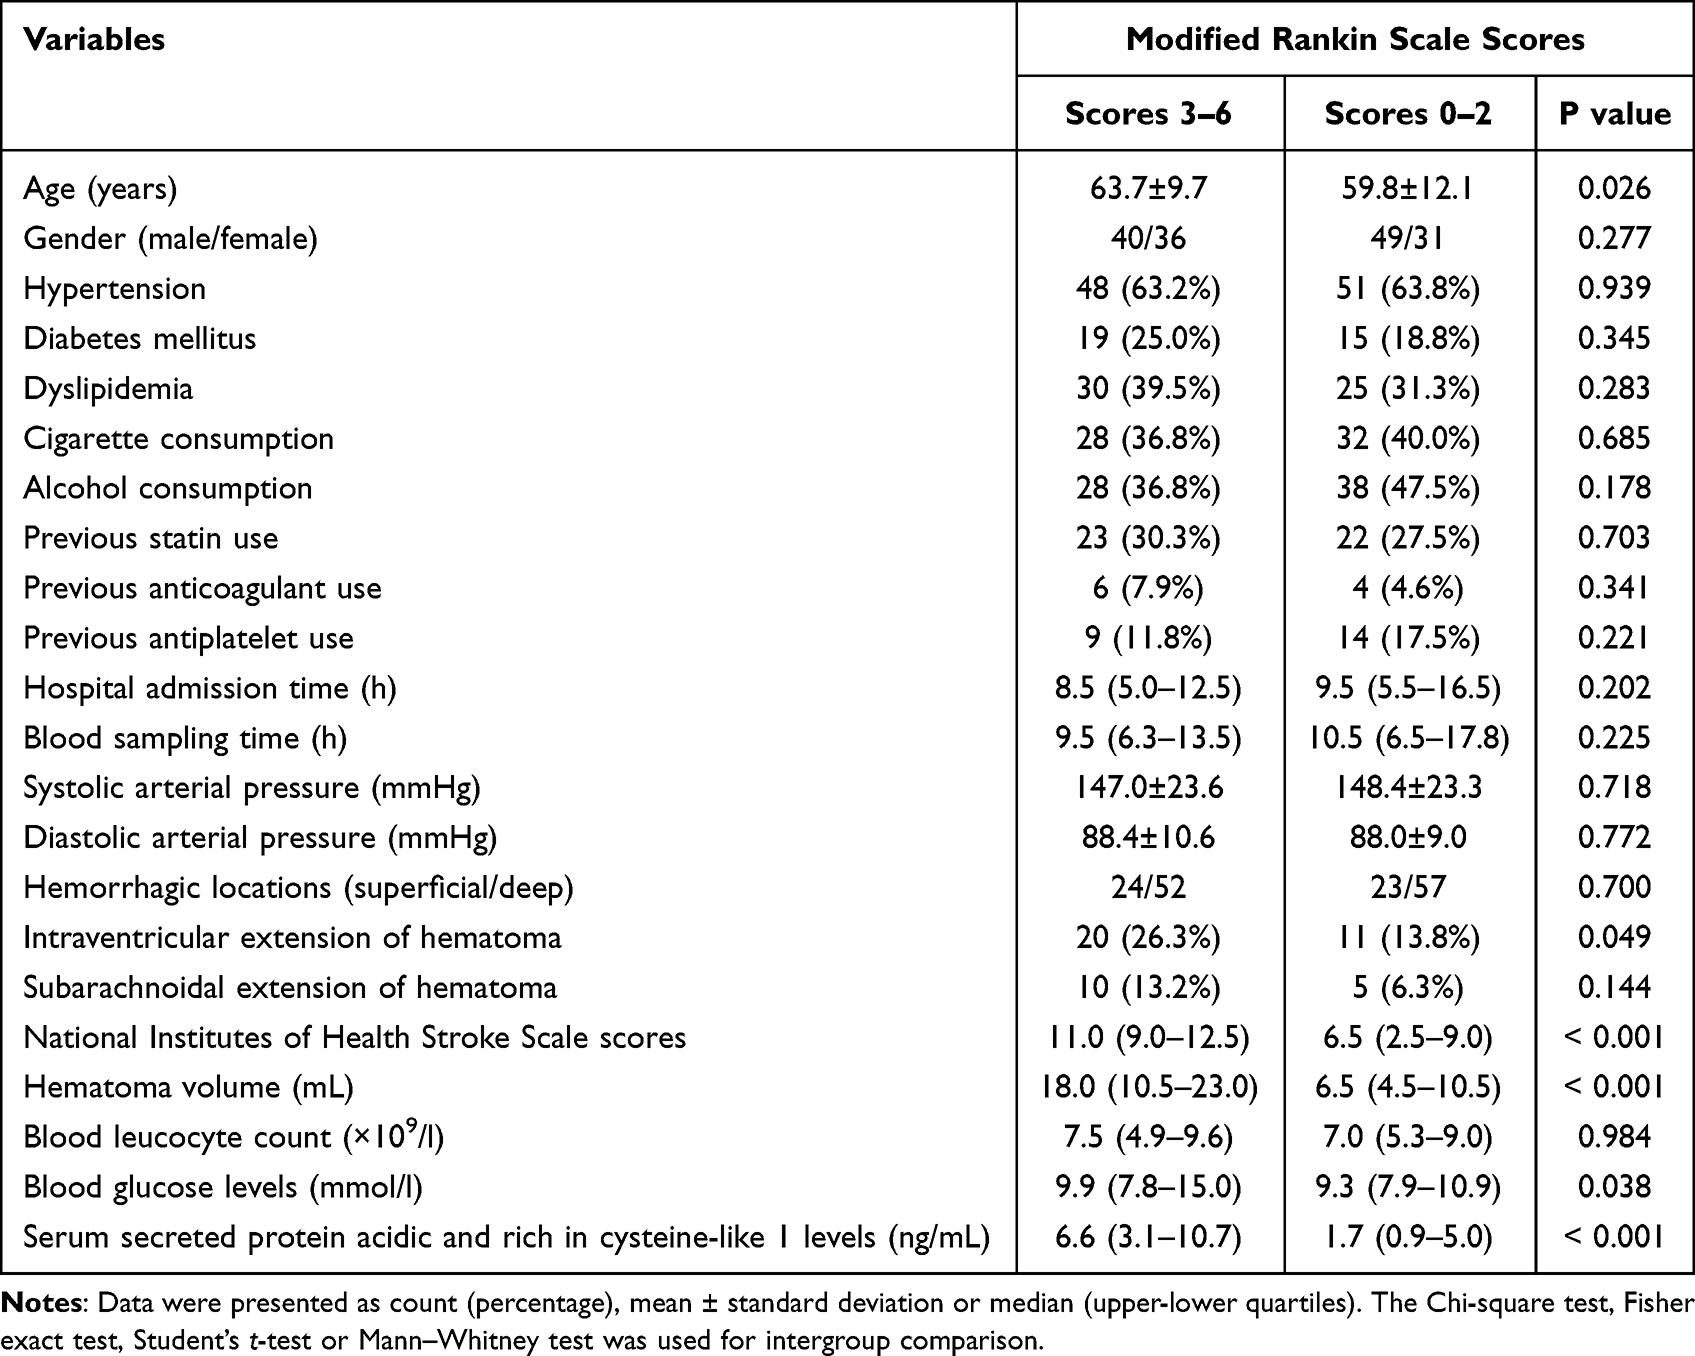 |
Table 3 Factors Related to Poor Prognosis at Six Months After Acute Intracerebral Hemorrhage |
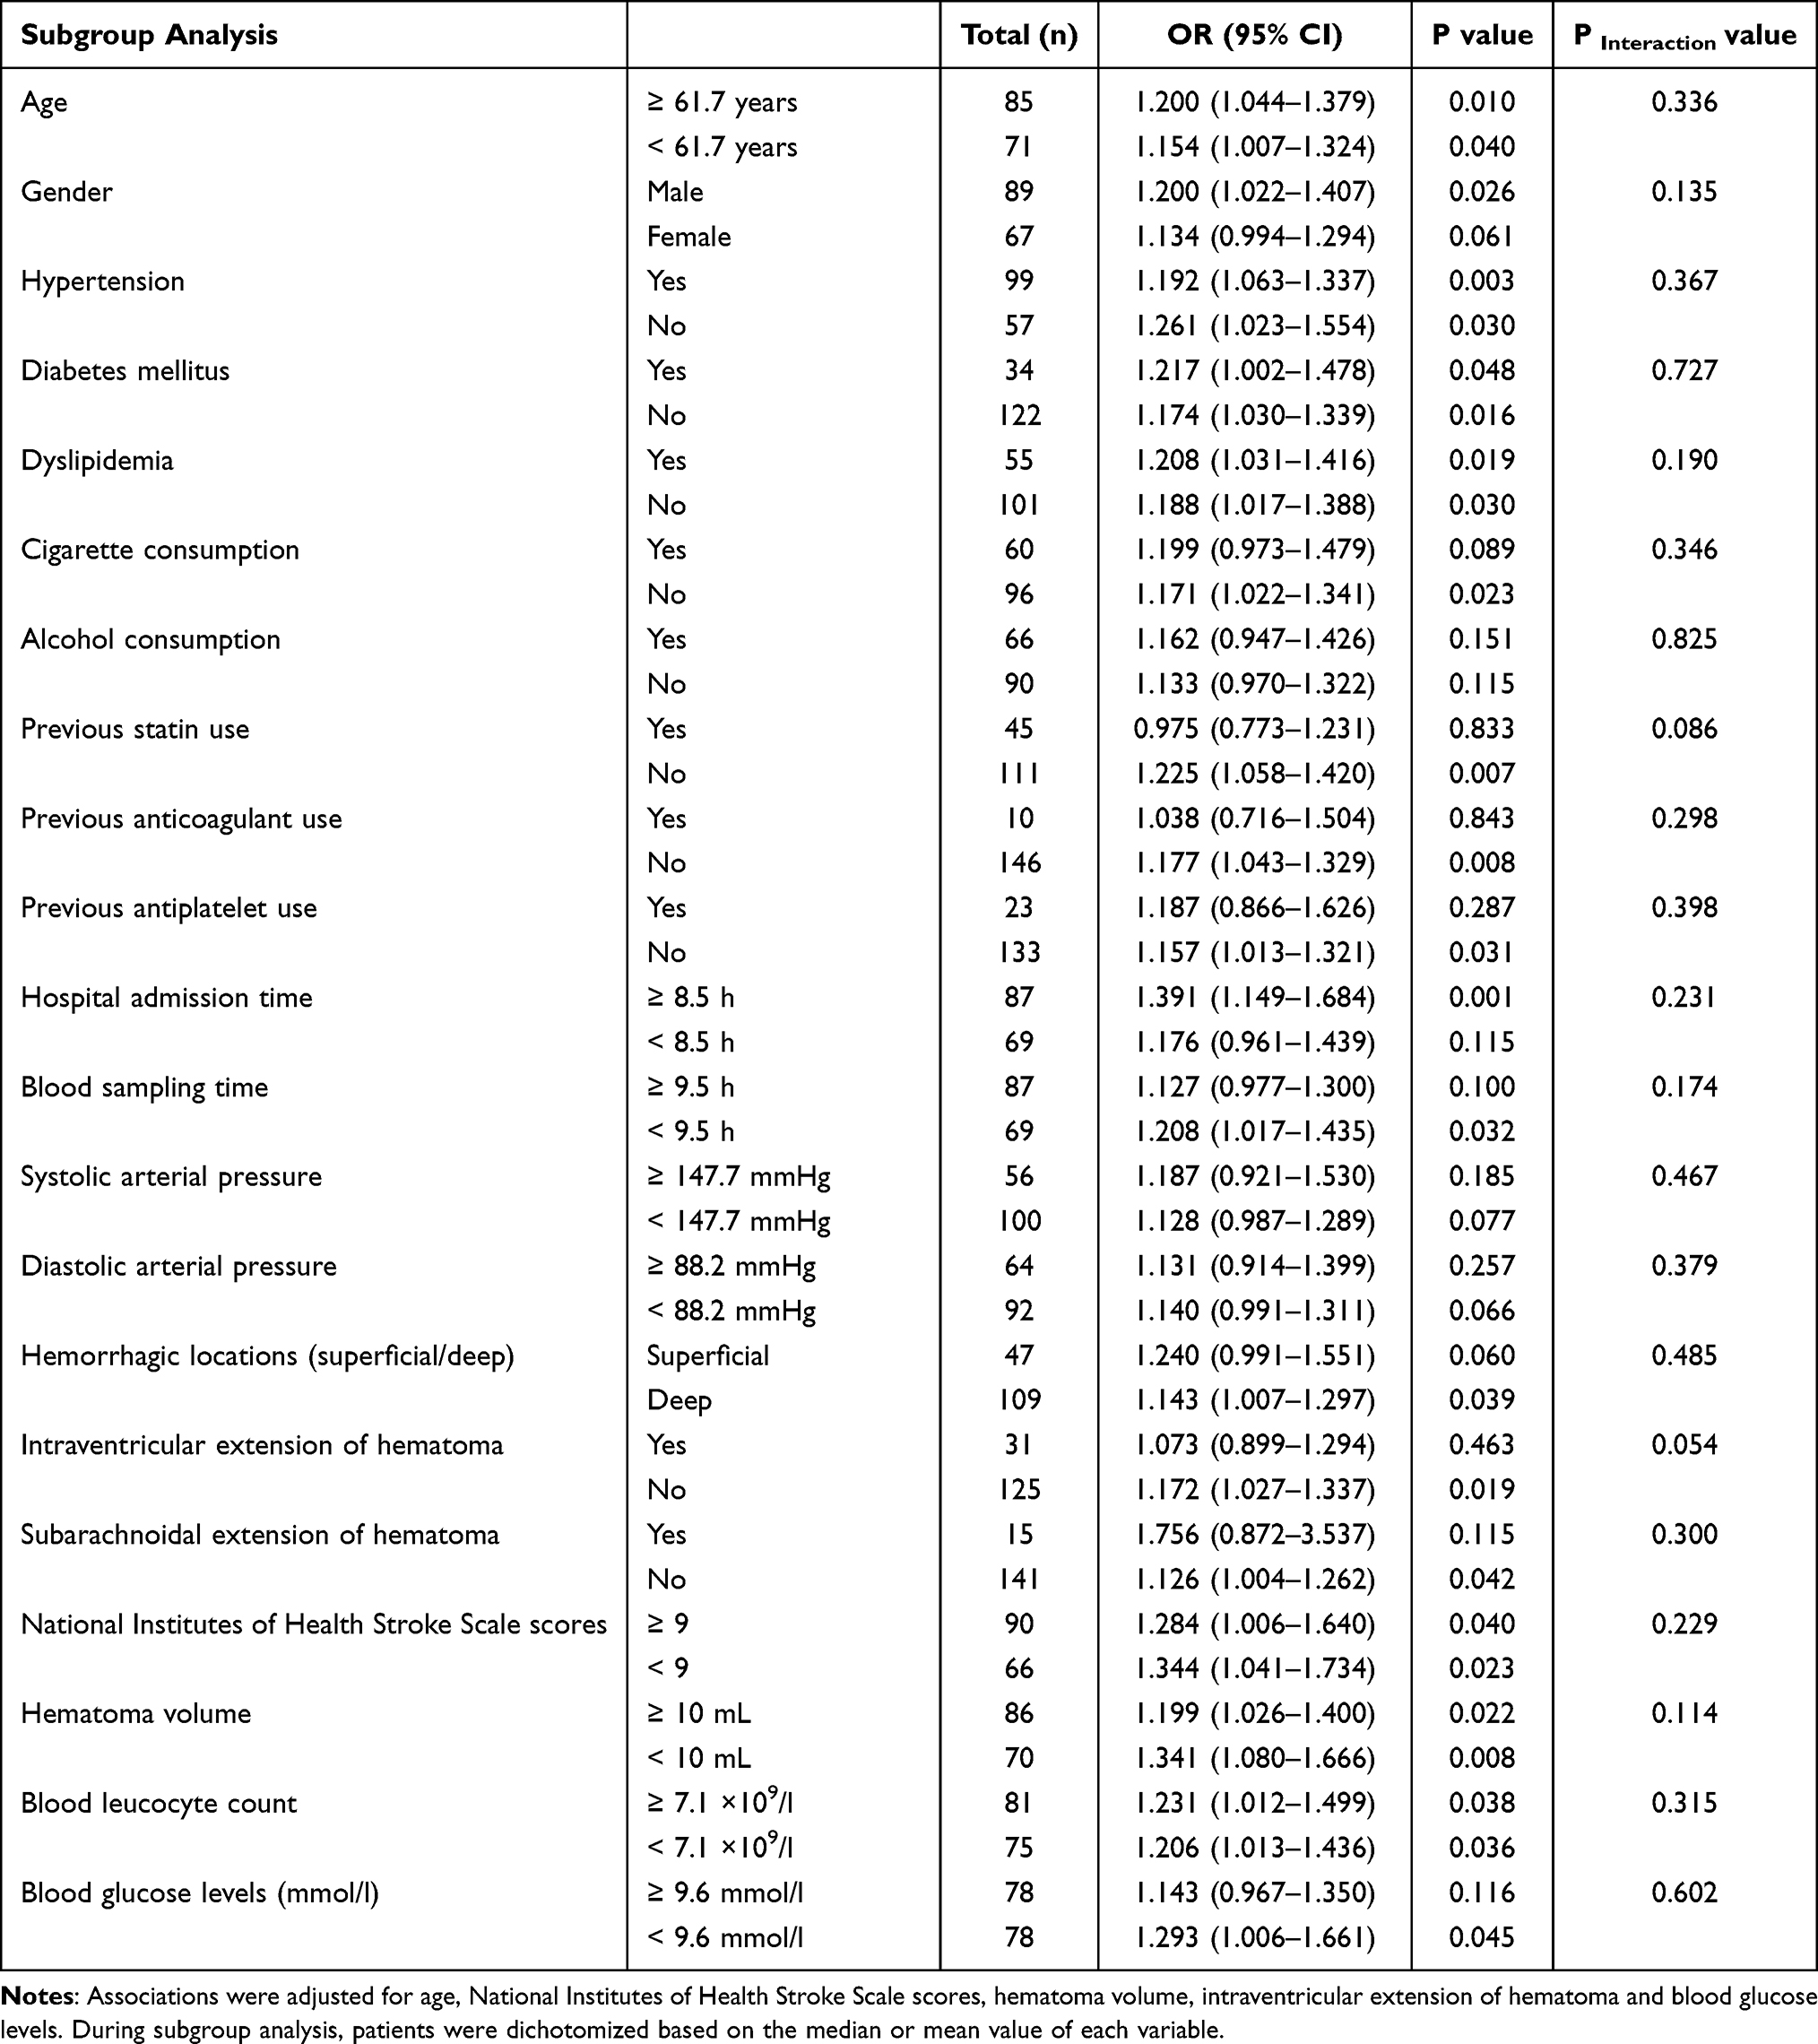 |
Table 4 Subgroup Analysis for the Association of Serum Secreted Protein Acidic and Rich in Cysteine-Like 1 Levels with 6-Month Poor Prognosis After Acute Intracerebral Hemorrhage and Interaction Analysis Between Subgroups |
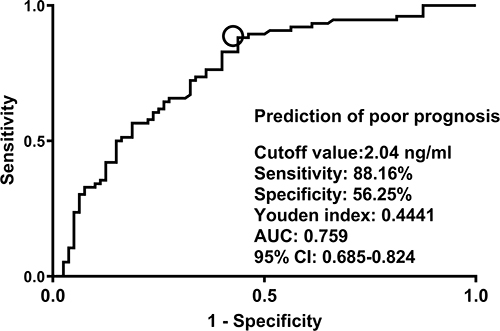 |
Figure 3 Ability with respect to serum secreted protein acidic and rich in cysteine-like 1 levels for predicting a poor prognosis at six months following acute intracerebral hemorrhage. Under the receiver operating characteristic curve, serum secreted protein acidic and rich in cysteine-like 1 levels efficiently distinguished the risk of a poor prognosis at 6 months after acute intracerebral hemorrhage (P<0.001). Using the Youden method, a suitable value of serum secreted protein acidic and rich in cysteine-like 1 levels was selected, with the corresponding sensitivity and specificity values. Circle indicates the cutoff value. Abbreviations: AUC, area under curve; 95% CI, 95% confidence interval. |
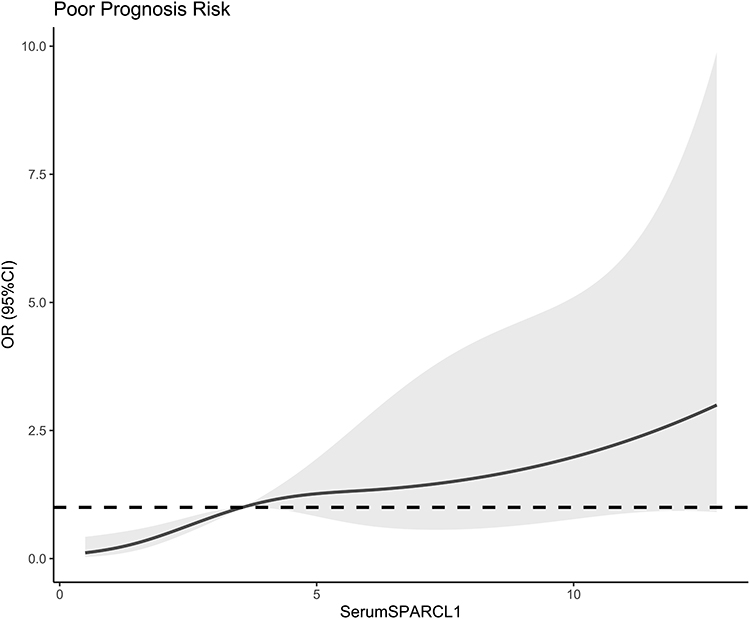 |
Figure 4 Restricted cubic spline showing relationship between serum secreted protein acidic and rich in cysteine-like 1 levels and risk of a poor prognosis at six months following acute intracerebral hemorrhage. There was a linear correlation between serum secreted protein acidic and rich in cysteine-like 1 levels and risk of a poor prognosis at six months following acute intracerebral hemorrhage (P>0.05). Abbreviations: SPARCL1, secreted protein acidic and rich in cysteine-like 1; OR, odds ratio; 95% CI, 95% confidence interval. |
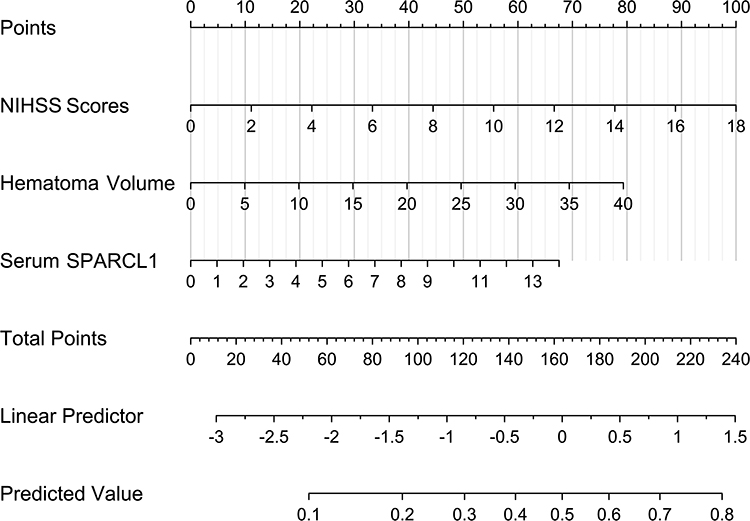 |
Figure 5 Nomogram predicting a poor prognosis at six months following acute intracerebral hemorrhage. Serum secreted protein acidic and rich in cysteine-like 1, hematoma volume and National Institutes of Health Stroke Scale scores were integrated to predict a poor prognosis at six months following acute intracerebral hemorrhage. Abbreviations: SPARCL1, secreted protein acidic and rich in cysteine-like 1; NIHSS, National Institutes of Health Stroke Scale. |
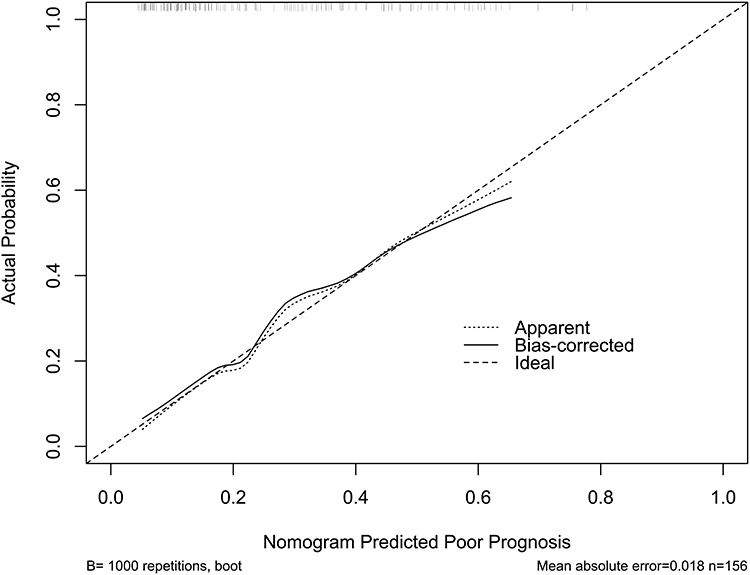 |
Figure 6 Calibration curve verifying stability of nomogram for predicting a poor prognosis at poststroke six months. The constructed prognosis prediction model was of comparative stability. |
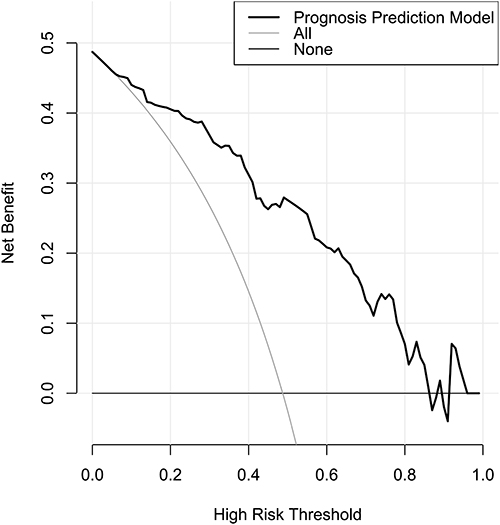 |
Figure 7 Decision curve validating clinical usability of nomogram in discriminating risk of a prognosis at poststroke six months. The configured prognosis prediction model was of relative efficiency in clinical work. |
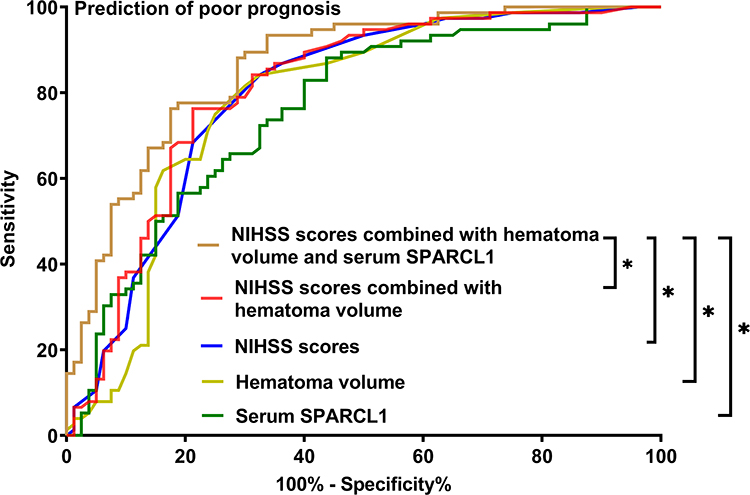 |
Figure 8 Differences in terms of prognosis prediction abilities between the built prognosis prediction model and other variables under the receiver operating characteristic curve. As compared to other variables, including combination of National Institutes of Health Stroke Scale scores with hematoma volume, National Institutes of Health Stroke Scale, hematoma volume and serum secreted protein acidic and rich in cysteine-like 1, the prognosis prediction model integrating all of them showed significantly higher area under curve (all *P<0.05). Abbreviations: SPARCL1, secreted protein acidic and rich in cysteine-like 1; NIHSS, National Institutes of Health Stroke Scale. |
Baseline Serum SPARCL1 Levels and Risk of END Following ICH
Totally, 41 patients experienced END. Table 5 shows that patients with END exhibited markedly higher serum SPARCL1 levels than the other remainders (P<0.001). As displayed in Figure 9, serum SPARCL1 levels significantly discriminated patients at risk of END (P<0.001). Moreover, serum SPARCL1 levels above 2.90 ng/mL predicted END with 85.37% sensitivity, 54.78% specificity, Youden index of 0.4015, positive predictive value of 40.2% and negative predictive value of 91.3%. Alternatively, there was a linear relationship between serum SPARCL1 levels and the END risk under restricted cubic spline (P=0.286; Figure 10). In comparison to patients without the development of END, those with END showed substantially higher admission serum SPARCL1 levels, NIHSS scores, hematoma volume and blood glucose levels (all P<0.05; Table 5). The abovementioned significant variables were forced into the binary logistic regression model, and it was verified that NIHSS scores (odds ratio, 1.189; 95% confidence interval, 1.047–1.350; P=0.008) and admission serum SPARCL1 levels (odds ratio, 1.117; 95% confidence interval, 1.004–1.243; P=0.042) appeared as the two independent predictors of END. In Table 6, no interactions existed between serum SPARCL1 levels and other variables, such as age, gender and chronic diseases (all P>0.05). Using independent predictors (ie, serum SPARCL1 level and NIHSS scores) to configure a nomogram (Figure 11), the model was comparatively stable under the calibration curve (Figure 12) and was relatively clinically valuable under the decision curve (Figure 13). Disappointedly, the model exhibited the insignificantly higher predictive efficiency, in contrast to other variables (all P>0.05; Figure 14).
 |
Table 5 Factors in Relation to Early Neurologic Deterioration After Acute Intracerebral Hemorrhage |
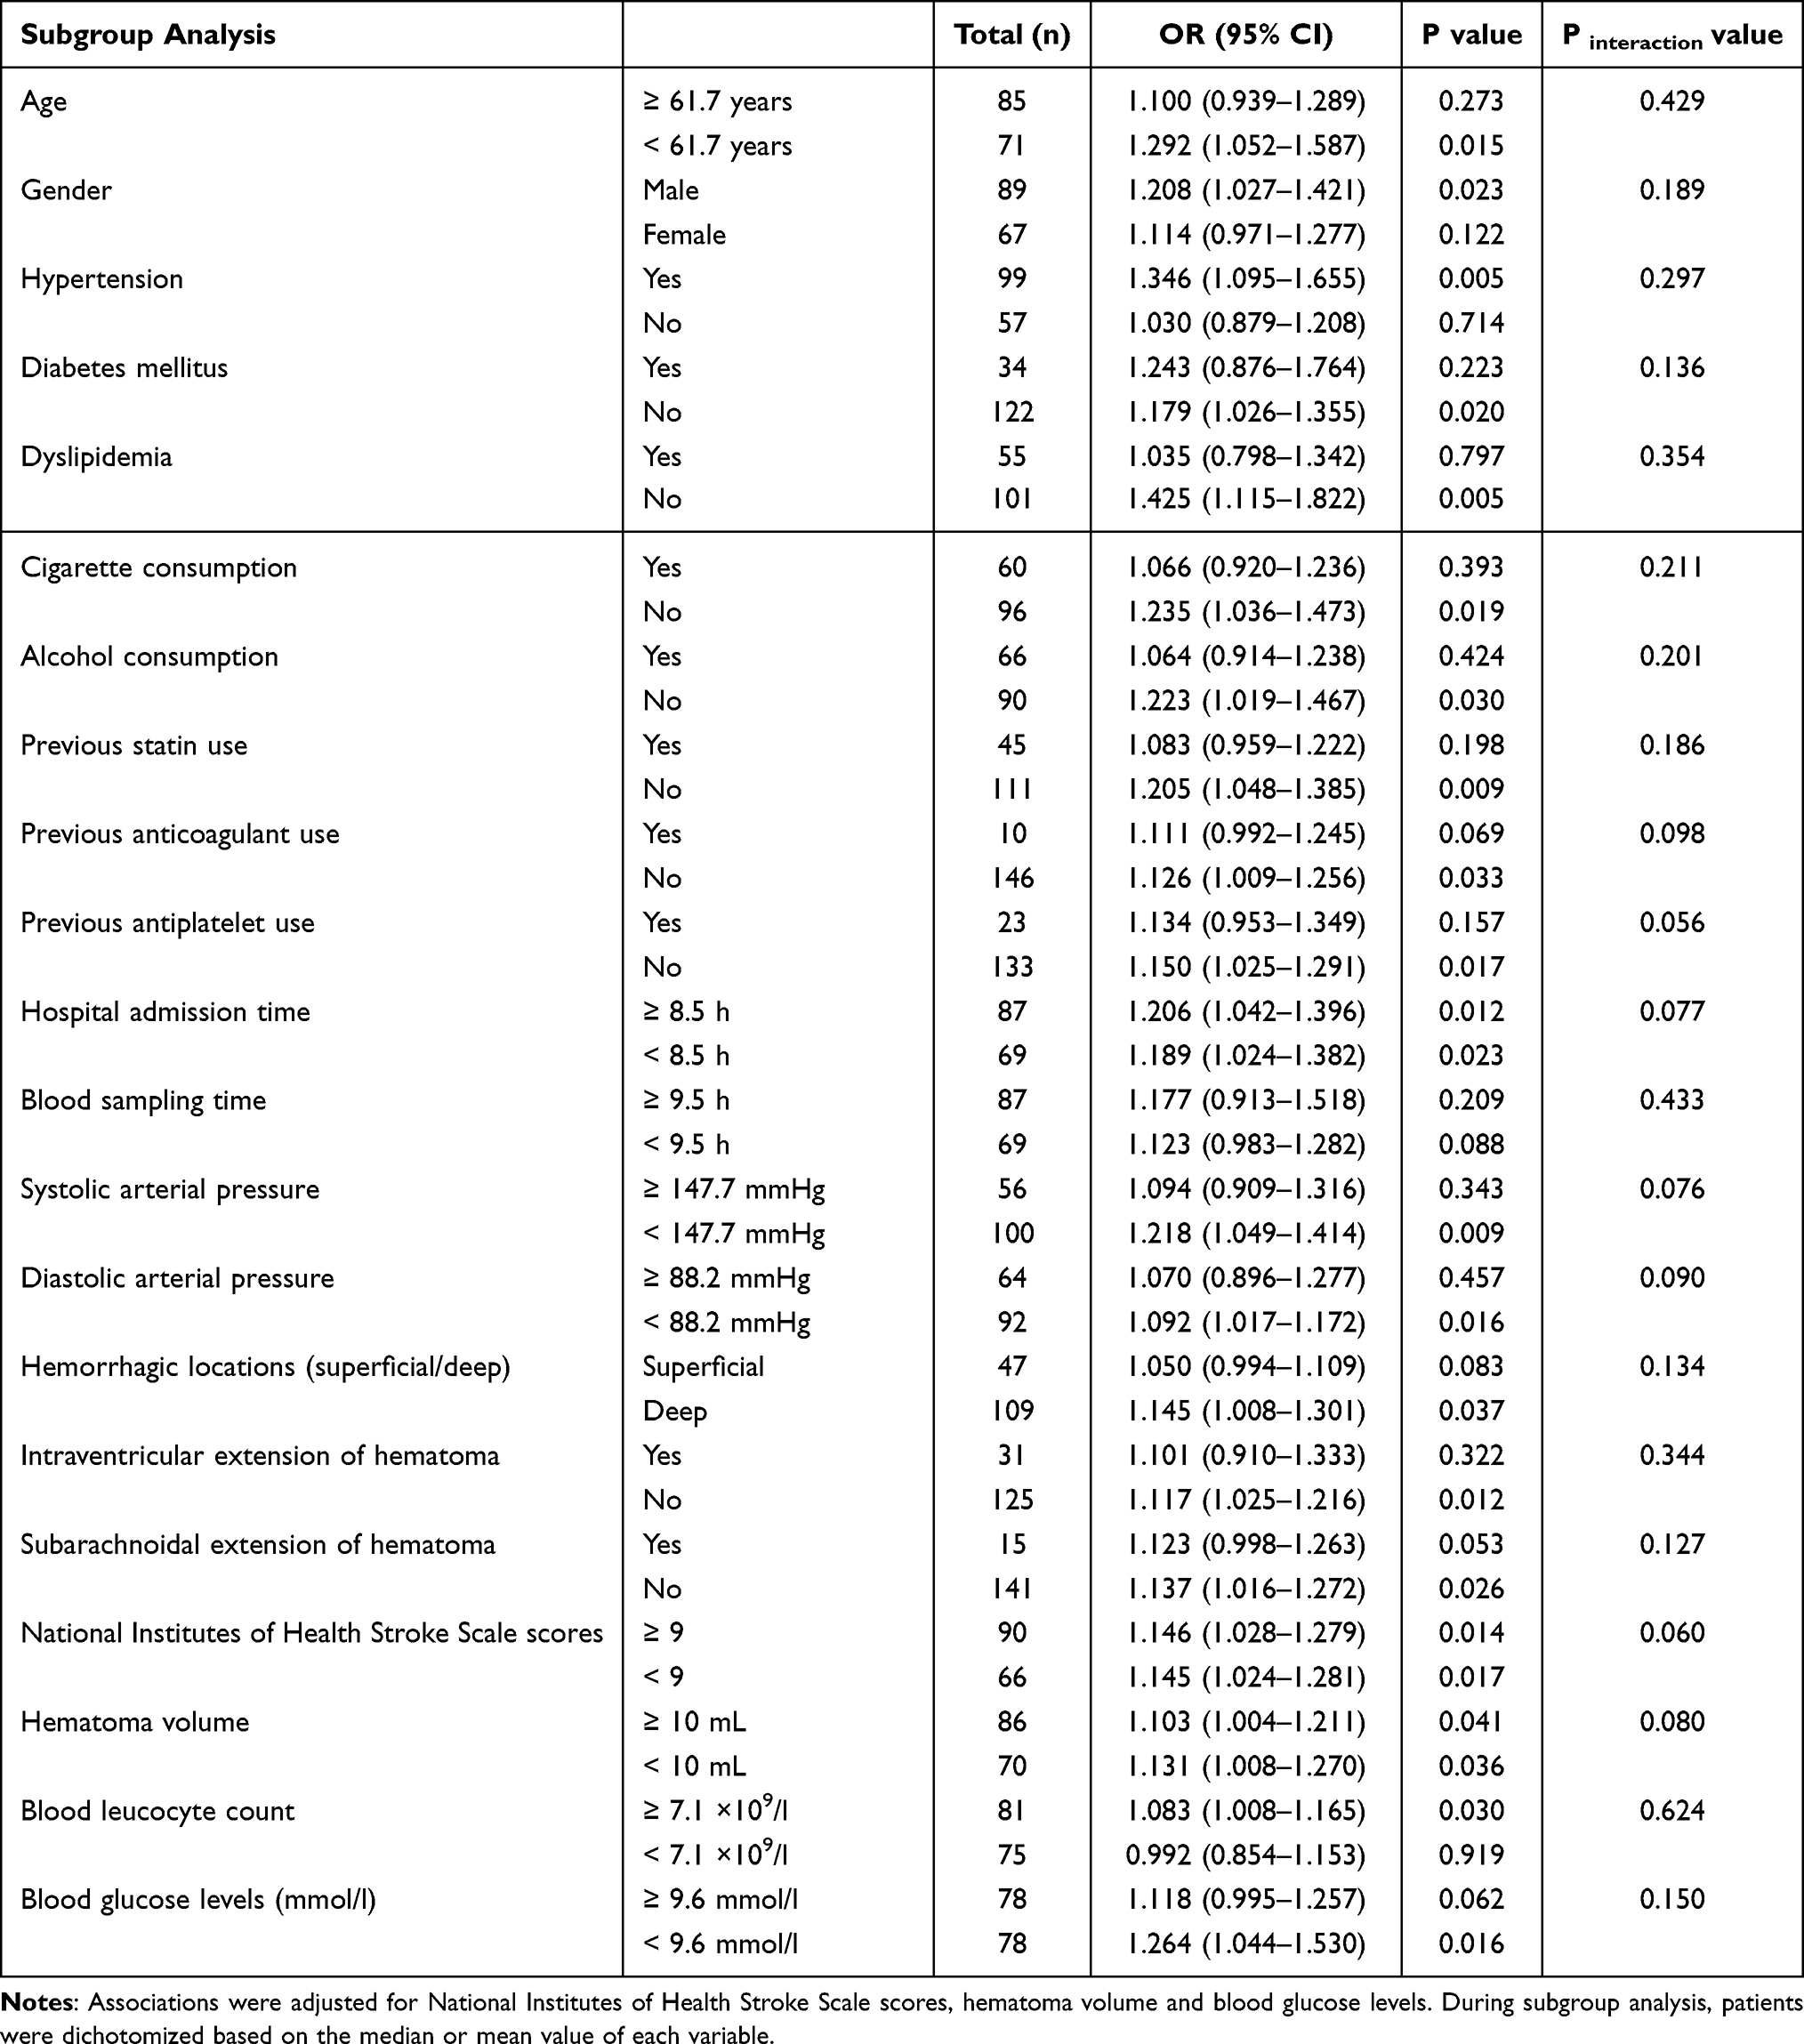 |
Table 6 Subgroup Analysis for the Association of Serum Secreted Protein Acidic and Rich in Cysteine-Like 1 Levels with Early Neurologic Deterioration After Acute Intracerebral Hemorrhage and Interaction Analysis Between Subgroups |
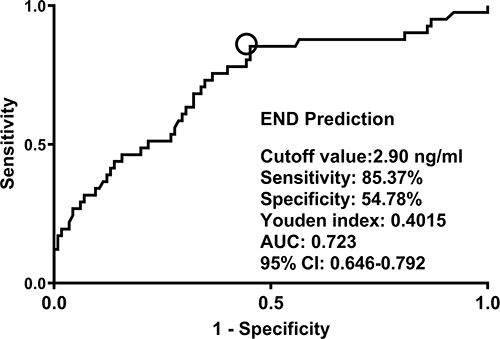 |
Figure 9 Capability with respect to serum secreted protein acidic and rich in cysteine-like 1 levels for predicting early neurological deterioration after acute intracerebral hemorrhage. Under the receiver operating characteristic curve, serum secreted protein acidic and rich in cysteine-like 1 levels efficiently distinguished the development of early neurologic deterioration after acute intracerebral hemorrhage (P<0.001). Using the Youden method, a suitable value of serum secreted protein acidic and rich in cysteine-like 1 levels was yielded, with the corresponding sensitivity and specificity values. Circle indicates the cutoff value. Abbreviations: AUC, area under curve; 95% CI, 95% confidence interval; END, early neurological deterioration. |
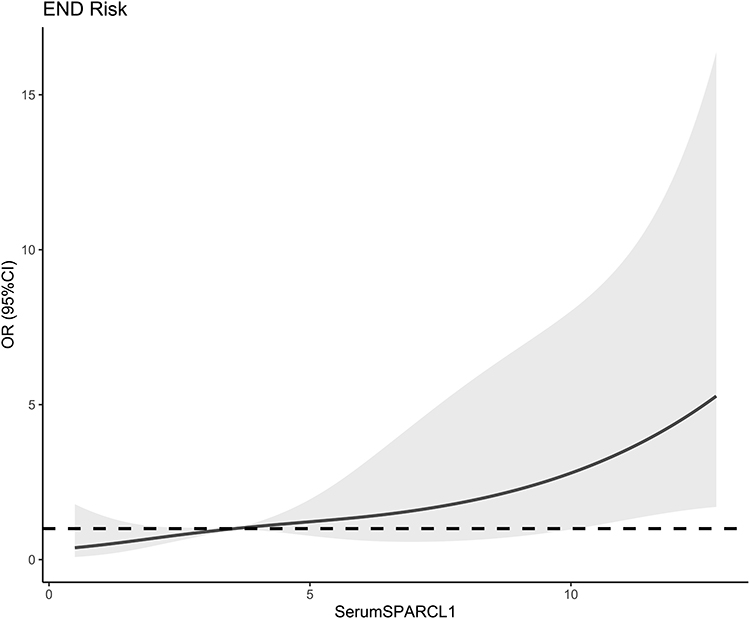 |
Figure 10 Restricted cubic spline displaying relationship between serum secreted protein acidic and rich in cysteine-like 1 levels and the development of early neurologic deterioration following acute intracerebral hemorrhage. There was a linear correlation between serum secreted protein acidic and rich in cysteine-like 1 levels and the development of early neurologic deterioration following acute intracerebral hemorrhage (P>0.05). Abbreviations: SPARCL1, secreted protein acidic and rich in cysteine-like 1; OR, odds ratio; 95% CI, 95% confidence interval; END, early neurologic deterioration. |
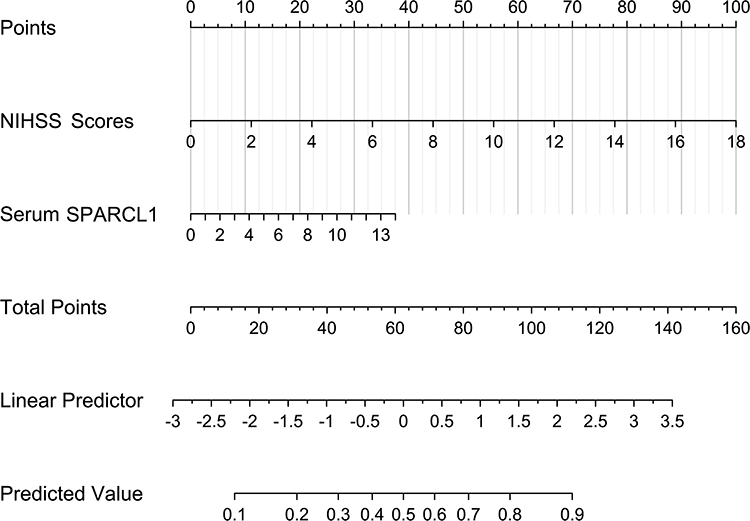 |
Figure 11 Nomogram predicting the development of early neurologic deterioration following acute intracerebral hemorrhage. Serum secreted protein acidic and rich in cysteine-like 1 and National Institutes of Health Stroke Scale scores were integrated to predict the development of early neurologic deterioration following acute intracerebral hemorrhage. Abbreviations: SPARCL1, secreted protein acidic and rich in cysteine-like 1; NIHSS, National Institutes of Health Stroke Scale; END, early neurologic deterioration. |
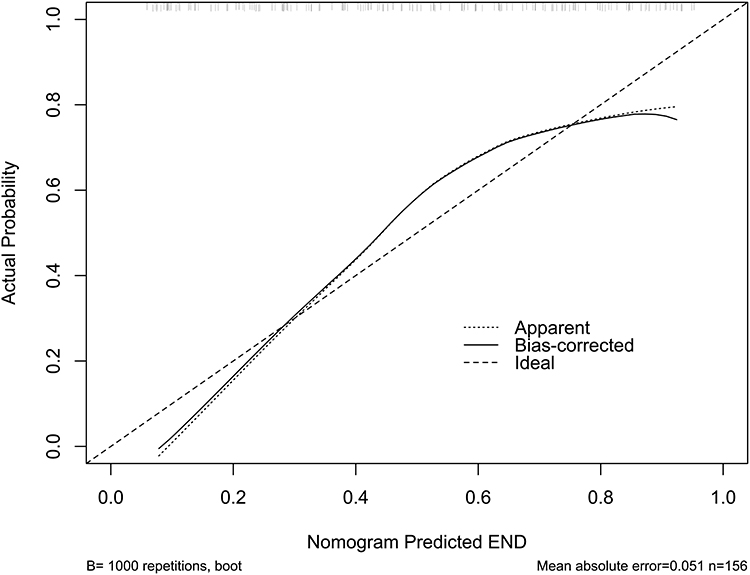 |
Figure 12 Calibration curve verifying stability of nomogram for predicting the development of early neurologic deterioration after acute intracerebral hemorrhage. The constructed model was of comparative stability for predicting the development of early neurologic deterioration. Abbreviation: END, early neurologic deterioration. |
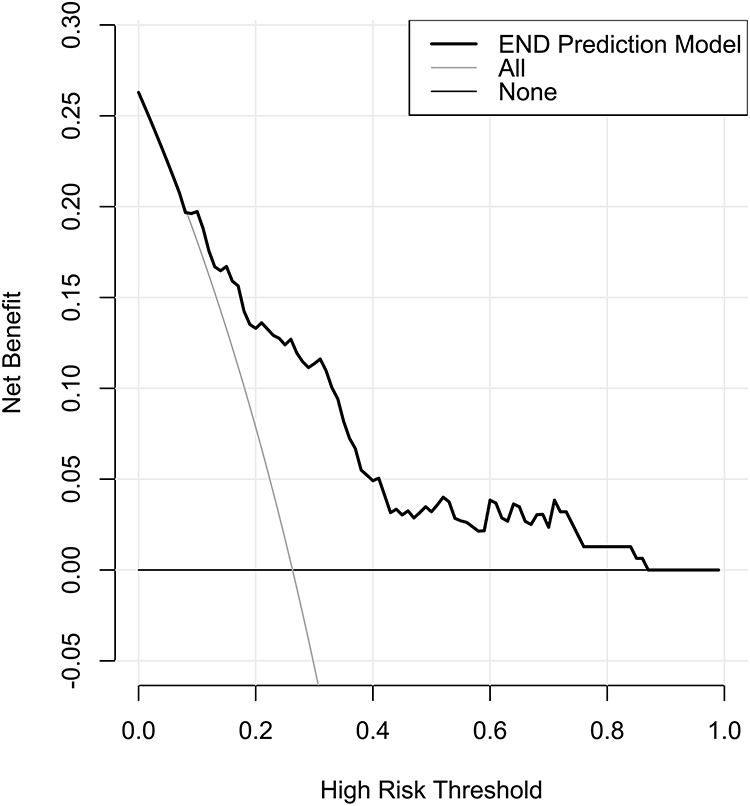 |
Figure 13 Decision curve validating clinical usability of nomogram in discriminating the development of early neurologic deterioration after acute intracerebral hemorrhage. The configured model was of relative efficiency in the prediction of early neurologic deterioration in clinical work of acute intracerebral hemorrhage. Abbreviation: END, early neurologic deterioration. |
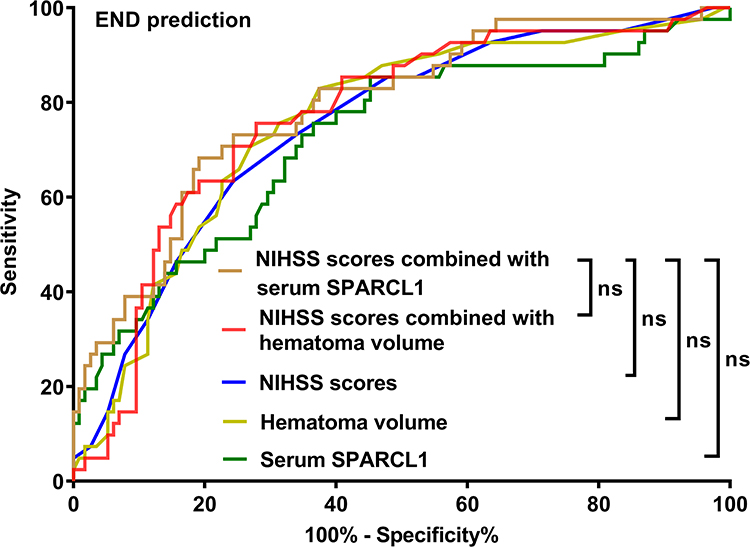 |
Figure 14 Differences in terms of prediction abilities for the development of early neurologic deterioration between the built prediction model and other variables under the receiver operating characteristic curve. As compared to other variables, including combination of National Institutes of Health Stroke Scale scores with hematoma volume, National Institutes of Health Stroke Scale, hematoma volume and serum secreted protein acidic and rich in cysteine-like 1, the prediction model showed insignificantly different area under curve for predicting the development of early neurologic deterioration (all P>0.05). Abbreviations: SPARCL1, secreted protein acidic and rich in cysteine-like 1; NIHSS, National Institutes of Health Stroke Scale; END, early neurologic deterioration; ns, non-significant. |
Discussion
In this study of ICH patients, multiple multivariate models were configured, so that some interesting results were found. First, ICH patients, in contrast to healthy controls, had a significant elevation of serum SPARCL1 levels, with the highest levels at days 1 and 3 and the higher levels persisting at least until day 10 after stroke. Second, serum SPARCL1 levels were not only independently correlated with admission NIHSS scores and hematoma volume but also with poststroke six-month mRS scores. Third, serum SPARCL emerged as an independent predictor of six-month poor prognosis and END. Last, the model containing serum SPARCL1 performed well in predicting poor prognosis at six months after acute ICH. Such data were strongly supportive of the presumption that serum SPARCL1 may be useful in prognosticating functional outcome of patients with ICH.
SPARCL1 is an antiadhesive glycoprotein and functions as the extracellular protein.12–14 It can regulate cell–matrix interactions and participates in tissue remodeling.25–27 Compelling evidence has confirmed that matricellular proteins are the important regulators of neuronal integrity.28–30 As such, SPARCL1 could impact synaptic stability and may play a pivotal effect in axonal regeneration after acute brain injury.31,32 Experimental data have shown that SPARCL1 in central nervous system was mainly localized in astrocytes under physiological conditions.15 In human brains, this protein was also observed.17,18 Moreover, its expressions by astrocytes were obviously upregulated in rats after transient ischemic stroke.16 Whether in ischemic stroke or intracerebral hemorrhage rats, SPARCL1 expressions were prominently increased in injured brain tissues.19 Notably, SPARCL1 immunoreactivity was also verified in human cerebrospinal fluid and serum samples, but was absent from any blood cell type.18 Such a clue indicates that SPARCL1 may be a brain-specific protein. In other words, SPARCL1 could be considered as a potential biomarker for reflecting severity and predicting clinical outcome in brain injury diseases. Also, it is postulated that serum SPARCL1, which was revealed in this study to have its levels with a significant enhancement after acute ICH, may be derived from injured brain tissues.
In a study of patients with acute ischemic stroke, serum SPARCL1 concentrations were verified to be positively correlated with clinical severity, when patients were dichotomized into the two groups (namely, admission NIHSS scores <5 versus ≥6), and moreover, serum SPARCL1 was found to be an independent predictor for stroke severity (ie, admission NIHSS scores ≥6).20 In another study of humans with severe traumatic brain injury, whether Glasgow coma scale was considered as a continuous variable, or transformed into a categorical variable, serum SPARCL1 levels were still independently related to Glasgow coma scale scores.21 Our study showed that serum SPARCL1 levels were independently correlated with NIHSS scores and hematoma volume after acute ICH. The above results may offer enough evidence to support the notion that SPARCL1 could be a promising serological marker for evaluating severity of acute brain injury diseases.
There was a recent clinical epidemiological investigation showing that serum SPARCL1 levels were independently associated with in-hospital mortality in a cohort of patients with severe traumatic brain injury.21 Our study extended follow-up time to six months and neurological function, but not mortality, was assessed in this group of ICH patients. Serum SPARCL1 levels were independently correlated with mRS scores. Interestingly, serum SPARCL1 emerged as an independent predictor of END and poor prognosis (mRS scores of 3–6). Furthermore, the two prediction models, which contained serum SPARCL1 and other independent predictors of END and poor prognosis in this group of patients, were constructed. Via a series of statistical methods, including ROC curve, calibration curve and decision curve analyses, the prognosis prediction model performed well and may be of clinical value. Our study built the restricted cubic spline and performed subgroup analysis with interaction identification. So, the results may be more scientific and reliable. Overall, it is believably conceived that serum SPARCL1 may be a useful prognostic biomarker of acute ICH and its measurement may aid in clinical prognostication of long-term functional outcome following acute ICH.
There are several strengths and weaknesses in this study. The strengths are that (1) to the best of our knowledge, this is the first series for verifying relationships between serum SPARCL1 levels, severity, prognosis and END after ICH using multivariate analysis; (2) a cohort of patients with supratentorial ICH were selected, so that the sample homogeneity could be guaranteed, and therefore the conclusions may be more scientific and reliable. Three weaknesses are mentioned. (1) only 14 cases had mRS score 6 in this cohort, denoting that 14 patients were deceased within poststroke six months. Owing to a small sample size, a statistical analysis is not performed for investigating relationship between serum SPARCL1 levels and mortality after ICH. Nevertheless, Figure 2 shows that serum SPARCL1 levels were significantly correlated with mRS scores. In other words, serum SPARCL1 levels may be higher in the death than in the alive. However, although we have demonstrated that serum SPARCL may be a potential biomarker of ICH, it is interesting if association of serum SPARCL levels with mortality will be verified in a large cohort study, in which enough dead patients could be included. (2) There is a subgroup of ICH, which is characterized by a small size of the lesion and manifests clinically as a lacunar syndrome, named as hemorrhagic lacunar stroke.33 This subgroup, which is usually free of in-hospital death and clinical symptom at discharge in 22.8% of cases, accounts for 7.4% of all ICH cases and is associated with a more favorable prognosis as compared to the remaining group.33 Because all patients with ICH were admitted at emergency center in this study, such a subgroup of patients were not found and thereof not included for an investigational study. However, a further study of such a subgroup for determining prognostic associations with serum SPARCL1 levels may be informatory and clinically valuable in ICH research. (3) although close relation of serum SPARCL1 levels to stroke severity and prognosis following ICH has been confirmed in the current study, the comparisons of prognostic ability between serum SPARCL1 and other biomarkers, such as serum copeptin, C-reactive protein and S100B, may be warranted in future clinical study.
Conclusions
Serum SPARCL1 levels are immediately increased during the early period after ICH, with persistent higher levels at least until day 10. Its admission levels, in independent correlation with NIHSS scores and hematoma volume, were associated with END and poststroke six-month poor prognosis. Also, the prediction model, in which serum SPARCL1, NIHSS scores and hematoma volume were integrated, displayed a significantly strong discriminatory efficiency for poor prognosis. Thus, it is hypothesized that SPARCL1, as a potential serological biomarker, may be of clinical benefit in prognosticating clinical outcome following acute ICH.
Ethics Approval and Consent to Participate
The current study complied with the guidelines of the Declaration of Helsinki and its amendments. Its protocol was endorsed by the Ethics Committee at the First People’s Hospital of Fuyang District of Hangzhou City (No. FYD2019011). Signed informed consent forms were acquired from the patients’ next of kins or controls themselves.
Data Sharing Statement
The datasets generated and/or analyzed during the current study are not publicly available because they are personal data but are available from the corresponding author upon reasonable request.
Acknowledgments
We gratefully thank all study participants, their relatives, and the staff at the recruitment centers for their invaluable contributions.
Funding
This research was financially supported by the Hangzhou Science and Technology Plan Project (No. 202107071918000249496).
Disclosure
The authors declared no potential conflicts of interest in this work.
References
1. Qureshi AI, Tuhrim S, Broderick JP, Batjer HH, Hondo H, Hanley DF. Spontaneous intracerebral hemorrhage. N Engl J Med. 2001;344(19):1450–1460. doi:10.1056/NEJM200105103441907
2. Mendiola JMF, Arboix A, García-Eroles L, Sánchez-López MJ. Acute spontaneous lobar cerebral hemorrhages present a different clinical profile and a more severe early prognosis than deep subcortical intracerebral hemorrhages-A hospital-based stroke registry study. Biomedicines. 2023;11(1):223. doi:10.3390/biomedicines11010223
3. Sheth KN. Spontaneous intracerebral hemorrhage. N Engl J Med. 2022;387(17):1589–1596. doi:10.1056/NEJMra2201449
4. Zhu H, Wang Z, Yu J, et al. Role and mechanisms of cytokines in the secondary brain injury after intracerebral hemorrhage. Prog Neurobiol. 2019;178:101610. doi:10.1016/j.pneurobio.2019.03.003
5. Weimar C, Kleine-Borgmann J. Epidemiology, prognosis and prevention of non-traumatic intracerebral hemorrhage. Curr Pharm Des. 2017;23(15):2193–2196. doi:10.2174/1381612822666161027152234
6. Leira R, Dávalos A, Silva Y, et al. Early neurologic deterioration in intracerebral hemorrhage: predictors and associated factors. Neurology. 2004;63(3):461–467. doi:10.1212/01.wnl.0000133204.81153.ac
7. Kwah LK, Diong J. National Institutes of Health Stroke Scale (NIHSS). J Physiother. 2014;60(1):61. doi:10.1016/j.jphys.2013.12.012
8. LoPresti MA, Bruce SS, Camacho E, et al. Hematoma volume as the major determinant of outcomes after intracerebral hemorrhage. J Neurol Sci. 2014;345(1–2):3–7. doi:10.1016/j.jns.2014.06.057
9. Wu X, Liu M, Yan T, et al. Plasma PRPC levels correlate with severity and prognosis of intracerebral hemorrhage. Front Neurol. 2022;13:913926. doi:10.3389/fneur.2022.913926
10. Wu X, Yan T, Wang Z, et al. Role of plasma Apo-J as a biomarker of severity and outcome after intracerebral hemorrhage: a prospective and cohort study. Clin Chim Acta. 2022;533:148–155. doi:10.1016/j.cca.2022.06.018
11. Yan T, Wang ZF, Wu XY, et al. Plasma SIRT3 as a biomarker of severity and prognosis after acute intracerebral hemorrhage: a prospective cohort study. Neuropsychiatr Dis Treat. 2022;18:2199–2210. doi:10.2147/NDT.S376717
12. Brekken RA, Sullivan MM, Workman G, et al. Expression and characterization of murine hevin (SC1), a member of the SPARC family of matricellular proteins. J Histochem Cytochem. 2004;52(6):735–748. doi:10.1369/jhc.3A6245.2004
13. Girard JP, Springer TA. Cloning from purified high endothelial venule cells of hevin, a close relative of the antiadhesive extracellular matrix protein SPARC. Immunity. 1995;2(1):113–123. doi:10.1016/1074-7613(95)90083-7
14. Isler SG, Schenk S, Bendik I, et al. Genomic organization and chromosomal mapping of SPARC-like 1, a gene down regulated in cancers. Int J Oncol. 2001;18(3):521–526. doi:10.3892/ijo.18.3.521
15. Kucukdereli H, Allen NJ, Lee AT, et al. Control of excitatory CNS synaptogenesis by astrocyte-secreted proteins Hevin and SPARC. Proc Natl Acad Sci U S A. 2011;108(32):E440–E449. doi:10.1073/pnas.1104977108
16. Mendis DB, Ivy GO, Brown IR. SC1, a brain extracellular matrix glycoprotein related to SPARC and follistatin, is expressed by rat cerebellar astrocytes following injury and during development. Brain Res. 1996;730(1–2):95–106. doi:10.1016/0006-8993(96)00440-4
17. Mongrédien R, Erdozain AM, Dumas S, et al. Cartography of hevin-expressing cells in the adult brain reveals prominent expression in astrocytes and parvalbumin neurons. Brain Struct Funct. 2019;224(3):1219–1244. doi:10.1007/s00429-019-01831-x
18. Nuñez-delMoral A, Brocos-Mosquera I, Vialou V, Callado LF, Erdozain AM. Characterization of Hevin (SPARCL1) immunoreactivity in postmortem human brain homogenates. Neuroscience. 2021;467:91–109. doi:10.1016/j.neuroscience.2021.05.017
19. Lively S, Schlichter LC. SC1/hevin identifies early white matter injury after ischemia and intracerebral hemorrhage in young and aged rats. J Neuropathol Exp Neurol. 2012;71(6):480–493. doi:10.1097/NEN.0b013e318256901c
20. Ambrosius W, Michalak S, Kazmierski R, Lukasik M, Andrzejewska N, Kozubski W. The association between serum matricellular protein: secreted protein acidic and rich in cysteine-like 1 levels and ischemic stroke severity. J Stroke Cerebrovasc Dis. 2018;27(3):682–685. doi:10.1016/j.jstrokecerebrovasdis.2017.09.060
21. Huang HB, Yang SB, Shen LJ, et al. A prospective study on serum secreted protein acidic and rich in cysteine-like 1 as a prognostic marker for severe traumatic brain injury. Clin Chim Acta. 2019;491:19–23. doi:10.1016/j.cca.2019.01.005
22. Kothari RU, Brott T, Broderick JP, et al. The ABCs of measuring intracerebral hemorrhage volumes. Stroke. 1996;27(8):1304–1305. doi:10.1161/01.str.27.8.1304
23. You S, Zheng D, Delcourt C, et al. Determinants of early versus delayed neurological deterioration in intracerebral hemorrhage. Stroke. 2019;50(6):1409–1414. doi:10.1161/STROKEAHA.118.024403
24. Hao Y, Avadhani R, Caron JL, et al. Efficacy and safety of minimally invasive surgery with thrombolysis in intracerebral haemorrhage evacuation (MISTIE III): a randomised, controlled, open-label, blinded endpoint Phase 3 trial. Lancet. 2019;393(10175):1021–1032. doi:10.1016/S0140-6736(19)30195-3
25. Taketomi T, Yasuda T, Morita R, et al. Autism-associated mutation in Hevin/Sparcl1 induces endoplasmic reticulum stress through structural instability. Sci Rep. 2022;12(1):11891. doi:10.1038/s41598-022-15784-5
26. Gagliardi F, Narayanan A, Mortini P. SPARCL1 a novel player in cancer biology. Crit Rev Oncol Hematol. 2017;109:63–68. doi:10.1016/j.critrevonc.2016.11.013
27. Cheng X, Chen X, Zhang M, Wan Y, Ge S, Cheng X. Sparcl1 and atherosclerosis. J Inflamm Res. 2023;16:2121–2127. doi:10.2147/JIR.S406907
28. Pervaiz N, Kathuria I, Aithabathula RV, Singla B. Matricellular proteins in atherosclerosis development. Matrix Biol. 2023;120:1–23. doi:10.1016/j.matbio.2023.04.003
29. Feng D, Gerarduzzi C. Emerging Roles of matricellular proteins in systemic sclerosis. Int J Mol Sci. 2020;21(13):4776. doi:10.3390/ijms21134776
30. Pinto AR. Matricellular proteins as critical regulators of fibrosis. Circ Res. 2021;129(11):1036–1038. doi:10.1161/CIRCRESAHA.121.320273
31. Brayman VL, Taetzsch T, Miko M, Dahal S, Risher WC, Valdez G. Roles of the synaptic molecules Hevin and SPARC in mouse neuromuscular junction development and repair. Neurosci Lett. 2021;746:135663. doi:10.1016/j.neulet.2021.135663
32. Fan S, Gangwar SP, Machius M, Rudenko G. Interplay between hevin, SPARC, and MDGAs: modulators of neurexin-neuroligin transsynaptic bridges. Structure. 2021;29(7):664–678.e6. doi:10.1016/j.str.2021.01.003
33. Arboix A, García-Eroles L, Massons J, Oliveres M, Targa C. Hemorrhagic lacunar stroke. Cerebrovasc Dis. 2000;10(3):229–234. doi:10.1159/000016061
 © 2023 The Author(s). This work is published and licensed by Dove Medical Press Limited. The full terms of this license are available at https://www.dovepress.com/terms.php and incorporate the Creative Commons Attribution - Non Commercial (unported, v3.0) License.
By accessing the work you hereby accept the Terms. Non-commercial uses of the work are permitted without any further permission from Dove Medical Press Limited, provided the work is properly attributed. For permission for commercial use of this work, please see paragraphs 4.2 and 5 of our Terms.
© 2023 The Author(s). This work is published and licensed by Dove Medical Press Limited. The full terms of this license are available at https://www.dovepress.com/terms.php and incorporate the Creative Commons Attribution - Non Commercial (unported, v3.0) License.
By accessing the work you hereby accept the Terms. Non-commercial uses of the work are permitted without any further permission from Dove Medical Press Limited, provided the work is properly attributed. For permission for commercial use of this work, please see paragraphs 4.2 and 5 of our Terms.