")
Back to Journals » Diabetes, Metabolic Syndrome and Obesity » Volume 16
Serum Proteomic Signatures in Umbilical Cord Blood of Preterm Neonates Delivered by Women with Gestational Diabetes
Authors Li X, Zhang B, Ding W, Jia X, Han Z, Zhang L, Hu Y, Shen B , Wang H
Received 29 January 2023
Accepted for publication 19 May 2023
Published 26 May 2023 Volume 2023:16 Pages 1525—1539
DOI https://doi.org/10.2147/DMSO.S406297
Checked for plagiarism Yes
Review by Single anonymous peer review
Peer reviewer comments 3
Editor who approved publication: Professor Gian Paolo Fadini
Xiaoyan Li,1 Bin Zhang,1 Wen Ding,2 Xianfen Jia,1 Zhen Han,1 Lin Zhang,2 Yifeng Hu,2 Bing Shen,2 Huiqin Wang1
1Department of Pediatrics, Anhui Province Maternity and Child Health Hospital, Hefei, Anhui, 230001, People’s Republic of China; 2School of Basic Medicine, Anhui Medical University, Hefei, Anhui, 230032, People’s Republic of China
Correspondence: Bing Shen, Department of Physiology, Anhui Medical University, 81 Meishan Road, Hefei, Anhui, 230032, People’s Republic of China, Tel +86-551-65161132, Fax +86-551-65161126, Email [email protected] Huiqin Wang, Department of Pediatrics, Anhui Province Maternity and Child Health Hospital, 15 Yimin Road, Hefei, Anhui, 230001, People’s Republic of China, Tel +86-13955130296, Email [email protected]
Background: Women who develop diabetes during pregnancy are at higher risk of preterm birth. Here, we identified differentially expressed proteins (DEPs) in the serum of umbilical cord blood samples obtained from preterm neonates delivered by women with gestational diabetes to provide therapeutic targets for clinical drug development.
Materials and Methods: Umbilical cord blood was collected after delivery of preterm neonates by women with gestational diabetes and after delivery of healthy neonates by women without diabetes. DEPs in the serum samples were identified using liquid chromatography–tandem mass spectrometry. Gene Ontology (GO), cluster analysis and Kyoto Encyclopedia of Genes and Genomes (KEGG) were used to determine the biological functions associated with these DEPs. Enzyme linked immunosorbent assay was used to confirm the key DEPs.
Results: We found that 21 proteins were significantly upregulated, and 51 proteins were significantly downregulated in 72 DEPs in serum samples. GO analyses showed that the DEPs were mainly associated with the GO terms cellular process, biological regulation, cellular anatomical entity, and binding. KEGG signaling pathway analysis indicated that most of the upregulated DEPs were associated with the complement and coagulation cascades, Staphylococcus aureus infection, pertussis, HIF-1 signaling pathway and PPAR signaling pathway and that most of the downregulated DEPs were associated with the complement and coagulation cascades, dilated cardiomyopathy, pathways in cancer, Chagas disease, and hypertrophic cardiomyopathy. The results of KEGG pathway annotation and enrichment analyses indicated that changes in the complement and coagulation cascades may be importantly associated with preterm delivery of neonates by women with gestational diabetes. The key DEPs were confirmed by enzyme linked immunosorbent assay.
Conclusion: Our proteomics and bioinformatics analyses identified several key proteins and the complement and coagulation cascades pathway that warrant further investigation as potential novel therapeutic targets in preterm delivery among women with gestational diabetes.
Keywords: label-free LC-MS/MS, proteomics, gestational diabetes, preterm birth, complement and coagulation cascades
Introduction
The number of people with diabetes increases every year, including among pregnant women.1 An increasing number of women in China have received a diagnosis of type 1 or type 2 diabetes, often before they become pregnant.2,3 A reported prevalence of gestational diabetes is 11.91% in China in 2018, but another study showed that the prevalence of gestational diabetes is various in different cities of China.4,5 One potential reason for an increase in gestational diabetes is that women are waiting to become pregnant at older ages (>35 years).6 Women who develop diabetes during pregnancy are at higher risk of developing complications related to the perinatal period and to diabetes.1,7 Many pregnancies are unplanned and may occur when diabetes is not well controlled. This leads to higher risk of preterm birth, cesarean delivery, eclampsia, preeclampsia, or complications from advanced diabetes.1,7–9 To discover novel therapeutic targets for clinical drug development and to better control the impact of gestational diabetes on the fetus and the occurrence of diabetes complications, two studies in China have used proteomics techniques to identify metabolic profiling of blood serum from gestational diabetes patients and animal model to find novel biomarkers for precision or personalized diagnosis for gestational diabetes.10,11 In addition, another study using proteomics techniques to identify plasma protein changes of gestational diabetes mellitus at 16‐18 weeks.12 However, it is still necessary to further understand the mechanisms underlying the development of gestational diabetes and the effect of gestational diabetes on fetus.
Preterm birth, accounting for 11% of pregnancies worldwide, is the leading cause of perinatal death.13 The causes undergirding preterm birth are various and complex and include gestational diabetes, periodontal health, preeclampsia, intrauterine infection, chorioamnionitis, and multiple births.14,15 In China, a study reported that the prevalence of preterm birth of gestational diabetes is 13.41%.16 Prevention of preterm birth is considered a public health priority because it has the potential to reduce morbidity and mortality in infants and children. Therefore, the discovery of new therapeutic targets and treatment strategies is important for preventing the preterm birth.
Proteomics is a robust method used to detect and quantify serum proteins that are expressed differentially in persons with a condition of interest. In the present study, we used label-free proteomics techniques to detect the differentially expressed proteins (DEPs) in neonatal cord blood from women with gestational diabetes who delivered preterm neonates and from women without diabetes who delivered healthy full-term neonates. Using bioinformatics analyses, we identified the functional roles of the various DEPs and their related signaling pathways to find those DEPs that may be key players in the occurrence and development of preterm birth associated with gestational diabetes. Those DEPs warrant further study as potential novel therapeutic targets for the treatment of the preterm birth.
Materials and Methods
Clinical Information and Sample Collection
All our experiments comply with the Declaration of Helsinki. Neonatal cord blood samples were collected from four women with gestational diabetes who delivered preterm neonates and from four women without diabetes who delivered healthy full-term neonates, all of whom had been admitted to the Anhui Province Maternity and Child Health Hospital. All pregnant women have complete clinical medical records and regular pregnancy examination without hereditary diseases. The delivery was successful. In healthy control group, inclusion criteria were: (1) ≥37 weeks gestation; (2) no disease history before or during pregnancy. Exclusion criteria were: (1) <37 weeks gestation; (2) disease history before or during pregnancy; (3) hereditary disease history. In diabetes group, inclusion criteria were: (1) <37 weeks gestation; (2) no history of diabetes before pregnancy; (3) pregnant with diabetes mellitus and using insulin to control blood glucose. Exclusion criteria were: (1) ≥37 weeks gestation; (2) diabetes history before pregnancy; (3) pregnant with diabetes mellitus and blood glucose was not controlled in the standard reference range; (4) hereditary disease history. Gestational diabetes mellitus diagnosis was conducted according to the World Health Organization (WHO) criteria.17 All women with gestational diabetes were diagnosed at the middle of pregnancy and treated during pregnancy with sufficient insulin to maintain blood glucose levels within the standard reference range. This study was approved by the Medical Ethics Committee of Anhui Province Maternity and Child Health Hospital (approval number YYLL2020-2020xkj235-02-01), and all participants provided written informed consent. The study was carried out from 03/2021 to 12/2021. Inclusion criteria were: (1) all women conformed to the clinical diagnostic criteria; (2) regular pregnancy examination; (3) successful delivery; (4) no hereditary diseases of coagulation system; (5) complete clinical medical records; and (6) pregnant women and family members gave informed consent to participate in this study. Exclusion criteria were: (1) women were diagnosed with diabetes mellitus or impaired glucose regulation before pregnancy; (2) women with other pregnancy-related diseases; (3) heart, liver or kidney dysfunction; (4) hematological diseases; (5) other diseases that may affect blood glucose; and (6) mental illness or retardation.
After the neonate was delivered, the blood samples from the umbilical cord were collected and placed at room temperature for 1 h prior to being centrifuged at 3000 × g for 15 min. The obtained serum was stored at −80°C for use in the following experiments.
Protein Preparation and Gel Analysis
High-abundance proteins in the plasma were removed using a ProteoMiner Protein Enrichment Kit (Bio-Rad). The protein concentrations were determined using the Bradford method. From each serum sample, 35 μg of total protein was mixed with 5 × sample buffer, boiled, and loaded onto 10% gels for sodium dodecyl sulfate–polyacrylamide gel electrophoresis (SDS-PAGE). The proteins were electrophoresed at a constant current of 14 mA for 90 min. Coomassie blue was used to stain the resultant protein bands.
Enzymatic Hydrolysis of Proteins and High-Performance Liquid Chromatography with Tandem Mass Spectrometry (LC-MS/MS) Analysis
A flowchart of the study analyses is provided in Supplementary Figure 1. Dithiothreitol (5 µL of 1 M) was added to samples containing 200 µg of each protein. Iodoacetamide (20 µL of 1 M) was added to the samples following incubation at 37°C for 1 h. After another incubation in the dark at room temperature for 1 h, the samples were centrifuged at 14,000 × g for 20 min at 4°C. The precipitate was collected, and 100 µL of UA buffer (8 M urea, 100 mM Tris-HCl, pH 8.0) was added. After ultracentrifugation, the resulting pellet was digested with trypsin according to the (mass) protein to enzyme ratio of 50:1 for 12–16 h at 37°C. Next, we used nanoliter flow rate, high-performance liquid chromatography with a liquid phase system to separate the samples. Before adding samples, the chromatographic column was balanced with 95% phase A solution (0.1% formic acid in water). The mobile phases included phase A and phase B (0.1% formic acid in acetonitrile). The phase B gradient parameters were 0–2 min for a linear increase from 6% to 9%; 2–10 min for an increase to 13%; 10–50 min for an increase to 26%; 50–70 min for an increase to 38%; and 70–71 min for an increase to 100%, which was maintained for 71–78 min. We used capillary LC-MS/MS with an Orbitrap Fusion Mass Spectrometer (Thermo Scientific) to separate and analyze all samples.
Database Retrieval and Bioinformatics Analyses
We used Proteome Discoverer, version 2.4 (Thermo Fisher Scientific) software to analyze the LC-MS/MS data. Briefly, human proteome databases containing reviewed UniProt sequences were used to identify peptides with the SEQUST search engine. We used P values < 0.05 and 1.5-fold changes (FC) to define DEPs between the two groups of samples. A FC ≥ 1.5 and P < 0.05 represented upregulated proteins, whereas a FC ≤ 0.667 and P < 0.05 represented downregulated proteins. If the FC was between 0.667 and 1.5 or if P > 0.05, this was defined as no change detected in protein expression levels between the two groups. For bioinformatics analyses, we obtained gene ontology (GO) results of these DEPs using Metascape, which is a web-based resource (http://metascape.org). Through this analysis, DEPs were mapped to the terms in the database, and the number of proteins per term was determined. In addition, the hypergeometric test was used to identify GO entries that were significantly enriched.18,19 The signaling pathways were analyzed using the Kyoto Encyclopedia of Genes and Genomes (KEGG) Orthology-Based Annotation System (KOBAS) online analysis tool (http://kobas.cbi.pku.edu.cn/),20 through which we identified those signaling pathways that were significantly enriched with DEPs.
Enzyme Linked Immunosorbent Assay (ELISA)
ELISA experiment was used to confirm the key proteins identified by LC-MS/MS. The kit was purchased from Shanghai Enzyme-linked Biotechnology Co., Ltd. (Shanghai, China). After we collected the blood samples, optical density (OD) values were measured at a wavelength of 450 nm using a microplate reader. The protein concentrations of the blood samples were calculated using a standard curve.
Statistical Analysis
We performed two-tailed Mann–Whitney and Fisher exact tests with SigmaPlot software. Unless otherwise stated, values are expressed as means ± SEM. A two-sided value of P < 0.05 was considered statistically significant.
Results
Participants in LC-MS/MS Test
No significant differences were found in mother age and weight gain during pregnancy between the four healthy women and the four women with diabetes (Table 1). However, significant differences were detected for the gestational age, birth weight of neonates and body mass index (BMI) before pregnancy (Table 1). The results showed that the gestational age of neonates delivered by women with gestational diabetes was significantly younger, and the birth weight of the preterm neonates delivered by women with gestational diabetes was significantly lower than neonates delivered by healthy women, and BMI before pregnancy of women with gestational diabetes was significantly higher than that in healthy women.
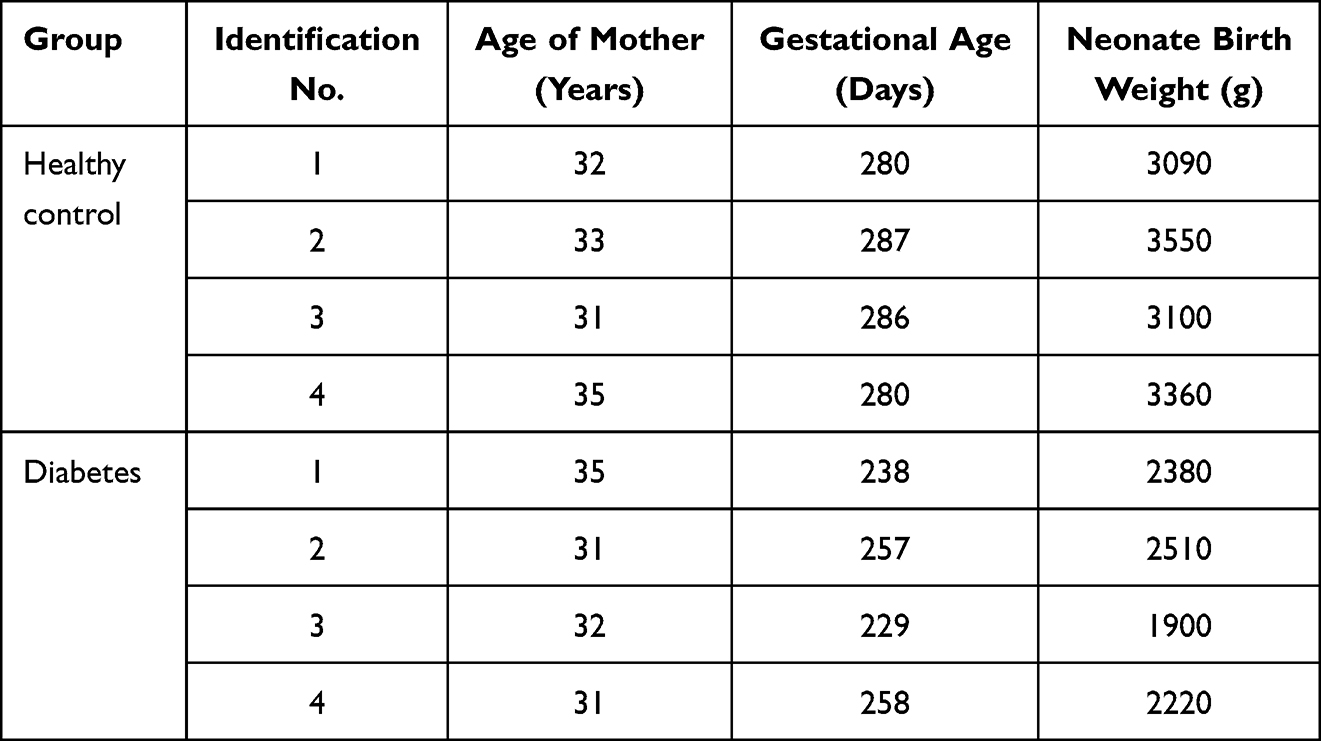 |
Table 1 Demographic Characteristics of Participants |
SDS-PAGE
Proteins in the serum of neonatal cord blood obtained from four women with gestational diabetes who delivered preterm neonates and from four women without diabetes who delivered full-term neonates were separated by SDS-PAGE. The molecular weights of the total proteins ranged from 25 to 180 kDa in all eight samples. The proteins were effectively separated in similar patterns without degradation, indicating that the samples were of sufficient quality to be used in the following experiments. Compared with the bands of the original serum (Lane E in Supplementary Figure 2), the high-abundance proteins were significantly decreased, whereas the bands of other molecular weight regions were significantly increased. The total protein content met the requirements for use in the present study (Supplementary Figure 2).
LC-MS/MS Spectrum Analysis to Identify DEPs
LC-MS/MS was used to detect the proteins. A total of 450 proteins were identified among all serum samples (Supplementary Tables 1 and 2). Among them, 72 serum proteins from neonate cord blood were differentially expressed between preterm and full-term neonates, with 21 upregulated proteins and 51 downregulated proteins (Figure 1A; Table 2). We used cluster analyses to find that the protein expression pattern of the DEPs differed significantly between the two groups (Figure 1B).
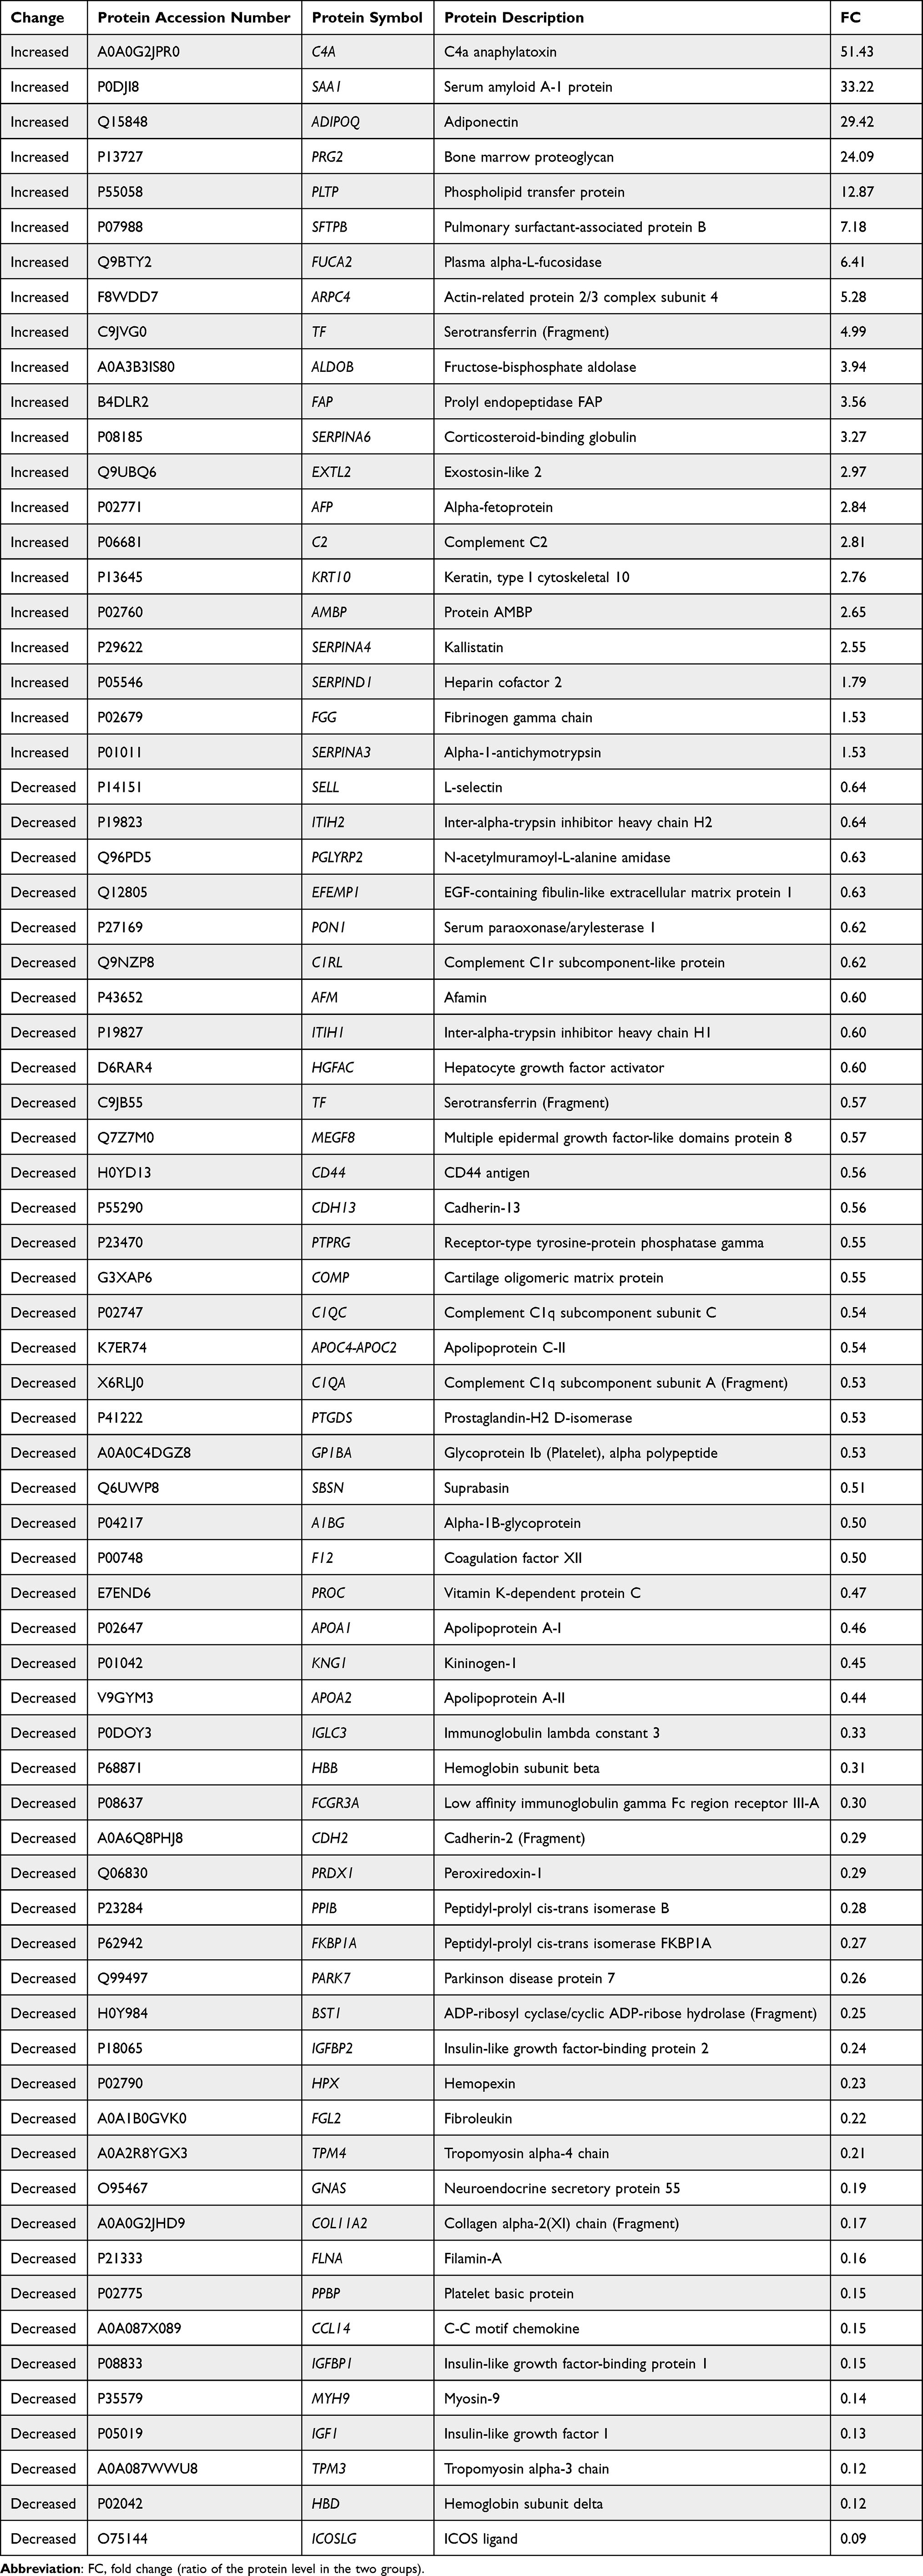 |
Table 2 Differentially Expressed Proteins in Serum from Umbilical Cord Blood of Full-Term Neonates Delivered by Healthy Women vs Preterm Neonates Delivered by Women with Gestational Diabetes |
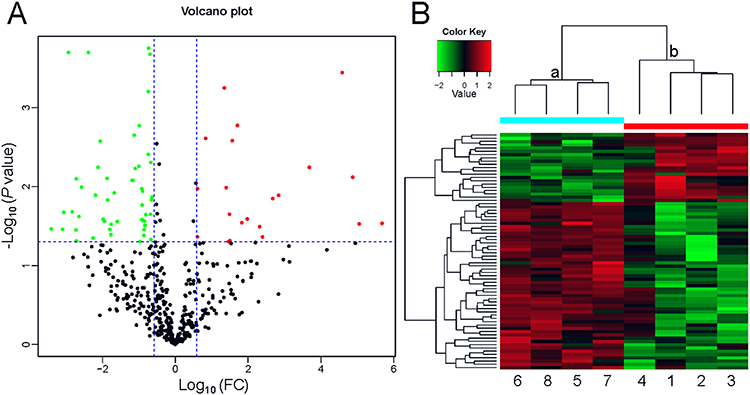 |
Figure 1 Profile of the differentially expressed proteins. (A) Volcano plot. Red dots represent proteins with a significant fold change (FC) > 1.5; green dots, proteins with a significant FC < 0.667; black dots, proteins with no significant change. (B) Heatmap showing the upregulation and downregulation of different proteins observed by cluster analysis. Each band in the image represents a protein, each column is a sample (1–4, full-term infant; 5–8, preterm infant), and colors represent various expression levels. |
GO Functional Annotation and Enrichment Analysis
GO has three categories indicating how gene functions may be described: biological process, cellular component, and molecular function. GO analysis, a useful method and tool in bioinformatics analyses, has functional annotations indicating the number of DEPs in each category, and GO functional enrichment provides GO functional terms related to these DEPs. Thus, through GO analysis, the distribution of DEPs in these three categories and the involvement of the DEPs in cellular functions were identified. In addition, the most important biochemical metabolic pathways and signal transduction pathways were determined.
Our GO functional annotation analysis showed that the highest percentage of DEPs in the biological process classification were related to the term “cellular process” for the upregulated proteins (n = 17 proteins) (Figure 2A), with the top three proteins being SAA1, ADIPOQ and PRG2, and to the term “biological regulation” for the downregulated proteins (n = 37 proteins) (Figure 2B), with the top three proteins being ICOSLG, HBD and IGF1. For the cellular component classification, the highest percentage of DEPs were related to the term “cellular anatomical entity” for both the upregulated proteins (n = 20 proteins) (Figure 2A)—with the top three proteins being C4A, SAA1 and ADIPOQ—and for the downregulated proteins (n = 46 proteins) (Figure 2B)—with the top three proteins being ICOSLG, HBD and TPM3. For the molecular function classification, the highest percentage of DEPs were related to the term “binding” for both the upregulated proteins (n = 15 proteins) (Figure 2A)—with the top three proteins being SAA1, ADIPOQ and PRG2—and for the downregulated proteins (n = 39 proteins) (Figure 2B)—with the top three proteins being ICOSLG, HBD and TPM3.
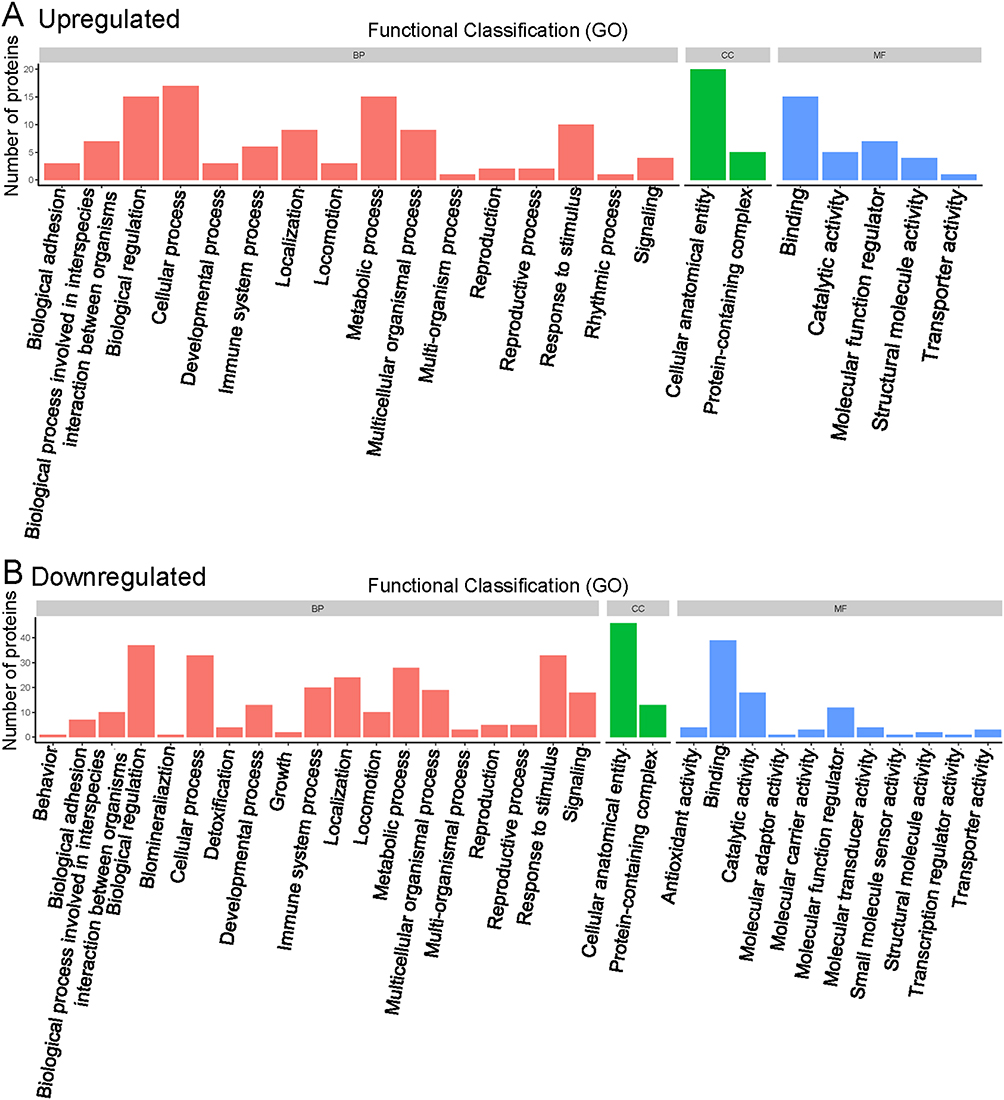 |
Figure 2 Functional classification of gene ontology analysis. (A) Upregulated proteins. (B) Downregulated proteins. Abbreviations: BP, biological process; CC, cellular component; MF, molecular function. |
In the GO functional enrichment analysis, the top five upregulated GO terms were serine-type endopeptidase inhibitor activity, endopeptidase inhibitor activity, endopeptidase regulator activity, peptidase inhibitor activity, and peptidase regulator activity (Figure 3A). The top five downregulated GO terms were protein stabilization, positive regulation of activated T cell proliferation, regulation of activated T cell proliferation, regulation of protein stability, and Ras protein signal transduction (Figure 3B).
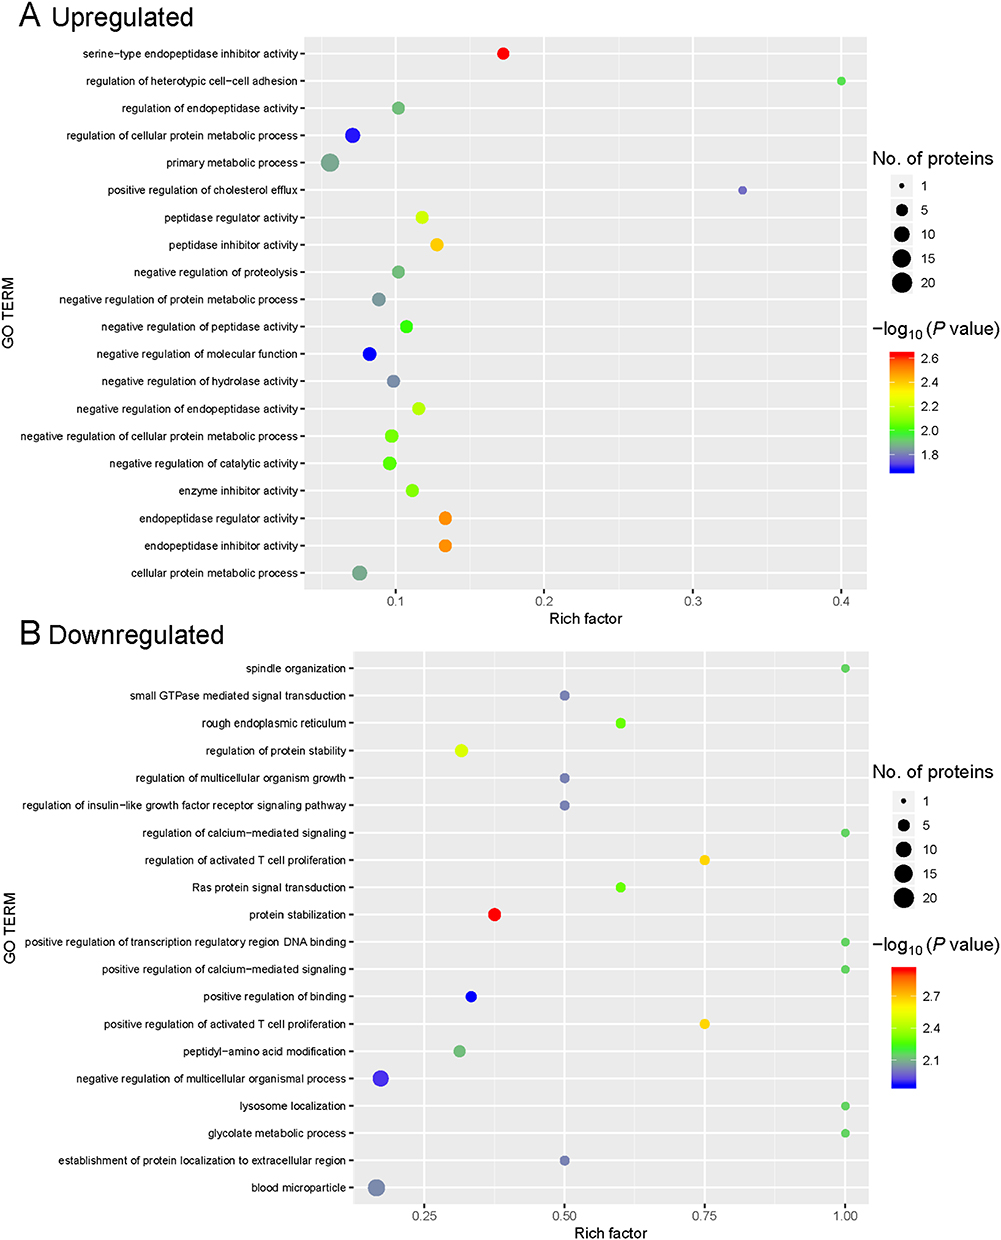 |
Figure 3 Gene ontology (GO) enrichment for functional terms. (A) Upregulated proteins. (B) Downregulated proteins. The abscissa represents the enrichment factor, showing the percentage of differentially expressed proteins in the GO classification relative to the identified proteins in that classification. The ordinate indicates the GO term description. The size of the bubble represents the number of proteins in the GO classification. The enrichment test P value was obtained using the Fisher exact test; −log10 (P value): the logarithmic conversion of the Fisher exact test P value. |
KEGG Pathway Annotation and Enrichment Analysis
We used KEGG signaling pathways analysis to identify the signaling pathways that were altered in cord blood from preterm neonates delivered by women with gestational diabetes. In the KEGG pathway annotation analysis, we found that the top five upregulated KEGG pathways were the complement and coagulation cascades, Staphylococcus aureus infection, pertussis, HIF-1 signaling pathway, and PPAR signaling pathway (Figure 4). The top five downregulated KEGG pathways were complement and coagulation cascades, dilated cardiomyopathy, pathways in cancer, Chagas disease, and hypertrophic cardiomyopathy (Figure 4).
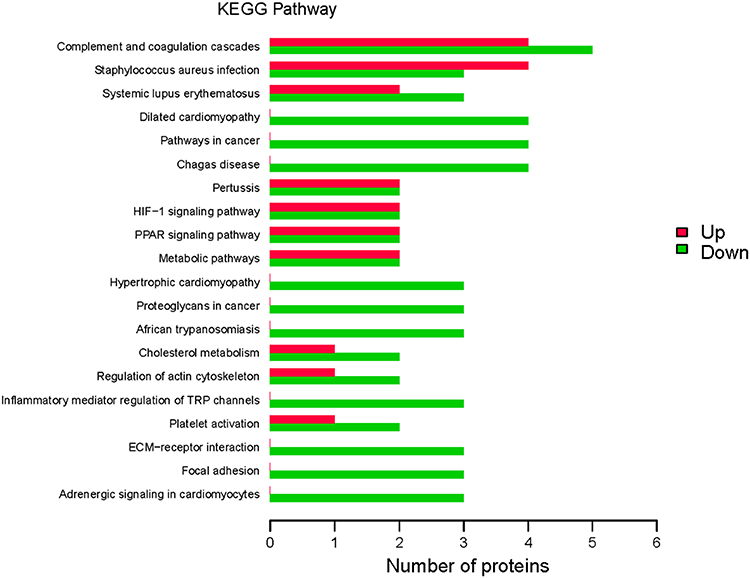 |
Figure 4 Kyoto Encyclopedia of Genes and Genomes (KEGG) pathway annotation. KEGG signaling pathways were identified in differentially expressed proteins (DEPs). Abscissa represents the number of DEPs; ordinate, KEGG pathways associated with the DEPs; green bars, upregulated pathways; and red bars, downregulated pathways. |
The results of our KEGG pathway enrichment analysis indicated seven KEGG signaling pathways were enriched for the DEPs: inflammatory mediator regulation of TRP channels, Chagas disease, adrenergic signaling in cardiomyocytes, long-term depression, PPAR signaling pathway, ovarian steroidogenesis, and longevity regulating pathway (Figure 5). All but one pathway, PPAR signaling, were downregulated.
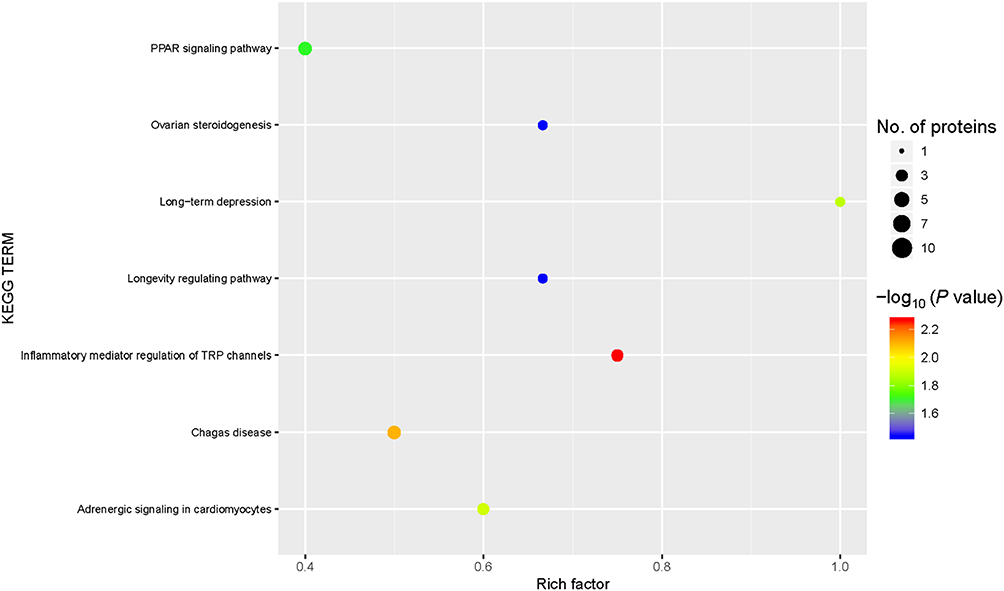 |
Figure 5 Kyoto Encyclopedia of Genes and Genomes (KEGG) pathway enrichment. KEGG signaling pathways were enriched for the differentially expressed proteins (DEPs). Abscissa: the enrichment factor showing the total proportion of DEPs in the KEGG signaling pathway as a proportion of the identified proteins in the classification. Ordinate: the KEGG term description. Bubble size indicates the number of DEPs in the KEGG pathway. The enrichment test P value was obtained using the Fisher exact test; −log10 (P value): the logarithmic conversion of the Fisher exact test P value. |
On the basis of our KEGG pathway annotation and enrichment analyses, we concluded that the complement and coagulation cascades may be importantly associated with preterm delivery of neonates by women with gestational diabetes. The DEPs in the serum obtained from the cord blood of these neonates involved in the complement and coagulation cascades included C4A, C2, SERPIND1, FGG, C1QC, C1QA, F12, PROC, and KNG1 (Figure 6).
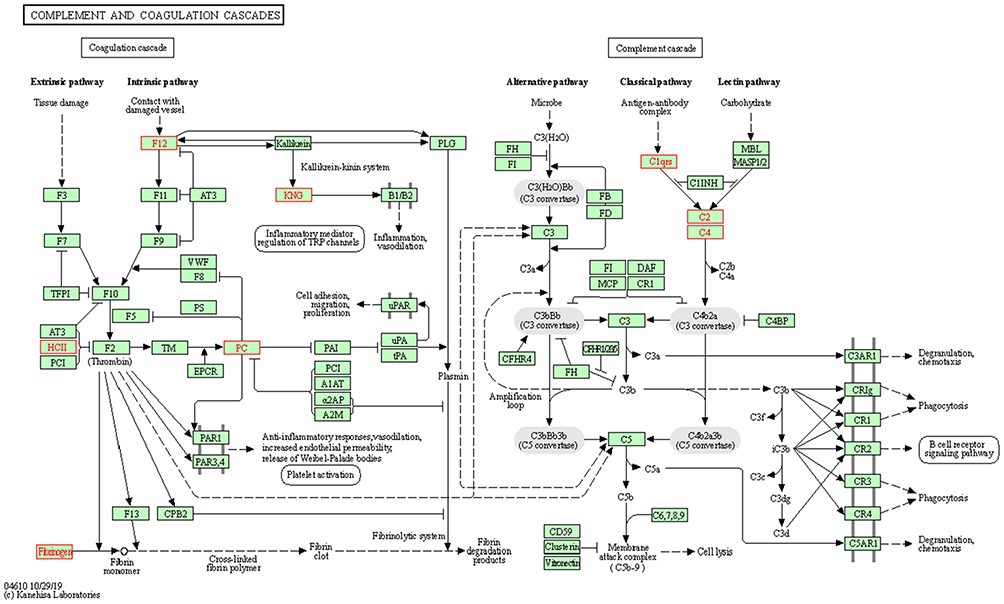 |
Figure 6 Complement and coagulation cascades. The differentially expressed proteins (DEPs), highlighted in a red frame, participating in the complement and coagulation cascades. The upregulated DEPS are C4A (C4, C4a anaphylatoxin), C2 (complement C2), SERPIND1 (HCII, heparin cofactor 2) and FGG (fibrinogen, fibrinogen gamma chain). The downregulated DEPs are C1QC (complement C1q subcomponent subunit C), C1QA (complement C1q subcomponent subunit A), F12 (coagulation factor XII), PROC (PC, vitamin K-dependent protein C) and KNG1 (KNG, kininogen-1). |
Concentrations of Coagulation-Associated Proteins in DEPs
To confirm the DEPs identified by the LC-MS/MS, we examined the concentrations of coagulation-associated proteins in DEPs in neonatal cord blood samples using ELISA experiment and expended samples. Beside the samples used in LC-MS/MS experiment, we further collected 9 neonatal cord blood samples respectively from women with gestational diabetes who delivered preterm neonates and from women without diabetes who delivered full-term neonates. Our data showed that the expressions of SERPIND1 and FGG were significantly upregulated in the cord blood samples of preterm neonates compared to those of full-term neonates. On the contrary, the expressions of F12, KNG1and PROC were significantly downregulated in the cord blood samples of preterm neonates compared to those of full-term neonates (Figure 7). Therefore, these results are consistent with the data from our LC-MS/MS experiment.
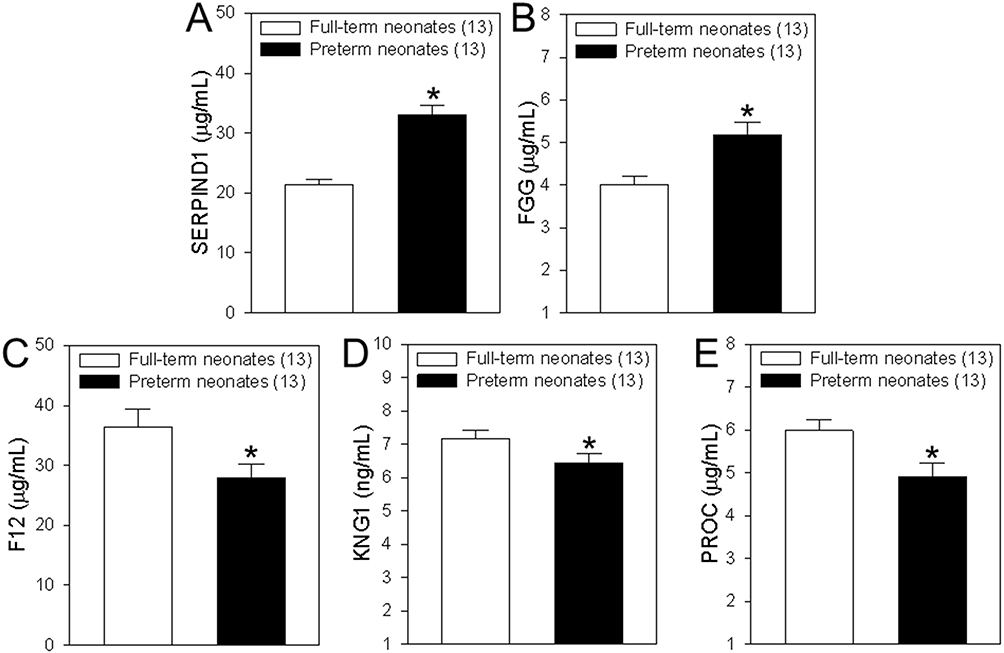 |
Figure 7 Concentrations of coagulation-associated proteins in differentially expressed proteins (DEPs). (A–E) Summary data showing the concentrations of heparin cofactor 2 (SERPIND1, A), fibrinogen gamma chain (FGG, B), coagulation factor XII (F12, C), kininogen-1 (KNG1, D) and vitamin K-dependent protein C (PROC, E) in serum samples from cord blood of healthy women who delivered full-term neonates and women with gestational diabetes who delivered preterm neonates. Among of them, SERPIND1and FGG are upregulated DEPs, but F12, KNG1and PROC are downregulated DEPs. Values are shown as the mean ± SEM (n = 13); *P < 0.05 for full-term neonates vs preterm neonates. |
Discussion
The incidence of diabetes in China continues to increase every year, including among pregnant women. Gestational diabetes is a serious threat to the health of pregnant women and their fetuses. Thus, understanding the pathogenesis and development of gestational diabetes is critical for finding new targets for prevention and treatment. In the present study, we used label-free LC-MS/MS analysis to identify key proteins that were differentially expressed between the serum obtained from neonatal cord blood of healthy women who delivered full-term neonates and of women with gestational diabetes who delivered preterm neonates. Overall, we identified 450 proteins, of which 21 DEPs were upregulated and 51 DEPs were downregulated. Our KEGG pathway annotation and enrichment analyses determined that many of these DEPs were involved in complement and coagulation cascades.
Hemorrhagic or thrombotic complications are important factors inducing neonate morbidity and mortality.21–25 One study reported that the coagulation system is similar in preterm and full-term infants and does not show a rapid change between 30 and 40 weeks of life.26 Even in extremely preterm neonates (24–31 weeks), the initial clotting tests, including platelets, fibrinogen, K-dependent factors, and factors VIII and V, are within standard references ranges.27 However, gestational diabetes is a risk factor associated with coagulation abnormalities, with reduced factor V and prothrombin-proconvertin, a prolonged prothrombin time, elevated hematocrit, and reduced fibrinolytic activity in cord blood, which may cause preterm birth.28,29 In the present study, we used label-free LC-MS/MS to find that the levels of coagulation-associated proteins, including SERPIND1, F12, FGG, KNG1, and PROC, were significantly changed in neonatal cord blood from women with diabetes who delivered preterm neonates. Among these five coagulation-associated DEPs, SERPIND1 and FGG were increased, and F12, KNG1 and PROC were decreased. SERPIND1 (heparin cofactor 2) is a thrombin inhibitor activated by the glycosaminoglycans, heparin or dermatan sulfate.30 FGG (fibrinogen gamma chain), a primary component of blood clots and involved in hemostasis, polymerizes with fibrinogen alpha and fibrinogen beta to form an insoluble fibrin matrix.31 F12 (coagulation factor XII) is a glycoprotein involved in coagulation initiation, fibrinolysis, and the bradykinin and angiotensin production.32 KNG1 (kininogen-1) is an inhibitor of thiol proteases and participates in the aggregation of thrombocytes and blood clotting.33 PROC (vitamin K-dependent protein C) is a vitamin K-dependent serine protease that inactivates factors Va and VIIIa to regulate blood coagulation and to protect the endothelial cell barrier.34,35 Our results suggest that these five DEPs are potential targets for future study of pregnancy-induced hemorrhagic or thrombotic complications in preterm infants delivered by women with gestational diabetes.
In general, the complement system is activated during pregnancy; for example, increased levels of C3A, C4A, and C5A are observed in plasma.36 However, in women with gestational diabetes, plasma levels of C3A, C4A, and C5A are decreased, while C3 and C4 are increased in the second trimester of pregnancy.37,38 In the present study, the levels of C2, C4A, C1QA, and C1QC were significantly altered in the neonatal cord blood of preterm neonates delivered by women with gestational diabetes, with C2 and C4A significantly increased, and C1QA and C1QC significantly decreased. C2 (component C2), part of the classic pathway of the complement system, is cleaved by activated factor C1 into two fragments: C2b and C2a. C2a, a serine protease, then combines with complement factor C4b to generate C3 or C5 convertase.39,40 C4A (C4a anaphylatoxin) is an anaphylatoxin generated when complement is activated. However, because the receptor(s) for C4A remain uncertain, the functions of C4A have not been well identified.41 Zhao et al reported that C4A inhibits C5a-induced neointima formation following arterial injury.42 C1QA (complement C1q subcomponent subunit A) and C1QC (complement C1q subcomponent subunit C) are subcomponent subunits of C1q, which associates with proenzymes C1r and C1s to yield C1.43 C1q uses collagen-like regions to interact with the calcium-dependent C1r2C1s2 proenzyme complex.44 C1q interacts with the Fc regions of IgG or IgM antibody present in immune complexes to activate C1r, C1s, and the classic complement pathway.44 Thus, the results of our study may provide potential new therapeutic targets for disorders of the immune system in preterm infants delivered by women with gestational diabetes. These complement components may also warrant investigation as potential therapeutic targets.
Among the key signaling pathways of these DEPS, our bioinformatics analysis identified the complement and coagulation cascades. Some of the proteins identified in the present study may warrant further study as new therapeutic targets for preterm birth among women with gestational diabetes. In this study, even we found these interesting DEPs, there are some limitations including that clinical samples used in LC-MS/MS experiments are small, and verification using larger samples from multiple hospitals is needed for the translational application in future.
In conclusion, we used label-free LC-MS/MS to identify and quantify key DEPs in serum derived from neonatal cord blood and the complement and coagulation cascades pathway and their potential roles in pathogenesis and the preterm birth of neonates delivered by mothers with gestational diabetes.
Acknowledgments
We would like to express our gratitude to Yunxia Lu, Ph.D. and the technicians in the Comprehensive Experiment Center of Basic Medical Sciences, Anhui Medical University, for facility support, and the Center for Scientific Research of Anhui Medical University for valuable help with our study.
Funding
This work was supported by grants from the Key Project of Medical Application Research of He-fei Municipal Health Commission (grant No. Hwk2021zd016) and the National College Student Innovation and Entrepreneurship Training Program (Grant No. 202110366018X).
Disclosure
The authors declare that the research was conducted in the absence of any commercial or financial relationships that could be construed as a potential conflict of interest.
References
1. Bartaskova D. Diabetes in pregnancy: current ways of treatment. Vnitr Lek. 2019;65(4):256–263. doi:10.36290/vnl.2019.044
2. Peng S, Zhang J, Liu L, et al. Newborn meconium and urinary metabolome response to maternal gestational diabetes mellitus: a preliminary case-control study. J Proteome Res. 2015;14(4):1799–1809. doi:10.1021/pr5011857
3. Wang C, Wei Y, Zhang X, et al. A randomized clinical trial of exercise during pregnancy to prevent gestational diabetes mellitus and improve pregnancy outcome in overweight and obese pregnant women. Am J Obstet Gynecol. 2017;216(4):340–351. doi:10.1016/j.ajog.2017.01.037
4. Nguyen CL, Pham NM, Binns CW, Duong DV, Lee AH. Prevalence of gestational diabetes mellitus in eastern and Southeastern Asia: a systematic review and meta-analysis. J Diabetes Res. 2018;2018:6536974. doi:10.1155/2018/6536974
5. Juan J, Yang H. Prevalence, prevention, and lifestyle intervention of gestational diabetes mellitus in China. Int J Environ Res Public Health. 2020;17(24):9517. doi:10.3390/ijerph17249517
6. Gao L, Chen CR, Wang F, et al. Relationship between age of pregnant women with gestational diabetes mellitus and mode of delivery and neonatal Apgar score. World J Diabetes. 2022;13(9):776–785. doi:10.4239/wjd.v13.i9.776
7. Kong L, Nilsson IAK, Gissler M, Lavebratt C. Associations of maternal diabetes and body mass index with offspring birth weight and prematurity. JAMA Pediatr. 2019;173(4):371–378. doi:10.1001/jamapediatrics.2018.5541
8. Tse BC, Block B, Figueroa H, Yao R. Adverse neonatal outcomes associated with pregestational diabetes mellitus in infants born preterm. Am J Obstetr Gynecol MFM. 2020;2(4):100213. doi:10.1016/j.ajogmf.2020.100213
9. Billionnet C, Mitanchez D, Weill A, et al. Gestational diabetes and adverse perinatal outcomes from 716,152 births in France in 2012. Diabetologia. 2017;60(4):636–644. doi:10.1007/s00125-017-4206-6
10. Meng X, Zhu B, Liu Y, et al. Unique biomarker characteristics in gestational diabetes mellitus identified by LC-MS-based metabolic profiling. J Diabetes Res. 2021;2021:6689414. doi:10.1155/2021/6689414
11. Zhou Y, Zhao R, Lyu Y, et al. Serum and amniotic fluid metabolic profile changes in response to gestational diabetes mellitus and the association with maternal-fetal outcomes. Nutrients. 2021;13(10):3644. doi:10.3390/nu13103644
12. Liu X, Sun J, Wen X, et al. Proteome profiling of gestational diabetes mellitus at 16–18 weeks revealed by LC-MS/MS. J Clin Lab Anal. 2020;34(9):e23424. doi:10.1002/jcla.23424
13. Suff N, Story L, Shennan A. The prediction of preterm delivery: what is new? Semin Fetal Neonatal Med. 2019;24(1):27–32. doi:10.1016/j.siny.2018.09.006
14. Frey HA, Klebanoff MA. The epidemiology, etiology, and costs of preterm birth. Semin Fetal Neonatal Med. 2016;21(2):68–73. doi:10.1016/j.siny.2015.12.011
15. Galindo-Sevilla N, Reyes-Arroyo F, Mancilla-Ramirez J. The role of complement in preterm birth and prematurity. J Perinat Med. 2019;47(8):793–803. doi:10.1515/jpm-2019-0175
16. Liu K, Chen Y, Tong J, Yin A, Wu L, Niu J. Association of maternal obesity with preterm birth phenotype and mediation effects of gestational diabetes mellitus and preeclampsia: a prospective cohort study. BMC Pregnancy Childbirth. 2022;22(1):459. doi:10.1186/s12884-022-04780-2
17. Alberti KG, Zimmet PZ. Definition, diagnosis and classification of diabetes mellitus and its complications. Part 1: diagnosis and classification of diabetes mellitus provisional report of a WHO consultation. Diabetic Med. 1998;15(7):539–553. doi:10.1002/(SICI)1096-9136(199807)15:7<539::AID-DIA668>3.0.CO;2-S
18. Soonthornvacharin S, Rodriguez-Frandsen A, Zhou Y, et al. Systems-based analysis of RIG-I-dependent signalling identifies KHSRP as an inhibitor of RIG-I receptor activation. Nature Microbiol. 2017;2:17022. doi:10.1038/nmicrobiol.2017.22
19. Fang Y, Wang P, Xia L, et al. Aberrantly hydroxymethylated differentially expressed genes and the associated protein pathways in osteoarthritis. PeerJ. 2019;7:e6425. doi:10.7717/peerj.6425
20. Kanehisa M, Goto S. KEGG: Kyoto Encyclopedia of Genes and Genomes. Nucleic Acids Res. 2000;28(1):27–30. doi:10.1093/nar/28.1.27
21. Kuperman AA, Kenet G, Papadakis E, Brenner B. Intraventricular hemorrhage in preterm infants: coagulation perspectives. Semin Thromb Hemost. 2011;37(7):730–736. doi:10.1055/s-0031-1297163
22. Kuperman AA, Brenner B, Kenet G. Intraventricular hemorrhage in preterm infants and coagulation--ambivalent perspectives? Thromb Res. 2013;131(Suppl 1):S35–S38. doi:10.1016/S0049-3848(13)70018-5
23. Neary E, Okafor I, Al-Awaysheh F, et al. Laboratory coagulation parameters in extremely premature infants born earlier than 27 gestational weeks upon admission to a neonatal intensive care unit. Neonatology. 2013;104(3):222–227. doi:10.1159/000353366
24. Salonvaara M, Riikonen P, Kekomaki R, et al. Effects of gestational age and prenatal and perinatal events on the coagulation status in premature infants. Arch Dis Child. 2003;88(4):F319–F323. doi:10.1136/fn.88.4.F319
25. Grevsen AK, Hviid CVB, Hansen AK, Hvas AM. The role of platelets in premature neonates with intraventricular hemorrhage: a systematic review and meta-analysis. Semin Thromb Hemost. 2020;46(3):366–378. doi:10.1055/s-0039-3402687
26. Andrew M, Paes B, Milner R, et al. Development of the human coagulation system in the healthy premature infant. Blood. 1988;72(5):1651–1657. doi:10.1182/blood.V72.5.1651.1651
27. Barnard DR, Simmons MA, Hathaway WE. Coagulation studies in extremely premature infants. Pediatr Res. 1979;13(12):1330–1335. doi:10.1203/00006450-197912000-00006
28. Nielsen NC. Coagulation and fibrinolysis in diabetic women immediately post partum and in their newborn infants. Influence of caesarean section. Acta Obstet Gynecol Scand. 1969;48(3):392–404. doi:10.3109/00016346909156654
29. Hathaway WE, Mahasandana C, Makowski EL. Cord blood coagulation studies in infants of high-risk pregnant women. Am J Obstet Gynecol. 1975;121(1):51–57. doi:10.1016/0002-9378(75)90974-6
30. Van Deerlin VM, Tollefsen DM. The N-terminal acidic domain of heparin cofactor II mediates the inhibition of alpha-thrombin in the presence of glycosaminoglycans. J Biol Chem. 1991;266(30):20223–20231. doi:10.1016/S0021-9258(18)54913-9
31. Mosesson MW. Fibrinogen gamma chain functions. J Menopausal Med. 2003;1(2):231–238. doi:10.1046/j.1538-7836.2003.00063.x
32. MacQuarrie JL, Stafford AR, Yau JW, et al. Histidine-rich glycoprotein binds factor XIIa with high affinity and inhibits contact-initiated coagulation. Blood. 2011;117(15):4134–4141. doi:10.1182/blood-2010-07-290551
33. Markaki I, Bergstrom S, Tsitsi P, et al. Cerebrospinal fluid levels of Kininogen-1 indicate early cognitive impairment in Parkinson’s disease. Mov Disorders. 2020;35(11):2101–2106. doi:10.1002/mds.28192
34. Ding Q, Yang L, Dinarvand P, Wang X, Rezaie AR. Protein C Thr315Ala variant results in gain of function but manifests as type II deficiency in diagnostic assays. Blood. 2015;125(15):2428–2434. doi:10.1182/blood-2014-12-617274
35. Kovacs KB, Pataki I, Bardos H, et al. Molecular characterization of p.Asp77Gly and the novel p.Ala163Val and p.Ala163Glu mutations causing protein C deficiency. Thromb Res. 2015;135(4):718–726. doi:10.1016/j.thromres.2015.01.011
36. Richani K, Soto E, Romero R, et al. Normal pregnancy is characterized by systemic activation of the complement system. J Mater Fetal Neonatal Med. 2005;17(4):239–245. doi:10.1080/14767050500072722
37. Lappas M. Lower circulating levels of complement split proteins C3a and C4a in maternal plasma of women with gestational diabetes mellitus. Diabetic Med. 2011;28(8):906–911. doi:10.1111/j.1464-5491.2011.03336.x
38. Ramanjaneya M, Butler AE, Alkasem M, et al. Association of complement-related proteins in subjects with and without second trimester gestational diabetes. Front Endocrinol. 2021;12:641361. doi:10.3389/fendo.2021.641361
39. Van de Walle I, Silence K, Budding K, et al. ARGX-117, a therapeutic complement inhibiting antibody targeting C2. J Allergy Clin Immunol. 2021;147(4):1420–1429 e1427. doi:10.1016/j.jaci.2020.08.028
40. Peng M, Li Z, Niu D, Liu X, Dong Z, Li J. Complement factor B/C2 in molluscs regulates agglutination and illuminates evolution of the Bf/C2 family. FASEB J. 2019;33(12):13323–13333. doi:10.1096/fj.201901142RR
41. Barnum SR. C4a: an anaphylatoxin in name only. J Innate Immun. 2015;7(4):333–339. doi:10.1159/000371423
42. Zhao Y, Xu H, Yu W, Xie BD. Complement anaphylatoxin C4a inhibits C5a-induced neointima formation following arterial injury. Mol Med Rep. 2014;10(1):45–52. doi:10.3892/mmr.2014.2176
43. Kishore U, Reid KB. C1q: structure, function, and receptors. Immunopharmacology. 2000;49(1–2):159–170. doi:10.1016/S0162-3109(00)80301-X
44. Fouet G, Bally I, Signor L, et al. Headless C1q: a new molecular tool to decipher its collagen-like functions. FEBS J. 2021;288(6):2030–2041. doi:10.1111/febs.15543
 © 2023 The Author(s). This work is published and licensed by Dove Medical Press Limited. The full terms of this license are available at https://www.dovepress.com/terms.php and incorporate the Creative Commons Attribution - Non Commercial (unported, v3.0) License.
By accessing the work you hereby accept the Terms. Non-commercial uses of the work are permitted without any further permission from Dove Medical Press Limited, provided the work is properly attributed. For permission for commercial use of this work, please see paragraphs 4.2 and 5 of our Terms.
© 2023 The Author(s). This work is published and licensed by Dove Medical Press Limited. The full terms of this license are available at https://www.dovepress.com/terms.php and incorporate the Creative Commons Attribution - Non Commercial (unported, v3.0) License.
By accessing the work you hereby accept the Terms. Non-commercial uses of the work are permitted without any further permission from Dove Medical Press Limited, provided the work is properly attributed. For permission for commercial use of this work, please see paragraphs 4.2 and 5 of our Terms.