")
Back to Journals » Journal of Inflammation Research » Volume 16
Serum Metabolomics Analysis of Skin-Involved Systemic Lupus Erythematosus: Association of Anti-SSA Antibodies with Photosensitivity
Authors Lu D , Zhu X , Hong T , Yao X , Xie Z , Chen L, Wang Y , Zhang K, Ren Y, Cao Y, Wang X
Received 16 June 2023
Accepted for publication 23 August 2023
Published 30 August 2023 Volume 2023:16 Pages 3811—3822
DOI https://doi.org/10.2147/JIR.S426337
Checked for plagiarism Yes
Review by Single anonymous peer review
Peer reviewer comments 3
Editor who approved publication: Professor Ning Quan
Dingqi Lu,1,* Xinchao Zhu,2,* Tao Hong,2 Xinyi Yao,2 Zhiming Xie,3 Liying Chen,2 Yihan Wang,2 Kaiyuan Zhang,2 Yating Ren,2 Yi Cao,4 Xinchang Wang3
1First Clinical Medical College, Zhejiang Chinese Medical University, Hangzhou, Zhejiang Province, 310053, People’s Republic of China; 2Second Clinical Medical College, Zhejiang Chinese Medical University, Hangzhou, Zhejiang Province, 310053, People’s Republic of China; 3The Second Affiliated Hospital, Zhejiang Chinese Medical University, Hangzhou, Zhejiang Province, 310053, People’s Republic of China; 4The First Affiliated Hospital, Zhejiang Chinese Medical University, Hangzhou, Zhejiang Province, 310053, People’s Republic of China
*These authors contributed equally to this work
Correspondence: Xinchang Wang, The Second Affiliated Hospital, Zhejiang Chinese Medical University, Hangzhou, Zhejiang Province, People’s Republic of China, Tel +86 13065714635, Email [email protected]
Purpose: Systemic lupus erythematosus is a heterogeneous autoimmune disease in which skin involvement is a common manifestation. It is currently thought that the photosensitivity of SLE skin involvement is associated with anti-SSA antibodies. This study aimed to expand the current state of knowledge surrounding the molecular pathophysiology of SLE skin photosensitivity through Serum metabolomics analysis.
Patients and Methods: The serum metabolites of 23 cases of skin-involved SLE (SI) group, 14 cases of no SI (NSI) group, and 30 cases of healthy controls (HC) were analyzed by using UPLC-MS/MS technology, and subgroup analysis was performed according to the expression of anti-SSA antibodies in SI. MetaboAnalyst 5.0 was used for enrichment analysis and ROC curve construction, identifying serum metabolic markers of skin-involved SLE associated with anti-SSA antibodies.
Results: We identified several metabolites and metabolic pathways associated with SLE photosensitivity. Two metabolites, SM (d18:1/24:0) and gamma-CEHC can distinguish between anti-SSA antibody-positive and negative SI, with AUC of 0.829 and 0.806. These two photosensitization-related substances may be potential markers of skin involvement in SLE associated with anti-SSA antibody.
Conclusion: This study provides new insights into the pathogenesis of SI patients, and provides a new molecular biological basis for the association between anti-SSA antibodies and skin photoallergic manifestations of SLE.
Keywords: systemic lupus erythematosus, metabolomics, biomarkers, anti-SSA antibodies, photosensitivity
Introduction
Systemic lupus erythematosus (SLE) is a chronic refractory disease characterized by autoimmune abnormalities involving multiple systems, such as the skin, kidneys, and blood. The prevalence of SLE is estimated to be 30–50 per 100 000.1 The age-standardized prevalence was 6.17 for males and 67.78 for females per 100,000 in China.2 Mortality in patients with SLE is 2–3 times higher than that in the general population.3 Studies have shown that fever, arthritis, and rash are the most common first-episode manifestations of SLE,4 with 53.8% of the patients presenting with skin lesions.5 Therefore, identifying skin lesions in patients with SLE can aid in the development of early interventional treatments.
Overreaction caused by ultraviolet radiation (UVR) is called photosensitivity. Approximately 93% of patients with SLE show photosensitivity,6 which is highly common in the production of lupus skin lesions and can even cause the onset and aggravation of systemic diseases. It is currently believed that UVR-induced activation of human endogenous retrovirus-associated dsRNA transcription and RIG-I/MDA5/IRF7 pathways leads to reduce expression of interferon-stimulated genes, promoting apoptosis of keratinocytes and aggravating the skin manifestations of lupus.7 Simultaneously, UVR can induce reactive oxygen species to indirectly destroy proteins and lipids, leading to the disruption of cell signaling pathways and membrane structures; this causes cell and tissue dysfunction, thereby aggravating diseases.8 Studies have shown that UVR exposure to the skin is correlated with the expression of anti- Sjogren syndrome A (SSA) antibodies,9,10 however, in-depth studies are lacking. Therefore, studying the mechanism of photosensitivity in SLE can help us to further understand the development and prevention of SLE.
Metabolomics analysis captures the special chemical fingerprint left by specific cellular processes or conditions, which can provide hints about the underlying pathophysiology of SLE at the molecular level. Some studies have revealed abnormalities in fatty acid metabolism, phospholipid catabolism, and amino acid metabolism in patients with SLE.11–17 SLE research has predominantly focused on lupus nephritis14,18–20 and cardiovascular risks.21–23 However, there are limited metabolic studies on the skin involved in SLE, and there is a lack of discussion on the relationship between skin damage and photosensitivity.
To further explore the relationship between SLE and photosensitivity, we analyzed the serum metabolites of 23 cases of skin-involved SLE (SI) group, 14 cases of no SI (NSI) group, and 30 cases of healthy controls (HC) using UPLC-MS/MS technology and four methods of parallel detection. We further identified SI patients with anti-SSA antibody positivity and performed metabolomic analysis. Overall, this study aimed to expand the current state of knowledge surrounding the molecular pathophysiology of SLE skin photosensitivity.
Materials and Methods
Sample Collection
A total of 67 samples were included in the study, including 30 sex-, age-, and BMI-matched HC and 37 patients with SLE. Samples from patients who were smokers or had infections, metabolic diseases, or tumors were excluded. Volunteers in the HC group were those who participated in the physical examination and excluded the disease diagnosis. Patients in the SLE group met 2012 International Lupus Collaborative Group SLE classification criteria24 and had no history of other autoimmune diseases. Patients with SLE scored SLEDAI-200025 according to disease activity, with SLEDAI scores<5 as the inactive group (Inactive) and ≥5 as the active group (Active). Each patient was also evaluated for the SLICC / ACR-Damage Index (SDI).26 Patient samples were further divided into SI, NSI, SSA+SI, or SSA-SI groups. This study was approved by the Ethics Committee of the Second Affiliated Hospital of Zhejiang Chinese Medical University (2021-KL-071-01). Written informed consent was obtained from all participants.
Vacuum blood collection tubes were used to collect 2 mL of peripheral blood from each patient. Blood samples were placed at room temperature for 30 min and centrifuged at 3000 rpm for 15 min. The serum samples were then divided into 200 μL aliquots in microcentrifuge tubes and immediately stored at −80 °C.
Serum Non-Target Metabolomics Studies
Sample Handling and UPLC-MS/MS Analysis
Untargeted metabolomic analysis was conducted by Calibra Lab at DIAN Diagnostics (Hangzhou, Zhejiang, China) on CalOmics metabolomics platform. Samples were extracted using methanol in a ratio of 1:4. The mixtures were shaken for 3 minutes and precipitated by centrifugation at 4000×g, 10 minutes at 20°C. Four aliquots of 100μL supernatant were transferred to sample plates and dried under blowing nitrogen, then re-dissolved in reconstitution solutions for sample injection into UPLC-MS/MS systems. The instruments for the four UPLC-MS/MS methods are ACQUITY 2D UPLC (Waters, Milford, MA, USA) plus Q Exactive (QE) hybrid Quadrupole-Orbitrap mass spectrometer (Thermo Fisher Scientific, San Jose, USA). QE mass spectrometer was operated at a mass resolution of 35,000, the scan range was 70–1000 m/z. In the first UPLC-MS/MS method, QE was operated in positive ESI mode and the UPLC column was C18 reverse-phase (UPLC BEH C18, 2.1×100 mm, 1.7 um; Waters); the mobile solutions used in the gradient elution were water (A) and methanol (B) containing 0.05% PFPA and 0.1% FA. In the second UPLC-MS/MS method, QE was operated in negative ESI mode, and the UPLC column was C18 reverse-phase (UPLC BEH C18, 2.1×100 mm, 1.7 um; Waters), the mobile solutions used in the gradient elution were water (A) and methanol (B) containing 6.5 mM ammonium bicarbonate at pH 8. The third UPLC-MS/MS method had the QE operated in ESI positive mode and the UPLC column was C18 reverse-phase (UPLC BEH C18, 2.1×100 mm, 1.7 um; Waters), the mobile solutions were water (A) and methanol/acetonitrile/water (B) contain 0.05% PFPA and 0.01% FA. In the fourth method, QE was operated in negative ESI mode, the UPLC column was HILIC (UPLC BEH Amide, 2.1×150 mm, 1.7 um; Waters), and the mobile solutions were water (A) and acetonitrile (B) with 10 mM ammonium formate.
Compound identification and quantification After pre-processing of raw data and data quality control inspection, ion peaks were extracted using proprietary in-house IT hardware and software. Metabolites were identified by searching an in-house library generated from running reference standards commercially purchased or obtained from other sources. Identification of metabolites in samples requires strict matching of three criteria between experimental data and library entry: narrow window retention index (RI), accurate mass with variation less than 10 ppm and MS/MS spectra with high forward and reverse searching scores. Peak area for each metabolite was calculated using area-under-the-curve.
Data Normalization
After confirming that the detection data met quality control requirements, chromatographic peak extraction was performed. Metabolite identification was performed by comparison with CalOmics, a metabolite database based on standards, with strict matching of three indicators: retention index, primary precise mass, and secondary fragment spectrum. Metabolites were quantified by calculating the area under the chromatographic peak curve to obtain the original peak area of each metabolite.
Prior to statistical analysis, the raw peak areas were normalized to adjust for system fluctuations among the different run days. The normalized values were log-transformed (log2) to obtain an approximately normal distribution. Missing values were imputed using the minimum detection value of a metabolite among all samples.
Data Analysis
Chi-square and nonparametric tests were used to assess the clinical features. Principal component analysis (PCA) and orthogonal least squares discriminant analysis (OPLS-DA) were performed for peak areas normalized by R. P-values were calculated using Student’s t-test or a nonparametric test (Welch’s t-test) on normalized data. Differential metabolites were screened according to P<0.05 and VIP>1. Prim9.0 was used for differential metabolite expression level analysis and Spearman grade correlation analysis of SLEDAI. Correlation heatmaps and clustering heatmaps were constructed for visualization in R. Pathway enrichment analysis of differential metabolites was performed using MetaboAnalyst 5.0, along with conventional ROC model analysis and visualization.
Results
Clinical Characteristics
Thirty seven patients with SLE were included in this study and were divided into two groups according to clinical manifestations: the SI group (n = 23) and the NSI group (n = 14). The HC group was comparable to the SI and NSI groups in terms of sex, age, and BMI. There were no significant differences in complement levels, anti-dsDNA antibodies, anti-SSB antibodies, SLEDAI activity, and SDI scores between the SI and NSI groups; however, anti-SSA antibody positivity was more frequent in the SI group than that in the NSI group (P<0.01). In the SI group, there were 8 patients with acute cutaneous lupus, 13 patients with subacute cutaneous lupus, 2 patients with chronic cutaneous lupus and 10 patients with photosensitivity, with a partial overlap between subacute cutaneous lupus and photosensitivity. There were no significant differences in drug treatment between groups, including glucocorticoids, hydroxychloroquine, leflunomide, cyclophosphamide, methotrexate, and mycophenolate mofetil, as shown in Table 1. The flow chart of the study are shown in Figure 1.
 |
Table 1 Clinical Characteristics of the Study Participants |
 |
Figure 1 The grouping design and analysis flowchart. |
Differential Metabolites in SLE
PCA (Figure 2A) revealed differences between the HC and SLE groups. In addition, the differentiation of serum metabolites in the two groups was further clarified through the construction of the OPLSDA model (Figure 2B). The R2Y value of the OPLS-DA model was 0.936 and the Q2Y value was 0.755, indicating that the model was effective. Using the VIP and P values, we screened 325 differential metabolites, and the clustering heat map of the differential metabolites is shown in Figure 2D. These metabolites were primarily lipids, amino acids, xenobiotics, and peptides (Figure 2C). We further analyzed the largest proportion of lipid species (Figure 2E), among which fatty acids, hormones, and hemolytic phospholipids were the most common. Differential metabolites were enriched for caffeine, sphingolipid, histidine, and arginine biosynthesis pathways (Figure 2F).
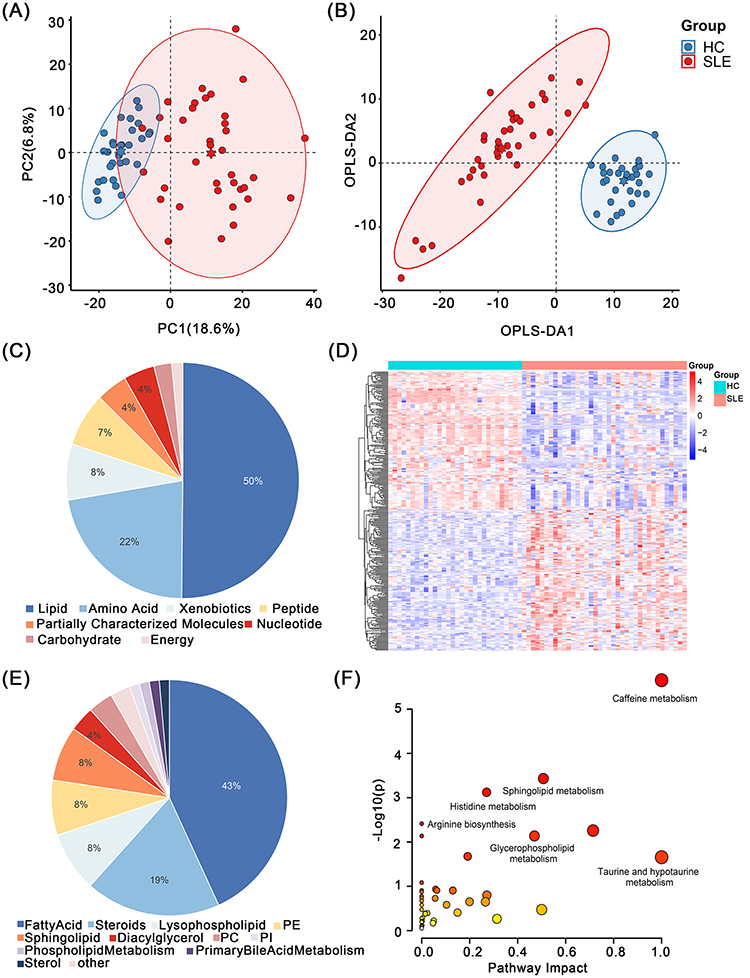 |
Figure 2 Serum metabolomic analysis between SLE group and HC group. (A) PCA analysis plot and (B) OPLS-DA analysis plot of SLE and HC. (C) Component composition of differential metabolites and (E) lipids. (D) The heat map shows 325 differential metabolites between SLE and HC. (F) Pathway enrichment map for 325 differential metabolites. |
Association of Serum Metabolic Profile with SLE Disease Activity
We divided the patients into the Inactive group (SLEDAI<5, n=11) and the Active group (SLEDAI≥5, n=26) for further analysis. PCA and OPLS-DA analyses of the two groups are shown in Figure 3A and B. We screened 156 metabolites in both groups. These metabolites were predominantly lipids, including fatty acids, lysophospholipids, steroids, sphingolipids, and phosphatidylcholine (Figure 3C and E). Differential metabolites were enriched for pentose and glucuronate interconversion, sphingolipid metabolism, ascorbate and aldarate metabolism, and glycerophospholipid metabolism (Figure 3D). Serum metabolites, such as Phosphatidylcholine (PC) (16:1/18:3), LysoPE (18:1), LysoPC (18:1 (9Z)), LysoPE (18:2), LysoPE (20:4), PE (P-16:0/18:1), PC (16:1), LysoPE (18:0), 4−acetamidobutanoate, cholesterol, PC (16:0/18:3), and SM (d18:0/16:0) were positively correlated with SLEDAI scores (Figure 3F).
 |
Figure 3 Serum metabolomic analysis between Active group and Inactive group. (A) PCA analysis plot and (B) OPLS-DA analysis plot of these two groups. (C) Component composition of differential metabolites and (E) lipids. (D) Pathway enrichment map for differential metabolites between these two groups. (F) Correlation analysis of differential metabolites and SLEDAI scores, 12 positive metabolites were selected based on Cor value and P value. ***P<0.001. |
Serum Metabolic Profile Analysis of SLE Skin Involvement
We compared the metabolites between the SLE and HC samples (Figure 4A and B). Venn diagram analysis identified 118 metabolic markers unique to the SI group (Figure 4C), which were mainly enriched for arginine biosynthesis, sphingolipid metabolism, alanine, aspartic acid, glutamate metabolism, arginine and proline metabolism, citrate cycling, and other pathways (Figure 4D). Further analysis of differential metabolites revealed that N-acetylglutamine (AUC=0.857), N-acetylphenylalanine (AUC=0.799), and fumarate (AUC=0.781) were the most significantly altered between the three groups and may play critical roles in SI (Figure 4E and F).
 |
Figure 4 Serum metabolomic analysis between SI group and NSI group. The composition of (A) differential metabolites and (B) lipids between SI, NSI and HC. (C) Wayne diagram of differential metabolites between SI, NSI and HC, thus identifying 118 differential metabolites belonging to SI. (D) Pathway enrichment map of 118 differential metabolites. (E) ROC curves and (F) expression differences of N-acetylglutamine, N-acetylphenylalanine and fumarate between SI and NSI, HC. NS: P>0.05. * 0.01<P<0.05, **0.001<P<0.01, ***P<0.001. |
Serum Metabolic Profile Analysis of SI Associated with Anti-SSA Antibodies
In our study, the positivity rate of anti-SSA antibodies was higher in the SI group than that in the NSI group. The relationship between patients with SI and anti-SSA antibodies has been well-documented. Therefore, we performed a subgroup analysis of the SI group to explore metabolite differences between SSA+SI and SSA-SI patients.
There was a significant degree of differentiation between the SSA+SI and SSA-SI groups in the OPLSDA model (Figure 5A and B). We identified 27 differential metabolites between the two groups, which were mainly enriched for carnitine synthesis, glutamate metabolism, arginine and proline metabolism, alanine metabolism, tryptophan metabolism, and glutathione metabolism pathways (Figure 5C). Based on the VIP values, we selected the top 10 metabolites for ROC analysis. The results showed that SM (d18:1/24:0) and gamma-CEHC could distinguish between SSA+SI and SSA-SI patients, with AUC values of 0.829 and 0.806, respectively (Figure 5D and E).
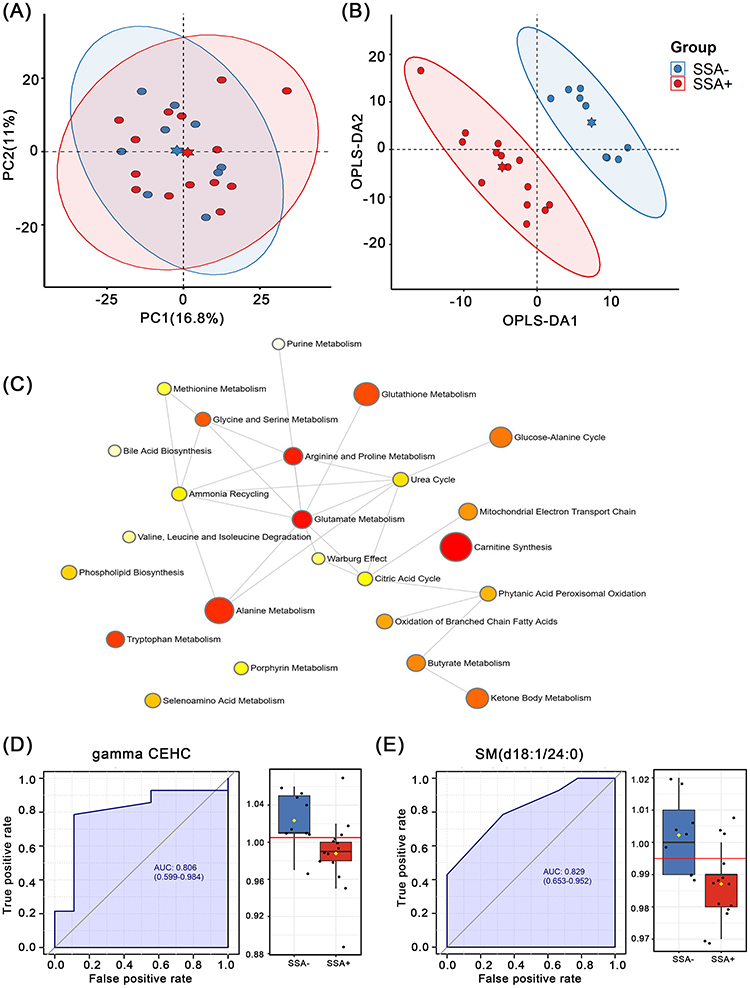 |
Figure 5 Serum metabolomic analysis between SSA+SI group and SSA-SI group. (A) PCA analysis plot and (B) OPLS-DA analysis plot of these two groups. (C) Pathway enrichment plots for the 27 differential metabolites between these two groups. ROC curves of (D) gamma-CEHC and (E) SM (d18:1 / 24:0) and expression levels in these two groups. |
Discussion
SLE photosensitivity causes skin disorders and can lead to serious systemic disease. When people with SLE are exposed to UVR, the pathogenic stimulus travels from the skin to the draining lymph nodes through lymphatic vessels and dendritic cells. This activates autoimmune T and B cell development response cells and leads to the development of systemic lesions.27 It has been shown that keratinocyte apoptosis caused by altered methylation of Hippo Pathway is correlated with skin photosensitivity in SLE.28 On the other hand, increased interferon Kappa in keratinocytes improves its sensitivity to UVR exposure and aggravates disease.29 UVR can induce the type I IFN response to cause the secretion of Th1 associated chemokines such as C-X-C motif chemokine ligand 9/10 in T cells, which contributes to the further recruitment of T cells.30 UVR stimulates neutrophil migration to the skin or to the kidney in an IL-17A dependent manne.31,32 Besides, expression of anti-SSA antibodies is closely associated with SI and photosensitivity. Studies have shown that subtype Ro52 of the SSA antibody can be ectopic to the cell surface under UVR exposure, and its expression in the lupus-afflicted epidermis is significantly upregulated,33 this makes it easy to bind to antibodies to form an immune complex and amplify the inflammatory response through multiple mechanisms,34 such as Type I IFN response and oxidative stress.30 However, current research on the relationship between skin photosensitivity and anti-SSA antibody-positive SLE patients remains limited.
This study showed that carnitine synthesis, glutamate metabolism, arginine and proline metabolism, alanine metabolism, tryptophan metabolism, and glutathione metabolism pathways were associated with anti-SSA antibodies. L-carnitine, a bioactive substance in the carnitine metabolic pathway, can reduce the activation of the protein p38 and c-Fos in UVR-induce skin tissue and exert potential protective effects against UVR-induced skin tissue damage.35 Reduced glutathione is also a key intracellular antioxidant that can mitigate oxidative stress in skin after UVR exposure.36 Tryptophan and arginine are also associated with oxidative stress and wound repair. However, there is insufficient evidence regarding their autoantibodies and light sensitivity. The ROC model suggested that SM (d18:1/24:0) and gamma-CEHC are potential metabolic markers of skin involvement in anti-SSA antibody-associated SI. SM is generated by ceramide and phosphatidylcholine, and it was found that supplementation with dietary sphingomyelin to maintain covalent bound ω-hydroxyceramide reduces the adverse effects of UVR on the skin.37 Gamma-CEHC is a metabolite of vitamin E, which is a peroxy-free radical scavenger, reduces the oxidative stress response of SLE and the production of proinflammatory factors and autoantibodies.38,39 In our study, patients in SSA+SI group had decreased SM (d18:1/24:0) and gamma-CEHC levels compared to SSA-SI group; consumption of beneficial sphingolipids and vitamin E may protect against the effects of UVR. The findings of this study may partly explain the relationship between skin photosensitivity of SLE and anti-SSA antibodies, and also provide new insights into the disease mechanisms in SLE patients with skin involvement.
Two previous studies have investigated the metabolic characteristics of SI using different detection modalities. A gas chromatography/mass spectrometry study of serum metabolomics has suggested that l-alpha-aminobutyric acid, dehydroascorbic acid, glycine, and l-tyrosine may be potential markers of skin lesions in SLE.40 Another study on multisystem involvement in SLE suggested that L-isoleucine and TAG metabolites are associated with SLE skin involvement.14 The results of this study suggest that arginine biosynthesis, sphingolipid metabolism, alanine, aspartate, glutamate metabolism, arginine and proline metabolism, and citric acid cycle are the metabolic pathways mainly altered by skin involved SLE, some of the differential metabolites differ from other studies, probably due to the choice of the detection method and individual difference. Furthermore, due to differences in detection methods, this study captures more information about the lipids and thus, as a supplement to other studies, we found that the sphingolipid pathway is the main metabolic pathway associated with SLE skin involvement. Ceramide, the core component of sphingolipids, is an important component of the protective skin barrier and improves the permeability of the epidermal barrier when combined with cholesterol and free fatty acids.41 There are currently no studies on sphingolipid metabolism in SI; however, studies on other autoimmune skin diseases have suggested that changes in the sphingolipid pathway are associated with inflammatory skin damage. Significant changes in ceramide-related enzymes and metabolites have been observed in patients with psoriatic dermatomyositis, where sphingosine 1-phosphate can mediate a variety of immune responses.42–44 Furthermore, UVR exposure has been reported to influence plasma ceramide and SM levels in mice.45 The dynamic balance of sphingolipid metabolism plays an important role in skin homeostasis and may be involved in the oxidative stress response to UVR exposure in patients with SI. However, the specific mechanism needs to be further studied.
Our study identified N-acetylglutamine, N-acetylphenylalanine, and fumarate as characteristic metabolites of SI. N-acetylglutamine is involved in mediating oxidative stress and regulating inflammation, has a repair effect on cells,46,47 and is often used in skin moisturizers. However, we were unable to obtain information on skin care products used by the patients in our study. N-acetylphenylalanine and fumarate may be markers of UVR-induced photodamage.48,49 Moreover, dimethyl fumarate, a derivative of fumarate, which inhibits dendritic cell maturation and reduces pathogenic T cell activation, exerts therapeutic effects on psoriasis and SLE.50,51
This study has some limitations. The sample size of each subgroup was small; this is only a preliminary study that looks at the possibility of a relationship, which will be followed up with similar research with a larger sample size. Moreover, antibody detection against SSA in this study did not distinguish between the Ro52 and Ro60 subtypes. To the best of our knowledge, this is the first study to perform a metabolic analysis of SI and anti-SSA antibody expression in patients with SLE. We identified characteristic metabolites and metabolic pathways in patients with SI and diagnostic markers associated with anti-SSA antibodies. Our study provides a new molecular basis for the link between skin damage and light sensitivity in SLE at the metabolite level and provides new directions for the clinical diagnosis of SLE and continued research on its pathophysiology.
Conclusion
Metabolomics provides valuable insights into the clinical characterization of SLE. Our study provides a new molecular biological basis for the association between anti-SSA antibodies and skin photoallergic manifestations of SLE by serum metabolomic analysis, which must be proven by further studies with larger sample sizes.
Statement of Ethics
This study was conducted in accordance with the Declaration of Helsinki and approved by the Ethics Committee of the Second Affiliated Hospital of Zhejiang Chinese Medical University, approval number [2021-KL-071-01]. All of the participants enrolled in the study gave their written informed consent.
Acknowledgments
We thank all members involved in this study, especially Hangzhou Dian Medical Laboratory Center Co., Ltd., for their technical support for this study.
Funding
This research was supported by National Natural Science Foundation of China (No.82074341), Zhejiang Province Traditional Chinese Medicine Science and Technology Program (No.2020ZX008) and General Research Project of Education Department of Zhejiang Province (No.Y202248715).
Disclosure
The authors report no conflicts of interest in this work.
References
1. Yafasova A, Fosbøl EL, Schou M, et al. Long-term cardiovascular outcomes in systemic lupus erythematosus. J Am Coll Cardiol. 2021;77(14):1717–1727. doi:10.1016/j.jacc.2021.02.029
2. Zou YF, Feng CC, Zhu JM, et al. Prevalence of systemic lupus erythematosus and risk factors in rural areas of Anhui Province. Rheumatol Int. 2014;34(3):347–356. doi:10.1007/s00296-013-2902-1
3. Kiriakidou M, Ching CL. Systemic lupus erythematosus. Ann Intern Med. 2020;172(11):Itc81–itc96. doi:10.7326/aitc202006020
4. Tsokos GC. Autoimmunity and organ damage in systemic lupus erythematosus. Nat Immunol. 2020;21(6):605–614. doi:10.1038/s41590-020-0677-6
5. Li M, Zhang W, Leng X, et al. Chinese SLE Treatment and Research group (CSTAR) registry: i. Major clinical characteristics of Chinese patients with systemic lupus erythematosus. Lupus. 2013;22(11):1192–1199. doi:10.1177/0961203313499086
6. Sanders CJ, Van Weelden H, Kazzaz GA, Sigurdsson V, Toonstra J, Bruijnzeel-Koomen CA. Photosensitivity in patients with lupus erythematosus: a clinical and photobiological study of 100 patients using a prolonged phototest protocol. Br J Dermatol. 2003;149(1):131–137. doi:10.1046/j.1365-2133.2003.05379.x
7. Min X, Zheng M, Yu Y, et al. Ultraviolet light induces HERV expression to activate RIG-I signalling pathway in keratinocytes. Exp Dermatol. 2022;31(8):1165–1176. doi:10.1111/exd.14568
8. Pattison DI, Rahmanto AS, Davies MJ. Photo-oxidation of proteins. Photochem Photobiol Sci. 2012;11(1):38–53. doi:10.1039/c1pp05164d
9. Novak GV, Marques M, Balbi V, et al. Anti-RO/SSA and anti-La/SSB antibodies: association with mild lupus manifestations in 645 childhood-onset systemic lupus erythematosus. Autoimmun Rev. 2017;16(2):132–135. doi:10.1016/j.autrev.2016.12.004
10. Stavropoulos PG, Goules AV, Avgerinou G, Katsambas AD. Pathogenesis of subacute cutaneous lupus erythematosus. J Eur Acad Dermatol Venereol. 2008;22(11):1281–1289. doi:10.1111/j.1468-3083.2008.02806.x
11. Tang K-T, Chien H-J, Chang Y-H, Liao T-L, Chen D-Y, Lai -C-C. Metabolic disturbances in systemic lupus erythematosus evaluated with UPLC-MS/MS. Clin Exp Rheumatol. 2021. doi:10.55563/clinexprheumatol/93qonf
12. Wang Y, Guo F, Guo Y, et al. Untargeted lipidomics reveals specific lipid abnormalities in systemic lupus erythematosus. Clin Exp Rheumatol. 2022;40(5):1011–1018. doi:10.55563/clinexprheumatol/ye2ua5
13. Gorczyca D, Szponar B, Paściak M, Czajkowska A, Szmyrka M. Serum levels of n-3 and n-6 polyunsaturated fatty acids in patients with systemic lupus erythematosus and their association with disease activity: a pilot study. Scand J Rheumatol. 2022;51(3):230–236. doi:10.1080/03009742.2021.1923183
14. Zhang W, Zhao H, Du P, et al. Integration of metabolomics and lipidomics reveals serum biomarkers for systemic lupus erythematosus with different organs involvement. Clin Immunol. 2022;241:109057. doi:10.1016/j.clim.2022.109057
15. Li Y, Liang L, Deng X, Zhong L. Lipidomic and metabolomic profiling reveals novel candidate biomarkers in active systemic lupus erythematosus. Int J Clin Exp Pathol. 2019;12(3):857–866.
16. He J, Ma C, Tang D, et al. Absolute quantification and characterization of oxylipins in lupus nephritis and systemic lupus erythematosus. Front Immunol. 2022;13:964901. doi:10.3389/fimmu.2022.964901
17. Li J, Ding H, Meng Y, et al. Taurine metabolism aggravates the progression of lupus by promoting the function of plasmacytoid dendritic cells. Arthritis Rheumatol. 2020;72(12):2106–2117. doi:10.1002/art.41419
18. Zhang Y, Gan L, Tang J, Liu D, Chen G, Xu B. Metabolic profiling reveals new serum signatures to discriminate lupus nephritis from systemic lupus erythematosus. Front Immunol. 2022;13:967371. doi:10.3389/fimmu.2022.967371
19. Guleria A, Pratap A, Dubey D, et al. NMR based serum metabolomics reveals a distinctive signature in patients with Lupus Nephritis. Sci Rep. 2016;6:35309. doi:10.1038/srep35309
20. Kalantari S, Chashmniam S, Nafar M, Zakeri Z, Parvin M. Metabolomics approach reveals urine biomarkers and pathways associated with the pathogenesis of lupus nephritis. Iran J Basic Med Sci. 2019;22(11):1288–1295. doi:10.22038/ijbms.2019.38713.9178
21. Coelewij L, Waddington KE, Robinson GA, et al. Serum metabolomic signatures can predict subclinical atherosclerosis in patients with systemic lupus erythematosus. Arterioscler Thromb Vasc Biol. 2021;41(4):1446–1458. doi:10.1161/atvbaha.120.315321
22. Hammad SM, Harden OC, Wilson DA, Twal WO, Nietert PJ, Oates JC. Plasma sphingolipid profile associated with subclinical atherosclerosis and clinical disease markers of systemic lupus erythematosus: potential predictive value. Front Immunol. 2021;12:694318. doi:10.3389/fimmu.2021.694318
23. Robinson GA, Peng J, Pineda-Torra I, Ciurtin C, Jury EC. Metabolomics defines complex patterns of dyslipidaemia in juvenile-SLE patients associated with inflammation and potential cardiovascular disease risk. Metabolites. 2021;12(1). doi:10.3390/metabo12010003
24. Petri M, Orbai AM, Alarcón GS, et al. Derivation and validation of the systemic lupus international collaborating clinics classification criteria for systemic lupus erythematosus. Arthritis Rheum. 2012;64(8):2677–2686. doi:10.1002/art.34473
25. Gladman DD, Ibañez D, Urowitz MB. Systemic lupus erythematosus disease activity index 2000. J Rheumatol. 2002;29(2):288–291.
26. Gladman D, Ginzler E, Goldsmith C, et al. The development and initial validation of the Systemic Lupus International Collaborating Clinics/American College of Rheumatology damage index for systemic lupus erythematosus. Arthritis Rheum. 1996;39(3):363–369. doi:10.1002/art.1780390303
27. Sim JH, Ambler WG, Sollohub IF, et al. Immune cell-stromal circuitry in lupus photosensitivity. J Immunol. 2021;206(2):302–309. doi:10.4049/jimmunol.2000905
28. Hile GA, Coit P, Xu B, et al. Regulation of photosensitivity by the Hippo pathway in Lupus skin. Arthritis Rheumatol. 2023;75(7):1216–1228. doi:10.1002/art.42460
29. Sarkar MK, Hile GA, Tsoi LC, et al. Photosensitivity and type I IFN responses in cutaneous lupus are driven by epidermal-derived interferon kappa. Ann Rheum Dis. 2018;77(11):1653–1664. doi:10.1136/annrheumdis-2018-213197
30. Klein B, Kunz M. Current concepts of photosensitivity in cutaneous lupus erythematosus. Front Med. 2022;9:939594. doi:10.3389/fmed.2022.939594
31. Skopelja-Gardner S, An J, Tai J, et al. The early local and systemic type I interferon responses to ultraviolet B light exposure are cGAS dependent. Sci Rep. 2020;10(1):7908. doi:10.1038/s41598-020-64865-w
32. Skopelja-Gardner S, Tai J, Sun X, et al. Acute skin exposure to ultraviolet light triggers neutrophil-mediated kidney inflammation. Proc Natl Acad Sci USA. 2021;118(3). doi:10.1073/pnas.2019097118
33. Oke V, Vassilaki I, Espinosa A, et al. High Ro52 expression in spontaneous and UV-induced cutaneous inflammation. J Invest Dermatol. 2009;129(8):2000–2010. doi:10.1038/jid.2008.453
34. Estadt SN, Maz MP, Musai J, Kahlenberg JM. Mechanisms of photosensitivity in autoimmunity. J Invest Dermatol. 2022;142(3 Pt B):849–856. doi:10.1016/j.jid.2021.05.007
35. Salama SA, Arab HH, Omar HA, et al. L-carnitine mitigates UVA-induced skin tissue injury in rats through downregulation of oxidative stress, p38/c-Fos signaling, and the proinflammatory cytokines. Chem Biol Interact. 2018;285:40–47. doi:10.1016/j.cbi.2018.02.034
36. Nagapan TS, Lim WN, Basri DF, Ghazali AR. Oral supplementation of L-glutathione prevents ultraviolet B-induced melanogenesis and oxidative stress in BALB/c mice. Exp Anim. 2019;68(4):541–548. doi:10.1538/expanim.19-0017
37. Morifuji M. The beneficial role of functional food components in mitigating ultraviolet-induced skin damage. Exp Dermatol. 2019;28(Suppl 1):28–31. doi:10.1111/exd.13825
38. Hsieh CC, Lin BF. Dietary factors regulate cytokines in murine models of systemic lupus erythematosus. Autoimmun Rev. 2011;11(1):22–27. doi:10.1016/j.autrev.2011.06.009
39. Jiao H, Acar G, Robinson GA, Ciurtin C, Jury EC, Kalea AZ. Diet and Systemic Lupus Erythematosus (SLE): from supplementation to intervention. Int J Environ Res Public Health. 2022;19(19). doi:10.3390/ijerph191911895
40. Xie Y, Liu B, Wu Z. Identification of serum biomarkers and pathways of systemic lupus erythematosus with skin involvement through GC/MS-Based metabolomics analysis. Clin Cosmet Investig Dermatol. 2022;15:77–86. doi:10.2147/ccid.S345372
41. Fujii M. The pathogenic and therapeutic implications of ceramide abnormalities in atopic dermatitis. Cells. 2021;10(9). doi:10.3390/cells10092386
42. Kleuser B, Bäumer W. Sphingosine 1-phosphate as essential signaling molecule in inflammatory skin diseases. Int J Mol Sci. 2023;24(2). doi:10.3390/ijms24021456
43. Alessandrini F, Pfister S, Kremmer E, Gerber JK, Ring J, Behrendt H. Alterations of glucosylceramide-beta-glucosidase levels in the skin of patients with psoriasis vulgaris. J Invest Dermatol. 2004;123(6):1030–1036. doi:10.1111/j.0022-202X.2004.23469.x
44. Dvergsten JA, Reed AM, Landerman L, Pisetsky DS, Ilkayeva O, Huffman KM. Metabolomics analysis identifies a lipidomic profile in treatment-naïve juvenile dermatomyositis patients vs healthy control subjects. Rheumatology. 2022;61(4):1699–1708. doi:10.1093/rheumatology/keab520
45. Łuczaj W, Jastrząb A, Do Rosário Domingues M, Domingues P, Skrzydlewska E. Changes in phospholipid/ceramide profiles and eicosanoid levels in the plasma of rats irradiated with UV rays and treated topically with cannabidiol. Int J Mol Sci. 2021;22(16). doi:10.3390/ijms22168700
46. Patra V, Bordag N, Clement Y, et al. Ultraviolet exposure regulates skin metabolome based on the microbiome. Sci Rep. 2023;13(1):7207. doi:10.1038/s41598-023-34073-3
47. Altman BJ, Stine ZE, Dang CV. From Krebs to clinic: glutamine metabolism to cancer therapy. Nat Rev Cancer. 2016;16(10):619–634. doi:10.1038/nrc.2016.71
48. Liu M, Yu W, Fang Y, et al. Pyruvate and lactate based hydrogel film inhibits UV radiation-induced skin inflammation and oxidative stress. Int J Pharm. 2023;634:122697. doi:10.1016/j.ijpharm.2023.122697
49. Moon E, Park HM, Lee CH, et al. Dihydrolipoyl dehydrogenase as a potential UVB target in skin epidermis; using an integrated approach of label-free quantitative proteomics and targeted metabolite analysis. J Proteomics. 2015;117:70–85. doi:10.1016/j.jprot.2014.12.016
50. Mazzola MA, Raheja R, Regev K, et al. Monomethyl fumarate treatment impairs maturation of human myeloid dendritic cells and their ability to activate T cells. Mult Scler. 2019;25(1):63–71. doi:10.1177/1352458517740213
51. Saracino AM, Orteu CH. Severe recalcitrant cutaneous manifestations in systemic lupus erythematosus successfully treated with fumaric acid esters. Br J Dermatol. 2017;176(2):472–480. doi:10.1111/bjd.14698
 © 2023 The Author(s). This work is published and licensed by Dove Medical Press Limited. The full terms of this license are available at https://www.dovepress.com/terms.php and incorporate the Creative Commons Attribution - Non Commercial (unported, v3.0) License.
By accessing the work you hereby accept the Terms. Non-commercial uses of the work are permitted without any further permission from Dove Medical Press Limited, provided the work is properly attributed. For permission for commercial use of this work, please see paragraphs 4.2 and 5 of our Terms.
© 2023 The Author(s). This work is published and licensed by Dove Medical Press Limited. The full terms of this license are available at https://www.dovepress.com/terms.php and incorporate the Creative Commons Attribution - Non Commercial (unported, v3.0) License.
By accessing the work you hereby accept the Terms. Non-commercial uses of the work are permitted without any further permission from Dove Medical Press Limited, provided the work is properly attributed. For permission for commercial use of this work, please see paragraphs 4.2 and 5 of our Terms.