Back to Journals » International Journal of Nephrology and Renovascular Disease » Volume 19
Serum Metabolomic Profiling Reveals Distinct Signatures and Candidate Biomarkers in Chronic Kidney Disease
Authors Jin H, Gao Y, Zhang H, Li H, Wang W, Zhang K ![]() , Zhang F
, Zhang F ![]()
Received 19 January 2026
Accepted for publication 1 May 2026
Published 13 May 2026 Volume 2026:19 597353
DOI https://doi.org/10.2147/IJNRD.S597353
Checked for plagiarism Yes
Review by Single anonymous peer review
Peer reviewer comments 3
Editor who approved publication: Professor Pravin Singhal
Huimin Jin,1,* Yun Gao,1,* Haochen Zhang,2 Hanbing Li,2 Wenqi Wang,1 Keyi Zhang,1 Fenghua Zhang1
1Department of Laboratory Medicine, Shanghai University of Health Sciences Affiliated Zhoupu Hospital, Shanghai, 200120, People’s Republic of China; 2Department of Environmental Science, Beijing University of Technology, Beijing, 100124, People’s Republic of China
*These authors contributed equally to this work
Correspondence: Fenghua Zhang, Email [email protected]
Introduction: Chronic kidney disease (CKD) is accompanied by systemic metabolic dysregulation, and metabolomics provides a robust approach for identifying disease-specific metabolic signatures and potential biomarkers. Hypertension may be closely associated with metabolic disturbances in CKD. This study aimed to characterize serum metabolic alterations and dysregulated pathways in CKD, and screen candidate metabolite biomarkers for distinguishing CKD patients from healthy individuals.
Methods: A total of 65 participants (35 CKD patients and 30 healthy controls) were enrolled in this study. Serum metabolic profiling was performed using high-resolution mass spectrometry-based untargeted metabolomics, while targeted analysis of small molecule metabolites was conducted via liquid chromatography-mass spectrometry (LC-MS). Multivariate statistical analyses including principal component analysis (PCA) and orthogonal partial least squared-discriminant analysis (OPLS-DA) were applied to identify metabolic alterations between groups. Kyoto Encyclopedia of Genes and Genomes (KEGG) pathway enrichment analysis was used to annotate the functional roles of differentially expressed metabolites. Independent t-tests and Pearson correlation analyses were performed to validate the expression and correlation of key metabolites.
Results: A total of 1,426 metabolites were detected in all serum samples, with 1,246 successfully identified by secondary mass spectrometry. Differential analysis revealed 397 significantly altered metabolites (216 up-regulated and 181 down-regulated) between the CKD and control groups. KEGG enrichment analysis indicated that these differential metabolites were mainly involved in phenylalanine metabolism, arginine and proline metabolism, and glutathione metabolism, suggesting systemic metabolic dysfunction in CKD. Targeted analysis of catecholamines showed that serum concentrations of adrenaline and nicotinamide mononucleotide (NMN) were significantly altered in CKD patients compared with healthy controls (P < 0.05), though no significant linear correlation was observed between these two metabolites and CKD progression via Pearson correlation analysis.
Discussion: The identified metabolic pathway dysregulations (amino acid metabolism and redox-related pathways) are core metabolic characteristics of CKD, which are closely associated with renal function impairment, oxidative stress and hypertension in CKD. Adrenaline and NMN may serve as potential candidate biomarkers for CKD, and their abnormal expression may be linked to the activation of the renin-angiotensin system and dysregulation of renal energy metabolism. However, the specific mechanistic roles of these two metabolites in CKD pathophysiology remain to be elucidated.
Conclusion: This study comprehensively characterized serum metabolic alterations in CKD and identified key dysregulated metabolic pathways, as well as adrenaline and NMN as potential candidate biomarkers. These findings enhance the understanding of biochemical dysregulation underlying CKD and provide novel insights for future diagnostic biomarker development and targeted therapeutic exploration for CKD.
Keywords: chronic kidney disease, hypertension, untargeted metabolomics, catecholamines
Introduction
Chronic kidney disease (CKD) is a progressive disorder characterized by structural and functional impairment of the kidneys,1 resulting in a major global public health challenge due to its high prevalence, disability burden and complex pathophysiology.2 From recent reports, CKD is proved to be associated with multi-system metabolic disturbances and can increase the risk of cardiovascular complications.3 It is evident that immune dysregulation and metabolic imbalance play important roles in CKD progression. During CKD progression, the accumulation of metabolic wastes, enhanced oxidative stress, and immune dysregulation can further stimulate the production or pathogenicity of antiphospholipid antibodies.4 These antibodies may in turn aggravate microvascular dysfunction and metabolic disturbance, forming a vicious cycle that promotes renal injury.5 However, the specific metabolic pathways linked to antiphospholipid antibodies in CKD remain poorly understood.6
Metabolomics, an important branch of systems biology, enables comprehensive profiling of small-molecule metabolites, providing robust technical support for elucidating disease mechanisms and identifying novel biomarkers.7,8 In recent years, metabolomics has demonstrated unique advantages for CKD investigations, supporting early diagnosis, monitoring disease progression, and predicting complications. Sekula et al identified 54 metabolites significantly correlated with estimated glomerular filtration rate (eGFR), proving C-mannosyltryptophan and pseudouridine were novel renal function markers superior to traditional markers such as creatinine.9 The application of metabolomics by Shah et al on more than 100 metabolites involved in inflammatory mediation and adrenal hormone synthesis found that arginine metabolism disorder, activation of inflammation/coagulation pathways, and reduced steroid hormone synthesis are key features of CKD progression.10 Symptoms of tricarboxylic acid cycle interruption and abnormal fatty acid oxidation detected in patients with CKD and vascular calcification suggested the importance of phospholipid metabolism pathways in the calcification process.11 In addition, results of metabolomics in the study of Goek et al identified 22 metabolites including glutamyl carnitine significantly associated with eGFR decline in a considerable number of people, and CKD risks predicted by their combined model.12 Therefore, this study aims to combine metabolomics technology to deeply explore the serum/urine metabolic profiles of CKD patients, identify specific metabolic markers and key metabolic pathways associated with antiphospholipid antibodies, and reveal the potential mechanisms by which antiphospholipid antibodies contribute to metabolic disorders in CKD. This research aims to provide a theoretical basis for optimizing risk stratification in CKD patients and developing targeted metabolic intervention strategies.
Despite advances, evidence on metabolic network dysregulation in CKD remains limited, and the mechanistic involvement of key pathways in disease progression is not fully understood. Therefore, we conducted an untargeted metabolomics study involving 65 participants, including 30 healthy controls and 35 CKD patients. Our retrospective study aimed to identify differential metabolites, characterize their distribution across groups, and perform quantitative validation of representative metabolite categories. This research seeks to provide new insights into metabolic dysregulation in CKD, with potential implications for patient risk stratification and the development of targeted metabolic interventions.
Materials and Methods
Participants
A total of 65 participants were enrolled at Shanghai University of Health Sciences Affiliated Zhoupu Hospital, Shanghai, China, between January 2025 and July 2025, including 43 males and 22 females. Participants were stratified into two groups: healthy controls (n = 30) and CKD patients (n = 35). Diagnosis of CKD was established based on serum creatinine, estimation of glomerular filtration rate (eGFR), and urine protein levels. Healthy control subjects were recruited from the hospital health examination center and matched to the CKD group by age and sex.
Inclusion criteria were: (1) age from 41 to 90 years; (2) healthy controls with no history of chronic diseases and normal renal function; (3) CKD patients meeting clinical diagnostic criteria, specifically those in CKD stage 4 or 5 with an estimated glomerular filtration rate (eGFR) of less than 30 mL/min/1.73m2; (4) provision of written informed consent.
Exclusion criteria included: malignancies, severe cardiovascular or other chronic diseases; recent use of medications affecting metabolism; pregnancy or lactation; psychiatric disorders that could interfere with study participation. All participants provided informed consent, and the study protocol was reviewed and approved by the Ethics Committee of Shanghai University of Health Sciences Affiliated Zhoupu Hospital.
Biospecimen Collection and Processing
Serum samples were meticulously collected under standardized conditions to preserve metabolite stability,13 and processed in accordance with standard operating procedures, ensuring the stability of metabolites and the reliability of the obtained data. Venous blood was drawn from fasting individuals in the morning and transferred into vacuum tubes, followed by centrifugation at 3000 r/min for 10 minutes to separate the serum.14 The separated serum was then aliquoted into sterile cryogenic tubes and immediately stored at −80°C to prevent degradation and avoid repeated freeze-thaw cycles. Prior to analysis, samples were thawed on ice until no crystals remained, and then vortexed for 10 seconds before being transferred into centrifuge tubes. Subsequently, each sample was treated with 300 μL of an internal standard extraction solution containing 20% acetonitrile-methanol (1:1, v/v) and vortexed for 3 minutes. Samples were then centrifuged at 12,000 rpm for 10 minutes, and 200 μL of the supernatant was transferred to a new tube and stored in a −20°C freezer for 30 minutes. A second centrifugation (12,000 rpm, 3 minutes) was performed, and 180 μL of the supernatant was transferred into LC-MS vials for analysis.
The sample preparation method for catecholamines was performed by using the Waters Oasis® WCX 96-well solid-phase extraction plate (30 μm, 30 mg). Plasma samples, calibration standards, quality control samples and blank controls (400 μL each) were pipetted into a 2 mL 96-well plate at room temperature. The 50 μL of water was added to well 1, and 50 μL of internal standard extraction solution was added to well 2 and other remaining wells. The 96-well plate was sealed and mixed at 950 rpm for 5 min. Before extraction, the WCX plate was conditioned with 500 μL of methanol, followed by equilibration with 500 μL of water. Flow through of methanol and water out from the plate bottom was driven by either gravity or positive pressure. The prepared samples were then loaded onto a 96-well plate. Sequential rinse procedure was initiated with adding 500 μL of sample extraction solution A, 500 μL of pure water, and 500 μL of acetonitrile to the WCX extraction plate. Elution was performed by using 600 μL of sample extraction solution B to the WCX extraction plate, and eluates were collected in a new 96-well plate for evaporation to dryness under a stream of nitrogen, which is followed by adding 50 μL of extraction solution C. The plate was sealed and mixed at 950 rpm for 5 min before instrumental measurements.
LC-MS Analysis
Untargeted metabolomics analysis was performed using an LC-MS/MS equipment (Vanquish-Q Exactive HF-X, Thermo Scientific, USA). Sample separation was achieved using a Waters ACQUITY Premier HSS T3 column (1.8 μm, 2.1 mm × 100 mm). The mobile phase consisted of 0.1% formic acid in water (phase A) and 0.1% acetic acid in acetonitrile (phase B).15 The gradient elution program was as follows: 95% A + 5% B at 0 min, to 80% A and 20% B at 1 min, to 1% A + 99% B phase at 3 min, and maintained until 4.5 min, finally returned to 95% A + 5% B at 4.6 min. The column temperature was maintained at 40°C, with a flow rate at 0.4 mL/min and an injection volume of 4 µL.
Mass spectrometric detection was performed using a Q Exactive HF-X mass spectrometer operated in both positive (ESI+, 3500 V) and negative (ESI−, 3200 V) ionization modes. The mass scan range was m/z 75–1000. MS1 and MS2 resolutions were set at 35,000 and 17,500, respectively. Sheath and auxiliary gases were set at 30 and 5 (arbitrary units), respectively. The ion transfer tube and vaporizer temperatures were set at 320 °C and 300 °C. Collision energies were 30, 40, and 50 V. A data-dependent acquisition mode with a dynamic exclusion time of 3 seconds was used for MS1/MS2.
For the determination of catecholamines, mobile phase A consists of an aqueous solution containing 0.1% formic acid and 0.2 mM ammonium fluoride, and mobile phase B consists of a methanol solution containing 0.2 mM ammonium fluoride. The needle cleaning solution is an aqueous solution containing 50% methanol. Separation is performed using a Phenomenex Kinetex chromatographic column (2.8 μm, 3.0×100 mm, catalog number: 00D-4723-Y0), and the instrument used is a triple quadrupole liquid chromatography–mass spectrometry system (ARP6465MD, Shanghai Rongjia Biotechnology Co., Ltd). The parameters of the multisampler (model K7167A) were as follows: sampling rate 100.0 µL/min, ejection rate 400.0 µL/min, sampling wait time 1.2 s, injection mode standard needle washing, injection volume 20.00 µL, needle washing mode flushing port, duration 3 s, no high throughput, injection valve bypass to reduce delay volume 5.0, no overlapping injections, needle height position −0.2 mm, no bottle/well bottom detection, stop time unrestricted, stop time mode off; the parameters for the binary pump (model K7112B) are: flow rate 0.400 mL/min, solvent type used, low-pressure limit 0.00 bar, high-pressure limit 600.00 bar, stroke A maximum flow rate gradient 100.000 mL/min2, automatic calculation of strokes A and B, stop time mode set to time-based, stop time 5.50 min, post-time mode is time-set, post-time 1.20 min, at 1.20 min in the schedule, Phase A 97.0%, Phase B 3.0%, flow rate 0.400 mL/min, at 2.20 min, Phase A 90.0%, Phase B 10.0%, flow rate 0.500 mL/min. From 2.30 to 3.80 minutes, Phase A is 2.0%, Phase B is 98.0%, and flow rate is 0.500 mL/min. From 3.81 to 5.50 minutes, Phase A is 97.0%, Phase B is 3.0%, and flow rate is 0.400 mL/min; Column oven (model K7116A) parameters: no position switching after startup, both left and right temperature control modes set to temperature setting, both at 40.0 °C, both with analysis temperature enabled, analysis temperature value set to 0.8 °C, equilibration time set to 0.0 min, no forced operation of the chromatographic column, post-stop time mode synchronized with the pump/injector, post-stop time mode disabled; the parameters for the triple quadrupole mass spectrometer (model Ultivo) are as follows: tuning file atunes.tune, ion source AJS ESI, time filter enabled, window 0.07 min, stop time determined by pump time, scan type MRM, source parameters: gas 280, gas flow 5, Nebulizer 45 psi, capillary positive 2500/negative 4000, sheath gas 380, sheath gas flow 11, nozzle voltage positive 0/negative 1500, chromatogram label TIC, time schedule at 0 min switch valve to MS, polarity all positive, ion mode all ESI, compound information includes MN-1, MN-2, E-1, E-2, and other substances, including precursor ions, product ions, retention time, fragmentation voltage, collision energy, etc. (eg., MN-1 precursor 198.1 m/z, product 180.1 m/z, retention 25 ms, fragmentation voltage 76 V, collision energy 6 V, etc.).
Raw Data Preprocessing
Raw LC-MS/MS data were converted to mzML format using ProteoWizard and processed with XCMS for peak detection, retention time alignment, and correction. Peaks with missing rates >50% within any group were excluded. To impute the remaining missing values, a hybrid strategy was applied: if >50% values were missing for a given metabolite, the minimum value divided by 5 was used; otherwise, K-nearest neighbor (KNN) imputation was applied.
Support vector regression (SVR) was employed to correct for peak area variations and mitigate systemic errors such as instrument drift. Metabolite identification was performed using an in-house reference library supplemented with public databases (eg., KEGG, HMDB), with a match score ≥0.5 and a coefficient of variation (CV) <0.3 in quality control (QC) samples as selection criteria. Positive and negative mode data were merged, and the metabolite with the highest identification confidence and lowest CV was retained.16
Statistics Analysis
Multivariate and univariate statistical analyses were conducted using R software (v4.1.2). Principal component analysis (PCA) was performed using the prcomp function, and orthogonal partial least squares discriminant analysis (OPLS-DA) was conducted using the MetaboAnalystR package. To assess model robustness and avoid overfitting, 200 permutation tests were applied, and parameters such as R2X, R2Y, and Q2 were calculated.17
Differentially expressed metabolites were identified using a combination of univariate analysis (Student’s t-test or ANOVA for group comparisons, with P < 0.05 considered significant), variable importance in projection (VIP > 1 from OPLS-DA), and fold-change thresholds.18 Linear regression analysis was used to explore the relationship between metabolite levels and group classification. False discovery rate (FDR) adjustment was performed for multiple testing correction to reduce false positives and improve the specificity of differential metabolites.
For targeted metabolomics validation, SPSS (v26.0; IBM Corp., Armonk, NY, USA) was used. Independent sample t-tests (with equal and unequal variance assumptions) were applied to evaluate concentration differences in key catecholamines (eg., adrenaline, nicotinamide mononucleotide, norepinephrine, dopamine) between CKD and healthy control groups. Pearson correlation analyses were conducted to assess associations between selected metabolite concentrations and clinical groupings. A two-tailed P < 0.05 was considered statistically significant. These analyses provided quantitative support for identifying and validating key metabolic biomarkers involved in CKD pathophysiology.
Results
Sample Grouping
This study analyzed 65 human serum samples categorized into two groups based on clinical status: healthy controls (n=30, with a 1:1 male-to-female ratio) and patients with chronic kidney disease (CKD) (n=35). The healthy control group consisted of individuals with normal renal function (estimated Glomerular Filtration Rate, eGFR, 90–100 mL/min/1.73 m2), verified by standard blood and urine tests. Of the 35 CKD patients with complete clinical information, 27 were male and 8 were female. The mean eGFR was 12.77 ± 5.81 mL/min/1.73 m2 (range: 4.00–29.00, CKD stages 4–5). The age range was 40–90 years in the control group and 41–90 years (mean age: 67.7 years) in the CKD group. Mean body weight in the CKD group was 67.81 ± 13.87 kg. Mean systolic blood pressure was 153.77 ± 12.5 mmHg and mean diastolic blood pressure was 77.63 ± 8.1 mmHg in the CKD group, while the control group had a mean systolic blood pressure of 122.5 ± 10.2 mmHg and mean diastolic blood pressure of 74.8 ± 7.5 mmHg. Some patients showed obvious deviations from the mean blood pressure, which may be related to the high prevalence of hypertension in CKD patients. The detailed clinical and demographic characteristics of the study participants are summarized in Table 1.
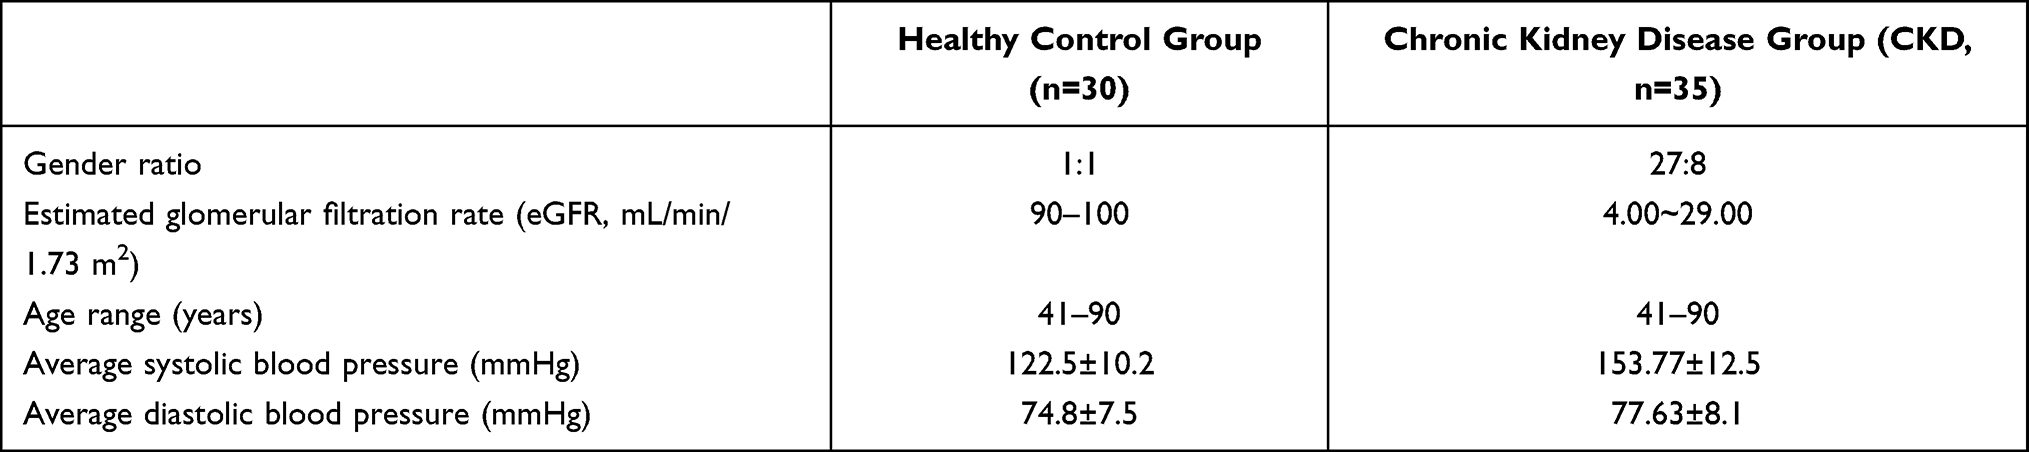 |
Table 1 Clinical and Demographic Characteristics of the Study Participants |
CKD patients presented with structural or functional abnormities persisting for more than 3 months, normally showing proteinuria, hematuuria, and clinical symptoms such as fatigue, backpain and nocturia.
Serum Metabolomics Profiling and Metabolite Identification
For untargeted metabolomics analysis, a total of 1,426 metabolites were investigated across all samples, with 831 in positive ion mode (T3_positive) and 595 in negative ion mode (T3_negative). With tandem mass spectrometry, a total of 1,246 metabolites were successfully identified. Differential expression metabolite analysis revealed 397 different metabolites between CKD and controls (216 up-regulated and 181 down-regulated), indicating substantial alterations in metabolic networks in the disease state.
The results of LC-MS/MS for untargeted metabolomics were investigated by unsupervised principal component analysis (PCA), showing distinct separation between the CKD and control groups, with PC1 accounting for 14.31% of the total variance and PC2 explaining 11.50%. Total ion current (TIC) overlays for quality control (QC) samples and Pearson correlation coefficients >0.98 demonstrated high consistency. Also, 75% of the metabolites had a coefficient of variation (CV) <0.3, confirming high reproducibility and stability of the dataset.
Further analysis using orthogonal partial least squares discriminant analysis (OPLS-DA) reinforced the differences between the CKD group and the control group. The model exhibited robust performance, with R2Y = 0.991 and Q2 = 0.949, demonstrating high model fitting and predictive capability (Figure 1). Based on variable importance projection (VIP > 1) and statistical significance (P < 0.05), 397 differentially expressed metabolites were identified between CKD and the controls, involving 216 up-regulated metabolites (eg., creatinine, phenylacetylglutamine) and 181 down-regulated metabolites (eg., L-tryptophan, bilirubin) (Figure 2). Visualization results from volcano plots and hierarchical clustering heatmaps revealed distinct group-specific expression patterns, such as elevated choline levels in the CKD group, whereas L-tryptophan was enriched in the control group (Figure 3).
 |
Figure 1 PCA score plot of the distribution of metabolomic profiles from PLA2R (green dots), control groups and CKD. |
 |
Figure 2 Volcano plot of differential metabolites between CKD and control groups. |
 |
Figure 3 Heatmap of differential metabolite clustering. |
Metabolic Pathway Enrichment and Functional Annotation
Results of KEGG pathway analysis indicated that the differential metabolic expression pathways were enriched in phenylalanine metabolism, arginine and proline metabolism, and glutathione metabolism (Figure 4). It is worth noting that 107 metabolites were mapped to the general “metabolic pathway” category (ko01100), suggesting a broad disruption of the metabolic network. Differential abundance (DA) scores showed a general trend of upregulation in the arginine and proline metabolism pathways (Figure 5). Complementary annotation from Human Metabolome Database (HMDB) proved that differentially expressed metabolites were associated with disease-related pathways such as sulphate metabolism and glutathione metabolism (Figure 6). Metabolic set enrichment analysis (MSEA) also confirmed their strong correlation with diabetes, ageing, and creatine deficiency (Figure 7).
 |
Figure 4 KEGG enrichment map of differential metabolite pathways for all groups. |
 |
Figure 5 Differential abundance score plot of metabolism pathways. |
 |
Figure 6 HMDB functional annotation map for enriched pathways. |
 |
Figure 7 MSEA enrichment analysis chart. |
Differential Metabolites and Pathway Enrichment in CKD
This study employed untargeted metabolomics to characterize the serum metabolic profiles of patients with chronic kidney disease. The functional enrichment analysis of differentially expressed metabolites and their potential involvement in disease-related pathophysiological mechanisms was conducted. A total of 397 differentially expressed metabolites were proved to be differentially expressed between the CKD and control groups, including significantly upregulated creatinine and phenylalanine glutamine. The accumulation of these metabolites was likely to elucidate impaired renal clearance and disrupted metabolic waste excretion due to kidney dysfunction.
KEGG pathway enrichment analysis revealed that differentially expressed metabolites in CKD were significantly enriched in five major pathways.19 Phenylalanine metabolism, classified under amino acid metabolism, involves the degradation and conversion of phenylalanine to tyrosine and phenylpyruvate.20 Arginine and proline metabolism, also within amino acid metabolism, covers arginine synthesis and degradation through the urea cycle as well as proline conversion, processes closely related to nitrogen metabolism and oxidative stress regulation. Glutathione metabolism, classified under general metabolic pathways, includes the synthesis of glutathione from glutamate, cysteine, and glycine, together with its redox cycling between reduced and oxidized forms, thereby maintaining antioxidant defense. Porphyrin metabolism, belonging to cofactor and vitamin metabolism, involves heme synthesis and degradation, including bilirubin formation, with direct links to iron utilization and anemia. Finally, tyrosine metabolism, another branch of amino acid metabolism, encompasses the conversion of tyrosine to neurotransmitters such as dopamine and epinephrine as well as melanin synthesis.21 Together, these enrichment results underscore the disruption of amino acid and redox-related pathways as central metabolic features in CKD progression.
Targeted Analysis of Catecholamines: Adrenaline and Nicotinamide Mononucleotide as Candidate Biomarkers
In addition to global metabolomic profiling, the targeted analysis enabled this study to evaluate the clinical relevance of catecholamines in CKD. In Figure 8, notable differences in catecholamine concentrations were observed between healthy individuals and CKD patients, particularly for the distribution of epinephrine and nicotinamide mononucleotide (NMN). Independent sample t-tests (Table 2) indicated statistically significant differences in the serum concentrations of epinephrine and NMN between these two groups under both equal and unequal variance assumptions (P < 0.05 for both). In contrast, no significant differences were found for norepinephrine, dopamine, methoxynorepinephrine, or 3-methoxytyramine (P > 0.05). This suggested that increased concentration of epinephrine and NMN could be involved in the pathological process of CKD. However, specific mechanisms for metabolites contribute to disease development remain uncovered and require further studies on broader metabolic pathways.
 |
Table 2 Independent Sample t-Test for Catecholamines Between CKD and Control Groups |
 |
Figure 8 Differences in the concentration of catecholamines between control and CKD groups. |
Correlation and Mechanistic Implications of Key Metabolites in CKD Pathophysiology
The Pearson correlation coefficient shown in Table 3 and Table 4 between adrenaline levels in healthy individuals (n=30) and CKD patients (n=34) was −0.109 (two-tailed P = 0.575 > 0.05), while the correlation for NMN was −0.098 (two-tailed P = 0.608 > 0.05), indicating that the concentration changes of these two metabolic compounds between two groups were not significantly correlated to be directly involved in CKD progression via simple linear analysis. However, previous studies have shown that adrenaline, as a sympathetic neurotransmitter, is closely associated with activation of the renin–angiotensin system, potentially contributing to increased vascular resistance and hypertension in CKD. Similarly, NMN, a key precursor in NAD⁺ biosynthesis, may serve as an indicator of altered renal energy metabolism when its levels are dysregulated.
 |
Table 3 Pearson Correlation of Adrenaline Levels in Healthy Individuals and CKD Patients (r = −0.109; p = 0.575) |
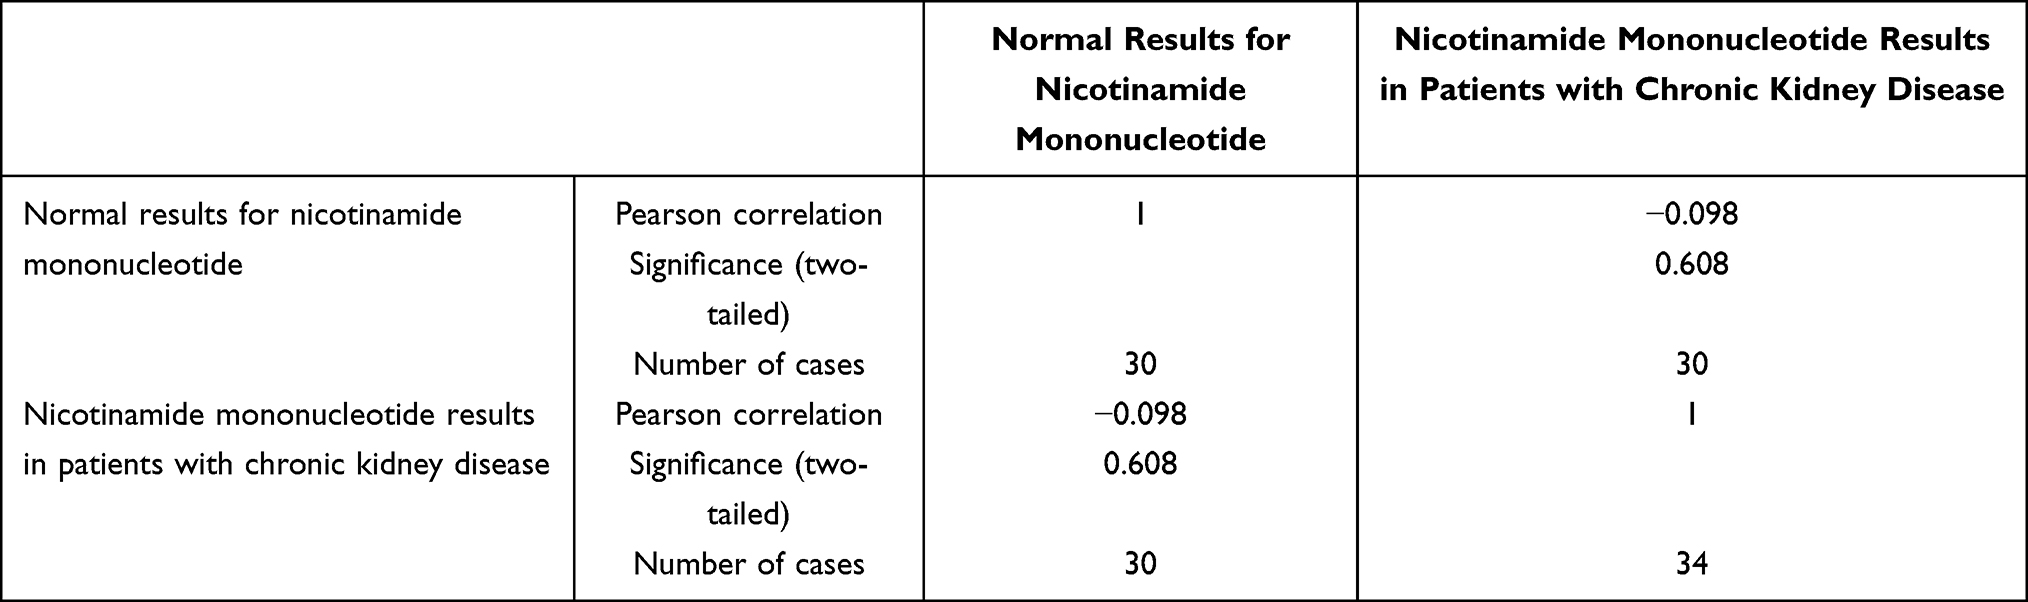 |
Table 4 Pearson Correlation of Nicotinamide Mononucleotide Levels in Healthy Individuals and CKD Patients (r = −0.098; p = 0.608) |
Discussion
Despite extensive research on CKD, limited research has been conducted on CKD combined with hypertension from a metabolomics perspective. Therefore, in this study, an untargeted LC-MS metabolomics method was used to analyze serum profiles from CKD patients and healthy controls, aiming to elucidate potential molecular mechanisms underlying CKD complicated by hypertension.
KEGG pathway enrichment analysis revealed that differentially expressed metabolites in patients with chronic kidney disease (CKD) are significantly enriched in 5 core pathways, which are detailed as follows:
Phenylalanine metabolism: This pathway primarily involves the degradation and conversion of phenylalanine, including the conversion of phenylalanine to tyrosine (catalyzed by phenylalanine hydroxylase) and the metabolic branch of phenylalanine to phenylpyruvate under abnormal conditions (eg., in cases of phenylalanine metabolic disorders). In CKD, the kidney’s ability to uptake and metabolize phenylalanine decreases, which may lead to its accumulation in the body. Meanwhile, the synthesis of tyrosine is reduced, thereby affecting the subsequent synthesis of neurotransmitters, thyroid hormones, and other substances.22
Arginine and proline metabolism: It encompasses the synthesis and degradation of arginine (which completes ammonia detoxification and excretion through the urea cycle) and the conversion process of proline (eg., the interconversion between proline and glutamic acid).23 This pathway is directly related to the balance of nitrogen metabolism in the body.24 In CKD, the function of the urea cycle is impaired, and arginine metabolic disorders may lead to ammonia accumulation and nitrogen excretion dysfunction.25 Additionally, abnormal proline metabolism can affect the regulation of oxidative stress (eg., proline derivatives participate in antioxidant reactions), exacerbating oxidative damage to the kidneys.26
Glutathione metabolism: Glutathione (GSH) is synthesized using glutamic acid, cysteine, and glycine as raw materials. Through the action of glutathione reductase and glutathione peroxidase, the redox cycle between reduced glutathione (GSH) and oxidized glutathione (GSSG) is realized.27 Glutathione is an important antioxidant in the body.28 In CKD, the disorder of this pathway leads to a decline in the kidney’s antioxidant defense capacity, aggravating renal tissue damage mediated by reactive oxygen species (ROS).19
Porphyrin metabolism: Its core processes are the synthesis of heme (starting from glycine and succinyl-CoA, generating heme through multiple enzymatic reactions)29 and the degradation of heme (heme decomposes into bilirubin, iron ions, etc.).,30 which is directly related to iron utilization and storage. CKD patients often experience abnormal porphyrin metabolism due to insufficient secretion of renal erythropoietin and iron utilization disorders,31 which in turn induces renal anemia. Moreover, bilirubin metabolic disorders may further increase the detoxification burden on the kidneys.32
Tyrosine metabolism: It includes the conversion of tyrosine to neurotransmitters (such as dopamine and adrenaline, catalyzed by tyrosine hydroxylase, dopa decarboxylase, etc.) and the synthesis process of tyrosine to melanin. In CKD, tyrosine metabolic disorders not only affect nervous system signal transmission33 (eg., abnormal sympathetic nerve activity) but may also cause the accumulation of metabolic intermediates (such as p-hydroxyphenylpyruvate), further increasing the renal metabolic burden and tissue damage.
In summary, these enrichment results indicate that amino acid metabolic disorders and imbalances in redox-related pathways are core metabolic characteristics during the progression of CKD. They also provide key directions for understanding the pathogenesis of CKD (such as nitrogen accumulation, oxidative stress, and renal anemia) and developing targeted intervention strategies (such as supplementing glutathione precursors and regulating amino acid metabolism).
Significant alterations in phenylalanine metabolism suggested that amino acid metabolic disorders were possible to facilitate impaired excretion of metabolic waste in CKD.34 Dysregulation of arginine and proline metabolisms also confirmed that metabolic dysfunction in renal energy metabolism and vascular function can accelerate the progression of CKD.35 This is consistent with previous study that CKD patients exhibit reduced renal uptake of phenylalanine, leading to decreased tyrosine synthesis and subsequently lower plasma tyrosine levels.36 The increasing phenylalanine levels were positively related to the risk of incident CKD, allowing its potential as a biomarker for this disease. Similarly, Rhee, E.et al evidenced that abnormalities in amino acid metabolites (eg., phenylalanine) are independent predictors from traditional risk factors of CKD, with elevated plasma phenylalanine levels strongly associated with renal impairment.37 Consequently, abnormalities in amino acid metabolic pathways in CKD patients emphasized their key role in CKD pathophysiology.
It is worth noting that, from the metabolomic analysis, the disruption of glutathione metabolism in CKD group was detected, particularly in patients with hypertension. While this pathway was originally involved in cardiovascular diseases, results of our study showed the possibility that glutathione metabolism was also a critical indicator for patients with CKD and hypertension. To further validate the specific biomarkers from untargeted metabolomic analysis, the target analysis of catecholamines showed significant differences in epinephrine and NMN levels in CKD patients compared to healthy controls. Results of target metabolomics provided essential evidence for the involvement of metabolic dysregulation in CKD pathogenesis. Metabolomic analysis identified specific metabolic pathways that are significantly dysregulated in CKD, indicating glutathione metabolism, especially in the presence of hypertension comorbidity, emerging as a pathway of great importance.
Adrenaline regulates blood pressure through sympathetic activation and vascular resistance.38 Our targeted analysis suggests a potential link between catecholamine metabolism and hypertension in CKD.39 The identified metabolic pathways and biomarkers (adrenaline, NMN) may serve as potential indicators for CKD progression.
Several limitations were also along with this study. First, the sample size of this research was relatively small, and patients across all CKD stages were not included, limiting the comprehensive collection of stage-dependent metabolic changes. Second, as this was a single-center study, potential regional bias may affect generalizability, and external validation is warranted. Future studies should involve larger, longitudinal cohorts to investigate dynamic changes in adrenaline, NMN, and other metabolites across CKD stages.40 Moreover, integrative metabolic network analyses are needed to delineate upstream regulatory mechanisms and downstream consequences of metabolic dysregulation, thereby enhancing mechanistic understanding and biomarker discovery.
Conclusions
A comprehensive characterization of serum metabolomic alterations in chronic kidney disease (CKD) was investigated by using a non-targeted LC–MS-based approach with catecholamine analysis. A total of 1,426 metabolites were detected, with 1,246 confidently identified, revealing distinct metabolic signatures and pathway perturbations between the CKD group and healthy controls. KEGG pathway enrichment highlighted significant dysregulation in amino acid metabolism, especially for phenylalanine, arginine, proline metabolism and glutathione metabolism, suggesting widespread metabolic network disruption. From the results of identified metabolites, adrenaline and NMN with significant intergroup differences emerged as potential candidate biomarkers for CKD. Although no direct linear correlation with disease progression was observed, their known physiological roles suggest possible involvement in altered renal energy metabolism, sympathetic nervous system activation, and hypertension in CKD.41 The identified metabolic signatures provide mechanistic insights into CKD, and their potential applications in early diagnosis, disease monitoring, and therapeutic development. Future studies also required to validate biomarkers in larger, longitudinal cohorts and explore their mechanistic roles through multi-omics integration.
Human Ethics Approval and Consent to Participate Declaration
The study was conducted in accordance with the Declaration of Helsinki and approved by the Institutional Review Board of Shanghai Pudong New Area Zhoupu Hospital (Affiliated Zhoupu Hospital of Shanghai University of Health Sciences) (protocol code 2025-C-168-E01 and date of approval 2025-07-08). All patients signed an informed consent approved by the Institutional Review Board.
Data Sharing Statement
The raw data supporting the conclusions of this article will be made available by the corresponding authors upon reasonable request, without undue restriction.
Acknowledgments
The authors would like to thank the Department of Laboratory Medicine, Shanghai University of Health Sciences Affiliated Zhoupu Hospital, Shanghai, China, for its support.
Author Contributions
All authors made a significant contribution to the work reported, whether that is in the conception, study design, execution, acquisition of data, analysis and interpretation, or in all these areas; took part in drafting, revising or critically reviewing the article; gave final approval of the version to be published; have agreed on the journal to which the article has been submitted; and agree to be accountable for all aspects of the work.
Funding
This research was funded by the General Program of Shanghai Pudong New Area Health Commission (No. PW2022A-19).
Disclosure
The authors declare no conflicts of interest in this work.
References
1. Levey AS, Coresh J, Bolton K, et al. K/DOQI clinical practice guidelines for chronic kidney disease: evaluation, classification, and stratification. Am J Kidney Dis. 2002;39(2 SUPPL. 1):i–ii+S1–16.
2. Chen Y, Li J, Wang L, Liu Y. Aromatic compounds from Dendrobium aphyllum. Biochem Syst Ecol. 2008;36(5–6):458–460. doi:10.1016/j.bse.2007.11.004
3. Sarnak MJ, Levey AS, Schoolwerth AC, et al. Kidney disease as a risk factor for development of cardiovascular disease: a statement from the American heart association councils on kidney in cardiovascular disease, high blood pressure research, clinical cardiology, and epidemiology and prevention. Circulation. 2003;108(17):2154–2169. doi:10.1161/01.CIR.0000095676.90936.80
4. Brandenburg VM, Saritas T. Chronic kidney disease—state of either “too much” or “too little”. Nutrients. 2023;15(7):1587. doi:10.3390/nu15071587
5. Cozzolino M, Gentile G, Mazzaferro S, Brancaccio D, Ruggenenti P, Remuzzi G. Blood pressure, proteinuria, and phosphate as risk factors for progressive kidney disease: a hypothesis. Am J Kidney Dis. 2013;62(5):984–992. doi:10.1053/j.ajkd.2013.02.379
6. Tektonidou MG. Antiphospholipid syndrome nephropathy: from pathogenesis to treatment. Front Immunol. 2018;9:1181. doi:10.3389/fimmu.2018.01181
7. Dunn WB, Broadhurst DI, Atherton HJ, Goodacre R, Griffin JL. Systems level studies of mammalian metabolomes: the roles of mass spectrometry and nuclear magnetic resonance spectroscopy. Chem Soc Rev. 2011;40(1):387–426. doi:10.1039/B906712B
8. Sarmad S, Viant MR, Dunn WB, et al. A proposed framework to evaluate the quality and reliability of targeted metabolomics assays from the UK consortium on metabolic phenotyping (MAP/UK). Nat Protocols. 2023;18(4):1017–1027. doi:10.1038/s41596-022-00801-8
9. Sekula P, Goek O-N, Quaye L, et al. A metabolome-wide association study of kidney function and disease in the general population. J Am Soc Nephrol. 2016;27(4):1175–1188. doi:10.1681/ASN.2014111099
10. Shah VO, Townsend RR, Feldman HI, Pappan KL, Kensicki E, Vander Jagt DL. Plasma metabolomic profiles in different stages of CKD. Clin J Am Soc Nephrol. 2013;8(3):363–370. doi:10.2215/CJN.05540512
11. Tan R, Ou S, Kang T, et al. Altered serum metabolome associated with vascular calcification developed from CKD and the critical pathways. Front Cardiovascu Med. 2023;10:1114528. doi:10.3389/fcvm.2023.1114528
12. Goek O-N, Döring A, Gieger C, et al. Serum metabolite concentrations and decreased GFR in the general population. Am J Kidney Dis. 2012;60(2):197–206. doi:10.1053/j.ajkd.2012.01.014
13. Baillargeon KR, Murray LP, Deraney RN, Mace CR. High-yielding separation and collection of plasma from whole blood using passive filtration. Anal Chem. 2020;92(24):16245–16252. doi:10.1021/acs.analchem.0c04127
14. Miler M, Nikolac Gabaj N, Culej J, Unic A, Vrtaric A, Milevoj Kopcinovic L. Integrity of serum samples is changed by modified centrifugation conditions. Clin Chem Laboratory Med. 2019;57(12):1882–1887. doi:10.1515/cclm-2019-0244
15. Fu R, Sheng M, Yang C, et al. A simple and sensitive LC-MS/MS method for determination of doxylamine in human plasma and its application in a bioequivalence study in healthy Chinese volunteers. J Pharmaceu Biomed Analysis. 2022;220:114984. doi:10.1016/j.jpba.2022.114984
16. Viant MR, Kurland IJ, Jones MR, Dunn WB. How close are we to complete annotation of metabolomes? Curr Opin Chem Biol. 2017;36:64–69. doi:10.1016/j.cbpa.2017.01.001
17. Stevens GJ, Deese AJ, Robertson DG. The application of metabonomics as an early in vivo toxicity screen. Metabonomic Toxicity Assess. 2005;211–240.
18. Knol MGE, Wulfmeyer VC, Müller R-U, Rinschen MM. Amino acid metabolism in kidney health and disease. Nat Rev Nephrol. 2024;20(12):771–788. doi:10.1038/s41581-024-00872-8
19. Chen D-Q, Cao G, Chen H, et al. Gene and protein expressions and metabolomics exhibit activated redox signaling and wnt/β-catenin pathway are associated with metabolite dysfunction in patients with chronic kidney disease. Redox Biol. 2017;12:505–521. doi:10.1016/j.redox.2017.03.017
20. Yamaguchi Y, Zampino M, Moaddel R, et al. Plasma metabolites associated with chronic kidney disease and renal function in adults from the baltimore longitudinal study of aging. Metabolomics. 2021;17(1):9. doi:10.1007/s11306-020-01762-3
21. Gan L, Wang L, Li W, Zhang Y, Xu B. Metabolomic profile of secondary hyperparathyroidism in patients with chronic kidney disease stages 3–5 not receiving dialysis. Front Endocrinol. 2024;15:1406690. doi:10.3389/fendo.2024.1406690
22. Rhee EP, Clish CB, Wenger J, et al. Metabolomics of chronic kidney disease progression: a case-control analysis in the chronic renal insufficiency cohort study. Am J Nephrol. 2016;43(5):366–374. doi:10.1159/000446484
23. Jeong B, Shah MA, Roh E, Kim K, Park I, Bae T. Staphylococcus aureus does not synthesize arginine from proline under physiological conditions. J Bacteriol. 2022;204(6):e00018–22. doi:10.1128/jb.00018-22
24. Wang X, Liu Y, Li W, et al. OsNRT1.1B-OsCNGC14/16-Ca 2+ -OsNLP3 pathway: phosphorylation-mediated maintenance of nitrogen homeostasis. Adv Sci. 2025;12(43):e07919. doi:10.1002/advs.202507919
25. Hu Y, Jiang W, Remuzzi G. Mannose and glycine: metabolites with potentially causal implications in chronic kidney disease pathogenesis. PLoS One. 2024;19(2):e0298729. doi:10.1371/journal.pone.0298729
26. Zhao S, Kamran M, Rizwan M, et al. Regulation of proline metabolism, AsA-GSH cycle, cadmium uptake and subcellular distribution in Brassica napus L. under the effect of nano-silicon. Environ Pollut. 2023;335:122321. doi:10.1016/j.envpol.2023.122321
27. Santos LO, Silva PGP, Lemos Junior WJF, de Oliveira VS, Anschau A. Glutathione production by Saccharomyces cerevisiae: current state and perspectives. Appl Microbiol Biotechnol. 2022;106(5–6):1879–1894. doi:10.1007/s00253-022-11826-0
28. Yao M, Ge W, Zhou Q, et al. Exogenous glutathione alleviates chilling injury in postharvest bell pepper by modulating the ascorbate-glutathione (AsA-GSH) cycle. Food Chem. 2021;352:129458. doi:10.1016/j.foodchem.2021.129458
29. Astner I, Schulze JO, Van den Heuvel J, Jahn D, Schubert W-D, Heinz DW. Crystal structure of 5-aminolevulinate synthase, the first enzyme of heme biosynthesis, and its link to XLSA in humans. EMBO J. 2005;24(18):3166–3177. doi:10.1038/sj.emboj.7600792
30. Drummond GS. Control of heme metabolism by synthetic Metalloporphyrinsa. Ann NY Acad Sci. 1987;514(1):87–95. doi:10.1111/j.1749-6632.1987.tb48764.x
31. Pallet N, Karras A, Thervet E, Gouya L, Karim Z, Puy H. Porphyria and kidney diseases. Clin Kidney J. 2018;11(2):191–197. doi:10.1093/ckj/sfx146
32. Cochat P. Primary hyperoxaluria type 1. Kidney Int. 1999;55(6):2533–2547. doi:10.1046/j.1523-1755.1999.00477.x
33. Harzandi A, Lee S, Bidkhori G, et al. Acute kidney injury leading to CKD is associated with a persistence of metabolic dysfunction and hypertriglyceridemia. Iscience. 2021;24(2):102046. doi:10.1016/j.isci.2021.102046
34. Van der Niepen P, Allein S, Verbeelen D. Muscle metabolism in uremia and the effect of amino acid supplementation. Nephron. 1998;79(4):387–398. doi:10.1159/000045083
35. Morris CR, Vichinsky EP, Singer ST. Pulmonary hypertension in thalassemia: association with hemolysis, arginine metabolism dysregulation, and a hypercoagulable state. Adv Pulm Hypertens. 2007;6(1):31–38. doi:10.21693/1933-088X-6.1.31
36. Thévenot EA, Roux A, Xu Y, Ezan E, Junot C. Analysis of the human adult urinary metabolome variations with age, body mass index, and gender by implementing a comprehensive workflow for univariate and OPLS statistical analyses. J proteome res. 2015;14(8):3322–3335. doi:10.1021/acs.jproteome.5b00354
37. Rhee EP, Clish CB, Ghorbani A, et al. A combined epidemiologic and metabolomic approach improves CKD prediction. J Am Soc Nephrol. 2013;24(8):1330–1338. doi:10.1681/ASN.2012101006
38. Esler M. Sympathetic nervous system moves toward center stage in cardiovascular medicine: from Thomas Willis to resistant hypertension. Hypertension. 2014;63(3):e25–e32. doi:10.1161/HYPERTENSIONAHA.113.02439
39. Golafshan F, Shafieyoon M. Hypertension and chronic kidney disease; a mutual relationship. J Renal Injury Prev. 2024;13(3):e32277–e32277. doi:10.34172/jrip.2024.32277
40. Liang L, Rasmussen M-LH, Piening B, et al. Metabolic dynamics and prediction of gestational age and time to delivery in pregnant women. Cell. 2020;181(7):1680–1692.e15. doi:10.1016/j.cell.2020.05.002
41. Bishop NC, Burton JO, Graham-Brown MPM, Stensel DJ, Viana JL, Watson EL. Exercise and chronic kidney disease: potential mechanisms underlying the physiological benefits. Nat Rev Nephrol. 2023;19(4):244–256. doi:10.1038/s41581-022-00675-9
 © 2026 The Author(s). This work is published and licensed by Dove Medical Press Limited. The
full terms of this license are available at https://www.dovepress.com/terms
and incorporate the Creative Commons Attribution
- Non Commercial (unported, 4.0) License.
By accessing the work you hereby accept the Terms. Non-commercial uses of the work are permitted
without any further permission from Dove Medical Press Limited, provided the work is properly
attributed. For permission for commercial use of this work, please see paragraphs 4.2 and 5 of our Terms.
© 2026 The Author(s). This work is published and licensed by Dove Medical Press Limited. The
full terms of this license are available at https://www.dovepress.com/terms
and incorporate the Creative Commons Attribution
- Non Commercial (unported, 4.0) License.
By accessing the work you hereby accept the Terms. Non-commercial uses of the work are permitted
without any further permission from Dove Medical Press Limited, provided the work is properly
attributed. For permission for commercial use of this work, please see paragraphs 4.2 and 5 of our Terms.
Recommended articles
Clinical Efficacy, Safety, Tolerability, and Real-World Data of Patiromer for the Treatment of Hyperkalemia
Colbert G, Sannapaneni S, Lerma EV
Drug, Healthcare and Patient Safety 2022, 14:87-96
Published Date: 14 July 2022
Acute Helicobacter pylori Infection Prevalence Among Renal Failure Patients and Its Potential Roles with Other Chronic Diseases: A Retrospective Cohort Study
Alhoufie ST, Ibrahim NA, Alhhazmi AA, Makhdoom HM, Ali HM, Hemeg HA, Almutawif YA, Mahallawi WH, Alfarouk KO
Infection and Drug Resistance 2022, 15:6589-6599
Published Date: 10 November 2022
Prevalence and Factors Associated with Albuminuria Screening Among High-Risk Adults in Saudi Arabia: A Retrospective Cross-Sectional Study
Albekery MA, Alnuhait M, Alhomoud IS, Alhussain K, Alkulaib MK, Alanazi GM, Alshaikh ZF, Alibrahim FS, Alburayman KY, Alhajji GH, Almalki BA, Aldossary IF, Al Turki L, Almulhim A
International Journal of Nephrology and Renovascular Disease 2026, 19:580140
Published Date: 6 March 2026