")
Back to Journals » Diabetes, Metabolic Syndrome and Obesity » Volume 16
Serum Lipoprotein(a) and High-Density Lipoprotein Cholesterol Associate with Diabetic Nephropathy: Evidence from Machine Learning Perspectives
Authors Gao RH, Liu B, Yang Y, Ran R, Zhou Y, Liu SM
Received 20 February 2023
Accepted for publication 10 May 2023
Published 22 June 2023 Volume 2023:16 Pages 1847—1858
DOI https://doi.org/10.2147/DMSO.S409410
Checked for plagiarism Yes
Review by Single anonymous peer review
Peer reviewer comments 3
Editor who approved publication: Professor Gian Paolo Fadini
Rui-Huan Gao,1,* Boyang Liu,2,* Ying Yang,1 Ruoxi Ran,1 Yidan Zhou,1,* Song-Mei Liu1,*
1Department of Clinical Laboratory, Zhongnan Hospital of Wuhan University, Wuhan, Hubei Province, 430071, People’s Republic of China; 2Department of Computer Science and Engineering, Michigan State University, East Lansing, MI, USA
*These authors contributed equally to this work
Correspondence: Song-Mei Liu; Yidan Zhou, Zhongnan Hospital of Wuhan University, 169 Donghu Road, Wuhan, Hubei Province, 430071, People’s Republic of China, Email [email protected]; [email protected]
Purpose: Diabetic nephropathy (DN) is a common complication of type 2 diabetes mellitus (T2DM) that significantly impacts the quality of life for affected patients. Dyslipidemia is a known risk factor for developing cardiovascular complications in T2DM patients. However, the association between serum lipoprotein(a) (Lp(a)) and high-density lipoprotein cholesterol (HDL-C) with DN requires further investigation.
Patients and Methods: For this cross-sectional study, we randomly selected T2DM patients with nephropathy (DN, n = 211) and T2DM patients without nephropathy (T2DM, n = 217) from a cohort of 142,611 patients based on predefined inclusion and exclusion criteria. We collected clinical data from the patients to identify potential risk factors for DN using binary logistic regression and machine learning. After obtaining the feature importance score of clinical indicators by building a random forest classifier, we examined the correlations between Lp(a), HDL-C and the top 10 indicators. Finally, we trained decision tree models with top 10 features using training data and evaluated their performance with independent testing data.
Results: Compared to the T2DM group, the DN group had significantly higher serum levels of Lp(a) (p < 0.001) and lower levels of HDL-C (p = 0.028). Lp(a) was identified as a risk factor for DN, while HDL-C was found to be protective. We identified the top 10 indicators that were associated with Lp(a) and/or HDL-C, including urinary albumin (uALB), uALB to creatinine ratio (uACR), cystatin C, creatinine, urinary ɑ1-microglobulin, estimated glomerular filtration rate (eGFR), urinary β 2-microglobulin, urea nitrogen, superoxide dismutase and fibrinogen. The decision tree models trained using the top 10 features and with uALB at a cut-off value of 31.1 mg/L showed an average area under the receiver operating characteristic curve (AUC) of 0.874, with an AUC range of 0.870 to 0.890.
Conclusion: Our findings indicate that serum Lp(a) and HDL-C are associated with DN and we have provided a decision tree model with uALB as a predictor for DN.
Keywords: type 2 diabetes mellitus, diabetic nephropathy, high density lipoprotein cholesterol, lipoprotein(a), machine learning
Introduction
Diabetic nephropathy (DN) is the most common complication of diabetes, characterized by renal microangiopathy, and it occurs in approximately 40% of type 2 diabetes mellitus (T2DM) patients.1 Currently, DN has become the major contributor of chronic renal disease (CKD), renal failure2 and end-stage renal disease.3 DN could also lead to an increase of cardiovascular mortality.4 The main manifestations of DN are the changes in renal morphology and function, such as decreased estimated glomerular filtration rate (eGFR) and renal hypertrophy at an early stage, proteinuria, decreased renal function, and even glomerulosclerosis at late stage.5 The American Diabetes Association recommends using eGFR as an indicator for the progression of CKD and divides CKD into five stages (eGFR <15, 15–30, 30–60, 60–90, >90 mL/min/1.73m2).6 Importantly, the presence of proteinuria, reduced eGFR and renal pathological damage can be used for clinical diagnosis of DN.6 Determining urinary albumin (uALB) is useful for identifying diabetic patients at risk for developing DN.7
Glucose metabolic disorders can cause renal microangiopathy, leading to changes in glomerular filtration rate and renal blood flow.8 Dyslipidemia promotes the subcutaneous deposition of lipids in blood vessels, leading to atherosclerosis and cardio-cerebrovascular diseases (ASCVD).9 Long-term hyperglycemia and lipid disorders in T2DM could lead to ASCVD.10,11 Patients with concomitant DM and ASCVD tend to have a higher risk of future cardiovascular events.12 Particularly, lipoprotein(a) (Lp(a)) is an independent risk factor for ASCVD.13 Lowering LDL cholesterol (<100 mg/dl) is an effective strategy for preventing the development of microalbuminuria and delaying the progression of nephropathy.14 A prospective study in Korean population demonstrated that Lp(a) is an independent risk factor for the progression of DN in T2DM patients with overt proteinuria.15 In addition, in patients with type 1 diabetes, abnormal lipids are closely related to the occurrence of proteinuria, affecting the occurrence of macrovascular and microvascular complications.16 These studies suggest that abnormal blood lipids are involved in the occurrence and development of DN. Lowering Lp(a) and increasing HDL-C therapy could prevent T2DM patients from developing DN.
Machine learning has been used for disease diagnosis/prediction, risk assessment and gene diagnosis. Olufemi Aromolaran et al applied machine learning for gene importance prediction.17 As a common classifier in machine learning, random forest has a good classification performance, and its built-in feature selection method could be used for molecular marker prediction.18 Early diagnosis of DN will be beneficial to the improvement of the life quality of T2DM patients. In this study, we aimed to obtain the feature importance score of clinical data from T2DM patients with or without nephropathy by building a random forest classifier, evaluate the correlations of the top 10 indicators with Lp(a) and HDL-C, and train a decision tree model for DN prediction.
Materials and Methods
Study Population
This cross-sectional study received approval from the Ethics Committee of Zhongnan Hospital, and it adhered to the provisions set forth in the Declaration of Helsinki. Informed consent was waived due to the following reasons: (1) participants’ information was de-identified to safeguard their privacy; (2) no direct contact was made with the participants to collect samples, therefore no additional risk was posed to them; (3) all participants were discharged, and the data were not required to be shared with them; and (4) all findings were intended for scientific exploration only and not for diagnosis or commercial purposes. Initially, we obtained data from 142,611 patients with available blood lipids or urinary microalbumin from Zhongnan Hospital of Wuhan University between August 2016 and November 2022. The inclusion criteria were age >18 years and referral for T2DM patients with or without nephropathy. The clinical diagnosis of the enrolled patients was based on the Standards of Medical Care in Diabetes-2020.6,19 The exclusion criteria included type 1 diabetes, gestational diabetes, other types of diabetes; acute complications of diabetes (such as diabetic ketoacidosis, etc.); other types of nephropathy, malignant tumors, and patients with missing clinical data.
Data Collection and Description
For this cross-sectional study, we randomly selected 211 cases of T2DM patients with nephropathy (DN group) and 217 cases of T2DM patients without nephropathy (T2DM group) from a cohort of 142,611 patients. We ensured gender and age matching between the two groups, and the process of selecting the study population is outlined in Supplementary Figure S1. We collected clinical information of 428 patients from their medical records using a standard protocol (Supplementary Table S1). The data were divided into training data (DN = 161, T2DM = 167; 57 features) and testing data (DN = 50, T2DM = 50; 57 features). The rate of missing values was 10.19%, with most of the missing data concentrated in height, weight, BMI, serum amyloid protein, urinary creatinine, urinary β2-microglobulin (ug/L) and urinary ɑ1-microglobulin (mg/L), which accounted for about 62% of the total missing data. The results of this study were based on training data, while the test data were only used for model testing.
Calculations of uACR and eGFR
The equations for calculating uACR:

uALB is urinary microalbumin (mg/L). uCREA is urinary creatinine (μmol /L).
eGFR were calculated from the 2012 Collaborative Equation for the Epidemiology of Chronic Kidney Disease (CKD-EPICYSC):

Scys is serum cystatin C (mg/dL), κ = 0.8, “min” indicates the minimum of Scys/κ or 1, and “max” indicates the maximum of Scys/κ or 1.20
Data Preprocessing
As there are missing values present in the dataset, we employ the K-nearest neighbor21 imputation method to fill in any gaps. This method utilizes the mean value of the top-k nearest neighbors to impute the missing value, ensuring that there are no missing values remaining in the dataset. Once the imputation process is complete, we divide the data into training and testing sets. We treat the value of K in K-nearest neighbor as a hyperparameter and conduct a hyperparameter search to identify the optimal value for our model. Our experiment finds that setting K = 5 yields the most accurate model predictions on the validation data. Thus, we will use K = 5 as our choice for K.
Building Predictive Decision Tree Models
In this study, our pipeline of building models was as follows:
- Extract the feature set X and corresponding label set Y from the training data, and construct a random forest classifier22 using the default parameters. Subsequently, calculate the feature importance scores.
- Sort the feature importance scores in descending order and choose the top 10 features based on their importance scores.
- Train the decision tree model using the top 10 features selected by random forest for better interpretability. We employed 5-fold cross-validation23 to partition the training data, with 80% of the data serving as the training set to build the tree model and 20% as the validation set to test the tree model performance. Successive halving search24,25 was used to tune the hyperparameters, and we selected the optimal hyperparameter based on the lowest averaged validation loss.
- Build the tree model on the entire training set using the best hyperparameters identified in step 3.
Evaluation Tree Model
We obtained the prediction of the tree model on the testing set, compared the predicted label and ground-truth label, and calculated the AUC score. We repeated the above process 10 times to ensure the stability of our results.
Statistical Analysis
All statistical analyses were performed by SPSS 25.0. The continuous variables of normal distribution were expressed as mean ± standard deviation ( ), and the continuous variables of skewed distribution were presented as median (25th-75th percentile). Student’s t-test, Mann–Whitney U-test or Kruskal–Wallis test was used to compare clinical parameters among groups. The Spearman’s rank correlation was applied for correlation evaluation. χ2 tests were used to compare frequencies between two groups. All statistical analysis was two-sided, and p value < 0.05 was considered statistically significant.
Results
Serum Lp(a) is Increased and HDL-C is Decreased in T2DM Patients with Nephropathy
The comparison of clinical data between T2DM group and DN group was presented in Supplementary Table S1. There was no difference in the distribution of age and sex, indicating that the effects of age and sex on lipid changes could be negligible. However, compared with T2DM group, the level of Lp(a) was increased and HDL-C was decreased in DN group (Figure 1A and B). There was no difference in cholesterol, triglyceride, low-density lipoprotein cholesterol, small dense low-density lipoprotein cholesterol, free fatty acid or phospholipid levels (Table 1). Taken together, the distinct features of lipid disorders between DN group and T2DM group are the changes of Lp(a), and HDL-C levels.
 |
Table 1 Serum Lipids Comparison of Type 2 Diabetes Mellitus Patients with or without Nephropathy |
 |
Figure 1 Increased Lp(a) and decreased HDL-C presenting a risk factor for DN. (A) The level of serum lipoprotein(a) in DN group was higher than that in T2DM group. (B) The level of serum HDL-C in DN group was lower than that in T2DM group. (C) The increase of eGFR was associated with the decline of Lp(a) level. (D) The increase of eGFR was associated with the elevation of HDL-C level. (E) Binary logistic regression analysis showed Lp(a) was a risk factor, while HDL-C was a protective factor for DN. (F) χ2 test showed the incidence of DN in the high-Lp(a) group was higher than that in the low-Lp(a) group (61.18% vs 37.75%). (G) χ2 test showed the incidence of DN in the high-HDL-C group was lower than that in the low-HDL-C group (43.48% vs 55.48%). *p < 0.05; **p< 0.01; ***p < 0.001. |
To investigate the difference of Lp(a) and HDL-C across various stages of CKD, T2DM patients with nephropathy were divided into three groups based on eGFR (<30, 30–60, >60 mL/min/1.73m2), due to the small number of patients with eGFR < 15 and eGFR >90. By Kruskal–Wallis H-test, we found that an increase of eGFR was associated with a decline in Lp(a) levels (Figure 1C), whereas an increase of eGFR was associated with elevation of HDL-C (Figure 1D).
Lp(a) is a Risk Factor, While HDL-C is a Protective Factor for DN
Binary logistic regression analysis (0 for T2DM group and 1 for DN group) was used to evaluate whether Lp(a) and HDL-C were the risk factors of DN. After adjusting age, sex, BMI, systolic blood pressure (SBP) and diastolic blood pressure (DBP), Lp(a) was found to be a risk factor for DN (OR = 1.005; 95% CI, 1.002–1.008), while HDL-C was a protective factor (OR = 0.225; 95% CI, 0.076–0.668) (Figure 1E). Then, based on the median of Lp(a), patients were divided into low-Lp(a) group (Lp(a) <64.30mg/L) and high-Lp(a) group (Lp(a) ≥64.30mg/L). Similarly, patients were divided into low-HDL-C group (HDL-C <0.97mmol/L) and high-HDL-C group (HDL-C ≥0.97mmol/L). χ2 test showed that the incidence of DN in the high-Lp(a) group (61.18%) was higher than that of the low-Lp(a) group (37.75%) (p < 0.001, Figure 1F), while the incidence of high-HDL-C group (43.48%) was lower than that of the low-HDL-C group (55.48%) (p = 0.033, Figure 1G).
Top 10 Indicators Ranking by the Feature Importance Score
As shown in Table 2, the feature importance score of 57 clinical parameters were obtained by building a random forest classifier. After ranking the feature importance score, the top 10 indicators were urinary albumin (uALB), uALB to creatinine ratio (uACR), cystatin C, creatinine, urinary ɑ1-microglobulin, eGFR, urinary β2-microglobulin, urea nitrogen, superoxide dismutase and fibrinogen. Of which, the top 8 feature indicators are well known for renal function evaluation in clinical practice.
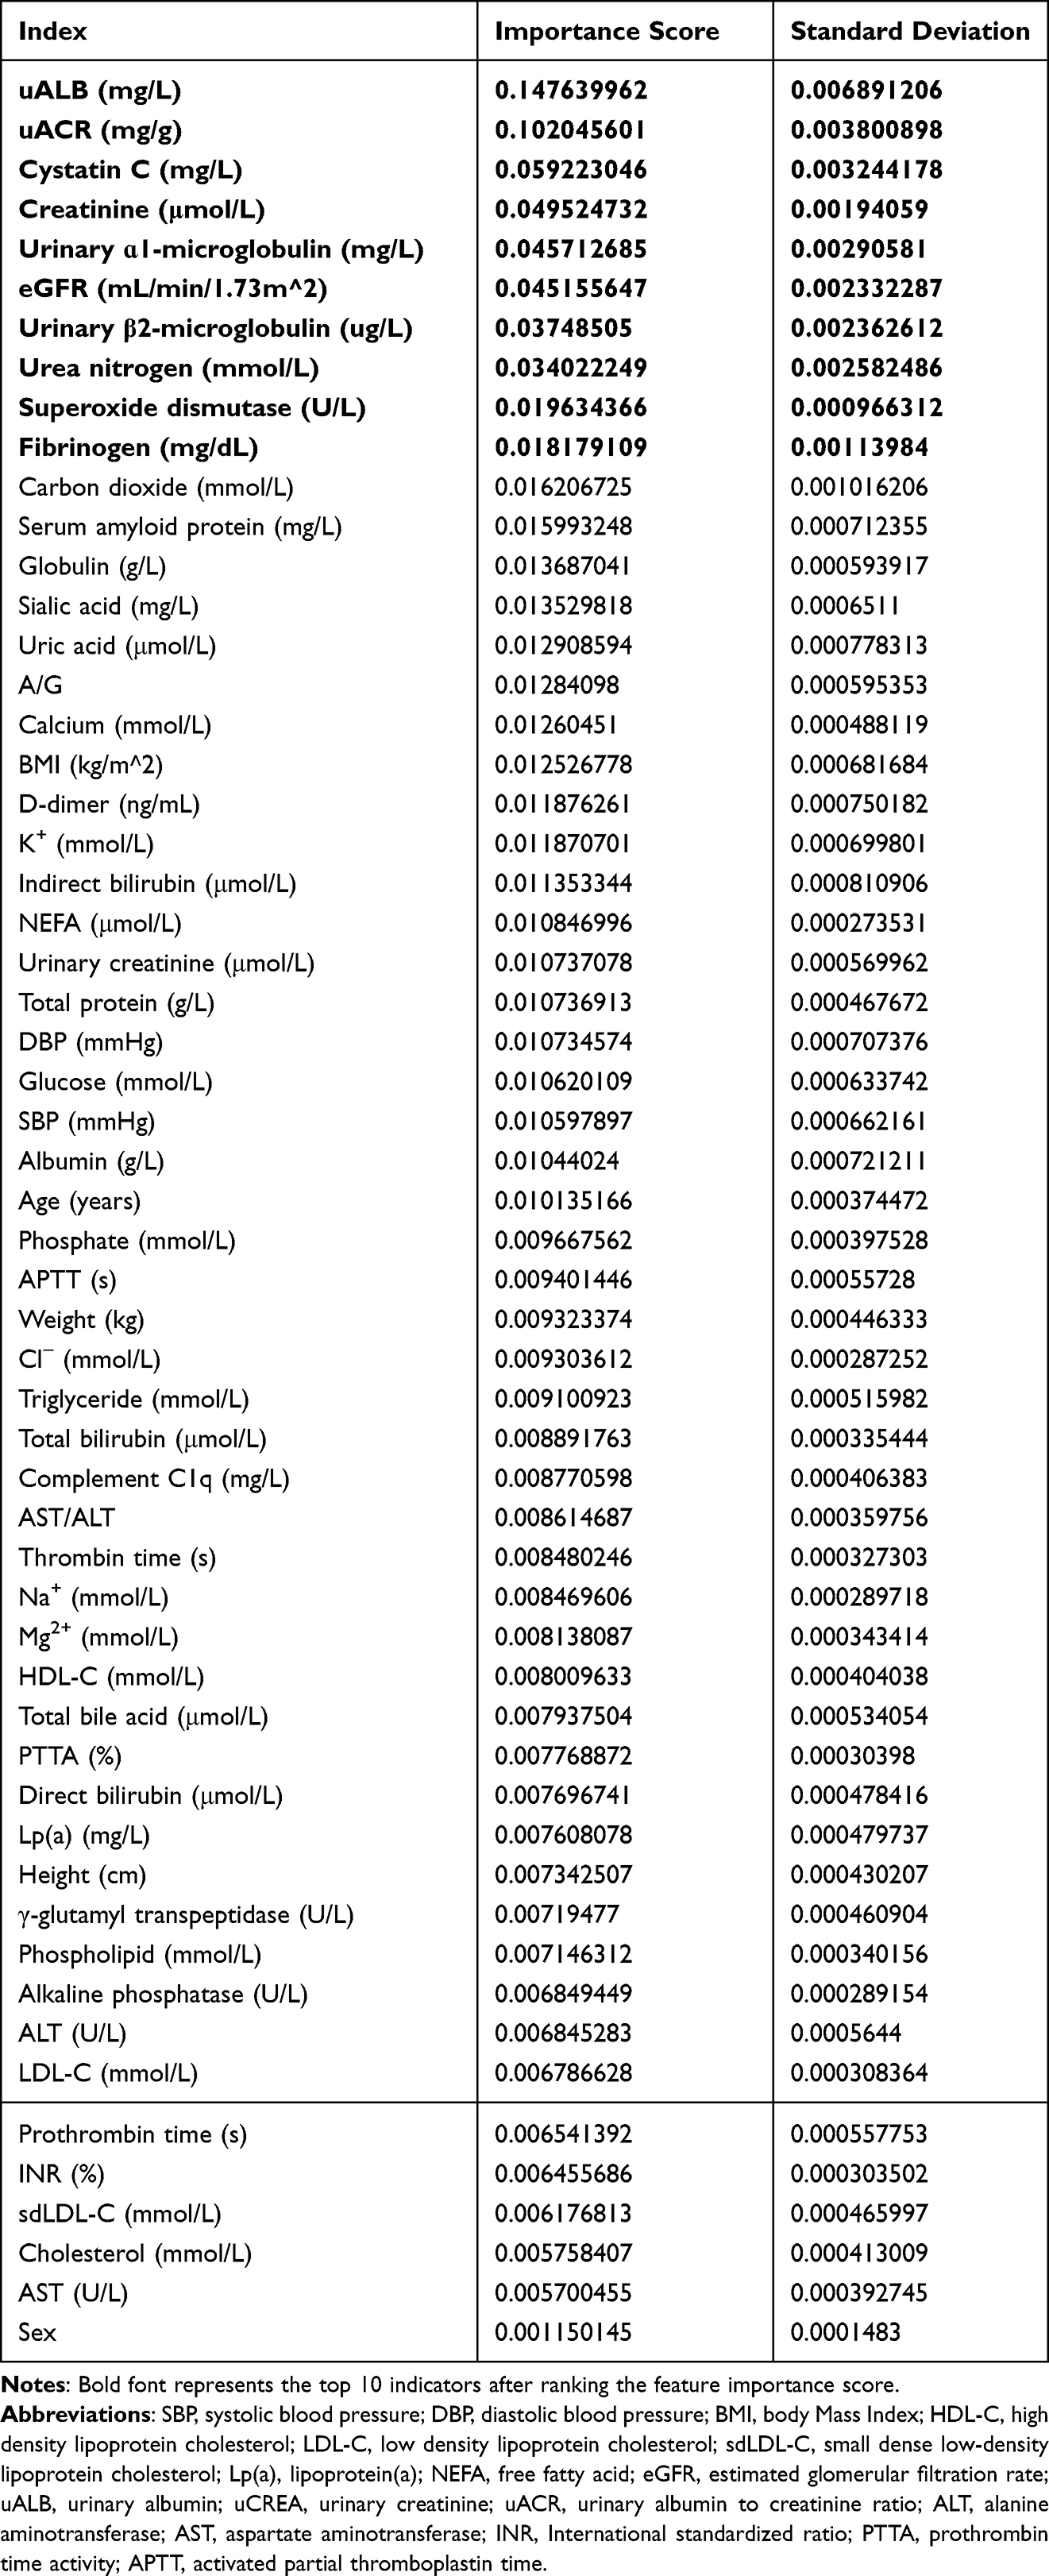 |
Table 2 Ranking of Index Importance |
Correlations Between Lp(a) and Top 10 Indicators
To evaluate whether Lp(a) was related to the top 10 indicators in DN, we performed Spearman’s rank correlation analysis. As illustrated in Figure 2, there were positive correlations between serum Lp(a) and uALB (r = 0.207, p = 0.001), uACR (r = 0.214, p = 0.006), cystatin C (r = 0.186, p = 0.001), urinary ɑ1-microglobulin (r = 0.209, p = 0.033), urinary β2-microglobulin (r = 0.208, p = 0.031), fibrinogen (r = 0.414, p < 0.001) and negative correlations between Lp(a) and eGFR (r = −0.201, p = 0.001) and superoxide dismutase (r = −0.286, p < 0.001). However, Lp(a) was not related to creatinine and urea nitrogen. In short, Lp(a) was related to 8 out of 10 indicators, suggesting that higher level of Lp(a) implicated poor renal function.
 |
Figure 2 Correlations between Lp(a) and top 10 indicators. Serum Lp(a) was positively correlated with uALB, uACR, cystatin C, urinary ɑ1-microglobulin, urinary β2-microglobulin and fibrinogen, while negatively correlated with eGFR and superoxide dismutase. Lp(a) was not related to creatinine and urea nitrogen. Abbreviations: uALB, urinary microalbumin; uACR, urinary albumin to creatinine ratio; r, related coefficient; p, p value. |
Correlations Between HDL-C and Top 10 Future Indicators
We then performed Spearman’s rank correlation analysis to explore the correlations between HDL-C and the top 10 future indicators. As shown in Figure 3, HDL-C was negatively correlated with uALB (r = −0.133, p = 0.027), uACR (r = −0.155, p = 0.041), cystatin C (r = −0.194, p = 0.001), and creatinine (r = −0.212, p < 0.001). In addition, HDL-C was positively correlated with eGFR (r = 0.240, p < 0.001) and superoxide dismutase (r = 0.165, p = 0.007). However, HDL-C was not related to urinary ɑ1-microglobulin, urinary β2-microglobulin, urea nitrogen and fibrinogen. Our data indicated that higher HDL-C is associated with better renal function.
 |
Figure 3 Correlations between HDL-C and top 10 indicators. Serum HDL-C was negatively correlated with uALB, uACR, cystatin C and creatinine. HDL-C was positively correlated with eGFR and superoxide dismutase. HDL-C was not related to urinary ɑ1-microglobulin, urinary β2-microglobulin, urea nitrogen and fibrinogen. Abbreviations: uALB, urinary microalbumin; uACR, urinary albumin to creatinine ratio; r, related coefficient; p, p value. |
Decision Tree Models for DN Prediction
As shown in Figure 4, the top-ranked index uALB showed robust performance for DN predication. The area under the receiver operating characteristic curve (AUC) of the decision tree models at cut-off value of 31.1mg/L ranged from 0.870 to 0.890, with an average AUC of 0.874.
 |
Figure 4 Decision tree models for DN prediction. Gini represents the purity of the node. Abbreviation: AUC, area under the receiver operating characteristic curve. |
Discussion
For the first time, we employed a combination of machine learning and correlation analysis to explore the links between Lp(a), HDL-C, and diabetic nephropathy. This led us to develop a decision tree model with uALB for predicting DN, which showed an AUC of 0.874 and a trained cut-off value that aligns with the clinical normal range (uALB <= 30 mg/L), providing a reliable and simple model for clinical DN prediction. Our data indicated that Lp(a) is a risk factor for DN, while HDL-C is a protective factor after controlling blood pressure. Furthermore, Lp(a) and HDL-C were associated with the top 10 indicators selected from 57 clinical parameters by feature selection with random forest classifier, emphasizing their clinical significance for assessing DN.
In line with previous reports,26 we found that higher levels of serum Lp(a) are associated with renal insufficiency in diabetes patients. For instance, Lp(a) was related to renal function indicators (uALB, uACR, eGFR, urea nitrogen, creatinine and cystatin C). However, the role of Lp(a) in the pathogenesis of DN remains unclear. Lp(a) can mediate inflammation, promote thrombosis and atherosclerotic plaque formation.27 Mechanically, Lp(a) induces endothelial cells to express adhesion molecules vascular cellular adhesion molecule-1, E-selectin and monocyte chemoattractant protein, promotes endothelial cell proliferation and foam cell formation, mediates plaque inflammation, inhibits the production of anti-atherosclerotic nitric oxide, promotes tissue factor-mediated thrombosis, and induces platelet activation.28 Oxidative stress and glomerular atherosclerosis mediated by Lp(a)-induced reactive oxygen metabolites also play important roles in the pathogenesis of DN.29–31 Interestingly, we observed a negative correlation between Lp(a) and superoxide dismutase activity, which is the first line of defense against reactive oxygen species-mediated damage.32
Lp(a) has been reported to inhibit the fibrinolytic system, leading to hypercoagulable state and renal damage.33 DN is related to changes in the coagulation system,34–36 and our results indicated that the hypercoagulable state in T2DM patients with nephropathy was related to Lp(a) (Supplementary Table S2). Lp(a) was positively correlated with blood fibrinogen and D-dimer, which significantly increased in T2DM patients with nephropathy. However, our data did not show any correlation between Lp(a) and creatinine. This can be attributed to the fact that the main determinant of Lp(a) is liver uptake, and the mechanism of regulating Lp(a) secretion by the kidney differs between individuals with impaired renal function and those with a normal to moderate decrease in renal clearance.37–39 Even under physiological conditions, the kidney accounts for only 1.3% of Lp(a) clearance.38
Low levels of HDL-C have been considered an independent risk factor for the development and progression of DN,40 and our results confirmed this. HDL-C has nephroprotective, anti-atherosclerotic, and anti-inflammatory effects.41,42 Our data revealed correlations between HDL-C and several renal function indicators, suggesting that low levels of HDL-C in T2DM patients with nephropathy are associated with poor renal function. Furthermore, HDL-C is involved in oxidative stress and regulates endothelial cell apoptosis, vascular smooth muscle, and platelet function.43,44 The regulation of HDL-C on endothelial cells is dependent on calcium homeostasis,43 and our results showed that the level of HDL-C was positively correlated with antioxidant levels and calcium levels (Supplementary Table S3).
There were still several limitations in this study. First, due to various therapeutic requirements of the patients, their diets, exercise and drug treatments could not be normalized, which prevented us from taking these factors into account in the current study. Second, although our correlation and machine learning data found connections between Lp(a), HDL-C and diabetic nephropathy, more direct causal evidence was lacking. Third, this was a retrospective and single-center study, therefore, a multicenter prospective study and mechanism investigations will be necessary in the future.
Conclusion
In summary, the increase of Lp(a) was a risk factor for DN, while the decrease of HDL-C was a protective factor. We reported serum Lp(a) and HDL-C related to the top 10 features of DN. We also provided a decision tree model for DN prediction, and uALB could be a reliable and easily detectable indicator.
Abbreviations
T2DM, Type 2 diabetes mellitus; DN, diabetic nephropathy; CKD, chronic renal disease; ASCVD, atherosclerosis and cardio-cerebrovascular diseases; Lp(a), lipoprotein(a); HDL-C, high-density lipoprotein cholesterol; LDL-C, low-density lipoprotein cholesterol; sdLDL-C, small dense low-density lipoprotein cholesterol; NEFA, free fatty acid; eGFR, estimated glomerular filtration rate; uALB, urinary albumin; uCREA, urinary creatinine; uACR, urinary albumin to creatinine ratio; BMI, body mass index; SBP, systolic blood pressure; DBP, diastolic blood pressure; ALT, alanine aminotransferase; AST, aspartate aminotransferase; INR, International standardized ratio; PTTA, Prothrombin time activity; APTT, activated partial Thromboplastin time.
Acknowledgments
We are indebted to all the participants for their dedicated and conscientious collaboration. Rui-Huan Gao and Boyang Liu are co-first authors for this study. Yidan Zhou and Song-Mei Liu are co-senior authors for this study.
Author Contributions
All authors made a significant contribution to the work reported, whether that is in the conception, study design, execution, acquisition of data, analysis and interpretation, or in all these areas; took part in drafting, revising or critically reviewing the article; gave final approval of the version to be published; have agreed on the journal to which the article has been submitted; and agree to be accountable for all aspects of the work.
Funding
We thank the financial support from the National Natural Science Foundation of China (81972009, 82172359) and Health Commission of Hubei Province Scientific Research Project (2019CFA018).
Disclosure
The authors declare no conflicts of interest in this work.
References
1. Umanath K, Lewis JB. Update on diabetic nephropathy: core curriculum 2018. Am J Kidn Dis. 2018;71(6):884–895. doi:10.1053/j.ajkd.2017.10.026
2. Rayego-Mateos S, Morgado-Pascual JL, Opazo-Ríos L, et al. Pathogenic pathways and therapeutic approaches targeting inflammation in diabetic nephropathy. Int J Mol Sci. 2020;21(11):3798. doi:10.3390/ijms21113798
3. Selby NM, Taal MW. An updated overview of diabetic nephropathy: diagnosis, prognosis, treatment goals and latest guidelines. Diabetes Obes Metab. 2020;22(Suppl 1):3–15. doi:10.1111/dom.14007
4. Li J, Albajrami O, Zhuo M, Hawley CE, Paik JM. Decision algorithm for prescribing SGLT2 Inhibitors and GLP-1 receptor agonists for diabetic kidney disease. Clin J Am Soc Nephrol. 2020;15(11):1678–1688. doi:10.2215/CJN.02690320
5. Alicic RZ, Rooney MT, Tuttle KR. Diabetic kidney disease: challenges, progress, and possibilities. Clin J Am Soc Nephrol. 2017;12(12):2032–2045. doi:10.2215/CJN.11491116
6. American Diabetes Association. Microvascular complications and foot care: standards of medical care in diabetes-2019. Diabe Care. 2019;42(Suppl 1):S124–s138. doi:10.2337/dc19-S011
7. Wheeler DC, Stefánsson BV, Jongs N, et al. Effects of dapagliflozin on major adverse kidney and cardiovascular events in patients with diabetic and non-diabetic chronic kidney disease: a prespecified analysis from the DAPA-CKD trial. Lancet Diabet Endocrinol. 2021;9(1):22–31. doi:10.1016/S2213-8587(20)30369-7
8. Tu C, Wang L, Wei L. The role of PKM2 in diabetic microangiopathy. Diabetes Meta Synd Obesity. 2022;15:1405–1412. doi:10.2147/DMSO.S366403
9. Michos ED, McEvoy JW, Blumenthal RS. Lipid management for the prevention of atherosclerotic cardiovascular disease. N Engl J Med. 2019;381(16):1557–1567. doi:10.1056/NEJMra1806939
10. Arnett DK, Blumenthal RS, Albert MA, et al. 2019 ACC/AHA guideline on the primary prevention of cardiovascular disease: executive summary: a report of the American College of Cardiology/American heart association task force on clinical practice guidelines. Circulation. 2019;140(11):e563–e595. doi:10.1161/CIR.0000000000000677
11. Deng X, Qin S, Chen Y, et al. B-RCA revealed circulating miR-33a/b associates with serum cholesterol in type 2 diabetes patients at high risk of ASCVD. Diabetes Res Clin Pract. 2018;140:191–199. doi:10.1016/j.diabres.2018.03.024
12. Lee YJ, Cho JY, You SC, et al. Moderate-intensity statin with ezetimibe vs. high-intensity statin in patients with diabetes and atherosclerotic cardiovascular disease in the RACING trial. Eur Heart J. 2023;44(11):972–983. doi:10.1093/eurheartj/ehac709
13. Mohammadi-Shemirani P, Chong M, Narula S, et al. Elevated Lipoprotein(a) and risk of atrial fibrillation: an observational and Mendelian randomization study. J Am Coll Cardiol. 2022;79(16):1579–1590. doi:10.1016/j.jacc.2022.02.018
14. Gross JL, de Azevedo MJ, Silveiro SP, Canani LH, Caramori ML, Zelmanovitz T. Diabetic nephropathy: diagnosis, prevention, and treatment. Diabe Care. 2005;28(1):164–176.
15. Chandni R, Ramamoorthy KP. Lipoprotein(a) in type 2 diabetic subjects and its relationship to diabetic microvascular complications. World J Diabetes. 2012;3(5):105–109. doi:10.4239/wjd.v3.i5.105
16. Chaturvedi N, Fuller JH, Taskinen MR. Differing associations of lipid and lipoprotein disturbances with the macrovascular and microvascular complications of type 1 diabetes. Diabe Care. 2001;24(12):2071–2077. doi:10.2337/diacare.24.12.2071
17. Aromolaran O, Aromolaran D, Isewon I, Oyelade J. Machine learning approach to gene essentiality prediction: a review. Brief Bioinform. 2021;22(5):bbab128.
18. Lin E, Lin CH, Lane HY. Prediction of functional outcomes of schizophrenia with genetic biomarkers using a bagging ensemble machine learning method with feature selection. Sci Rep. 2021;11(1):10179. doi:10.1038/s41598-021-89540-6
19. Care D. Classification and diagnosis of diabetes: standards of medical care in diabetes-2020. Diabe Care. 2020;43(Suppl 1):S14–s31. doi:10.2337/dc20-S002
20. Inker LA, Schmid CH, Tighiouart H, et al. Estimating glomerular filtration rate from serum creatinine and cystatin C. N Engl J Med. 2012;367(1):20–29. doi:10.1056/NEJMoa1114248
21. Troyanskaya O, Cantor M, Sherlock G, et al. Missing value estimation methods for DNA microarrays. Bioinformatics. 2001;17(6):520–525. doi:10.1093/bioinformatics/17.6.520
22. Breiman L. Random forests. Mach Learn. 2001;45(1):5–32. doi:10.1023/A:1010933404324
23. Stone MA. Cross-validatory choice and assessment of statistical predictions. J Royal Stat Soc. 1974;36(2):111–147.
24. Jamieson K, Talwalkar A. Non-stochastic best arm identification and hyperparameter optimization. Artif Intell Stat. 2016;51:240–248.
25. Li L, Jamieson K, DeSalvo G, Rostamizadeh A, Talwalkar A. Hyperband: a novel bandit-based approach to hyperparameter optimization. J Mach Learn Res. 2017;18(1):6765–6816.
26. Hermans MP, Ahn SA, Rousseau MF. The mixed benefit of low lipoprotein(a) in type 2 diabetes. Lipids Health Dis. 2017;16(1):171. doi:10.1186/s12944-017-0564-9
27. Ugovšek S, Šebeštjen M. Lipoprotein(a)-the crossroads of atherosclerosis, atherothrombosis and inflammation. Biomolecules. 2021;12(1):26. doi:10.3390/biom12010026
28. Boffa MB. Beyond fibrinolysis: the confounding role of Lp(a) in thrombosis. Atherosclerosis. 2022;349:72–81. doi:10.1016/j.atherosclerosis.2022.04.009
29. Hung CC, Tsai JC, Kuo HT, Chang JM, Hwang SJ, Chen HC. Dyslipoproteinemia and impairment of renal function in diabetic kidney disease: an analysis of animal studies, observational studies, and clinical trials. Rev Diabet Stud. 2013;10(2–3):110–120. doi:10.1900/RDS.2013.10.110
30. Piani F, Melena I, Tommerdahl KL, et al. Sex-related differences in diabetic kidney disease: a review on the mechanisms and potential therapeutic implications. J Diabetes Complications. 2021;35(4):107841. doi:10.1016/j.jdiacomp.2020.107841
31. Greiber S, Kreusel M, Pavenstädt H, Schollmeyer P, Wanner C. Lipoprotein(a) induces glomerular superoxide anion production. Nephrol Dialysis Tran. 1997;12(7):1330–1335. doi:10.1093/ndt/12.7.1330
32. Zhao H, Zhang R, Yan X, Fan K. Superoxide dismutase nanozymes: an emerging star for anti-oxidation. J Materials Chem B. 2021;9(35):6939–6957. doi:10.1039/D1TB00720C
33. Berg K. A new serum type system in man--The Ld system. Vox Sang. 1965;10(5):513–527. doi:10.1111/j.1423-0410.1965.tb01404.x
34. Alsharidah AS. Diabetes mellitus and diabetic nephropathy: a review of the literature on hemostatic changes in coagulation and thrombosis. Blood Res. 2022;57(2):101–105. doi:10.5045/br.2022.2021204
35. Goldberg RB. Cytokine and cytokine-like inflammation markers, endothelial dysfunction, and imbalanced coagulation in development of diabetes and its complications. J Clin Endocrinol Metab. 2009;94(9):3171–3182. doi:10.1210/jc.2008-2534
36. Pan L, Ye Y, Wo M, et al. Clinical significance of hemostatic parameters in the prediction for type 2 diabetes mellitus and diabetic nephropathy. Dis Markers. 2018;2018:5214376. doi:10.1155/2018/5214376
37. Cain WJ, Millar JS, Himebauch AS, et al. Lipoprotein [a] is cleared from the plasma primarily by the liver in a process mediated by apolipoprotein [a]. J Lipid Res. 2005;46(12):2681–2691. doi:10.1194/jlr.M500249-JLR200
38. Doucet C, Mooser V, Gonbert S, et al. Lipoprotein(a) in the nephrotic syndrome: molecular analysis of lipoprotein(a) and apolipoprotein(a) fragments in plasma and urine. J Am Soc Nephrol. 2000;11(3):507–513. doi:10.1681/ASN.V113507
39. Lippi G, Salvagno GL, Montagnana M, Targher G, Franchini M, Guidi GC. No correlation between lipoprotein(a) and biochemical markers of renal function in the general population. Arch Pathol Lab Med. 2008;132(9):1436–1438. doi:10.5858/2008-132-1436-NCBLAB
40. Molitch ME, DeFronzo RA, Franz MJ, Keane WF, Mogensen CE, Parving HH. Diabetic nephropathy. Diabe Care. 2003;26(1):S94–98.
41. Li X, Su T, Xiao H, et al. Association of the HDL-c Level with HsCRP, IL-6, U-NAG, RBP and Cys-C in Type 2 diabetes mellitus, hypertension, and chronic kidney disease: an epidemiological survey. Diabetes Meta Synd Obesity. 2020;13:3645–3654. doi:10.2147/DMSO.S265735
42. Lüscher TF, Landmesser U, von Eckardstein A, Fogelman AM. High-density lipoprotein: vascular protective effects, dysfunction, and potential as therapeutic target. Circ Res. 2014;114(1):171–182. doi:10.1161/CIRCRESAHA.114.300935
43. Mineo C, Shaul PW. Novel biological functions of high-density lipoprotein cholesterol. Circ Res. 2012;111(8):1079–1090. doi:10.1161/CIRCRESAHA.111.258673
44. Zewinger S, Drechsler C, Kleber ME, et al. Serum amyloid A: high-density lipoproteins interaction and cardiovascular risk. Eur Heart J. 2015;36(43):3007–3016. doi:10.1093/eurheartj/ehv352
 © 2023 The Author(s). This work is published and licensed by Dove Medical Press Limited. The full terms of this license are available at https://www.dovepress.com/terms.php and incorporate the Creative Commons Attribution - Non Commercial (unported, v3.0) License.
By accessing the work you hereby accept the Terms. Non-commercial uses of the work are permitted without any further permission from Dove Medical Press Limited, provided the work is properly attributed. For permission for commercial use of this work, please see paragraphs 4.2 and 5 of our Terms.
© 2023 The Author(s). This work is published and licensed by Dove Medical Press Limited. The full terms of this license are available at https://www.dovepress.com/terms.php and incorporate the Creative Commons Attribution - Non Commercial (unported, v3.0) License.
By accessing the work you hereby accept the Terms. Non-commercial uses of the work are permitted without any further permission from Dove Medical Press Limited, provided the work is properly attributed. For permission for commercial use of this work, please see paragraphs 4.2 and 5 of our Terms.