Back to Journals » Diabetes, Metabolic Syndrome and Obesity » Volume 16
Serum Fibroblast Growth Factor 21 Level After an Oral Fat Tolerance Test is Related to Postprandial Free Fatty Acid Level
Authors Li X ![]() , Zheng K, Gu W, Hou X, Guan Y, Liu L, Hou L, Geng J, Song G
, Zheng K, Gu W, Hou X, Guan Y, Liu L, Hou L, Geng J, Song G
Received 10 March 2023
Accepted for publication 25 May 2023
Published 1 June 2023 Volume 2023:16 Pages 1567—1576
DOI https://doi.org/10.2147/DMSO.S410457
Checked for plagiarism Yes
Review by Single anonymous peer review
Peer reviewer comments 2
Editor who approved publication: Professor Gian Paolo Fadini
Xiaolong Li,1– 3 Kunjie Zheng,1– 3 Wei Gu,1– 3 Xiaoyu Hou,1,3 Yunpeng Guan,1 Lifang Liu,1,3,4 Liping Hou,2 Jianlin Geng,2 Guangyao Song1,3
1Department of Internal Medicine, Hebei Medical University, Shijiazhuang, Hebei, People’s Republic of China; 2Department of Endocrinology, Harrison International Peace Hospital, Hengshui, Hebei, People’s Republic of China; 3Department of Endocrinology, Hebei General Hospital, Shijiazhuang, People’s Republic of China; 4Department of Endocrinology, Baoding First Central Hospital, Baoding, Hebei, People’s Republic of China
Correspondence: Guangyao Song, Tel +86-0311-8598-8556, Email [email protected]
Purpose: The relationship between blood lipids and fibroblast growth factor (FGF) 21 in the postprandial period remains unclear. To investigate this, we observed the changes in blood lipid levels after an oral fat tolerance test (OFTT) and examined the short-term effects on FGF21.
Patients and Methods: A total of 158 non-diabetic adult volunteers who underwent OFTT were randomly recruited from the Hebei General Hospital. Participants were stratified into three groups according to fasting and 4-h postprandial triglyceride levels: normal fat tolerance (NFT), impaired fat tolerance (IFT), and hypertriglyceridemia (HTG). Blood samples were collected at 2-h intervals for 6 h. Circulating total cholesterol levels, triglycerides, high-density lipoprotein-cholesterol, low-density lipoprotein-cholesterol, free fatty acids (FFA), and FGF21 were assessed.
Results: Fasting FGF21 levels increased progressively in the NFT, IFT, and HTG groups and were strongly correlated with FFA levels (r = 0.531, P < 0.001). During the OFTT, the FFA and FGF21 levels decreased and then increased after reaching a nadir at 2 and 4 h, respectively. After adjusting for potential risk factors, the FFA incremental area under the curve (iAUC) was an independent influencing factor of FGF21 iAUC (P = 0.005).
Conclusion: Fasting FGF21 levels showed a strong positive correlation with FFA. During OFTT, changes in FGF21 levels were closely associated with alterations in FFA exogenously changed by OFTT. Moreover, they were linearly related to each other. Therefore, the serum FGF21 level is positively correlated to the FFA level in the postprandial period.
Keywords: fibroblast growth factor 21, free fatty acid, lipids, dyslipidemia, postprandial state, oral fat tolerance test
Introduction
Fibroblast growth factor (FGF) 21 is a distinctive member of the FGF family that functions as a hormone-like factor. FGF21 is involved in numerous metabolic processes, including glucose and lipid metabolism, weight loss, and energy homeostasis.1–3 FGF21 levels are primarily regulated by nutritional stresses.4,5 Several studies have found that low-protein diets can stimulate FGF21 secretion.6,7 A more recent study has revealed that FGF21 can acutely respond to an oral glucose tolerance test.8 Due to the rise in fast-food diets, the amount of fat in our daily diet has increased, and high-fat diets have challenged metabolic pathways in recent years. A previous study reported that FGF21 levels in a healthy population showed a gradual upward trend after lipid infusion, which was associated with free fatty acids (FFA) levels.9 However, a recent study found that changes in FGF21 in nonalcoholic fatty liver disease after a high-fat diet was related to triglyceride-rich lipoproteins instead of FFA.10 Therefore, it is unclear which lipid profile components affect FGF21 secretion.
This study aimed to observe the changes in postprandial FGF21 and lipid levels after an oral fat tolerance test (OFTT) and analyze their relationship.
Materials and Methods
Study Sample
Non-diabetic adult volunteers (n=158) who underwent an OFTT between November 2018 and December 2019 were randomly recruited from Hebei General Hospital, as previously reported.11 Men and women aged between 18 and 65 years with a wide range of body mass indices (BMI, ≥18 kg/m2) were included. The ethics committee of Hebei General Hospital approved the research protocol, which conformed to the provision of the Declaration of Helsinki.
Exclusion Criteria
The exclusion criteria were as follows: vegetarian diet, heart disease, thyroid dysfunction, malignant tumors, digestive system diseases (liver, gallbladder, pancreas, or spleen diseases), acute and chronic blood diseases, kidney diseases, infectious diseases, psychosis, stroke in the past 3 months, pregnancy, use of related drugs (fish oil, contraceptives, hormone β receptor blockers, and diuretics), severe infection, a history of surgery, a history of trauma, and a weight change >3 kg. All participants underwent oral glucose tolerance testing (OGTT), and those with fasting blood glucose level ≥7.0 mmol/L or 2-h blood glucose level ≥ 11.1 mmol/L were excluded. Additionally, participants with fasting triglyceride levels > 5.0 mmol/L were excluded from this study to avoid extreme values that might have an excessive influence on the data.
Oral Fat Tolerance Testing
All participants underwent an OFTT. Before the OFTT, all participants received a unified standard meal for 1 week, and smoking and alcohol consumption were prohibited. The research group completed the high-fat diet formula in the OFTT with the assistance of professional nutritionists, referring to the Chinese Food Guide Pagoda. The test meal provided 1500 kcal, with fat (monounsaturated fatty acids: polyunsaturated fatty acids: saturated fatty acids = 2:2:1), carbohydrate, and protein content of 60%, 20%, and 20%, respectively. Consuming water and food after 22:00 h the day before the test was disallowed. Venous blood samples were collected at 8:00 h (0 h) for fasting measurements, and the participants were fed the test meal 10 min later. They were free to consume alcohol and did not smoke or perform acuteness activities. Blood samples were collected before and 2, 4, and 6 h after the participants consumed the test meal. After sampling in serum tubes, blood was immediately chilled on ice and centrifuged at 4°C. Subsequently, aliquots were immediately frozen at −80°C (Haier MDR-382E; Haier, Qingdao, China) until assayed.
Measurement of Anthropometric and Biochemical Parameters
The fasting blood glucose (FBG) level in the OGTT and the total cholesterol (TC), TG, FFA, high-density lipoprotein-cholesterol (HDL-C), and low-density lipoprotein-cholesterol (LDL-C) levels in the fasting state and 2, 4, and 6 h after the meal were measured using a biochemical analyzer (Hitachi 7600; Hitachi, Tokyo, Japan). In addition, the serum insulin (FINS) levels were measured by electrochemiluminescence. The serum FGF21 levels were measured using the immunoadsorption method with an enzyme-linked immunosorbent assay kit (Cat # DF2100, RRID: AB_2783729, R&D Systems, MN, USA) with intra- and inter-assay coefficients of variation of 2.9–3.5% and 5.2–10.9%, respectively.
Height, weight, waist circumference (WC), systolic blood pressure (SBP), and diastolic blood pressure (DBP) were measured by professional staff.
Insulin resistance was evaluated using the homeostatic model assessment for insulin resistance [(HOMA-IR) = FBG, mmol/L × FINS (mIU/L) / 22.5].12 BMI was calculated as the weight to height squared (kg/m2) ratio. The incremental area under the curves (iAUC) for TC (TC iAUC), TG (TG iAUC), FFA (FFA iAUC), HDL-C (HLD iAUC), LDL-C (LDL iAUC), and FGF21 (FGF21 iAUC) represent the increased area after the test meal consumption compared to the fasting level, which was calculated using the trapezoidal area method.
Definition of Hypertriglyceridemia
According to the 2016 Chinese Guidelines for the Prevention and Treatment of Adult Dyslipidemia, a fasting TG level ≥ 1.7 mmol/L is defined as fasting hypertriglyceridemia (HTG);13 According to the 2011 expert consensus, a postprandial 4-h TG level (4-h PTG) > 2.5 mmol/L is defined as postprandial hypertriglyceridemia (PHTG).14 Therefore, according to the fasting and 4-h PTG levels of the OFTT, the participants were divided into three groups with different levels of lipid metabolism: (i) the normal fat tolerance (NFT) group (fasting TG level < 1.7 mmol/L and 4-h PTG level ≤ 2.5 mmol/L); (ii) the impaired fat tolerance (IFT) group (fasting TG level < 1.7 mmol/L and 4-h PTG level > 2.5 mmol/L), which was the PHTG group; and (iii) the hypertriglyceridemia (HTG) group (1.7 mmol/L ≤ fasting TG level < 5 mmol/L).
Statistical Analysis
SPSS 26.0 (IBM Corp., Armonk, NY, USA) was used for statistical analysis. The chi-square test was applied to the classified data. Normally distributed data are expressed as mean ± standard deviation, and the non–normally distributed data are expressed as the median and interquartile interval (M [P25, P75]). Single-factor analysis of variance (ANOVA) was used to compare normally distributed data among the three groups, and the Bonferroni test was used for post-analysis. The Kruskal–Wallis H-test was applied to non-normal distributed data. Two-factor repeated measures ANOVA was used to evaluate the changes in parameters and indicators over time after a meal and the differences among the groups. Greenhouse–Geisser adjustment was used for correction, and Pearson correlation was used to analyze the strength of correlations between normal distribution variables. The relationships between the FGF21 iAUC and lipid iAUCs was evaluated using multiple linear regression analysis. The fasting and postprandial FGF21 levels were non-normal distributions and needed to be converted to logarithm FGF21 (LgFGF21) before statistical analysis. We presented our data using iAUCs to depict the effect of OFTT, excluding discrepancies in the baseline levels among the groups. FGF21 iAUC was negative; therefore, its absolute value was used for the statistical analysis. Statistical significance was set at P < 0.05 (two-tailed).
Results
Basic Characteristics
The demographic and clinical characteristics of the participants are presented in Table 1. All participants consumed a high-fat test meal that was well-tolerated during OFTT. A total of 158 participants were included in this study. Of these, 52, 50, and 56 participants were in the NFT, IFT, and HTG groups, respectively. There were no significant differences in sex or age among the three groups (P > 0.05). The median FGF21 levels in all participants were 270.13 pg/mL. FGF21 levels gradually increased in the three groups, with the HTG group showing significantly higher levels than the IFT and NFG groups did (both P < 0.05). Among the three groups, the BMI; WC; SBP; DBP; TC, TG, FFA, LDL-C, FBG, and FINS levels; and HOMA-IR gradually increased (P < 0.05), whereas HDL-C levels gradually decreased (P < 0.05). The WC; SBP; DBP; TC, TG, FFA, and FINS levels; and HOMA-IR were significantly higher in the HTG group than in the IFT group (all P < 0.05). Furthermore, the BMI; WC; SBP; DBP; TC, TG, FFA, LDL-C, FBG, and FINS levels, and HOMA-IR were significantly higher (all P < 0.05) in the HTG group than in the NFT group, whereas HDL-C levels were significantly lower (P < 0.05). There were significant differences in the BMI; DBP; and TG and FFA levels between the IFT and NFT groups (all P < 0.05; Table 1). These data showed that the characteristics of participants with dyslipidemia included being overweight and having higher insulin resistance and FGF21 levels.
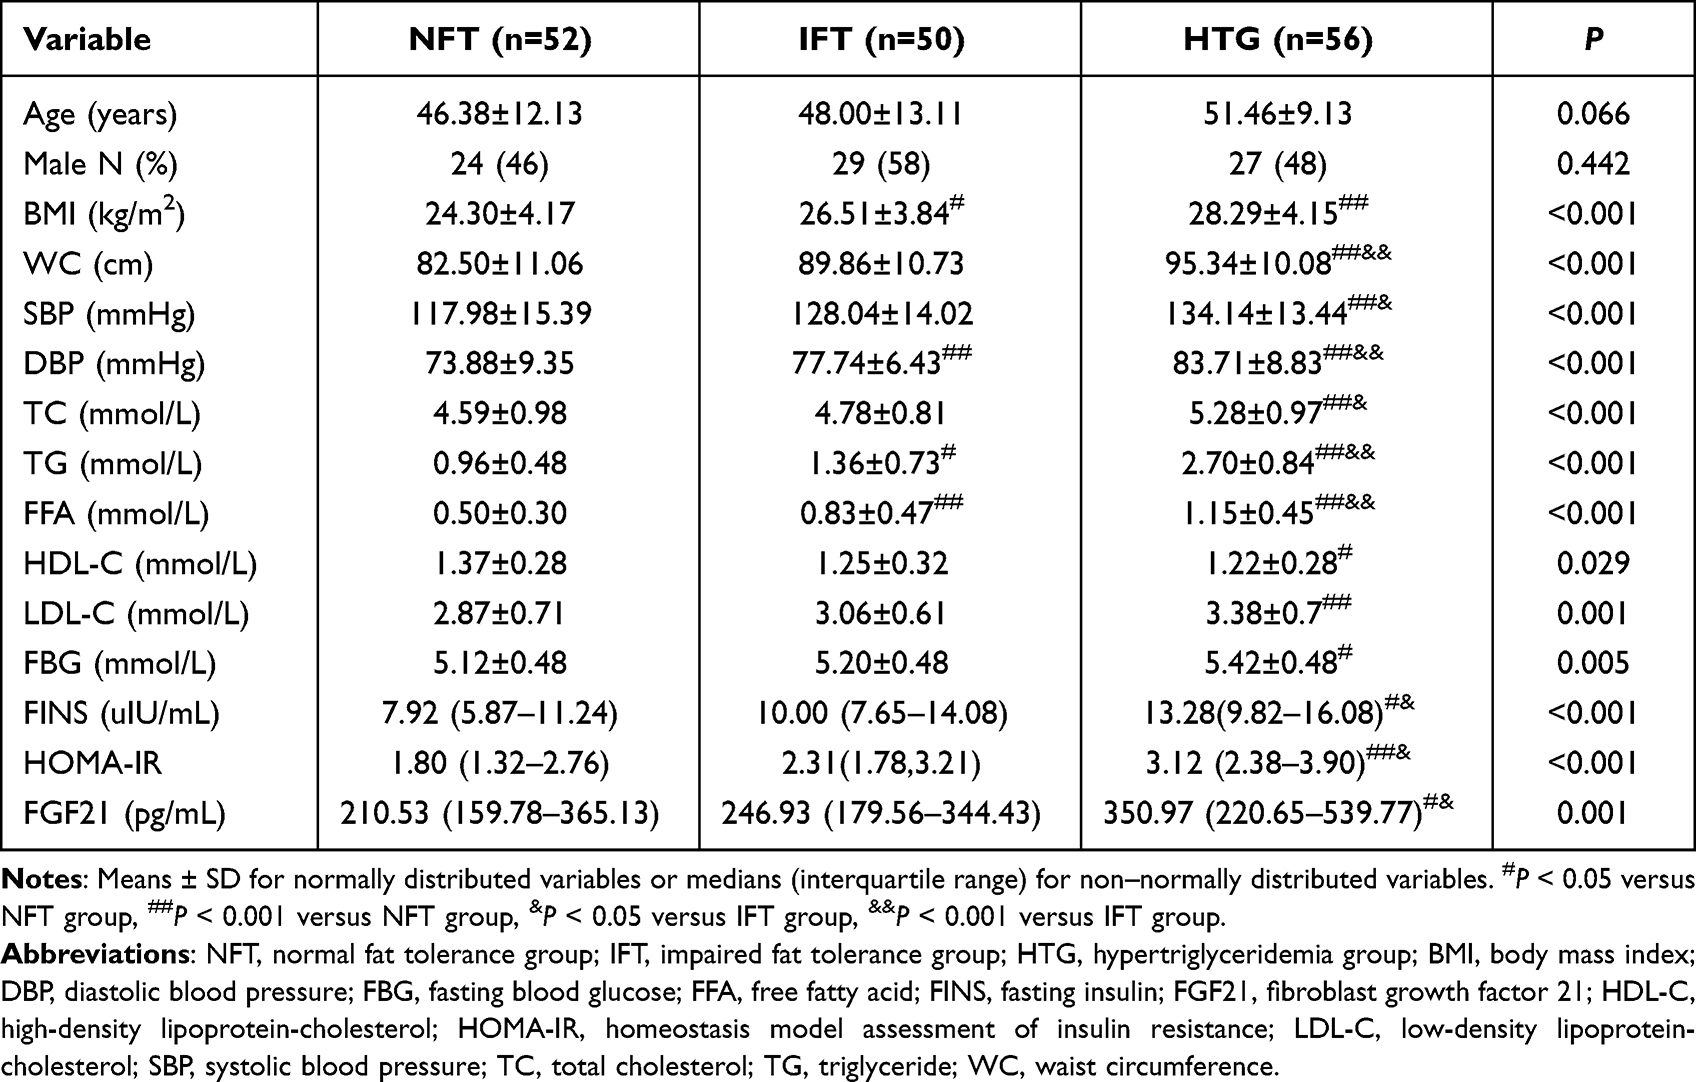 |
Table 1 Comparison of Basic Characteristics of Participants in the Three Study Groups |
Relationship of Clinical Parameters with the Fasting Lipid and Fasting FGF21 Levels
Correlation analysis showed that FGF21 levels were positively correlated with BMI; WC; FINS level; HOMA-IR; and FFA (r = 0.557, P < 0.001) and TG (r = 0.256, P = 0.001) levels. After adjusting for age, BMI, and WC, FGF21 levels were positively correlated with FFA and TG levels (r = 0.531, P < 0.001 and r = 0.209, P = 0.009, respectively). After further adjustment for SBP and DBP, FGF21 levels remained positively correlated with FFA and TG levels; however, it had the strongest correlation with FFA levels (r = 0.531, P < 0.001 and r = 0.193, P = 0.017, respectively) (Figure 1).
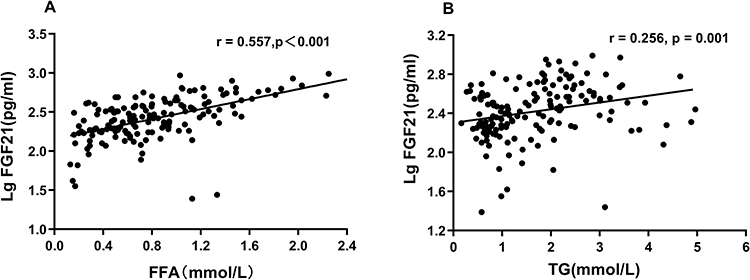 |
Figure 1 Relationship between fasting FFA, TG, and fasting LgFGF21. (A) Correlation between fasting FFA and LgFGF21. (B) Correlation between fasting TG and LgFGF21. Abbreviations: FFA, free fatty acid; FGF21, fibroblast growth factor 21; TG, triglyceride. |
Comparison of FFA and FGF21 Levels During the OFTT
During the OFTT, FFA levels showed a similar biphasic trend of decreasing and then increasing in the three groups. It reached its lowest point at 2 h (vs 0 h, P < 0.001) and then gradually increased and exceeded the baseline level at 6 h (vs 0 h, P < 0.001). Compared with the baseline level, there were significant differences at all times in the three groups (all P < 0.001). FFA levels in the HTG group were significantly higher than those in the NFT and IFT groups at 0, 2, and 4 h (P < 0.05). Similarly, FFA levels in the IFG group were significantly higher than those in the NFT group at 0, 2, and 4 h (P < 0.05). However, only the HTG group showed significantly higher FFA levels than the NFT group at 6 h (P < 0.05) (Table 2, Figure 2A).
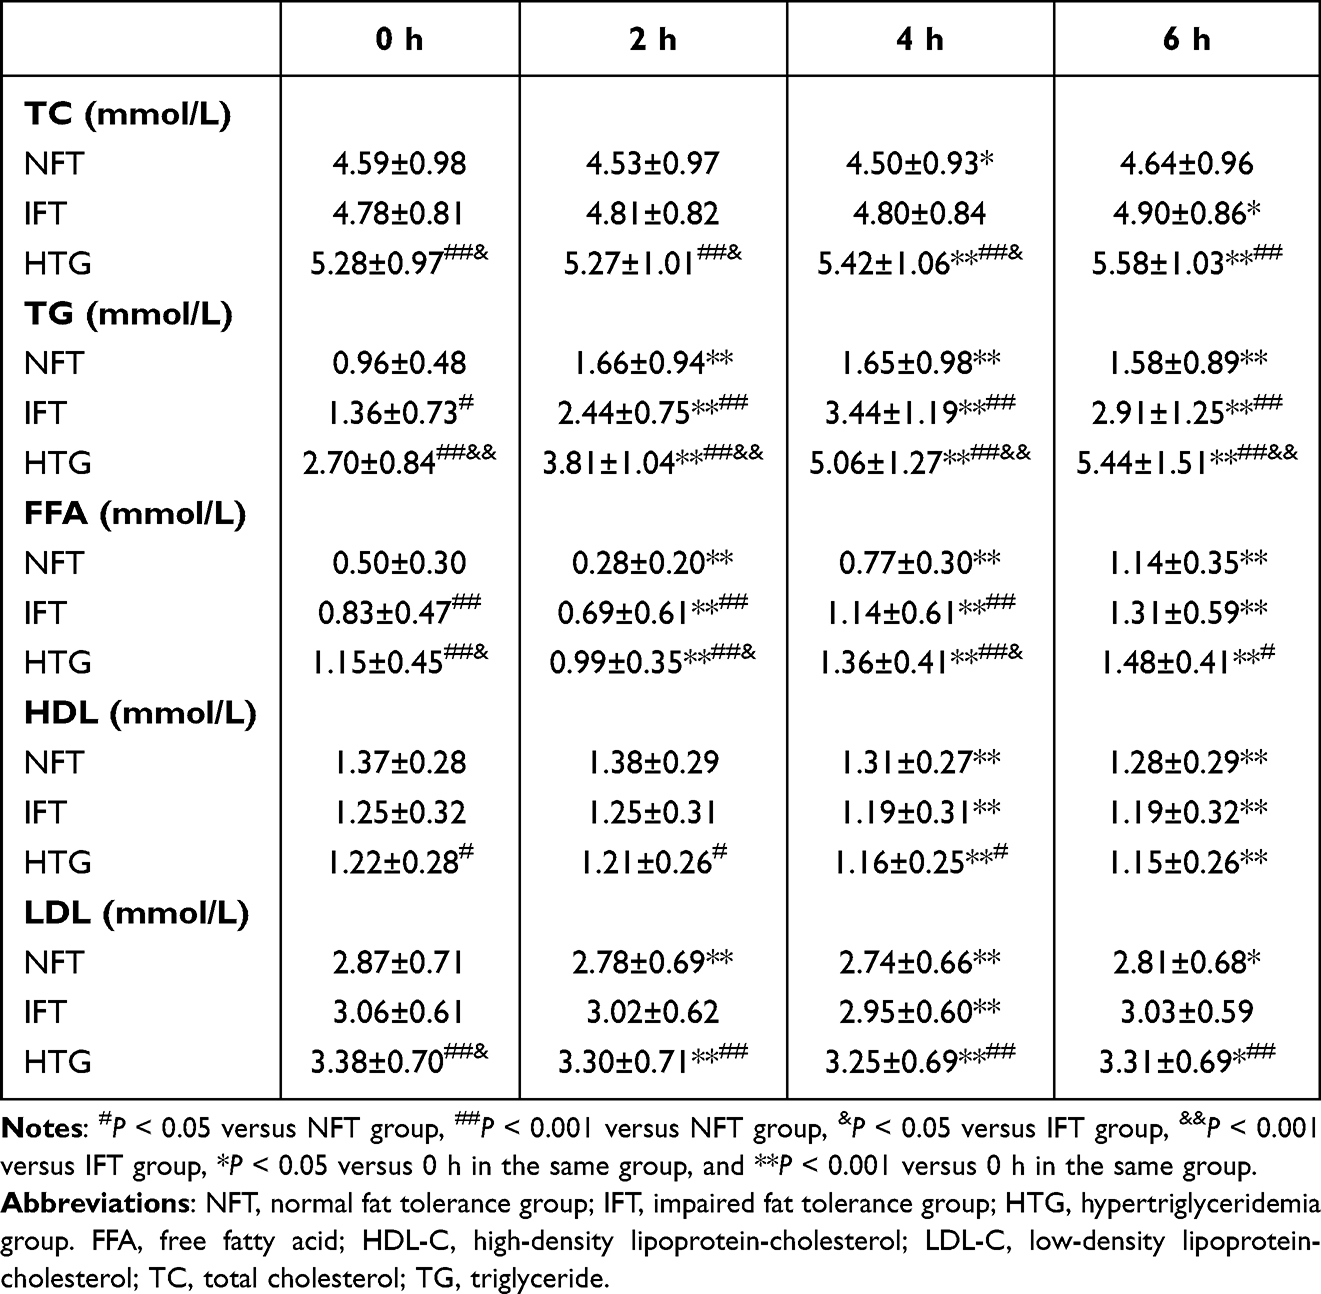 |
Table 2 Comparison of Lipids Concentrations During the OFTT in the Three Groups |
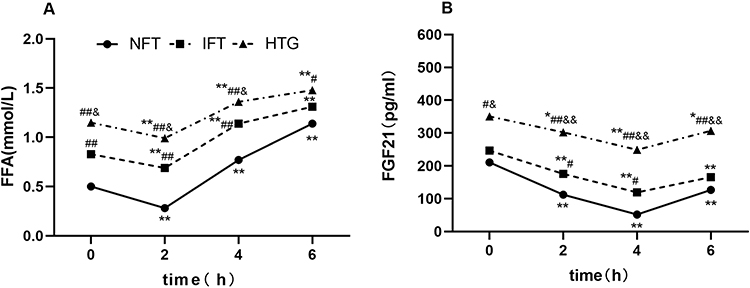 |
Figure 2 Changes in FFA and FGF21 levels after a high-fat diet in the three groups. (A) FFA. (B) FGF21. Abbreviations: NFT, normal fat tolerance group; IFT, impaired fat tolerance group; HTG, hypertriglyceridemia group. FFA, free fatty acid; FGF21, fibroblast growth factor 21. Notes: FFA concentrations are shown as means; FGF21 levels are shown as medians, and statistical analysis was performed using logarithmic transformation. #P < 0.05 versus NFT group, ##P < 0.001 versus NFT group, &P < 0.05 versus IFT group, &&P < 0.001 versus IFT group, *P < 0.05 versus 0 h in the same group, and **P < 0.001 versus 0 h in the same group. |
The serum FGF21 levels showed a similar biphasic change in all three groups. The serum FGF21 levels declined to a nadir at 4 h (vs 0 h, P < 0.001) and then progressively increased until 6 h, when the serum FGF21 levels had not returned to baseline levels (vs 0 h, all P < 0.05). Compared with the baseline level, there were significant differences at all times in the three groups (all P < 0.05). The serum FGF21 level in the HTG group was significantly higher than those in the NFT and IFT groups at all times (all P < 0.05). The serum FGF21 levels in the IFT group were significantly higher than those in the NFT group at 2 h and 4 h (P < 0.05 and P < 0.001, respectively) (Figure 2B).
These data showed that the trends of serum FFA and FGF21 levels were similar, showing a biphasic change of decreasing and then increasing. Most importantly, FFA levels changed earlier than FGF21 levels.
Comparison of Other Lipid Levels During the OFTT
In the NFT group, the TG levels peaked 2 h after the lipid load (vs 0 h, P < 0.001) and then showed a descending trend and did not return to the baseline level at 6 h (vs 0 h, P < 0.001). In the IFT group, the TG levels increased at 2 h after the meal (vs 0 h, P < 0.001), peaked at 4 h (vs 0 h, P < 0.001), and then gradually declined and did not return to the baseline level at 6 h (vs 0 h, P < 0.001). In the HTG group, TG level continued to increase after the meal and was significantly higher at 2 h than at the baseline (P < 0.001); however, it continued to increase until 6 h (vs 0 h, P < 0.001). The differences in TG levels among the three groups at all times were significant (P(IFT–NFT) 0 h < 0.05, other P < 0.001) (Table 2, Figure 3A).
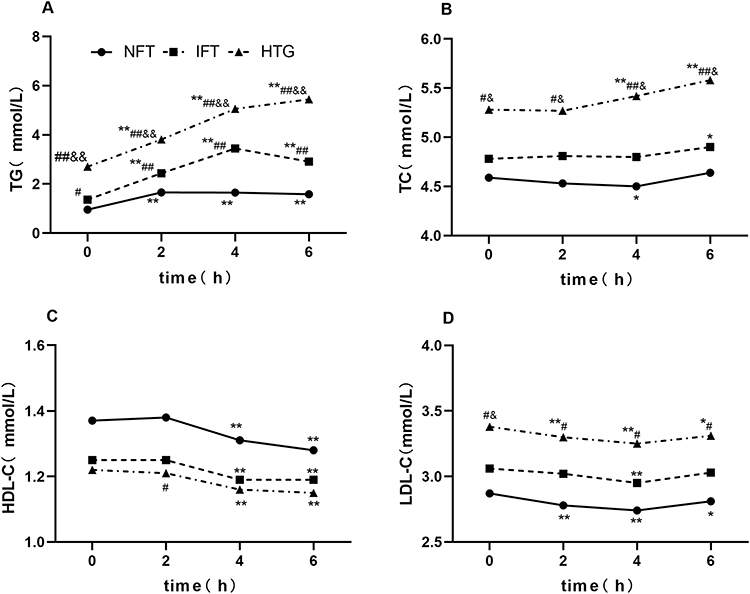 |
Figure 3 Changes in other lipid levels after a high-fat diet in the three groups. (A) TG. (B) TC. (C) HDL-C. (D) LDL-C. Abbreviations: NFT, normal fat tolerance group; IFT, impaired fat tolerance group; HTG, hypertriglyceridemia group. Notes: #P < 0.05 versus NFT group, ##P < 0.001 versus NFT group, &P < 0.05 versus IFT group, &&P < 0.001 versus IFT group, *P < 0.05 versus 0 h in the same group, and **P < 0.001 versus 0 h in the same group. |
The TC levels showed a slight upward trend. They were significantly higher in the HTG group than in the NTF and IFT groups (P < 0.05) (Table 2, Figure 3B). However, HDL-C levels did not change significantly at the start. However, they decreased significantly at 4 h vs at 0 h (P < 0.001), and there was a significant difference between them at 6 h and at the baseline (vs 0 h, P < 0.001) (Table 2, Figure 3C). LDL-C levels showed a downward trend, reaching a nadir at 4 h (vs 0 h, P < 0.001), and increased slightly at 6 h. LDL-C levels were significantly higher in the HTG group than in the NFT group (P < 0.05) (Table 2, Figure 3D).
Relationship Between Postprandial FGF21 iAUC and Lipid iAUC
The trend of FGF21 level was similar to that of FFA level, which was exogenously altered by the high-fat diet. FGF21 iAUC was negatively correlated with TC iAUC and TG iAUC (r = – 0.230, P = 0.004 and r = – 0.395, P < 0.001, respectively) and positively correlated with FFA iAUC (r = 0.210, P = 0.008). Therefore, FFA iAUC was used as an independent variable in the linear equation, whereas FGF21 iAUC was used as a dependent variable. The results showed that FFA iAUC was linearly correlated with FGF21 iAUC (P = 0.008). After adjusting for sex, age, SBP, DBP, and WC, FFA iAUC remained linearly correlated with FGF21 iAUC (P = 0.003). After further adjustment for serum TC iAUC and HOMA-IR, FFA iAUC was found to be an independent influencing factor of FGF21 iAUC (P = 0.005). (Table 3).
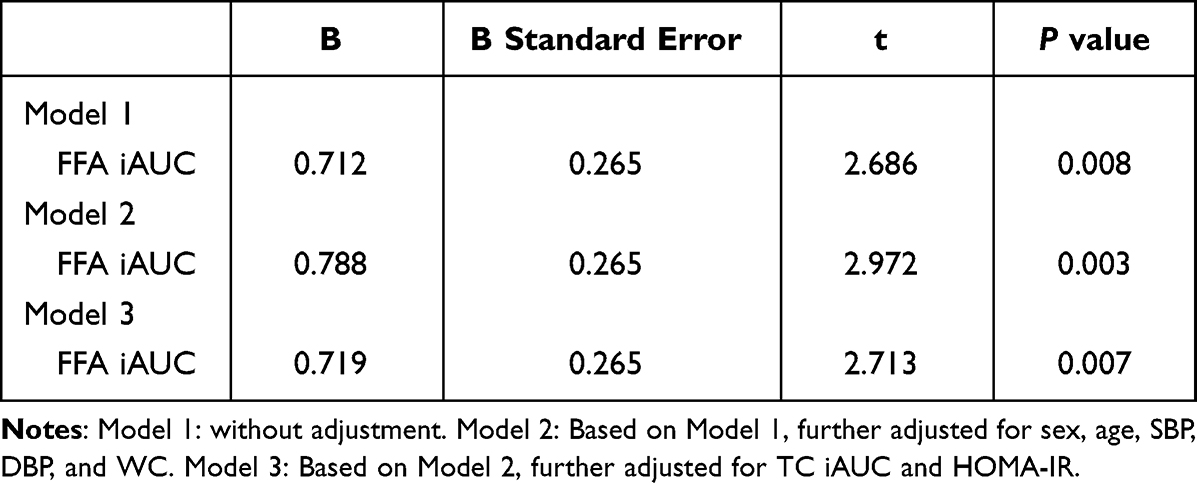 |
Table 3 Multiple Linear Regression Analysis of FGF21 iAUC |
Discussion
The fasting FGF21 level is closely related to the levels of blood lipids; however, their relationship in the postprandial period remains unclear. In the present study, by analyzing the baseline data, it was found that fasting FGF21 levels had a stronger positive correlation with FFA levels. An OFTT was then administered to induce exogenous changes in the lipid levels, and the variations in FGF21 level were similar to those in FFA level. Interestingly, further analysis showed that the change in FFA levels had an independent effect on the alteration of FGF21 levels.
Under normal circumstances, FFA is one of the main energy sources; however, chronic exposure to excessive FFA leads to lipotoxic damage, promoting metabolic disease occurrence and development.15 The present study found that fasting FFA levels were significantly increased in a population with abnormal lipid tolerance and insulin resistance. More importantly,16 insulin resistance could lead to postprandial elevation of serum FFA levels.17 Lauzière et al also discovered a progressive growth in postprandial FFA turnover from the normal insulin level to insulin resistance. This is consistent with the findings of the present study. Notably, FFA level displayed a biphasic pattern of change during the OFTT; it decreased in the early phase and then increased gradually, consistent with the report from a previous study.18 The decrease in FFA levels in the early phase might be due to the following reasons: Firstly, in the fasting state, peripheral fat mobilization releases FFA into the blood to provide energy for metabolically active tissues and organs;19 Therefore, the fasting FFA levels are higher than the FFA levels at any other time of day. In our study, the test meal was a high-fat mixed meal containing carbohydrates, which could restrict FFA utilization after intake.20,21 Peripheral fat mobilization is largely inhibited, and the pathway related to endogenously increasing FFA levels is suppressed. In addition, after consuming the test meal, fatty acids are incorporated into chylomicron-TG and then gradually appear in the serum FFA pool via the “spillover” route from the adipose tissue.22 Therefore, it takes time for OFTT to increase FFA levels exogenously. The gradual increase in FFA levels in the late stage is considered to be associated with the high-fat meal intake. Previous studies have found that dietary fat contributed up to approximately 50% of postprandial serum FFA levels using the isotope tracing method.23–25 Secondly, postprandial insulin levels may play an important role in the changes in FFA levels. In the postprandial state, insulin levels regulate FFA levels by suppressing intracellular adipose tissue lipolysis and reducing FFA spillover from chylomicron TG lipolysis. The insulin levels were elevated only in the first part of the postprandial phase after OFTT, which inhibited the peripheral FFA trapping, leading to the reduction in FFA levels. In the later stage, the peripheral FFA capture was enhanced with the decrease in insulin level, and then FFA level gradually increased. However, we acknowledge the limitation that FFA levels were not measured in our study.22,26 However, some studies have revealed that the FFA level shows a continuously increasing trend after lipid infusion.9 Several factors, such as the method and composition of the lipid administration, may account for this discrepancy. The main component of the infused lipids was fatty acids, which increased the circulating FFA levels constantly and directly. These data suggest that the FFA response pattern largely depends on the method and route of lipid administration.
FGF21 is closely linked to lipid metabolism. The increase in FGF21 levels in response to fasting may contribute to adaptation to energy deprivation.27 The present study showed that fasting FGF21 levels were positively correlated with FFA levels, consistent with previous studies that indicated that fasting FGF21 levels increased in metabolic diseases.28–30 Nevertheless, the data on postprandial FGF21 levels after lipid administration are contradictory. Interestingly, the fluctuation in FGF21 levels after OFTT was similar to that in FFA levels observed in the present study. This finding was confirmed in a randomized crossover trial in humans. A robust positive correlation between FFA and FGF21 levels was observed during lipid infusion in that trial.31 Likewise, Mai et al revealed that incubating HepG2 cells with different FFAs increased FGF21 expression and secretion.9 However, a knockdown of peroxisome proliferator-activated receptor alpha (PPARα) halted the increase in FGF21 expression. It has been suggested that FFA-induced effects on FGF21 depend on the activation of PPARα. This finding provided a theoretical basis for this study. However, previous studies also have drawn contradictory conclusions. Vamvini et al conducted an oral lipid test in healthy people and found no significant change in the FGF21 level.31 We believe that differences in the components of fat intake may account for this discrepancy. Previous studies have shown that carbohydrates and proteins can also affect FGF21 secretion.32–34 In our study, the test meal was a mixture of various nutrients in line with our daily diet. Another study using a high-fat test meal in older adults indicated that postprandial FGF21 levels steadily declined over 240 min.35 We believe that the continuous decline in FGF21 levels may be associated with the low energy intake in the test meal (450 kcal). A previous study found that FFA levels needed a certain threshold to fully stimulate FGF21 secretion.36 In that trial, FFA levels increased to a maximum of 1 mmol/L; therefore, we think the FFA levels obtained were possibly insufficient to effectively stimulate FGF21 secretion. Furthermore, this study found that the nadir time of circulating FFA preceded that of FGF21 by 2 h. This is comparable with the observation of Yu et al that incubation of HepG2 cells with fatty acids for this period (3–4 h) induced the production of FGF21 via PPARα activation.37,38 Blood samples were obtained at 2-h intervals in the present study, which may account for this discrepancy.
Additionally, we found that changes in FFA levels had an independent effect on FGF21. There is also strong evidence from an in vitro study of FGF21 induced by FFA.9 Moreover, the present study showed that the change in TG level was also associated with that of FGF21 level, which was consistent with the findings of Matikainen et al.10 Serum TG levels are closely associated with FFA. Their respective effects are difficult to dissociate. We cannot entirely exclude the role of TG in this study. Nevertheless, an in vitro study suggested that TG did not affect FGF21 secretion in HepG2 cells.9 Recent human data have indicated that variations in serum FGF21 levels resemble those in FFA and cortisol levels.37 These data support a model of FFA as a major regulator of FGF21 secretion.
To our knowledge, this is the first large-sample study conducted in a Chinese population without diabetes to analyze the relationship between postprandial lipids and FGF21. However, this study had some limitations. First, we did not provide a thorough analysis of blood glucose and insulin levels because we aimed to study the association between blood lipids and FGF21. Additionally, the energy provided by the test meal in the present study was high, which could have influenced the results to some extent. Therefore, our team will conduct further clinical trials to investigate the responses of FGF21 to different test meals in Chinese individuals with different diseases.
Conclusion
This study found that, during the OFTT, FFA and FGF21 levels showed a similar biphasic trend of decreasing first and then increasing. Further analysis revealed that the alteration of FFA levels was an independent factor influencing changes in FGF21 levels. This study suggests that FGF21 level after an oral fat tolerance test is positively related to postprandial FFA level. Therefore, we may achieve the goal of regulating endogenous FGF21 by effectively managing FFA levels, thus enabling FGF21 to exert better pleiotropic effects on metabolism.
Abbreviations
ANOVA, Analysis of variance; BMI, Body mass index; DBP, Diastolic blood pressure; ELISA, Enzyme-linked immunosorbent assay; FBG, Fasting blood glucose; FFA, Free fatty acids; FGF, Fibroblast growth factor; IFT, Impaired fat tolerance; NFT, Normal fat tolerance; OFTT, Oral fat tolerance test; OGTT, Oral glucose tolerance testing; SBP, Systolic blood pressure; SD, Standard deviation; TC, Total cholesterol; TG, Triglyceride; WC, Waist circumference.
Data Sharing Statement
The datasets generated and/or analyzed during this study are not publicly available because they contain information that could compromise the privacy of the research participants. The data are available from the corresponding author upon reasonable request.
Ethics Approval
This study was approved by the Ethics Committee of Hebei General Hospital (2018 NO.2) and was registered in the China Clinical Trial Registration Center (registration No.: ChiCTR1800019514, registration date: November 15, 2018). http://www.chictr. org.cn/index.aspx).
Consent to Participate
All participants provided written informed consent and completed the questionnaires as required.
Acknowledgments
We sincerely thank the teachers at the Clinical Medical Research Centre of Hebei General Hospital for their help with this study. We would like to thank Editage (www.editage.cn) for English language editing.
Author Contributions
All authors made a significant contribution to the work reported, whether that is in the conception, study design, execution, acquisition of data, analysis and interpretation, or in all these areas; took part in drafting, revising or critically reviewing the article; gave final approval of the version to be published; have agreed on the journal to which the article has been submitted; and agree to be accountable for all aspects of the work.
Funding
This study was supported by the Research Fund of Hebei Provincial Government.
Disclosure
The authors have no relevant financial or non-financial interests to disclose.
References
1. Kharitonenkov A, Shiyanova TL, Koester A, et al. FGF-21 as a novel metabolic regulator. J Clin Invest. 2005;115(6):1627–1635.
2. Salminen A, Kaarniranta K, Kauppinen A. Regulation of longevity by FGF21: interaction between energy metabolism and stress responses. Ageing Res Rev. 2017;37:79–93.
3. Geng L, Lam KSL, Xu A. The therapeutic potential of FGF21 in metabolic diseases: from bench to clinic. Nat Rev Endocrinol. 2020;16(11):654–667.
4. Demant M, Suppli MP, Foghsgaard S, et al. Metabolic effects of 1-week binge drinking and fast food intake during Roskilde Festival in young healthy male adults. Eur J Endocrinol. 2021;185(1):23–32.
5. Solon-Biet SM, Cogger VC, Pulpitel T, et al. Defining the Nutritional and Metabolic Context of FGF21 Using the Geometric Framework. Cell Metab. 2016;24(4):555–565.
6. Laeger T, Henagan TM, Albarado DC, et al. FGF21 is an endocrine signal of protein restriction. J Clin Invest. 2014;124(9):3913–3922.
7. Xu C, Markova M, Seebeck N, et al. High-protein diet more effectively reduces hepatic fat than low-protein diet despite lower autophagy and FGF21 levels. Liver Int. 2020;40(12):2982–2997.
8. Samms RJ, Lewis JE, Norton L, et al. FGF21 Is an Insulin-Dependent Postprandial Hormone in Adult Humans. J Clin Endocr Metab. 2017;102(10):3806–3813.
9. Mai K, Andres J, Biedasek K, et al. Free fatty acids link metabolism and regulation of the insulin-sensitizing fibroblast growth factor-21. Diabetes. 2009;58(7):1532–1538.
10. Matikainen N, Taskinen MR, Stennabb S, et al. Decrease in circulating fibroblast growth factor 21 after an oral fat load is related to postprandial triglyceride-rich lipoproteins and liver fat. Eur J Endocrinol. 2011;166(3):487–492.
11. Hou X, Guan Y, Tang Y, et al. Correlation study of the relationships between nonalcoholic fatty liver disease and serum triglyceride concentration after an oral fat tolerance test. Lipids Health Dis. 2021;20(1):54.
12. Matthews DR, Hosker JP, Rudenski AS, Naylor BA, Treacher DF, Turner RC. Homeostasis model assessment: insulin resistance and beta-cell function from fasting plasma glucose and insulin concentrations in man. Diabetologia. 1985;28:412–419.
13. Hu DY. New guidelines and evidence for the prevention and treatment of dyslipidemia and atherosclerotic cardiovascular disease in China. Zhonghua Xin Xue Guan Bing Za Zhi. 2016;44:826–827.
14. Kolovou GD, Mikhailidis DP, Kovar J, et al. Assessment and clinical relevance of non-fasting and postprandial triglycerides: an expert panel statement. Curr Vasc Pharmacol. 2011;9:258–270.
15. Lipke K, Kubis-Kubiak A, Piwowar A. Molecular Mechanism of Lipotoxicity as an Interesting Aspect in the Development of Pathological States-Current View of Knowledge. Cells. 2022;11(5). doi:10.3390/cells11050844
16. Carpentier AC. Postprandial fatty acid metabolism in the development of lipotoxicity and type 2 diabetes. Diabetes Metab. 2008;34:97–107.
17. Normand-Lauzière F, Frisch F, Labbé SM, et al. Increased postprandial nonesterified fatty acid appearance and oxidation in type 2 diabetes is not fully established in offspring of diabetic subjects. PLoS One. 2010;5:e10956.
18. Montastier É, Ye RZ, Noll C, et al. Increased postprandial nonesterified fatty acid efflux from adipose tissue in prediabetes is offset by enhanced dietary fatty acid adipose trapping. Am J Physiol-Endoc M. 2021;320(6):E1093–E1106.
19. Sprangers F, Romijn JA, Endert E, Ackermans MT, Sauerwein HP. The role of free fatty acids (FFA) in the regulation of intrahepatic fluxes of glucose and glycogen metabolism during short-term starvation in healthy humans. Eur J Gastroen Hepat. 2001;13(12):A17–A18.
20. van Oostrom AJ, van Dijk H, Verseyden C, et al. Addition of glucose to an oral fat load reduces postprandial free fatty acids and prevents the postprandial increase in complement component 3. Am J Clin Nutr. 2004;79(3):510–515.
21. Henry RW, Stout RW, Buchanan KD. The gastro-entero-pancreatic hormone secretion after a mixed meal in normal subjects before and after a 72 hour period of starvation. Diabete Metab. 1979;5(1):21–26.
22. Fielding B. Tracing the fate of dietary fatty acids: metabolic studies of postprandial lipaemia in human subjects. Proceedings of the Nutrition Society. 2011;70(3):342–350.
23. Miles JM, Wooldridge D, Grellner WJ, et al. Nocturnal and postprandial free fatty acid kinetics in normal and type 2 diabetic subjects: effects of insulin sensitization therapy. Diabetes. 2003;52:675–681.
24. Carpentier AC, Frisch F, Cyr D, et al. On the suppression of plasma nonesterified fatty acids by insulin during enhanced intravascular lipolysis in humans. Am J Physiol Endocrinol Metab. 2005;289:E849–E856.
25. Brassard P, Frisch F, Lavoie F, et al. Impaired plasma nonesterified fatty acid tolerance is an early defect in the natural history of type 2 diabetes. J Clin Endocrinol Metab. 2008;93:837–844.
26. Boquist S, Hamsten A, Karpe F, Ruotolo G. Insulin and non-esterified fatty acid relations to alimentary lipaemia and plasma concentrations of postprandial triglyceride-rich lipoproteins in healthy middle-aged men. Diabetologia. 2000;43(2):185–193.
27. Inagaki T, Dutchak P, Zhao G, Ding X. Endocrine regulation of the fasting response by PPARalpha-mediated induction of fibroblast growth factor 21. Cell Metab. 2007;5(6):415–425.
28. Xiao F, Shi X, Huang P, et al. Dose-response relationship between serum fibroblast growth factor 21 and liver fat content in non-alcoholic fatty liver disease. Diabetes Metab. 2020;47(6):101221.
29. Lui DTW, Lee CH, Chau VWK. Potential role of fibroblast growth factor 21 in the deterioration of bone quality in impaired glucose tolerance. J Endocrinol Invest. 2020;44(3):523–530.
30. Zhang X, Yeung DC, Karpisek M, et al. Serum FGF21 Levels Are Increased in Obesity and Are Independently Associated With the Metabolic Syndrome inHumans. Diabetes. 2008;57(5):1246–1253.
31. Vamvini MT, Hamnvik OP, Sahin-Efe A, et al. Differential Effects of Oral and Intravenous Lipid Administration on Key Molecules Related to Energy Homeostasis. J Clin Endocr Metab. 2016;101(5):1989–1997.
32. Laeger T, Castaño-Martinez T, Werno MW, et al. Dietary carbohydrates impair the protective effect of protein restriction against diabetes in NZO mice used as a model of type 2 diabetes. Diabetologia. 2018;61(6):1459–1469.
33. Hill CM, Berthoud HR, Münzberg H, Morrison CD. Homeostatic sensing of dietary protein restriction: a case for FGF21. Front Neuroendocrin. 2018;51:125–131.
34. McCullough D, Harrison T, Lane K, et al. The effect of a low carbohydrate high fat diet on emerging biochemical markers of cardiometabolic risk. P Nutr Soc. 2020;79(OCE2). doi:10.1017/s0029665120004796
35. Herpich C, Haß U, Kochlik B, et al. Postprandial dynamics and response of fibroblast growth factor 21 in older adults. Clin Nutr. 2021;40(6):3765–3771.
36. Mai K, Bobbert T, Groth C, et al. Physiological modulation of circulating FGF21: relevance of free fatty acids and insulin. Am J Physiol-Endoc M. 2010;299(1):E126–130.
37. Yu H, Xia F, Lam KS, et al. Circadian rhythm of circulating fibroblast growth factor 21 is related to diurnal changes in fatty acids in humans. Clin Chem. 2011;57(5):691–700.
38. Qiu H, Song E, Hu Y, et al. Exacerbates Nonalcoholic Fatty Liver Disease Through Autocrine Inhibition of the PPARα/FGF21 Axis. Cell Mol Gastroenterol Hepatol. 2022;14(5):1003–1023.
 © 2023 The Author(s). This work is published and licensed by Dove Medical Press Limited. The
full terms of this license are available at https://www.dovepress.com/terms
and incorporate the Creative Commons Attribution
- Non Commercial (unported, 3.0) License.
By accessing the work you hereby accept the Terms. Non-commercial uses of the work are permitted
without any further permission from Dove Medical Press Limited, provided the work is properly
attributed. For permission for commercial use of this work, please see paragraphs 4.2 and 5 of our Terms.
© 2023 The Author(s). This work is published and licensed by Dove Medical Press Limited. The
full terms of this license are available at https://www.dovepress.com/terms
and incorporate the Creative Commons Attribution
- Non Commercial (unported, 3.0) License.
By accessing the work you hereby accept the Terms. Non-commercial uses of the work are permitted
without any further permission from Dove Medical Press Limited, provided the work is properly
attributed. For permission for commercial use of this work, please see paragraphs 4.2 and 5 of our Terms.
Recommended articles
Correlation Between the Levels of ANGPTL3, ANGPTL4, ANGPTL8 and Postprandial Triglyceride-Rich Lipoprotein (TRL)
Zhang T, Hou Y, Liu M, Hou X, Tang Y, Ren L, Song G
Diabetes, Metabolic Syndrome and Obesity 2023, 16:3979-3993
Published Date: 6 December 2023