Back to Journals » Diabetes, Metabolic Syndrome and Obesity » Volume 16
Correlation Between the Levels of ANGPTL3, ANGPTL4, ANGPTL8 and Postprandial Triglyceride-Rich Lipoprotein (TRL)
Authors Zhang T, Hou Y ![]() , Liu M, Hou X, Tang Y, Ren L, Song G
, Liu M, Hou X, Tang Y, Ren L, Song G
Received 13 September 2023
Accepted for publication 26 November 2023
Published 6 December 2023 Volume 2023:16 Pages 3979—3993
DOI https://doi.org/10.2147/DMSO.S438757
Checked for plagiarism Yes
Review by Single anonymous peer review
Peer reviewer comments 2
Editor who approved publication: Prof. Dr. Juei-Tang Cheng
Tingxue Zhang,1,2 Yilin Hou,1,2 Min Liu,2 Xiaoyu Hou,1,2 Yong Tang,2 Luping Ren,2 Guangyao Song1,2
1Department of Internal Medicine, Hebei Medical University, Shijiazhuang, Hebei, People’s Republic of China; 2Department of Endocrinology, Hebei General Hospital, Shijiazhuang, People’s Republic of China
Correspondence: Guangyao Song, Tel +86-0311-8598-8556, Email [email protected]
Purpose: To investigate the effects of different angiopoietin-like proteins (ANGPTLs) on postprandial hypertriglyceridemia (PPT) by analyzing changes in serum lipid, ANGPTL3, ANGPTL4, and ANGPTL8 levels before and after a high-fat diet in individuals with normal fasting lipid and oral glucose tolerance test results.
Patients and Methods: Exactly 103 volunteers were recruited for an oral fat tolerance test (OFTT). Blood samples were obtained at 0, 2, and 4 h after eating to detect relevant indicators. PPT was defined as triglyceride (TG) levels ≥ 2.5 mmol/L. According to the test results, the participants were divided into two groups: postprandial normal triglycerides (PNT) and PPT. The levels of blood lipids and ANGPTL3, ANGPTL4, and ANGPTL8 were compared between the two groups.
Results: There were differences in the body mass index (BMI), waist circumference (WC), fasting total cholesterol (TC), TG, low-density lipoprotein cholesterol (LDL-C), triglyceride-rich lipoprotein cholesterol (TRL-C), non-high-density lipoprotein cholesterol (non-HDL-C), apolipoprotein B (ApoB), ApoA1/ApoB, fasting blood glucose (FBG), fasting insulin (FINS), ANGPTL4, and ANGPTL8 between the two groups. In the PNT group, the TG level increased from baseline at 2 and 4 h, TRL-C increased from baseline at 4 h, and ANGPTL8 decreased from baseline at 2 and 4 h. After OFTT, the levels of TG, TRL-C, ANGPTL3, and ANGPTL4 in the PPT group gradually increased; ANGPTL8 gradually decreased. Fasting ANGPTL3 was positively associated with age, TC, HDL-C, TRL-C, and ApoA1, and negatively associated with systolic blood pressure. Fasting ANGPTL4 was positively correlated with weight, WC, BMI, TC, TG, LDL-C, TRL-C, non-HDL-C, ApoB, FBG, and FINS, and negatively correlated with ApoA1/ApoB and fasting ANGPTL8. Binary logistic regression analysis indicated that ANGPTL4 and ANGPTL8 were significant predictors of PPT.
Conclusion: PPT occurrence is closely associated with changes in ANGPTL4 and ANGPTL8 levels.
Keywords: dyslipidemia, serum lipid, ANGPTL proteins, oral fat tolerance test, postprandial normal triglyceride
Introduction
As the prevalence of hyperlipidemia has increased, the assessment of blood lipids is increasingly important.1 At present, fasting lipid indices, including total cholesterol (TC), triglyceride (TG), and low-density lipoprotein cholesterol (LDL-C) levels are most commonly assessed in clinical practice.2 Among them, the TG level is one of the most important indices of blood lipid assessments. However, in daily life, most people eat regularly and are almost always in a continuous and dynamic postprandial state. Therefore, the postprandial TG concentration can better reflect changes in lipid metabolism than the fasting concentration.3 It has been reported that postprandial TG concentration can better predict the occurrence of atherosclerosis and coronary artery disease than fasting TG concentration.4
Postprandial alterations in lipid metabolism usually persist for 6–8 h after eating, whereas postprandial hypertriglyceridemia is due to an excessive magnitude or duration of postprandial triglyceride-rich lipoprotein (TRL) reactions. These results in increased accumulation of TRL and its residues in the circulation. In most tissues, lipoprotein lipase (LPL) hydrolyzes TRL to produce TG, which regulates the distribution of fatty acids to various tissues.5 Therefore, postprandial hypertriglyceridemia may occur because of reduced hepatic receptor activity or defective receptor ligands and impaired lipolysis of LPL.6
Angiopoietin-like proteins (ANGPTLs) are a family of proteins, the structure of ANGPTLs is extremely similar to that of angiopoietins. ANGPTLs are widely expressed in tissues such as the liver, vascular tissues, and adipose tissues. They play important roles in angiogenesis, inflammatory responses, cancer progression, and lipid metabolism.7,8 Among them, ANGPTL3, ANGPTL4, and ANGPTL8 have high sequence homology and are involved in the inhibition of LPL activity and the regulation of TRL metabolism. They are more closely related to lipid metabolism and have become potential drug targets for dyslipidemia and cardiovascular diseases.9
ANGPTL3 is a key regulator of lipid metabolism and is primarily synthesized in the liver, acting as an LPL inhibitor of TG hydrolysis in TRL metabolism.10 ANGPTL4 is mainly expressed in adipose tissue and the liver.11 It is also a key regulator of LPL inhibition. ANGPTL8 is a circulating factor derived from hepatocytes, also known as a β-trophic factor, which is expressed mainly in the liver, and regulates plasma TG levels.11
The present study aimed to analyze the correlation between fasting blood lipids and serum ANGPTL3, ANGPTL4, and ANGPTL8 of patients with normal oral glucose tolerance test (OGTT) results and lipid indices after a high-fat meal. In doing so, it aimed to explore the role of ANGPTL3, ANGPTL4, and ANGPTL8 in postprandial lipid metabolism, thus further evaluating the possibility of targeted therapy for abnormal lipid metabolism.
Materials and Methods
Research Participants
Between June 2018 and December 2019, 103 volunteers (49 males and 54 females) from the Hebei General Hospital, Shijiazhuang, China were selected as the study population.12 This research was registered with the China Clinical Trial Registry (registration number: ChiCTR1800019514), and the Ethics Committee of Hebei General Hospital approved this study; all participants provided informed consent, this complies with the Declaration of Helsinki’s requirements.
Exclusion Criteria
Patients with hematologic, cardiovascular, gastrointestinal, urinary system, and psychiatric diseases, or with hyperlipidemia, diabetes mellitus, thyroid dysfunction, and malignant tumors were excluded. Those who were vegetarians, pregnant, had a history of surgical trauma in the last month, had a change in body weight of more than 3 kg in the last month, and had used drugs affecting glucose and lipid metabolism (fish oils, antipyretic and analgesic medications, glucocorticoids, diuretics, and beta-blockers) were also excluded.
All volunteers underwent fasting lipid testing and OGTT before participating in this study and were excluded from the study according to the Chinese Guidelines for the Prevention and Treatment of Dyslipidemia in Adults13 and the 1999 WHO Diagnostic Criteria for Diabetes Mellitus. They were excluded from the study if they had abnormal fasting lipid findings (TC ≥ 5.2 mmol/L or TG ≥ 1.7 mmol/L or non-HDL-C < 4.1 mmol/L or LDL-C ≥ 3.4 mmol/L) or abnormal OGTT results (fasting blood glucose ≥ 7.0 mmol/L or OGTT 2 h blood glucose ≥ 11.1 mmol/L).
Oral Fat Tolerance Test
Participants were on a normal regular diet for 1 week before participation in the oral fat tolerance test (OFTT). They were required to fast overnight for 12 h the day before the OFTT and eat a high-fat meal at 8:00 am, which was to be consumed within 15 min. Strenuous activity was prohibited for 4 h after consuming the high-fat meal. Fasting and smoking were prohibited, and normal water intake was allowed. Venous blood was obtained at 0, 2, and 4 h after eating; the blood serum was centrifuged at 4°C for the determination of relevant indices, and the remaining serum was stored in a refrigerator at −80°C. The high-fat meal in this trial was prepared by specialized physicians in the Department of Nutrition, totally up to 1500 kcal, of which the contents of fat, protein and carbohydrates were 60%, 20% and 20%, respectively.12
Related Indices Testing
A biochemical instrument was used to measure the levels of fasting blood glucose (FBG) and blood lipid at 0, 2, and 4 h. The lipid indices, including TC, TG, LDL-C, high-density lipoprotein cholesterol (HDL-C), apolipoprotein A1 (ApoA1), and apolipoprotein B (ApoB). The concentrations of TRL-C and non-HDL-C were calculated from the above results: TRL-C = TC- (HDL-C - LDL-C) and non-HDL = TC - (HDL-C). Electrochemiluminescence was applied to detect fasting insulin (FINS) levels, and Enzyme-linked immunosorbent assay (ELISA) kits were used to assess ANGPTL3, ANGPTL4, and ANGPTL8.
Criteria for Grouping
Based on the 2019 expert group consensus,14 participants with TG levels ≥ 2.5 mmol/L at any time after meals were defined as having postprandial hypertriglyceridemia (PPT). Moreover, based on the results of the OFTT, the participants were divided into the postprandial normal lipid group (postprandial normal triglyceride, PNT) and the PPT group.
Statistical Analysis
SPSS 26.0 and GraphPad Prism 9.5.1 software were used to analyze the data. Categorical variables were analyzed using chi-squared tests. The Shapiro–Wilk method was used to test whether the data exhibited a normal distribution. Data from both groups were compared using t-tests for normal distribution and rank-sum tests for skewed distribution. The fasting ANGPTL3, ANGPTL4, and ANGPTL8 levels were correlated with height; weight; SBP; DBP; BMI; WC; and fasting TC, TG, LDL-C, HDL-C, TRL-C, non-HDL-C, ApoA1, ApoB, ApoA1/ApoB, blood glucose, insulin, ANGPTL3, ANGPTL4, and ANGPTL8 levels. For normally distributed data, Pearson correlation analysis was used, while Spearman correlation analysis was used for skewed distributions. Based on the third percentile of the fasting ANGPTL3, ANGPTL4, and ANGPTL8 levels, we divided the results into groups 1, 2, and 3 (from low to high) and compared the changes in the AUC regarding the various indices following the meal. Binary logistic regression was used to analyze the relationship between fasting ANGPTL3, ANGPTL4, ANGPTL8 and PPT. P < 0.05 were deemed statistically significant.
Results
Comparison of the General Information and Fasting Indicators Between the Two Groups
Exactly 103 participants were enrolled in this study; 55 and 48 were in the PNT and PPT groups, respectively. There were significant differences (P < 0.05) between the two groups in terms of BMI, WC, TC, TG, LDL-C, TRL-C, non-HDL-C, ApoB, ApoA1/ApoB, FBG, FINS, ANGPTL4, and ANGPTL8. In the PPT group, the expression levels of BMI, WC, TC, TG, LDL-C, TRL-C, non-HDL-C, ApoB, FBG, FINS, and ANGPTL4 were higher than in the PNT group, and those of ApoA1/ApoB and ANGPTL8 were lower than in the PNT group (Table 1).
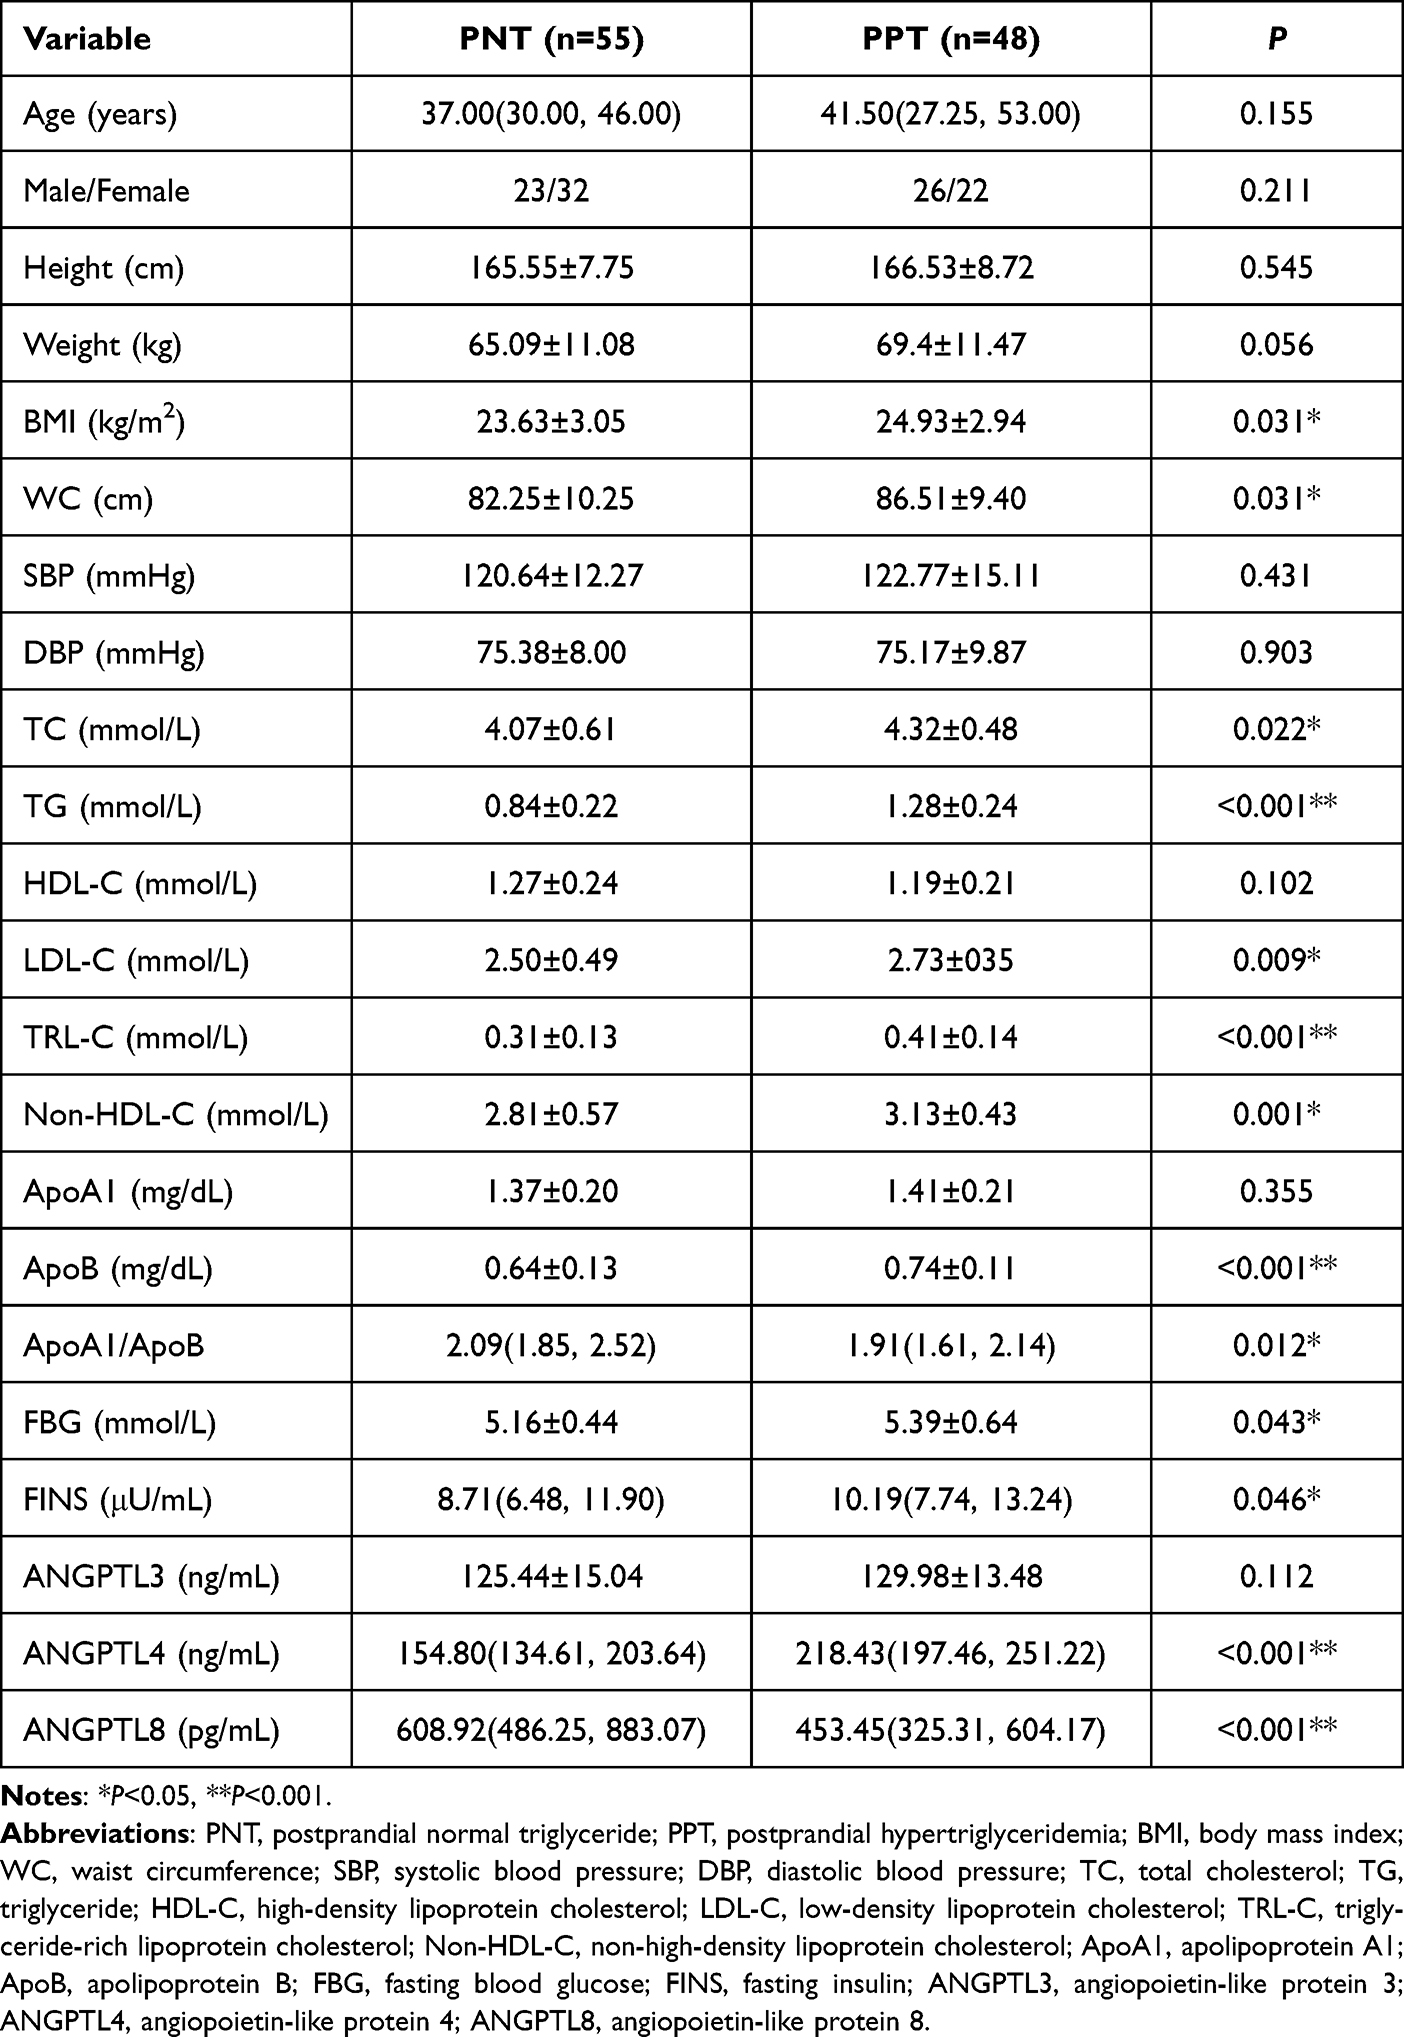 |
Table 1 Comparison of Clinical and Demographic Data and Fasting Indicators Between the Two Groups |
Comparison of Blood Lipid Levels and ANGPTL3, ANGPTL4, and ANGPTL8 at Different Time Points Before and After High-Fat Meal Consumption
In the PNT group, the TG levels were elevated at 2 and 4 h compared to the baseline levels. The TRL-C levels increased from baseline at 4 h, and the ANGPTL8 levels decreased from baseline at 2 and 4 h.
In the PPT group, TG, TRL-C, ANGPTL3, and ANGPTL4 showed a significant gradual increasing trend after OFTT, whereas ANGPTL8 showed a gradual decreasing trend, and HDL-C decreased from the baseline level at 4 h. The remaining lipid indices showed no discernible difference between the two groups (Table 2, Figures 1 and 2).
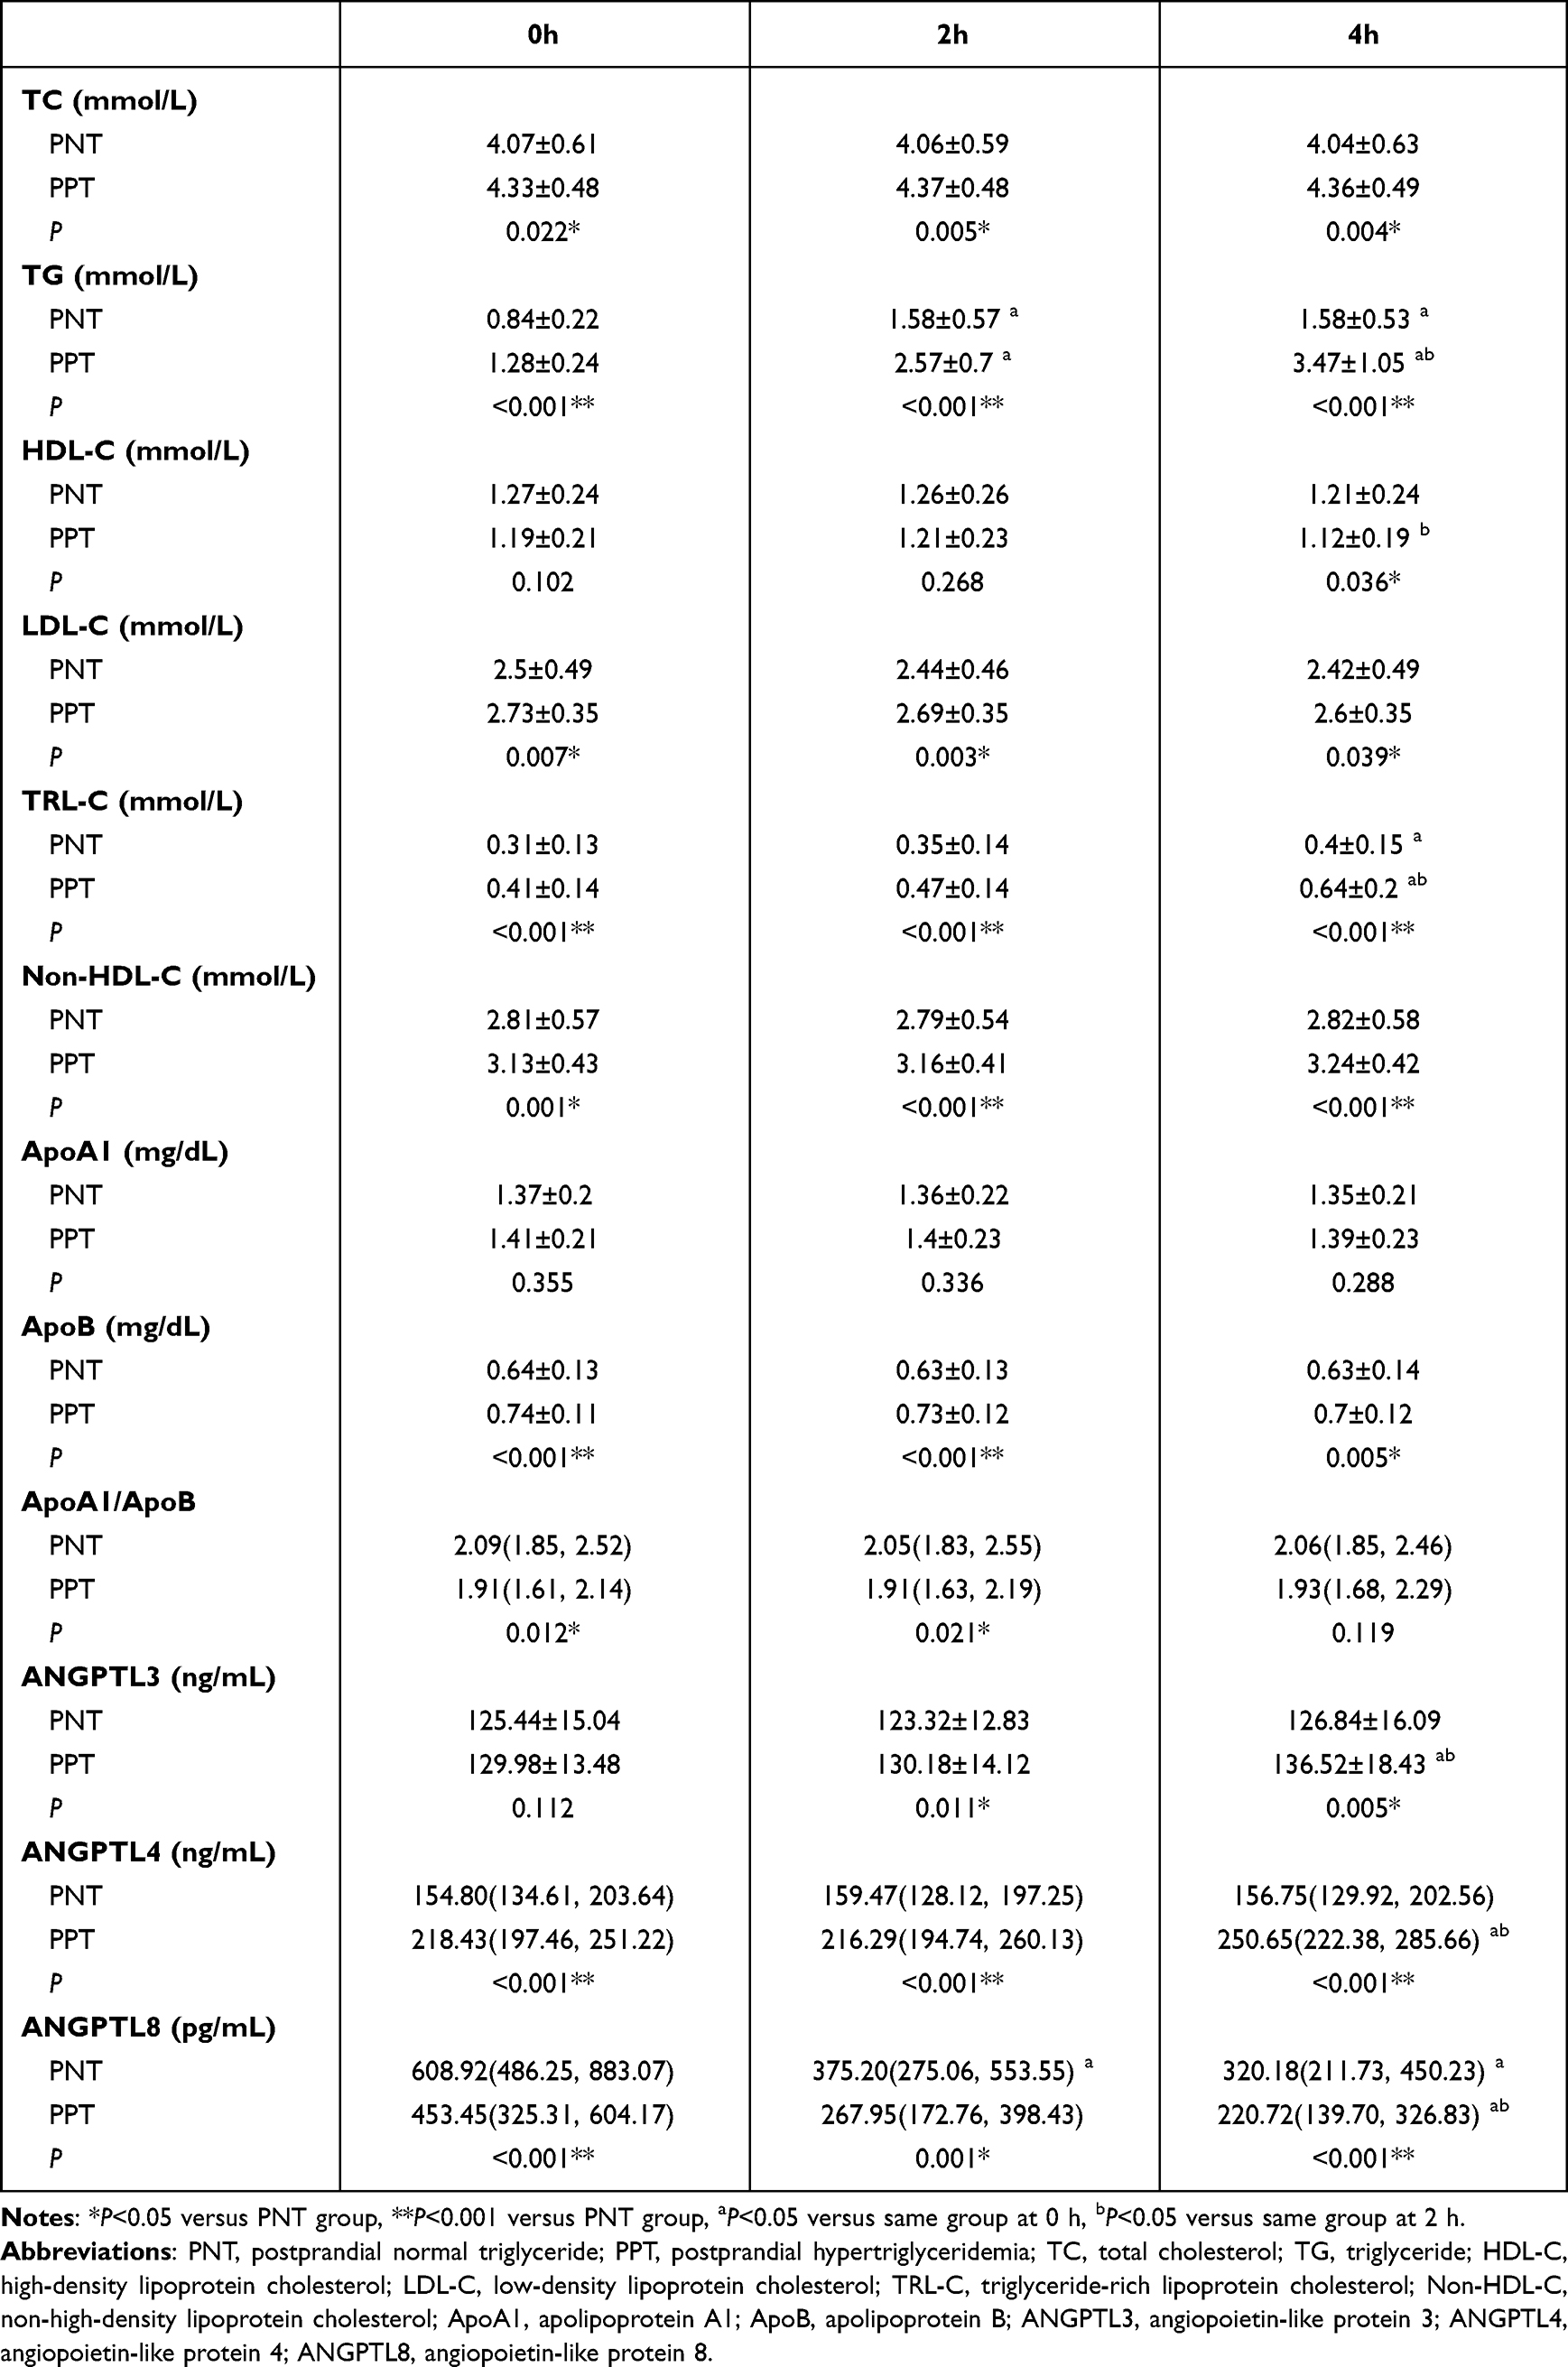 |
Table 2 Comparison of Blood Lipid Levels and ANGPTL3, ANGPTL4, and ANGPTL8 at Different Time Points Before and After High-Fat Meal Consumption |
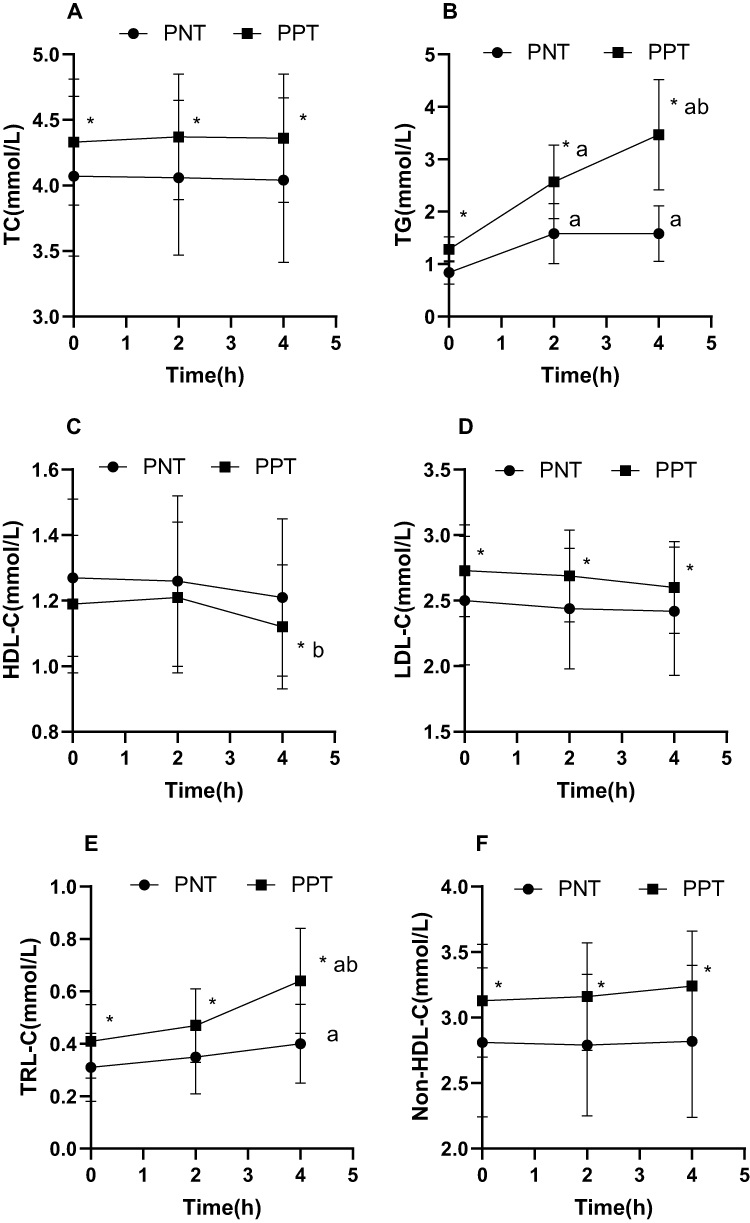 |
Figure 1 Comparison of blood lipid levels at different time points before and after high-fat meal consumption. (A) TC. (B) TG. (C) HDL-C. (D) LDL-C. (E) TRL-C. (F) Non-HDL-C. Abbreviations: PNT, postprandial normal triglyceride; PPT, postprandial hypertriglyceridemia; TC, total cholesterol; TG, triglyceride; HDL-C, high-density lipoprotein cholesterol; LDL-C, low-density lipoprotein cholesterol; TRL-C, triglyceride-rich lipoprotein cholesterol; Non-HDL-C, non-high-density lipoprotein cholesterol. Notes: *P<0.05 versus PNT group, aP<0.05 versus same group at 0 h, bP<0.05 versus same group at 2 h. |
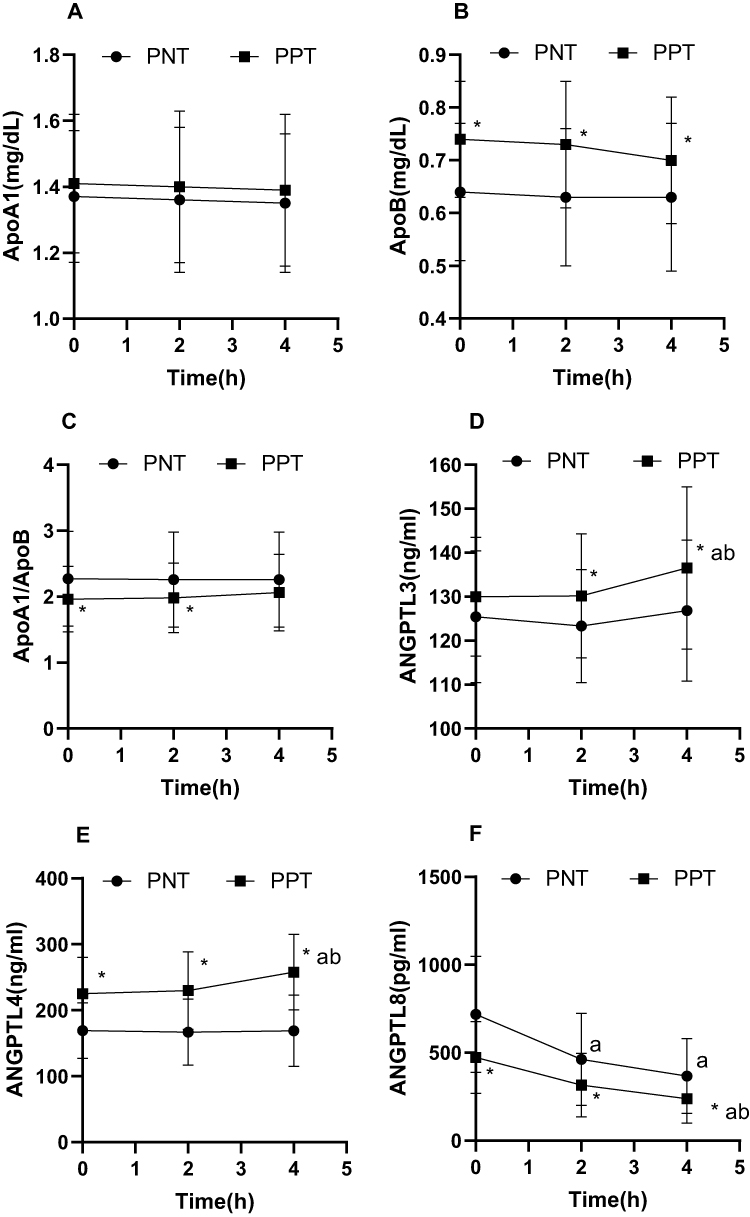 |
Figure 2 Comparison of blood lipid levels and ANGPTL3, ANGPTL4, and ANGPTL8 at different time points before and after high-fat meal consumption. (A) ApoA1. (B) ApoB. (C) ApoA1/ ApoB. (D) ANGPTL3. (E) ANGPTL4. (F) ANGPTL8. Abbreviations: PNT, postprandial normal triglyceride; PPT, postprandial hypertriglyceridemia; ApoA1, apolipoprotein A1; ApoB, apolipoprotein B; ANGPTL3, angiopoietin-like protein 3; ANGPTL4, angiopoietin-like protein 4; ANGPTL8, angiopoietin-like protein 8. Notes: *P<0.05 versus PNT group, aP<0.05 versus same group at 0 h, bP<0.05 versus same group at 2 h. |
Correlation Analysis of Fasting ANGPTL3, ANGPTL4, and ANGPTL8 Levels with the General Data and Fasting Indices
The fasting ANGPTL3 levels were positively associated with age, TC, HDL-C, TRL-C, and ApoA1 (P < 0.05) and negatively correlated with SBP (P < 0.05). The fasting ANGPTL4 levels were positively associated with weight, BMI, WC, TC, TG, LDL-C, TRL-C, non-HDL-C, ApoB, FBG, and FINS (P < 0.05) and negatively associated with ApoA1/ApoB and fasting ANGPTL8 levels (P < 0.05) (Table 3).
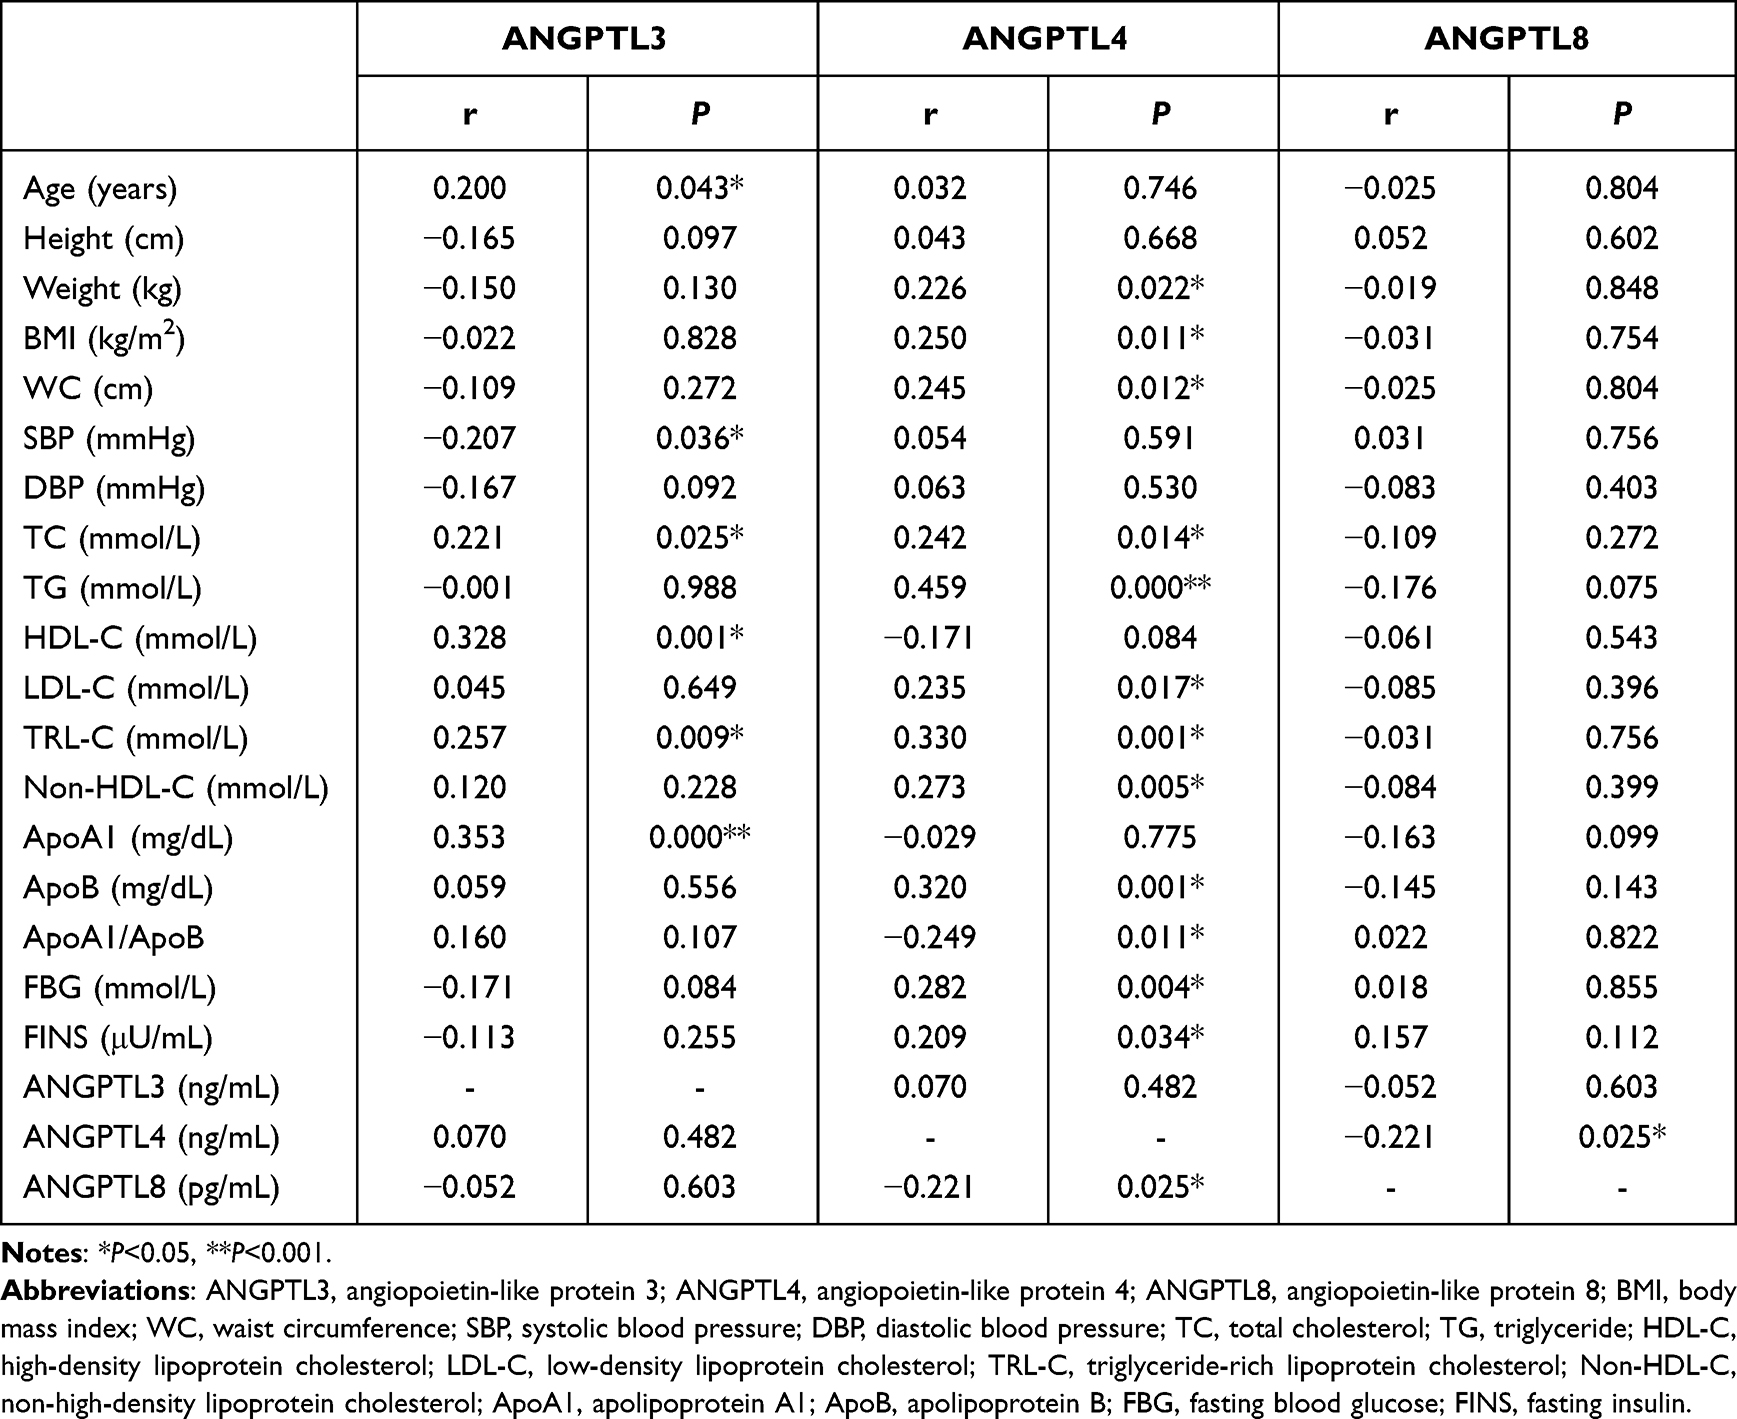 |
Table 3 Correlation Analysis of Fasting ANGPTL3, ANGPTL4, and ANGPTL8 Levels with Clinical and Demographic Data and Fasting Indices |
Comparison of the Subgroups Regarding the Fasting ANGPTL3 Level
The AUC regarding HDL-C and ApoA1 in groups 2 and 3 was higher than that in group 1 (P < 0.05), and the AUC regarding TRL-C in group 3 was higher than that in groups 1 and 2 (P < 0.05) (Figure 3).
 |
Figure 3 Changes in lipid levels and AUC of lipid after a high-fat diet in the three groups. (A) HDL-C. (B) AUC of HDL-C. (C) TRL-C. (D) AUC of TRL-C. (E) ApoA1. (F) AUC of ApoA1. Abbreviations: AUC area under the curve; HDL-C high-density lipoprotein cholesterol; TRL-C triglyceride-rich lipoprotein cholesterol; ApoA1 apolipoprotein A1. Notes: *P<0.05 indicates a difference in AUC between the two groups. |
Comparison of the Subgroups Regarding the Fasting ANGPTL4 Level
The AUC regarding TC, TG, LDL-C, TRL-C, non-HDL-C, and ApoB in group 3 was higher than that in group 1 (P < 0.05). Additionally, the AUC regarding TRL-C in group 3 was higher than that in group 2 (P < 0.05), and the AUC regarding TG, TRL-C, non-HDL-C, and ApoB in group 2 was higher than that in group 1 (P < 0.05) (Figures 4 and 5).
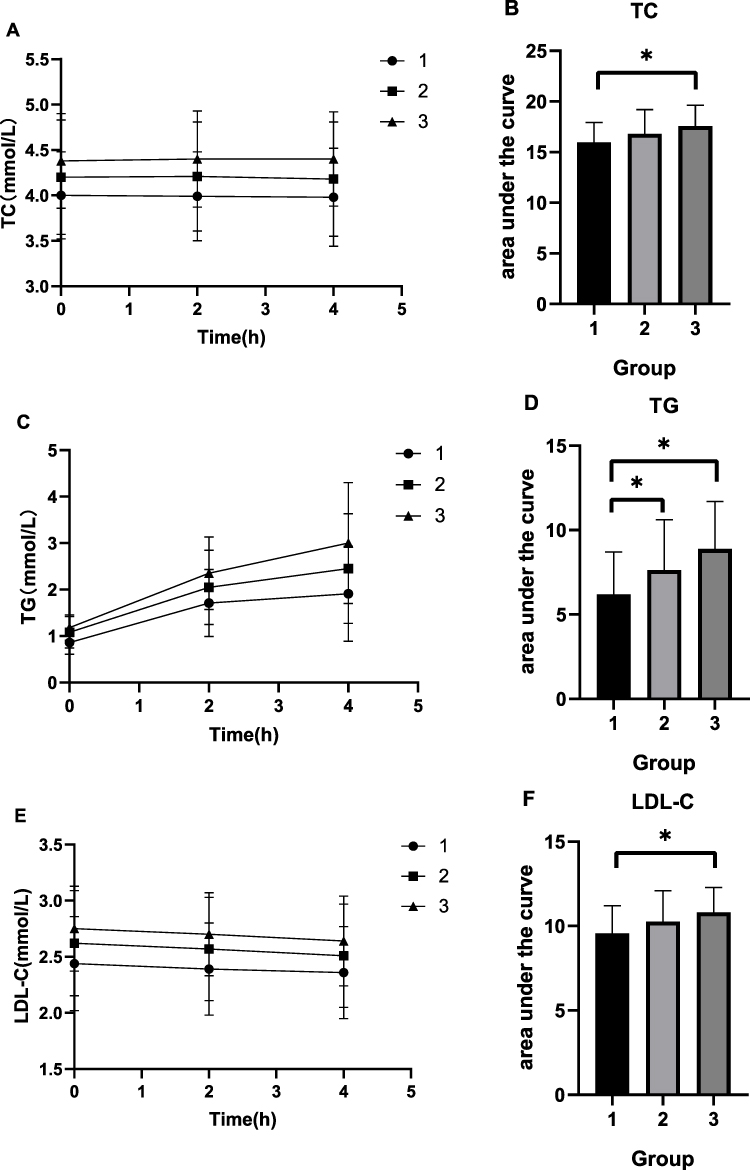 |
Figure 4 Changes in lipid levels and AUC of lipid after a high-fat diet in the three groups. (A) TC. (B) AUC of TC. (C) TG. (D) AUC of TG. (E) LDL-C. (F) AUC of LDL-C. Abbreviations: AUC area under the curve; TC total cholesterol; TG triglyceride; LDL-C low-density lipoprotein cholesterol. Notes: *P<0.05 indicates a difference in AUC between the two groups. |
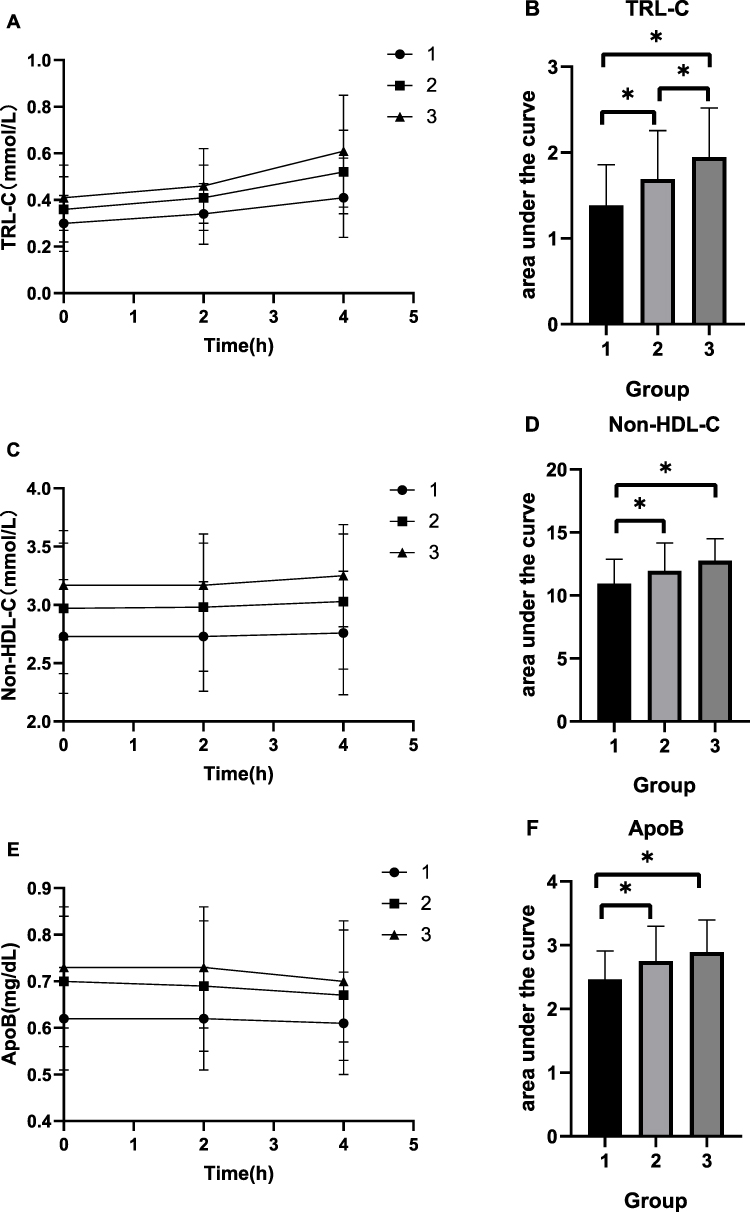 |
Figure 5 Changes in lipid levels and AUC of lipid after a high-fat diet in the three groups. (A) TRL-C. (B) AUC of TRL-C. (C) Non-HDL-C. (D) AUC of Non-HDL-C. (E) ApoB. (F) AUC of ApoB. Abbreviations: AUC area under the curve; TRL-C triglyceride-rich lipoprotein cholesterol; Non-HDL-C non-high-density lipoprotein cholesterol; ApoB apolipoprotein B. Notes: *P<0.05 indicates a difference in AUC between the two groups. |
Comparison of the Subgroups Regarding the Fasting ANGPTL8 Level
The AUC regarding TG in group 3 was higher than that in group 1 (P < 0.05), however, there were no significant differences in the other indicators (Figure 6).
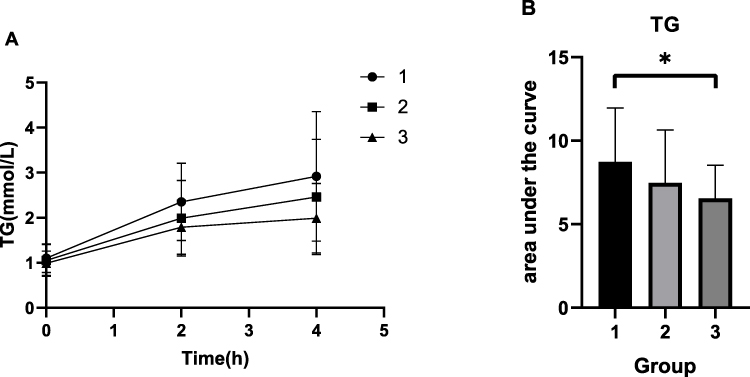 |
Figure 6 Changes in lipid levels and AUC of lipid after a high-fat diet in the three groups. (A) TG. (B) AUC of TG. Abbreviation: AUC area under the curve; TG triglyceride. Notes: *P<0.05 indicates a difference in AUC between the two groups. |
Binary Logistic Regression Analysis
Using PPT as the dependent variable, we conducted a binary logistic regression analysis to examine the association between the fasting levels of ANGPTL3, ANGPTL4, and ANGPTL8 and PPT (Table 4). After adjusting for age, gender, BMI, WC, SBP, and DBP, it was determined that fasting ANGPTL3 and ANGPTL4 levels were positively correlated with PPT (OR: 1.018 [0.981–1.056], P = 0.349 and OR: 1.027 [1.014–1.041], P < 0.001, respectively). Conversely, fasting ANGPTL8 levels were negatively correlated with PPT (OR: 0.995 [0.993–0.998], P = 0.001).
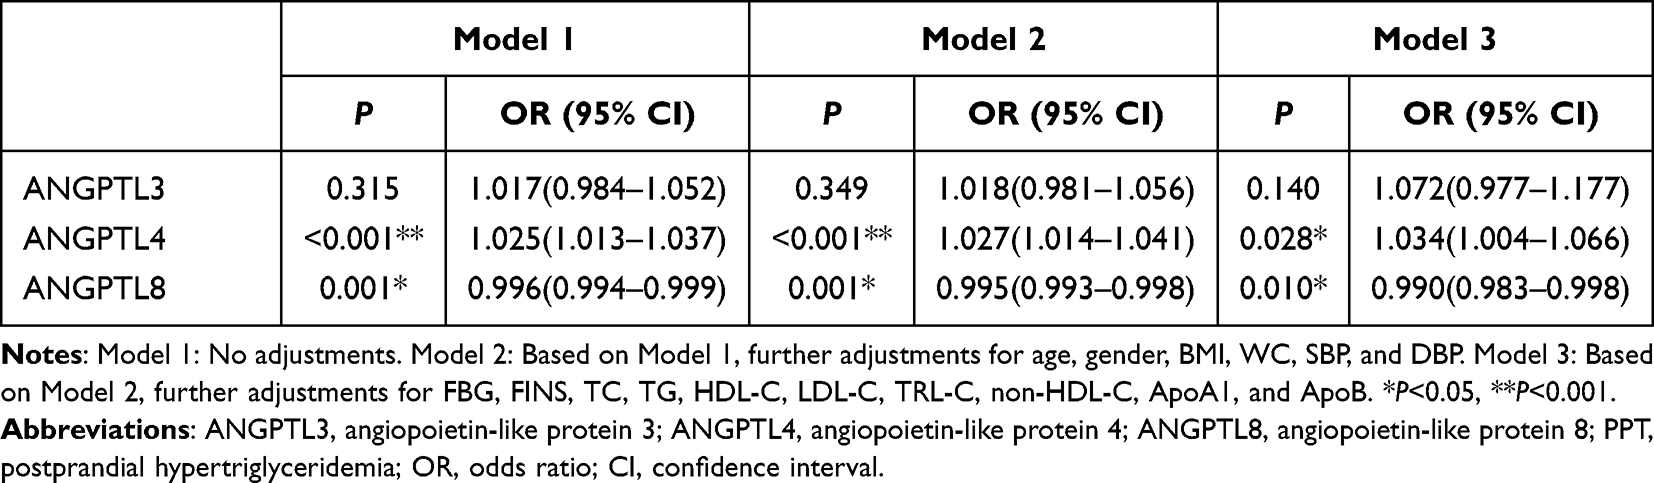 |
Table 4 Logistic Regression Analysis of Fasting ANGPTL3, ANGPTL4, ANGPTL8 and PPT |
After adjusting for FBG, FINS, TC, TG, HDL-C, LDL-C, TRL-C, non-HDL-C, ApoA1, and ApoB, fasting ANGPTL3 and ANGPTL4 levels exhibited positive correlations with PPT (OR: 1.072 [0.977–1.177], P = 0.140 and OR:1.034 [1.004–1.066], P = 0.028, respectively). Conversely, fasting ANGPTL8 levels were negatively correlated with PPT (OR: 0.990 [0.983–0.998], P = 0.010). Accordingly, ANGPTL4 and ANGPTL8 were independent factors contributing to PPT (P < 0.05).
Discussion
In this study, individuals with normal fasting blood lipid and OGTT test results were included. This minimized the interference of glucose metabolism and lipid metabolism disorders in the fasting state and avoided the impact of postprandial hyperglycemia on postprandial blood lipids. We found that while the fasting blood lipid levels of the participants were within the normal range, their postprandial markers varied. This suggests that there may be a disturbance in TG metabolism, resulting in elevated postprandial TG and TRL-C levels, even when some individuals have normal fasting TG levels. This condition is known as PPT. Our results demonstrated that ANGPTL4 and ANGPTL8 are independent factors influencing PPT. There was a significant difference in the AUC regarding the blood lipid indices among the three groups with varying levels of fasting ANGPTL4. Additionally, ANGPTL3, ANGPTL4, and ANGPTL8 exhibited distinct correlations with other biomarkers, indicating that the ANGPTL family, particularly ANGPTL4, plays a crucial role in postprandial lipid metabolism.
ANGPTL3, a hepatocyte-derived inhibitor of LPL, has emerged as a promising therapeutic target for lowering lipid levels. It has been reported that deletion mutations regarding the ANGPTL3 gene are linked to decreased levels of blood lipids.15,16 In this study, we found no significant differences in the ANGPTL3 levels between the groups. However, the ANGPTL3 levels in the PPT group exhibited a slow upward trend after high-fat meal consumption. Additionally, the fasting ANGPTL3 levels exhibited a positive correlation with age, TC, HDL-C, TRL-C, and ApoA1 while being negatively correlated with SBP and exhibiting no correlation with other lipid indices. This finding may be explained by the study population. ANGPTL3 affects lipid deposition in tissues primarily by inhibiting LPL, liver lipase, and endothelial lipase (EL), ultimately influencing lipid levels.17 Moreover, ANGPTL3’s inhibition of EL can affect the expression of HDL phospholipids,18,19 resulting in reduced levels of HDL-C. Because ApoA1 is the main structural component of HDL,20 its levels change accordingly. Our study also determined that ANGPTL3 levels are correlated with age and blood pressure, although the exact mechanism remains unclear and requires further investigation.
ANGPTL4 is primarily expressed in both white and brown adipose tissues.21 It inhibits LPL activity, which regulates the hydrolysis of TGs.22 Studies have reported increased LPL activity and decreased plasma TG levels in ANGPTL4 gene-deficient mice.23 In human lipid metabolism, studies have further confirmed that carriers of ANGPTL4 loss mutations have lower plasma TG levels.24,25 In this study, there were significant differences regarding the fasting ANGPTL4 levels between the two groups. The ANGPTL4 levels in the PPT group exhibited an upward trend with the time of consuming the high-fat meal. Additionally, the fasting ANGPTL4 levels were positively associated with fasting TC, TG, LDL-C, TRL-C, non-HDL-C, ApoB, blood glucose, and insulin levels, and negatively correlated with ApoA1/ApoB levels. These results are different from those from previous studies, suggesting the presence of other factors. It has been reported that ANGPTL4 may alter the intestinal microbiota, affecting insulin sensitivity and glucose metabolism.26 This may be a possible reason why the ANGPTL4 level was associated with weight, BMI, WC, FBG, FINS, and other metabolic indicators in this study. It also shows that ANGPTL4 plays a role in metabolic diseases.
In addition to acting independently, ANGPTL3 and ANGPTL4 can also form complexes with ANGPTL8 to fulfill varying functions.27 ANGPTL8 may facilitate the degradation of ANGPTL4 in adipose tissues,28 potentially explaining the negative correlation observed between fasting ANGPTL8 and ANGPTL4 levels in this study. It has been reported that ANGPTL8 and its complex in human serum are significantly positively correlated with TGs.29 However, we did not assess changes in the levels of complex, thus, this requires further research. A study involving adult women found a positive correlation between ANGPTL8 levels and TG, LDL-C, and TG/HDL-C.30 However, in a study by Gómez, the ANGPTL8 level was negatively correlated with the fasting TG level.31 This may be attributed to a reduction in the ANGPTL8 levels due to the exacerbation of hyperlipidemia, which serves as a compensatory mechanism for decreasing lipoprotein levels. Additionally, previous studies have indicated that the levels of ANGPTL8 were positively correlated with FBG and HbA1c.32,33 However, in this study, no correlation was found between ANGPTL8 and the glucose metabolism markers. Therefore, further investigations are required to determine the precise regulatory mechanisms.
However, this study had some limitations. Firstly, due to the complex metabolic regulation of TRL-C, other factors (not assessed in this study) may interfere with the correlation between ANGPTL3, ANGPTL4, ANGPTL8, and TRL-C. Additionally, the sample size was very small and may not have accurately reflected the conditions surrounding lipid metabolism.
Conclusion
Our study showed that ANGPTL3, ANGPTL4, and ANGPTL8 are closely associated with postprandial lipid and glucose metabolism. Thus, these proteins can serve as novel markers for postprandial lipid detection and targeted drug therapy. However, further research is required to determine the specific functions and mechanisms of the ANGPTL family in glucose and lipid metabolism.
Abbreviations
ANGPTLs, angiopoietin-like proteins; PPT, postprandial hypertriglyceridemia; PNT, postprandial normal triglycerides; OFTT, oral fat tolerance test; OGTT, oral glucose tolerance test; ELISA, Enzyme-linked immunosorbent assay; BMI, body mass index; WC, waist circumference; TC, total cholesterol; TG, triglyceride; LDL-C, low-density lipoprotein cholesterol; TRL-C, triglyceride-rich lipoprotein cholesterol; non-HDL-C, non-high-density lipoprotein cholesterol; ApoA1, apolipoprotein A1; ApoB, apolipoprotein B; FBG, fasting blood glucose; FINS, fasting insulin; TRL, triglyceride-rich lipoprotein; LPL, lipoprotein lipase.
Data Sharing Statement
The datasets generated and/or analyzed during this study are not publicly available due to their containing that could compromise the privacy of the research participants but are available from the corresponding author on reasonable request.
Acknowledgments
We deeply appreciate the instructors at the Clinical Medical Research Centre of Hebei General Hospital for their help with this study. We appreciate Editage (www.editage.cn) for English language editing.
Ethics Approval and Informed Consent
This study was approved by the Ethics Committee of Hebei General Hospital (No: 2020-01). All participants signed informed consent. This study was conducted in accordance with the Declaration of Helsinki.
Funding
This study was supported by the Research Fund of Hebei Provincial Government.
Disclosure
The authors have no relevant financial or non-financial interests to disclose.
References
1. Li Z, Zhu G, Chen G, et al. Distribution of lipid levels and prevalence of hyperlipidemia: data from the NHANES 2007–2018. Lipids Health Dis. 2022;21(1):111. doi:10.1186/s12944-022-01721-y
2. Hirano T. Pathophysiology of Diabetic Dyslipidemia. J Atheroscler Thromb. 2018;25(9):771–782. doi:10.5551/jat.RV17023
3. Sciarrillo CM, Koemel NA, Keirns BH, et al. Who would benefit most from postprandial lipid screening? Clin Nutr. 2021;40(7):4762–4771. doi:10.1016/j.clnu.2021.04.022
4. Vergès B. Intestinal lipid absorption and transport in type 2 diabetes. Diabetologia. 2022;65(10):1587–1600. doi:10.1007/s00125-022-05765-8
5. Sylvers-Davie KL, Davies BSJ. Regulation of lipoprotein metabolism by ANGPTL3, ANGPTL4, and ANGPTL8. Am J Physiol Endocrinol Metab. 2021;321(4):E493–E508. doi:10.1152/ajpendo.00195.2021
6. Chan DC, Pang J, Romic G, Watts GF. Postprandial hypertriglyceridemia and cardiovascular disease: current and future therapies. Curr Atheroscler Rep. 2013;15(3):309. doi:10.1007/s11883-013-0309-9
7. Bai Y, Lu D, Qu D, et al. The role of ANGPTL gene family members in hepatocellular carcinoma. Dis Markers. 2022;2022:1844352. doi:10.1155/2022/1844352
8. Carbone C, Piro G, Merz V, et al. Angiopoietin-like proteins in angiogenesis, inflammation and cancer. Int J Mol Sci. 2018;19(2):431. doi:10.3390/ijms19020431
9. Chen P-Y, Gao W-Y, Liou J-W, Lin C-Y, M-J W, Yen J-H. Angiopoietin-like protein 3 (ANGPTL3) modulates lipoprotein metabolism and dyslipidemia. Int J Mol Sci. 2021;22:14.
10. Luo F, Das A, Khetarpal SA, et al. ANGPTL3 inhibition, dyslipidemia, and cardiovascular diseases. Trends Cardiovasc Med. 2023. doi:10.1016/j.tcm.2023.01.008
11. Zhao Z, Deng X, Jia J, et al. Angiopoietin-like protein 8 (betatrophin) inhibits hepatic gluconeogenesis through PI3K/Akt signaling pathway in diabetic mice. Metabolism. 2022;126:154921. doi:10.1016/j.metabol.2021.154921
12. Hou X, Guan Y, Tang Y, et al. A correlation study of the relationships between nonalcoholic fatty liver disease and serum triglyceride concentration after an oral fat tolerance test. Lipids Health Dis. 2021;20(1):54. doi:10.1186/s12944-021-01483-z
13. Hu DY. New guidelines and evidence for the prevention and treatment of dyslipidemia and atherosclerotic cardiovascular disease in China. Zhonghua Xin Xue Guan Bing Za Zhi. 2016;44(10):826–827. doi:10.3760/cma.j.issn.0253-3758.2016.10.002
14. Kolovou GD, Watts GF, Mikhailidis DP, et al. Postprandial hypertriglyceridaemia revisited in the era of non-fasting lipid profile testing: a 2019 expert panel statement, main text. Curr Vasc Pharmacol. 2019;17(5):498–514. doi:10.2174/1570161117666190507110519
15. Qiu M, Glass Z, Chen J, et al. Lipid nanoparticle-mediated codelivery of Cas9 mRNA and single-guide RNA achieves liver-specific in vivo genome editing of Angptl3. Proc Natl Acad Sci U S A. 2021;118(10). doi:10.1073/pnas.2020401118
16. Arca M, D’Erasmo L, Minicocci I. Familial combined hypolipidemia: angiopoietin-like protein-3 deficiency. Curr Opin Lipidol. 2020;31(2):41–48. doi:10.1097/MOL.0000000000000668
17. Akoumianakis I, Zvintzou E, Kypreos K, Filippatos TD. ANGPTL3 and Apolipoprotein C-III as Novel Lipid-Lowering Targets. Curr Atheroscler Rep. 2021;23(5):20. doi:10.1007/s11883-021-00914-7
18. Ling P, Zheng X, Luo S, Ge J, Xu S, Weng J. Targeting angiopoietin-like 3 in atherosclerosis: from bench to bedside. Diabetes Obes Metab. 2021;23(9):2020–2034. doi:10.1111/dom.14450
19. Dewey FE, Gusarova V, Dunbar RL, et al. Genetic and Pharmacologic Inactivation of ANGPTL3 and Cardiovascular Disease. N Engl J Med. 2017;377(3):211–221. doi:10.1056/NEJMoa1612790
20. Mehta A, Shapiro MD. Apolipoproteins in vascular biology and atherosclerotic disease. Nat Rev Cardiol. 2022;19(3):168–179. doi:10.1038/s41569-021-00613-5
21. Aryal B, Price NL, Suarez Y, Fernández-Hernando C. ANGPTL4 in Metabolic and Cardiovascular Disease. Trends Mol Med. 2019;25(8):723–734. doi:10.1016/j.molmed.2019.05.010
22. Ploug M. ANGPTL4: a new mode in the regulation of intravascular lipolysis. Curr Opin Lipidol. 2022;33(2):112–119. doi:10.1097/MOL.0000000000000800
23. Cushing EM, Chi X, Sylvers KL, Shetty SK, Potthoff MJ, Davies BSJ. Angiopoietin-like 4 directs uptake of dietary fat away from adipose during fasting. Mol Metab. 2017;6(8):809–818. doi:10.1016/j.molmet.2017.06.007
24. Stitziel NO, Stirrups KE, Masca NGD, et al. Coding Variation in ANGPTL4, LPL, and SVEP1 and the risk of coronary disease. N Engl J Med. 2016;374(12):1134–1144.
25. Ruscica M, Zimetti F, Adorni MP, Sirtori CR, Lupo MG, Ferri N. Pharmacological aspects of ANGPTL3 and ANGPTL4 inhibitors: new therapeutic approaches for the treatment of atherogenic dyslipidemia. Pharmacol Res. 2020;153:104653. doi:10.1016/j.phrs.2020.104653
26. Zheng X, Liu R, Zhou C, et al. ANGPTL4-mediated promotion of glycolysis facilitates the colonization of Fusobacteriumnucleatum in colorectal cancer. Cancer Res. 2021;81(24):6157–6170. doi:10.1158/0008-5472.CAN-21-2273
27. Zhen EY, Chen YQ, Russell AM, et al. Angiopoietin-like protein 4/8 complex-mediated plasmin generation leads to cleavage of the complex and restoration of LPL activity. Proc Natl Acad Sci U S A. 2023;120(7):e2214081120. doi:10.1073/pnas.2214081120
28. Oldoni F, Cheng H, Banfi S, Gusarova V, Cohen JC, Hobbs HH. ANGPTL8 has both endocrine and autocrine effects on substrate utilization. JCI Insight. 2020;5(17). doi:10.1172/jci.insight.138777
29. Chen YQ, Pottanat TG, Siegel RW, et al. Angiopoietin-like protein 8 differentially regulates ANGPTL3 and ANGPTL4 during postprandial partitioning of fatty acids. J Lipid Res. 2020;61(8):1203–1220. doi:10.1194/jlr.RA120000781
30. Stefanska A, Bergmann K, Krintus M, Kuligowska-Prusinska M, Murawska K, Sypniewska G. Serum ANGPTL8 and ANGPTL3 as predictors of triglyceride elevation in adult women. Metabolites. 2022;12(6):539. doi:10.3390/metabo12060539
31. Gómez-Ambrosi J, Pascual E, Catalán V, et al. Circulating betatrophin concentrations are decreased in human obesity and type 2 diabetes. J Clin Endocrinol Metab. 2014;99(10):E2004–E2009. doi:10.1210/jc.2014-1568
32. Ebert T, Kralisch S, Hoffmann A, et al. Circulating angiopoietin-like protein 8 is independently associated with fasting plasma glucose and type 2 diabetes mellitus. J Clin Endocrinol Metab. 2014;99(12):E2510–E2517. doi:10.1210/jc.2013-4349
33. Lee Y-H, Lee S-G, Lee CJ, et al. Association between betatrophin/ANGPTL8 and non-alcoholic fatty liver disease: animal and human studies. Sci Rep. 2016;6:24013. doi:10.1038/srep24013
 © 2023 The Author(s). This work is published and licensed by Dove Medical Press Limited. The
full terms of this license are available at https://www.dovepress.com/terms
and incorporate the Creative Commons Attribution
- Non Commercial (unported, 3.0) License.
By accessing the work you hereby accept the Terms. Non-commercial uses of the work are permitted
without any further permission from Dove Medical Press Limited, provided the work is properly
attributed. For permission for commercial use of this work, please see paragraphs 4.2 and 5 of our Terms.
© 2023 The Author(s). This work is published and licensed by Dove Medical Press Limited. The
full terms of this license are available at https://www.dovepress.com/terms
and incorporate the Creative Commons Attribution
- Non Commercial (unported, 3.0) License.
By accessing the work you hereby accept the Terms. Non-commercial uses of the work are permitted
without any further permission from Dove Medical Press Limited, provided the work is properly
attributed. For permission for commercial use of this work, please see paragraphs 4.2 and 5 of our Terms.
Recommended articles
Serum Fibroblast Growth Factor 21 Level After an Oral Fat Tolerance Test is Related to Postprandial Free Fatty Acid Level
Li X, Zheng K, Gu W, Hou X, Guan Y, Liu L, Hou L, Geng J, Song G
Diabetes, Metabolic Syndrome and Obesity 2023, 16:1567-1576
Published Date: 1 June 2023
Distribution of Arteriosclerotic Vessels in Patients with Arteriosclerosis and the Differences of Serum Lipid Levels Classified by Different Sites
Xu W, Wang Z, Yao H, Zeng Z, Lan X
International Journal of General Medicine 2024, 17:4733-4744
Published Date: 16 October 2024