Back to Journals » Vascular Health and Risk Management » Volume 22
Serum Albumin Level Predicts Systemic Arterial Stiffening Mediated Partially by Change in Lean Body Mass: A Retrospective Cohort Study in General Japanese Population
Authors Nagayama D ![]() , Horikawa O
, Horikawa O ![]() , Watanabe Y, Fujishiro K
, Watanabe Y, Fujishiro K ![]() , Suzuki K, Ohira M
, Suzuki K, Ohira M ![]() , Shirai K, Saiki A
, Shirai K, Saiki A
Received 19 March 2026
Accepted for publication 4 June 2026
Published 10 June 2026 Volume 2026:22 610441
DOI https://doi.org/10.2147/VHRM.S610441
Checked for plagiarism Yes
Review by Single anonymous peer review
Peer reviewer comments 2
Editor who approved publication: Dr Konstantinos Tziomalos
Daiji Nagayama,1,2 Osamu Horikawa,2 Yasuhiro Watanabe,2 Kentaro Fujishiro,3 Kenji Suzuki,3 Masahiro Ohira,4 Kohji Shirai,5 Atsuhito Saiki2
1Department of Internal Medicine, Nagayama Clinic, Oyama-City, Tochigi, 323-0032, Japan; 2Center of Diabetes, Endocrinology and Metabolism, Toho University, Sakura Medical Center, Sakura-City, Chiba, 285-0841, Japan; 3Japan Health Promotion Foundation, Shibuya-Ku, Tokyo, 150-0013, Japan; 4Division of Diabetes, Metabolism and Endocrinology, Toho University, Ohashi Medical Center, Meguro-Ku, Tokyo, 153-8515, Japan; 5Department of Internal Medicine, Mihama Hospital, Chiba-City, Chiba, 261-0013, Japan
Correspondence: Daiji Nagayama, Department of Internal Medicine, Nagayama Clinic, 2-12-22 Tenjin-Cho, Oyama-City, Tochigi, 323-0032, Japan, Tel +81 285 22 0219, Fax +81 285 22 0219, Email [email protected]
Background and Aim: Serum albumin level (albumin) is inversely associated with the risk of cardiovascular disease (CVD) mortality. Additionally, the decline in lean body mass partially mediates the age-related vascular dysfunction. We aimed to clarify the interaction between albumin, lean body mass and vascular function in the general Japanese population.
Methods: This study analyzed three-year longitudinal data (n=5,253) obtained from Japanese urban residents receiving consecutive annual health screenings. Participants with a history of CVD and/or any chronic wasting diseases were excluded. Skeletal muscle mass was assessed using estimated lean body mass index (eLBMI). Systemic arterial stiffness was assessed using the cardio-ankle vascular index (CAVI), with high CAVI defined as CAVI ≥ 9.0.
Results: Among serum protein parameters, albumin showed a stronger inverse correlation with CAVI (r = − 0.191) compared to total protein and albumin/globulin ratio. Age correlated positively with CAVI and negatively with albumin. In multiple regression analysis, 1 standard deviation increase in albumin was negatively associated with high CAVI (odds ratio = 0.78), independent of aging and traditional CVD risk factors. Jonckheere-Terpstra trend test revealed a significant inverse trend in change in CAVI over three years (ΔCAVI) among the stratified baseline albumin groups, whereas no significant trend was observed among the stratified age groups. Baseline albumin was negatively associated with ΔCAVI, which was partially mediated by ΔeLBMI after adjusting for age (mediation rate, 3.4%).
Conclusion: As serum albumin level predicts CAVI mediated by changes in lean body mass, appropriate nutrition management aimed at enhancing skeletal muscle mass may be useful for reliable prevention of CVD.
Keywords: serum albumin level, lean body mass, arterial stiffness, cardio-ankle vascular index
Introduction
Vascular aging is characterized by progressive structural and functional changes in blood vessels, increasing systemic arterial stiffness (arterial stiffening) and risk of cardiovascular disease (CVD).1 Pulse wave velocity (PWV) has been widely utilized as a standard tool to assess vascular function.2 However, PWV is essentially affected by blood pressure (BP) at the time of measurement,3 and thus may underestimate the degree of vascular dysfunction caused by CVD risk factors other than hypertension. Cardio-ankle vascular index (CAVI) has been developed to solve this issue.4 CAVI, which reflects the stiffness of the arterial tree from the aortic origin to the ankle without being affected by BP at the time of measurement, has been established as an index of vascular function. This arterial stiffness parameter is associated with traditional CVD risk factors including metabolic disorders, abdominal obesity, sleep apnea, smoking and psychological stress.5 Additionally, a study has indicated that even sarcopenia, characterized by a decrease in muscle quality and/or quantity, is associated with vascular dysfunction as assessed by CAVI.6 On the other hand, the primary factor determining CAVI is age. A study of healthy Japanese urban residents showed a linear positive correlation between age and CAVI, with an increase in CAVI of nearly 0.5 per decade.7 Furthermore, we have previously reported that the age-related CAVI increase is associated with decrease in lean body mass, a surrogate for skeletal muscle mass.8 In fact, low skeletal muscle mass is known to be associated with the presence, incidence and progression of coronary artery calcification, independently of conventional cardiometabolic risks.9
Age-related physiological changes include not only arterial stiffening, but also deterioration of nutritional state as indicated by serum protein parameters. For example, serum albumin level tends to be low in older individuals, and a longitudinal study has reported that albumin level declines further with aging10 serum protein parameters not only indirectly reflect muscle strength11 and immune function,12 but also serve as prognostic predictor.13 In particular, albumin is known to exert anti-atherosclerotic effects including anti-inflammatory, antioxidant and anti-coagulant activities.14 Furthermore, a cross-sectional study in dialysis patients demonstrated that albumin was independently associated with vascular dysfunction indicated by increased CAVI.15 Based on data from the National Health and Nutrition Examination Survey, serum albumin levels in patients with CVD were found to be inversely correlated with all-cause mortality and the risk of cardiovascular mortality.16,17
On the other hand, albumin serves as a marker of hepatic protein synthesis capacity,18 while its association with skeletal muscle mass is also gaining attention. A cross-sectional study revealed that albumin was associated with skeletal muscle mass, independent of age, protein intake and physical activity level,19 while a longitudinal study showed that relatively higher albumin level predicted a stronger effect of resistance training on muscle hypertrophy.20 However, it remains unclear how serum protein parameters and skeletal muscle mass interact to affect changes in vascular function independent of aging. We therefore hypothesized that the association between circulating protein markers and subsequent vascular function may be mediated, at least in part, by changes in skeletal muscle mass. Elucidating this potential mediating pathway could provide a novel, nutrition-based strategy for anti-atherosclerotic intervention.
Against this background, this study investigated the association between serum protein parameters and CAVI, considering lean body mass in the analysis. First, we examined the correlation between serum protein parameters and clinical variables, particularly identifying the serum protein parameter most strongly associated with CAVI. Next, we conducted a longitudinal analysis adjusting for age, to assess the impact of the serum protein parameter on changes in both lean body mass and CAVI over three years.
Materials and Methods
Study Population and Design
This study was a retrospective cohort study using data from the CVD and cancer screening program conducted by the Japan Health Promotion Foundation; since it utilizes data from routine health screenings, the sample is a convenience sample. The study population comprised Japanese urban residents of major Japanese cities who underwent annual health screening between 2013 and 2018. The health screening centers and branches of the Japan Health Promotion Foundation are located in Ebisu, Shibuya Ward, Tokyo (Ebisu Health Screening Center) and in Chuo Ward, Osaka City, Osaka Prefecture (Osaka Health Screening Center). Approximately 90% of the participants resided in major metropolitan areas in the Kanto or Kansai regions. However, about 10% of the participants underwent health checkups in various cities throughout Japan, from Hokkaido to Okinawa, using these centers as primary referral bases. The participants were volunteers who were not paid or recruited specifically for this study.
We excluded individuals with a history of cerebrovascular disease, cirrhosis, nephrotic syndrome, chronic inflammatory disease, and/or malignant neoplasms, those younger than 20 years, and individuals with disabilities who were unable to provide informed consent. This is because these wasting diseases can cause rapid changes in nutritional status over a short period of time. All other adults aged 20 years or older who were capable of expressing their own will were included, even if they had a current history of metabolic disorders. Initially, we assessed the eligibility of all 76,720 participants. Of these, 34,697 individuals (45.2%) attended two consecutive examinations, and 14,405 individuals (18.8%) attended three consecutive examinations. Ultimately, 5,986 individuals (7.8%) who attended four annual (ie, three-year) screenings and for whom sufficient data were available were included in the analysis. To address the potential impact on serum protein parameters including total protein (TP) and albumin, 733 individuals who met the aforementioned exclusion criteria were excluded. Ultimately, 5,253 individuals (6.8%) were recruited for the study.
Data Collection
All examinations and data entry were performed by professionally trained technicians affiliated with the Japan Health Promotion Foundation. We used a standardized data extraction template that had been iteratively refined and pilot-tested by experienced staff before the main analysis. This template was applied to all Excel files derived from the health checkup database to ensure consistent variable definitions, coding, and data structure across the dataset.
Height and body weight were measured, and body mass index (BMI) was calculated as Weight (kg)/Height (m) squared. According to the guidelines of the Japanese Association for the Study of Obesity (JASSO), obesity was defined as BMI 25 kg/m2 or higher.21 Waist circumference (WC) was measured horizontally at the height of the umbilicus, with the individual standing with arms hanging relaxed. High WC was defined as 85 cm or more for men and 90 cm or more for women, according to the Japanese Committee for the Diagnostic Criteria of Metabolic Syndrome.22 Lean body mass includes the weights of organs, skin, bones, body fluids, ligaments, and tendons in addition to skeletal muscle mass, but strongly approximates skeletal muscle mass.23 A narrative review reported that skeletal muscle mass measured by dual-energy X-ray absorptiometry (DXA) showed a strong correlation of 0.91 or higher with lean body mass.24 We therefore adopted lean body mass estimated using several anthropometric measurements as a surrogate indicator for skeletal muscle mass. The following equations were used to estimate lean body mass: Estimated lean body mass index (eLBMI)25 = [19.363 + 0.001 × Age (years) + 0.064 × Height (cm) + 0.756 × Weight (kg) − 0.366 × WC (cm) − 1.007]/Height (m)2 for males, [−10.683 − 0.039 × Age (years) + 0.186 × Height (cm) + 0.383 × Weight (kg) − 0.047 × WC (cm) – 0.34]/Height (m)2 for females.
According to the original report, the coefficients of determination of the eLBMI equations for predicting DXA-measured LBM are 0.91 for men and 0.85 for women.
BP was measured from an upper arm cuff after resting for five minutes in a sitting position. Hypertension was diagnosed by either systolic BP (SBP) ≥ 140 mmHg and diastolic BP ≥ 90 mmHg, or treatment with BP-lowering agents. Blood was collected from an anterior upper extremity vein in the morning after a 12-h fast for measuring fasting plasma glucose (FPG, mg/dL), total cholesterol (TC, mg/dL), triglycerides (TG, mg/dL) and high-density lipoprotein cholesterol (HDL-C, mg/dL). Diabetes mellitus was diagnosed when FPG was ≥ 126 mg/dL, or when the participant was on antidiabetic drugs. Dyslipidemia was defined as TC ≥ 220 mg/dL, HDL-C < 40 mg/dL, and/or TG ≥ 150 mg/dL, or treatment with lipid-lowering drugs.
The following three serum protein parameters were studied: TP level, Albumin/Globulin ratio (A/G ratio) and albumin level. The A/G ratio was calculated from TP and albumin using the following formula:26 A/G ratio = Albumin/(TP – Albumin).
Estimated glomerular filtration rate (eGFR) was calculated using the following formula developed by the Japanese Society of Nephrology:27
eGFR (mL/min per 1.73 m2) = 194 × Creatinine (mg/dL)−1.094 × Age (years)−0.287 (× 0.739 if female). Kidney dysfunction was defined as eGFR below 60 mL/min/1.73 m2, corresponding to GFR category 3a or worse.28 The prevalence of current smoking and habitual alcohol consumption was determined using a questionnaire. Alcohol consumption at least once a week was defined as habitual drinking.
Measurement of Arterial Stiffness Parameters and Blood Pressure
CAVI was measured after the participants had rested for at least 5 minutes. With the participants lying in a supine position on a bed, BP, pulse rate and CAVI were measured twice. CAVI was measured using the VaSera VS-1500 device (Fukuda Denshi Co, Ltd., Tokyo, Japan) according to the manufacturer’s instructions. This index was originally derived from the stiffness parameter β, proposed by Hayashi et al29 and was applied to a length of artery using a modified version of Bramwell Hill’s equation.30
CAVI values were automatically calculated using the following formula 4:
CAVI = a{2ρ × ln(Ps/Pd)/ΔP × haPWV2} + b,
where Ps is systolic BP; Pd is diastolic BP; ΔP is Ps ‒ Pd; ρ is blood density; haPWV denotes heart-ankle PWV; and a and b are constants to adjust the values of CAVI to those of Hasegawa’s PWV.
Individuals with ankle-brachial index < 0.90 were excluded from analysis, because patients with severe arterial occlusive disease may have falsely low CAVI.4 In addition, we defined “high CAVI” as equal to or greater than 9.0 in all individuals, which is essentially the cutoff for the presence of coronary artery stenosis.5
Dependent and Independent Variables
We defined the ΔCAVI as the dependent variable. Independent variables included factors that showed significant differences between the high CAVI and non-high CAVI groups in univariate analyses, namely age, sex, smoking status, and the presence of hypertension, diabetes mellitus, and dyslipidemia. In addition, kidney dysfunction and serum protein parameters were included as covariates based on their clinical relevance.
Statistical Analysis
The SPSS software (version 27.0.1, Chicago, IL, USA) was used for statistical analyses. Data are expressed as median (interquartile range), mean ± standard deviation (SD) or mean ± standard error (SE). Fisher’s exact test was performed to compare the proportions between two groups. Since several continuous variables showed markedly skewed distributions and extreme values in exploratory analyses, we chose the Mann–Whitney U-test (non-parametric test) for between-group comparisons, rather than the t test, which assumes approximate normality. Pearson’s correlation coefficient (r) and its 95% confidence interval (95% CI) were calculated to assess the linear relationship between serum protein parameters and clinical variables. The difference between two variables was considered statistically significant if 95% CIs for the correlation coefficients did not overlap. We stratified participants by baseline age or albumin level and analyzed three-year changes in CAVI (ΔCAVI) or eLBMI (ΔeLBMI) using Jonckheere-Terpstra trend test followed by Bonferroni multiple comparison test. The relationship of high CAVI with clinical variables including albumin level was analyzed using logistic regression analysis. In the model, albumin as a continuous variable was converted to SD, and other clinical confounding factors were binarized. A mediation analysis was carried out using PROCESS (version 4.0) in SPSS.31 To establish the presence of mediation, the total effect must be significant. Partial mediation exists when both the indirect and direct effects are significant. The mediation rate (%) explains the contribution of mediation to the total effect and is calculated using the following formula: indirect effect/total effect × 100. In all comparisons, two-sided p values less than 0.05 were considered statistically significant.
Results
Comparison of Clinical Characteristics in Participants with vs Without High CAVI
The baseline characteristics (median [IQR]) of the 76,720 individuals who initially met the eligibility criteria were as follows; Age (years): 42 (34, 54), BMI (kg/m2): 21.7 (19.8, 24.0), CAVI: 7.3 (6.8, 9.0), Male ratio: 41.7%. In contrast, the characteristics of the 5,253 individuals ultimately selected were as follows; Age: 43 (36, 54), BMI: 22.3 (20.2, 24.5), CAVI: 7.5 (6.9, 8.2), Male ratio: 60.7%. In other words, the proportion of male participants increased after the selection process for this study. Table 1 compares the baseline clinical characteristics in participants with high CAVI (CAVI ≥ 9.0) and those without. Furthermore, the clinical characteristics of total participants after three years were compared with baseline.
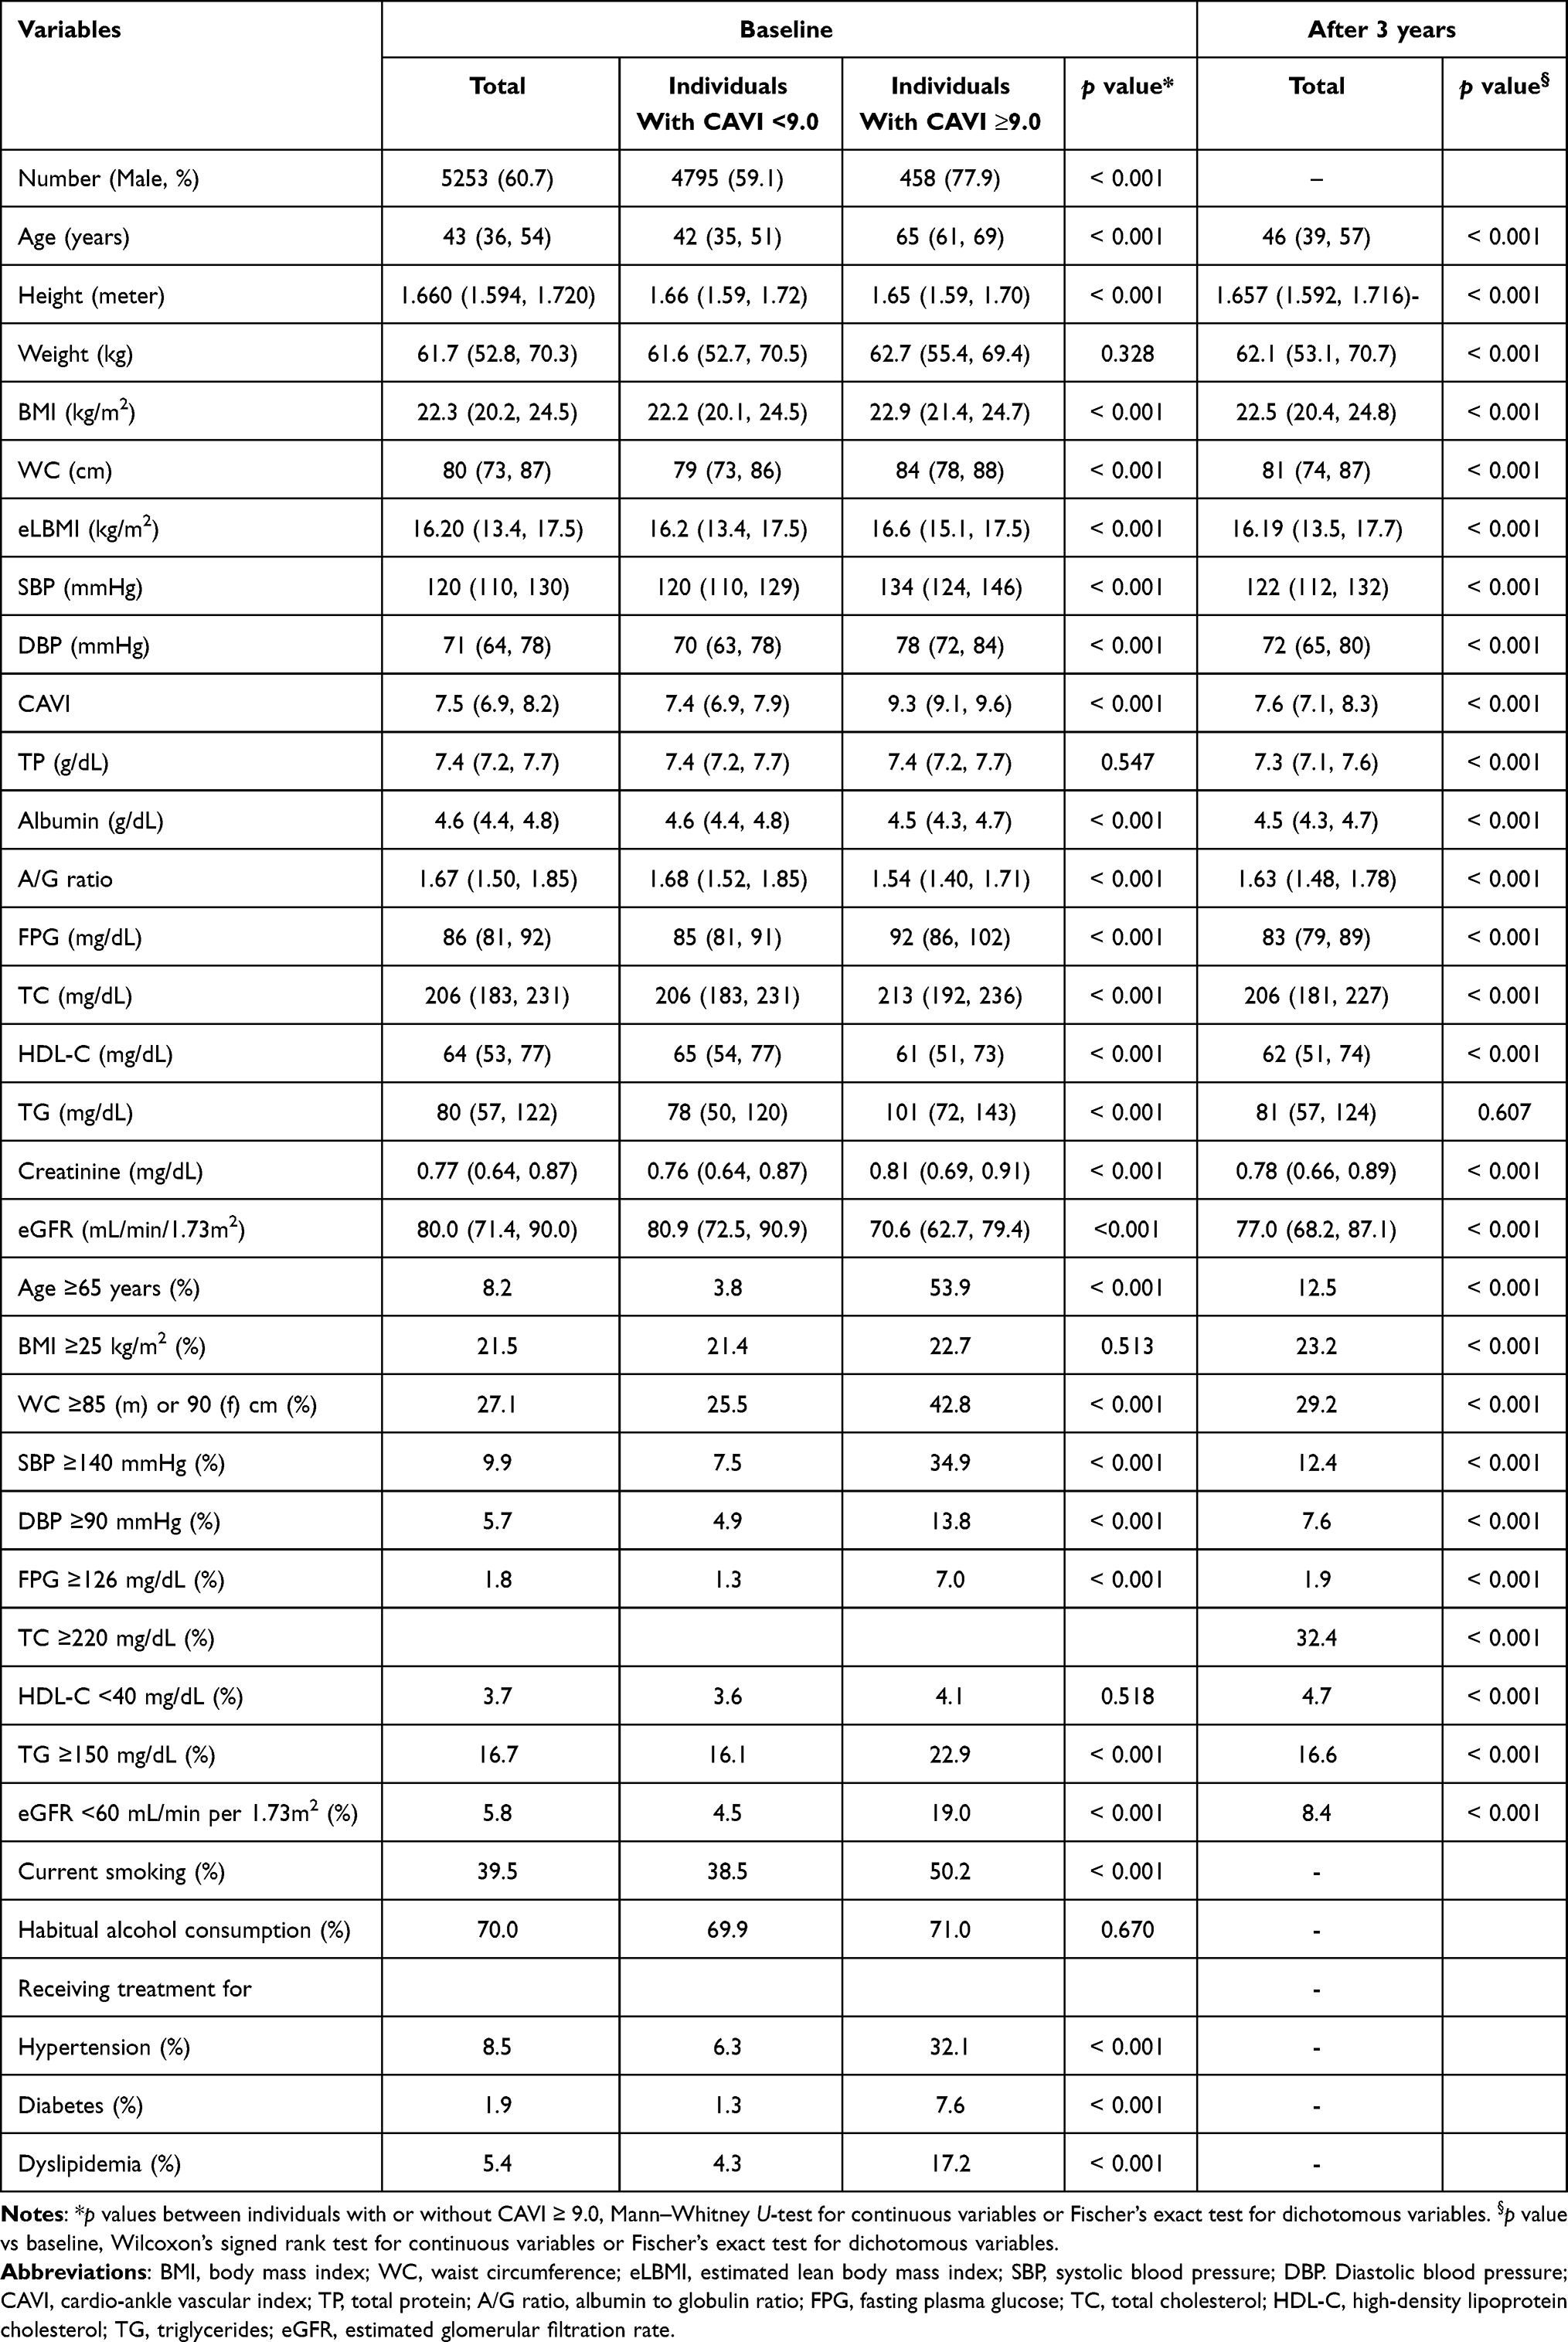 |
Table 1 Comparison of Clinical Characteristics in Participants with High CAVI (≥ 9.0) and Those Without |
At baseline, participants with high CAVI had significantly higher age, BMI, WC, eLBMI, BP, FPG, TC, TG and creatinine level, and lower albumin, A/G ratio, HDL-C and eGFR compared to those without. Presence of high CAVI was also associated with higher prevalence of smoking, kidney dysfunction and metabolic disorders compared to absence of high CAVI.
After three years, BMI, WC, BP, CAVI and creatinine increased slightly, while eLBMI, TP, albumin, A/G ratio, FPG, TC, HDL-C, and eGFR decreased slightly.
Comparison of Correlation Coefficients of Serum Protein Parameters with Clinical Variables
Next, we examined the correlation between serum protein parameters and general anthropometric indices as well as vascular/kidney function, as shown in Table 2. All three serum protein parameters; TP, albumin and A/G ratio, correlated positively with male sex, eLBMI and eGFR, and negatively with age. In particular, compared to TP and A/G ratio, albumin showed stronger correlation with both age and CAVI. Given its strong association with CAVI, albumin was identified as a potential indicator of changes in vascular function.
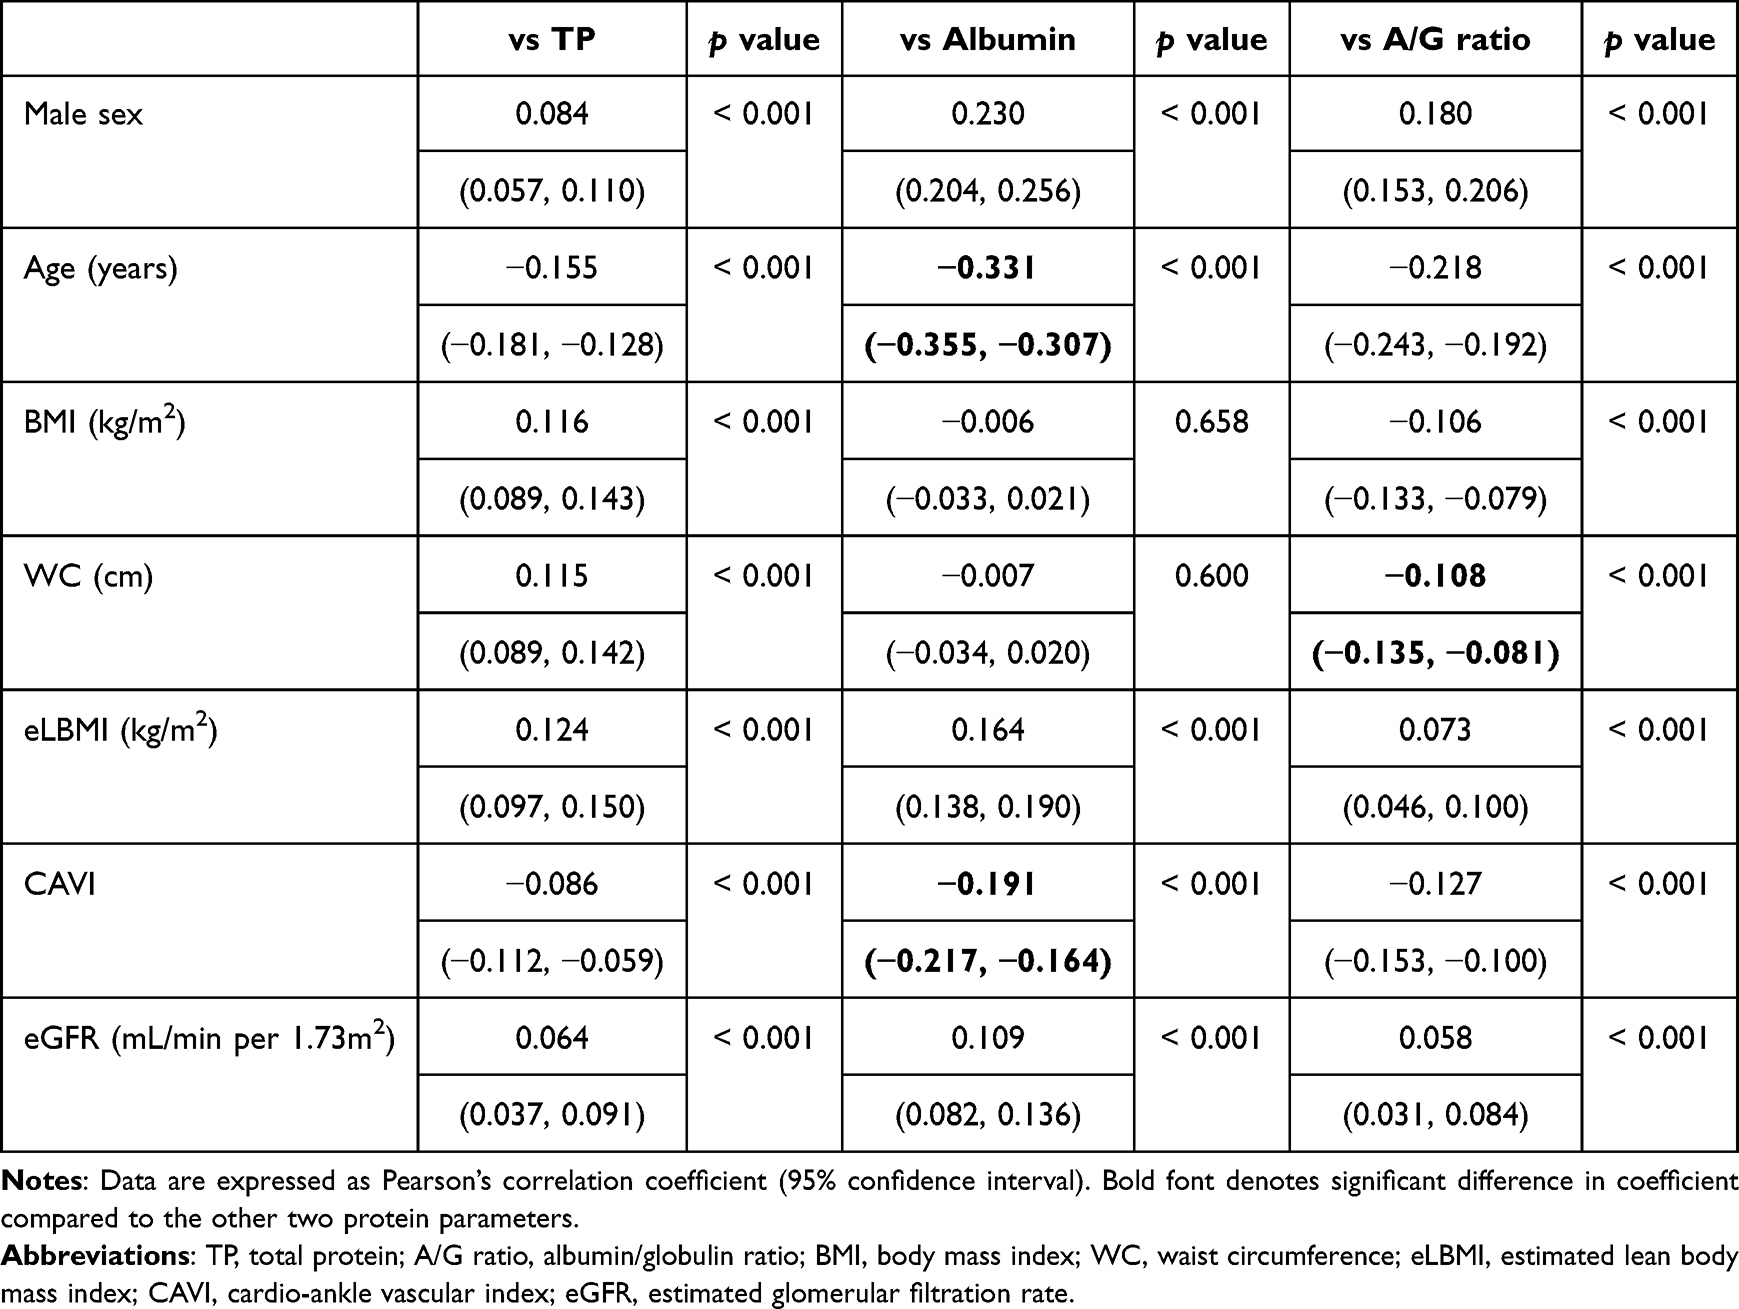 |
Table 2 Comparison of Correlation Coefficients of Serum Protein Parameters vs Clinical Variables |
Relationship of CAVI or Serum Albumin Level with Age
This study aimed to clarify the relationship between albumin and CAVI, but both are associated with age. We therefore examined the detailed relationship of CAVI or albumin with stratified age groups, as shown in Figure 1. CAVI showed a linear positive relationship with age (Figure 1A), whereas albumin showed a linear inverse relationship (Figure 1B).
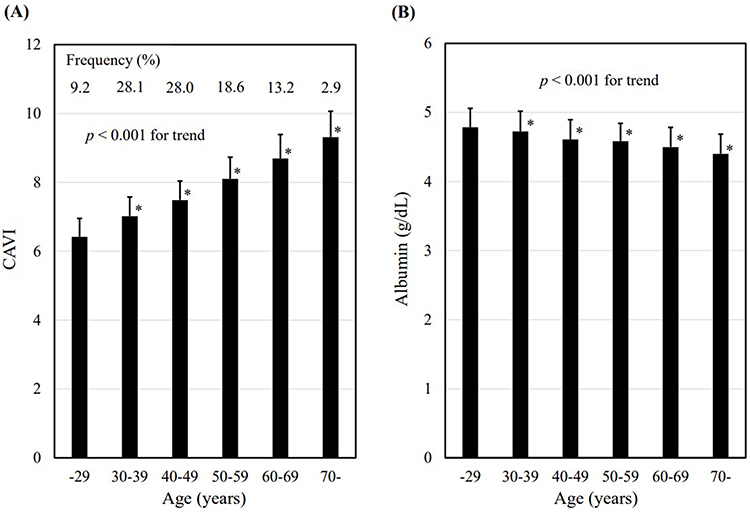 |
Figure 1 Relationship of (A) CAVI or (B) serum albumin level with age. Data are expressed as mean ± SD. *p < 0.001 vs the lowest group, Jonckheere-Terpstra trend test followed by Bonferroni multiple comparison test. Abbreviation: CAVI, cardio-ankle vascular index. |
Logistic Regression Model for High CAVI (≥9.0)
Furthermore, we performed logistic regression analysis to clarify whether serum protein parameters are associated independently with high CAVI, as shown in Table 3. Potential confounding factors were selected from those showing significant differences in Table 1 and included age (65 years or older), sex (male), central obesity (waist circumference ≥ 85 cm in men or ≥ 90 cm in women), hypertension, diabetes, dyslipidemia, current smoking, impaired renal function (eGFR < 60 mL/min/1.73m2), and serum protein parameters (per 1 SD). Obesity, defined as BMI ≥ 25 kg/m2, was excluded due to its intraclass correlation with high WC. TP, albumin and A/G ratio were entered into separate models due to their intraclass correlations.
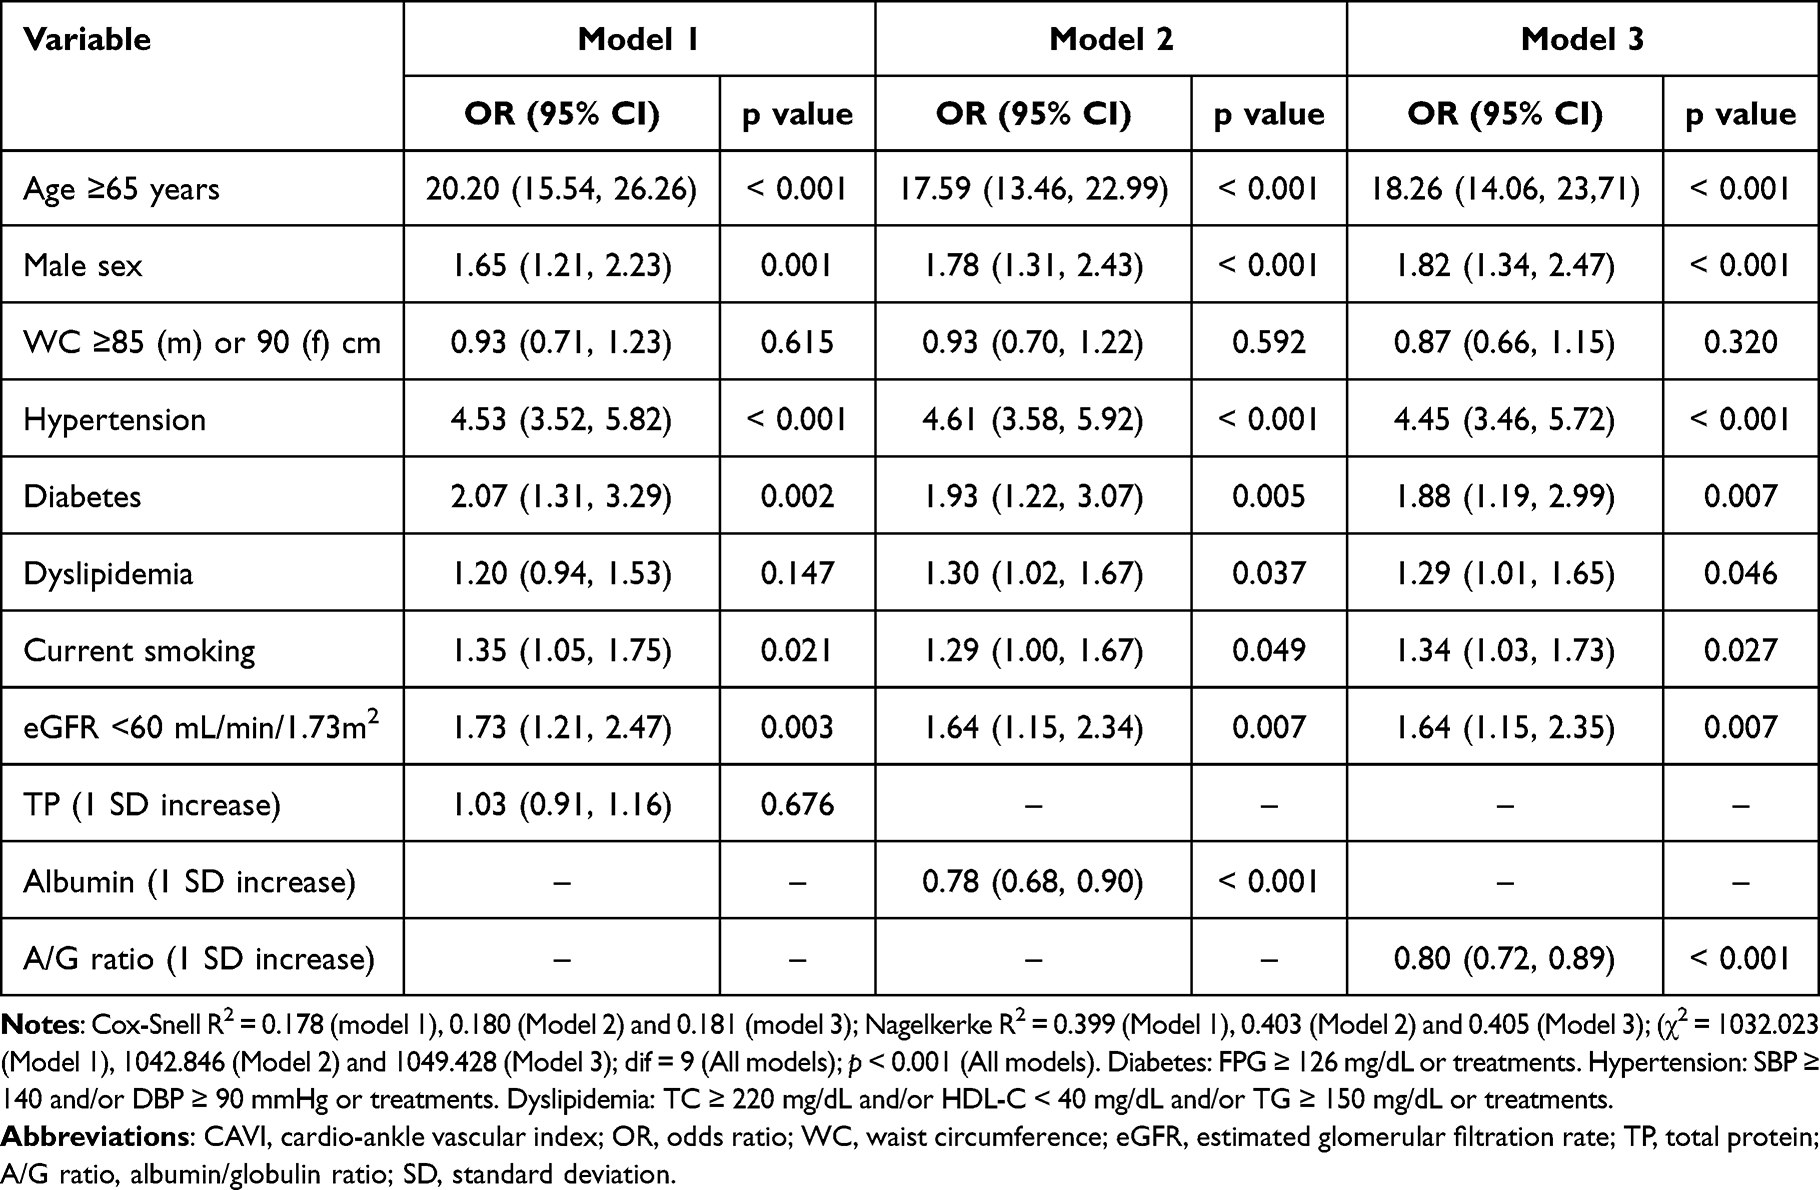 |
Table 3 Logistic Regression Model for High CAVI (≥9.0) |
The analysis identified older age, male sex, hypertension, diabetes, dyslipidemia, current smoking and kidney dysfunction to be independently associated with high CAVI. Notably, albumin (Model 2) and A/G ratio (Model 3) were significantly associated with high CAVI independent of the other variables. TP and high WC were not independently associated with high CAVI.
Changes in CAVI and eLBMI Over Three years vs Baseline Age and Albumin
Our previous study demonstrated that age was associated with both CAVI and eLBMI.8 We therefore analyzed the effects of both baseline albumin level and age on ΔCAVI and ΔeLBMI separately. Figure 2 shows cΔCAVI and ΔeLBMI over three years stratified by age or albumin level at baseline. Jonckheere-Terpstra trend test revealed a significant inverse trend of ΔCAVI among the stratified albumin groups (Figure 2B), whereas no significant trend was observed in the stratified age groups (Figure 2A). In other words, lower baseline albumin level is associated with greater increase in CAVI in subsequent follow-up, whereas age is not associated with ΔCAVI. In contrast, ΔeLBMI showed an inverse trend with baseline age (Figure 2C), and a positive trend with baseline albumin (Figure 2D). Therefore, it remains unclear whether baseline age and albumin level independently predict change in lean body mass in subsequent follow-up.
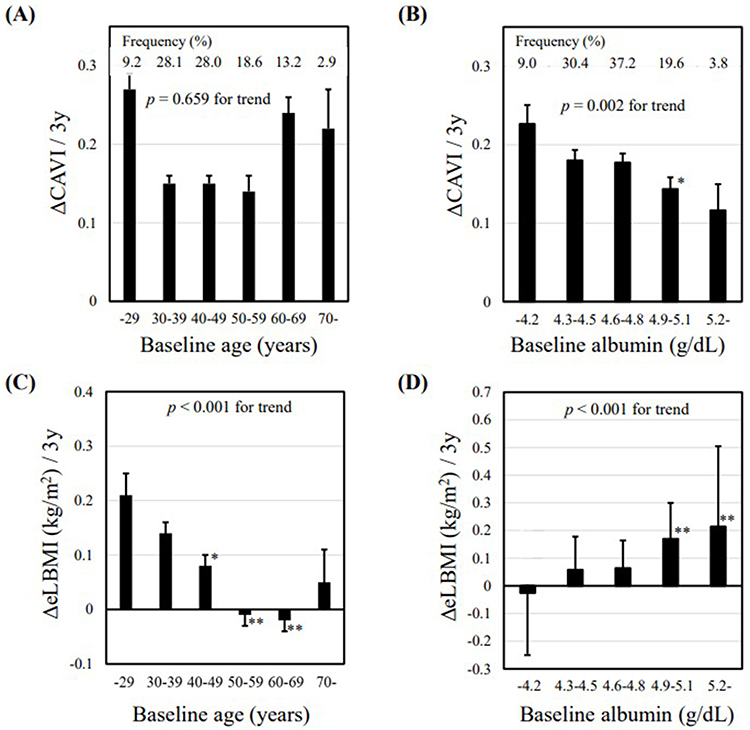 |
Figure 2 ΔCAVI stratified by (A) baseline age and (B) baseline albumin level, and ΔeLBMI stratified by (C) baseline age and (D) albumin level. Data are expressed as mean ± SE. *p < 0.05, **p < 0.001 vs the lowest group, Jonckheere-Terpstra trend test followed by Bonferroni multiple comparison test. Abbreviations: Δ, change over three years; SE, standard error; eLBMI, estimated lean body mass index; CAVI, cardio-ankle vascular index. |
Mediation Analyses of Δelbmi as Potential Mediator of the Association Between Baseline Albumin and ΔCAVI
Based on the above results, albumin appeared to be an indicator reflecting the changes in both vascular function and lean body mass. We therefore examined whether the significant inverse relationship between baseline and ΔCAVI is mediated by ΔeLBMI, as shown in Figure 3.
 |
Figure 3 Mediation analyses of ΔeLBMI as potential mediator of the association between baseline albumin level and ΔCAVI. Mediation model was univariate analysis in (A) men, in (B) women and in (C) total participants, and (D) adjusted for age in total participants. Abbreviations: Δ, change over three years. β, standardized β coefficient; eLBMI, estimated lean body mass index; CAVI, cardio-ankle vascular index. |
In separate mediation analyses for men (Figure 3A) and women (Figure 3B), no significant mediating effect of ΔeLBMI was observed. Next, we conducted a similar analysis for all participants. The total effect of baseline albumin on ΔCAVI was –0.042 (95% CI: –0.069 to –0.015, p < 0.001), and ΔeLBMI partially mediated the relationship between baseline albumin and ΔCAVI, with mediation rate of 5.5% (Figure 3C). Additionally, even after age adjustment, the significant mediation effect remained, with mediation rate of 3.4% (Figure 3D).
Discussion
This retrospective cohort study of Japanese urban residents who participated in three consecutive annual health screenings aimed to clarify the interaction between albumin, lean body mass and vascular function. As a result, the following findings were obtained: (1) albumin more strongly correlated with CAVI compared to TP and A/G ratio; (2) albumin was associated with high CAVI, independent of aging and traditional CVD risk factors; (3) relatively lower baseline albumin was associated with subsequent increase in CAVI, independent of age; and (4) mediation analysis suggested that the effect of baseline albumin on ΔCAVI was partially mediated by ΔeLBMI. The novelty of this study lies in the discovery of a relationship between albumin and both lean body mass as well as vascular function within the same population. Therapeutic approaches that increase albumin are expected to improve vascular function not only through the antioxidant and endothelial-restoring effects of albumin, but also by increasing lean body mass.
How can the findings of this study—that low albumin levels negatively affect vascular function through changes in lean body mass—be utilized? In routine clinical practice, medical nutrition therapy (MNT) is widely used not only for metabolic disorders and organ dysfunction, but also for the management of malnutrition.32 For example, a review on sarcopenic patients concluded that exercise combined with MNT increased both skeletal muscle index and albumin.33 MNT that provides sufficient dietary protein is also known to attenuate the impact of low albumin on increased mortality.34 Furthermore, several specific MNTs have been reported to also improve vascular function as assessed by CAVI. We previously showed that MNT using a protein-sparing modified formula diet decreased CAVI in obese individuals with type 2 diabetes.35 The protein-sparing modified formula diet may decrease CAVI due to its strong effect in improving metabolic disorders per 1% weight reduction.36 Based on the results of the present study, this finding can be interpreted as meaning that not only weight reduction but also the maintenance of lean body mass due to sufficient protein intake contributed to the improved vascular function. Considering that persistent CAVI impairment is an independent risk factor for future CVD events,37 MNTs that lower CAVI may contribute to favorable clinical outcomes. On the other hand, whether interventions that increase albumin improve CAVI remains unclear, and requires further verification.
In the present study, unlike TP, albumin and A/G ratio were each independently associated with high CAVI. However, we focused on albumin among serum protein parameters due to its strong correlation with CAVI, as shown in Table 2. Why does albumin reflect vascular function more robustly than TP and A/G ratio? A probable explanation is that albumin directly reflects pathophysiological processes related to vascular dysfunction, such as systemic inflammation, oxidative stress and endothelial dysfunction. Serum albumin neutralizes reactive oxygen species, binds to pro-inflammatory ligands such as homocysteine and metals, and has anticoagulants and antiplatelet properties.14 In contrast, TP and A/G ratio are affected by globulin fractions and various pathophysiological conditions not directly related to vascular function.38 Therefore, the affinity between albumin and CAVI observed in this study is consistent with previous reports.
We also examined the effects of albumin on vascular function mediated by changes in lean body mass, a surrogate of skeletal muscle mass. First, regarding the predictive value of albumin for skeletal muscle mass, albumin is involved in biological processes that support skeletal muscle growth and maintenance.11 Specifically, albumin acts as a non-specific transporter of androgens, thereby promoting muscle protein synthesis and satellite cell proliferation. In addition, increase in albumin level reflects favorable nutritional status associated with reduced skeletal muscle catabolism and resolved inflammatory response.39 The positive correlation between baseline albumin and ΔeLBMI observed in the present study therefore appears reasonable. Second, concerning the relationship between skeletal muscle mass assessed by eLBMI and CAVI, skeletal muscle per se may affect vascular function independent of albumin. Previous study has shown that the muscle mass deficit assessed by bioimpedance is independently associated with vascular dysfunction indicated by increased CAVI in middle-aged men.40 Similarly, our previous study demonstrated an inverse relationship between eLBMI and CAVI.8 Since skeletal muscle loss is a major cause of sarcopenia, these findings are consistent with report showing higher CAVI in heart failure patients with sarcopenia compared to those without.41 Qualitative or quantitative degeneration of skeletal muscle tissue may promote arteriosclerosis via increased insulin resistance, inflammation and oxidative stress.42,43 Furthermore, atherosclerosis is increasingly recognized as being promoted through dysregulation of myokines, muscle-derived signaling molecules. For instance, reduced beneficial myokines such as irisin and myonectin can impair carbohydrate and lipid metabolism, energy expenditure and anti-inflammatory processes, resulting in the progression of vascular dysfunction.44 Therefore, the linkage between ΔeLBMI and ΔCAVI observed in this study is plausible. Current evidence demonstrates that interventions aiming at increasing muscle mass or improving muscle quality, most commonly through resistance training or combined exercise regimens, can suppress the progression of atherosclerosis or reduce CVD risk.45
It should be noted that the participants in this study were not sarcopenic patients, but rather individuals from the general population undergoing health screenings. In this study population, ΔeLBMI correlated inversely with ΔCAVI; however, in middle-aged participants, ΔeLBMI actually reflected increases in eLBMI over three years. In other words, the increase in CAVI among participants was not necessarily attributable to decreases in eLBMI. Therefore, the results of this study should not be conflated with the high CAVI observed in sarcopenic patients with reduced skeletal muscle mass. To generalize the findings of this study to sarcopenic patients, it is essential to confirm that the pathophysiological conditions causing rapid skeletal muscle loss (such as CVD, malignant neoplasms and/or chronic inflammatory diseases) increase CAVI.
This study has several limitations. First, since most participants were healthy individuals from the general population, our findings cannot be generalized to patients with wasting diseases that cause pathological loss of skeletal muscle. Second, skeletal muscle mass indicated by eLBMI is less accurate than measurements using DXA. Third, the lack of information regarding protein intake and physical activity levels also constitutes a limitation of this study. Fourth, although the mediating effect of ΔLBMI on the relationship between baseline albumin and ΔCAVI remained significant after adjustment for age, the statistical power of the present database was insufficient to establish a significant model in sex-stratified analyses or when additional confounding variables were included; this should be considered a limitation. Fifth, since this study relies on secondary data, and the participants’ health status may not be adequately described, conclusions regarding the relationship between CAVI and eLBMI may not necessarily be valid. Finally, individuals who voluntarily participated in health screenings may have higher health awareness and healthier lifestyle habits compared to those who did not participate.
Conclusion
As serum albumin level predicts CAVI mediated by changes in lean body mass, appropriate nutrition management aimed at enhancing skeletal muscle mass may be useful for reliable prevention of CVD. Future interventional studies are warranted to determine whether nutritional strategies aimed at correcting hypoalbuminemia and skeletal muscle deficiency can improve vascular function, as well as to elucidate the underlying mechanisms of such effects.
Declaration of Generative AI and AI-Assisted Technologies
During the preparation of this work, the authors did not use any generative AI and AI-assisted technologies for purposes other than checking references.
Data Sharing Statement
The data that support the findings of this study are not publicly available because they contain information that could compromise the privacy of research participants. Further enquiries may be directed at the corresponding author.
Statement of Ethics
The protocol of the study was prepared in accordance with the Declaration of Helsinki. Written informed consent was waived in accordance with the opt-out policy approved by the ethics committee. The institution’s website clearly described the study objectives, the nature of the health checkup data to be used, measures for the protection of personal information, and restrictions on data sharing with external organizations. Participants were also informed of their rights to request disclosure, correction, deletion, or suspension of the use of their personal data. As a result, no participants declined the use of their data for this study. The study protocol including this consent procedure was reviewed and approved by the Institutional Review Board and Ethics Committee of Sakura Hospital, School of Medicine, Toho University (No. S24011; date of approval, June 14, 2024).
Acknowledgment
We would like to thank all staff members of our department who contributed to this study.
Author Contributions
All authors made a significant contribution to the work reported, whether that is in the conception, study design, execution, acquisition of data, analysis and interpretation, or in all these areas; took part in drafting, revising or critically reviewing the article; gave final approval of the version to be published; have agreed on the journal to which the article has been submitted; and agree to be accountable for all aspects of the work.
Funding
This study was not supported by any sponsor or funder.
Disclosure
The authors have no conflicts of interest to declare for this work.
References
1. Zieman SJ, Melenovsky V, Kass DA. Mechanisms, pathophysiology, and therapy of arterial stiffness. Arterioscler Thromb Vasc Biol. 2005;25:932–13. doi:10.1161/01.ATV.0000160548.78317.29
2. Fountoulakis N, Thakrar C, Patel K, Viberti G, Gnudi L, Karalliedde J. Increased arterial stiffness is an independent predictor of renal function decline in patients with type 2 diabetes mellitus younger than 60 years. J Am Heart Assoc. 2017;6:e004934. doi:10.1161/JAHA.116.004934
3. Shirai K, Song M, Suzuki J, et al. Contradictory effects of beta1- and alpha1- adrenergic receptor blockers on cardio-ankle vascular stiffness index [CAVI]--CAVI independent of blood pressure. J Atheroscler Thromb. 2011;18:49–55. doi:10.5551/jat.3582
4. Shirai K, Utino J, Otsuka K, Takata M. A novel blood pressure-independent arterial wall stiffness parameter; cardio-ankle vascular index (CAVI). J Atheroscler Thromb. 2006;13:101–107. doi:10.5551/jat.13.101
5. Saiki A, Ohira M, Yamaguchi T, et al. New horizons of arterial stiffness developed using cardio-ankle vascular index (CAVI). J Atheroscler Thromb. 2020;27:732–748. doi:10.5551/jat.RV17043
6. Kirkham FA, Bunting E, Fantin F, Zamboni M, Rajkumar C. Independent association between cardio-ankle vascular index and sarcopenia in older U.K. adults. J Am Geriatr Soc. 2019;67:317–322. doi:10.1111/jgs.15648
7. Shirai K, Hiruta N, Song M, et al. Cardio-ankle vascular index (CAVI) as a novel indicator of arterial stiffness: theory, evidence and perspectives. J Atheroscler Thromb. 2011;18:924–938. doi:10.5551/jat.7716
8. Nagayama D, Watanabe Y, Fujishiro K, et al. Age-related arterial stiffening is associated with a body shape index and lean body mass index: a retrospective cohort study in healthy Japanese population. Obes Facts. 2025;18:248–259. doi:10.1159/000543791
9. Jun JE, Choi MS, Park SW, et al. Low skeletal muscle mass is associated with the presence, incidence, and progression of coronary artery calcification. Can J Cardiol. 2021;37(9):1480–1488. doi:10.1016/j.cjca.2021.04.002
10. Gom I, Fukushima H, Shiraki M, et al. Relationship between serum albumin level and aging in community-dwelling self-supported elderly population. J Nutr Sci Vitaminol. 2007;53:37–42. doi:10.3177/jnsv.53.37
11. Reijnierse EM, Trappenburg MC, Leter MJ, et al. Serum albumin and muscle measures in a cohort of healthy young and old participants. Age. 2015;37:88. doi:10.1007/s11357-015-9825-6
12. Kozjek NR, Tonin G, Gleeson M. Nutrition for optimising immune function and recovery from injury in sports. Clin Nutr ESPEN. 2025;66:101–114. doi:10.1016/j.clnesp.2025.01.031
13. Cabrerizo S, Cuadras D, Gomez-Busto F, Artaza-Artabe I, Marín-Ciancas F, Malafarina V. Serum albumin and health in older people: review and meta analysis. Maturitas. 2015;81:17–27. doi:10.1016/j.maturitas.2015.02.009
14. Arques S. Human serum albumin in cardiovascular diseases. Eur J Intern Med. 2018;52:8–12. doi:10.1016/j.ejim.2018.04.014
15. Lee JA, Kim DH, Yu SJ, Oh DJ, Yu SH. Association of serum albumin and homocysteine levels and cardio-ankle vascular index in patients with continuous ambulatory peritoneal dialysis. Korean J Intern Med. 2006;21:33–38. doi:10.3904/kjim.2006.21.1.33
16. Li X, Zhang Y, He Y, et al. J-shaped association between serum albumin levels and long-term mortality of cardiovascular disease: experience in National Health and Nutrition Examination Survey (2011-2014). Front Cardiovasc Med. 2022;9:1073120. doi:10.3389/fcvm.2022.1073120
17. Tong J, Wang T, Wei Q, et al. Serum albumin is linearly and negatively associated with the risk of all-cause and cardiovascular death in coronary heart disease patients. Rev Cardiovasc Med. 2025;26(8):38034. doi:10.31083/RCM38034
18. Levitt DG, Levitt MD. Human serum albumin homeostasis: a new look at the roles of synthesis, catabolism, renal and gastrointestinal excretion, and the clinical value of serum albumin measurements. Int J Gen Med. 2016;9:229–255. doi:10.2147/IJGM.S102819
19. Baumgartner RN, Koehler KM, Romero L, Garry PJ. Serum albumin is associated with skeletal muscle in elderly men and women. Am J Clin Nutr. 1996;64:552–558. doi:10.1093/ajcn/64.4.552
20. Sawada S, Ozaki H, Natsume T, et al. Serum albumin levels as a predictive biomarker for low-load resistance training programs’ effects on muscle thickness in the community-dwelling elderly Japanese population: interventional study result. BMC Geriatr. 2021;21:464. doi:10.1186/s12877-021-02403-7
21. Ogawa W, Hirota Y, Miyazaki S, et al; Creation Committee for Guidelines for the Management of Obesity Disease 2022 by Japan Society for the Study of Obesity (JASSO). Definition, criteria, and core concepts of guidelines for the management of obesity disease in Japan. Endocr J. 71;2024:223–231. doi:10.1507/endocrj.EJ23-0593
22. Matsuzawa Y. Metabolic syndrome: definition and diagnostic criteria in Japan. J Atheroscler Thromb. 2005;12:301. doi:10.5551/jat.12.301
23. Baglietto N, Vaquero-Cristóbal R, Albaladejo-Saura M, Mecherques-Carini M, Esparza-Ros F. Assessing skeletal muscle mass and lean body mass: an analysis of the agreement among dual X-ray absorptiometry, anthropometry, and bioelectrical impedance. Front Nutr. 2024;11:1445892. doi:10.3389/fnut.2024.1445892
24. Muraki I. Muscle Mass Assessment in Sarcopenia: a Narrative Review. JMA J. 2023;6:381–386. doi:10.31662/jmaj.2023-0053
25. Lee DH, Keum N, Hu FB, et al. Development and validation of anthropometric prediction equations for lean body mass, fat mass and percent fat in adults using the National Health and Nutrition Examination Survey (NHANES), 1999-2006. Br J Nutr. 2017;118:858–866. doi:10.1017/S0007114517002665
26. Park J, Kim HJ, Kim J, Choi YB, Shin YS, Lee MJ Predictive value of serum albumin-to-globulin ratio for incident chronic kidney disease: a 12-year community-based prospective study. PLoS One. 2020;15(9):e0238421. doi:10.1371/journal.pone.0238421
27. Matsuo S, Imai E, Horio M, et al. Collaborators developing the Japanese equation for estimated GFR. Revised equations for estimated GFR from serum creatinine in Japan. Am J Kidney Dis. 2009;53:982–992. doi:10.1053/j.ajkd.2008.12.034
28. Levin AS, Bilous RW, Coresh J. Chapter 1: definition and classification of CKD. Kidney Int Suppl. 2013;3:19–62.
29. Hayashi K, Handa H, Nagasawa S, Okumura A, Moritake K. Stiffness and elastic behavior of human intracranial and extracranial arteries. J Biomech. 1980;13:175–184. doi:10.1016/0021-9290(80)90191-8
30. Bramwell JC, Hill AV. The velocity of the pulse wave in man. Proc R Soc London Series B. 1926;93:298–306. doi:10.1098/rspb.1922.0022
31. Preacher KJ, Hayes AF. SPSS and SAS procedures for estimating indirect effects in simple mediation models. Behav Res Methods Instrum Comput. 2004;36:717–731. doi:10.3758/BF03206553
32. Chen W, Song J, Gong S. Advances in nutritional metabolic therapy to impede the progression of critical illness. Front Nutr. 2024;11:1416910. doi:10.3389/fnut.2024.1416910
33. Hsu HC, Chow LH, Chen YL, Hung HM, Yen M, Lee HF. Effects of exercise and nutrition in improving sarcopenia in liver cirrhosis patients: a systematic review and meta-analysis. Hepatobiliary Surg Nutr. 2025;14:33–48. doi:10.21037/hbsn-23-639
34. Zhang C, Zhang L, Zeng L, Wang Y, Chen L. Associations of serum albumin and dietary protein intake with all-cause mortality in community-dwelling older adults at risk of sarcopenia. Heliyon. 2024;10:e29734. doi:10.1016/j.heliyon.2024.e29734
35. Nagayama D, Endo K, Ohira M, et al. Effects of body weight reduction on cardio-ankle vascular index [CAVI]. Obes Res Clin Pract. 2013;7:e139–45. doi:10.1016/j.orcp.2011.08.154
36. Shirai K, Saiki A, Oikawa S, et al. The effects of partial use of formula diet on weight reduction and metabolic variables in obese type 2 diabetic patients--multicenter trial. Obes Res Clin Pract. 2013;7:e43–54. doi:10.1016/j.orcp.2012.03.002
37. Otsuka T, Fukuda S, Shimada K, Suzoshikawa J. Serial assessment of arterial stiffness by cardio-ankle vascular index for prediction of future cardiovascular events in patients with coronary artery disease. Hypertens Res. 2014;37:1014–1020. doi:10.1038/hr.2014.116
38. Wang G, Li G, Wang P, Zang M, Pu J. Association between albumin to globulin ratio and all-cause and cardiovascular mortality among individuals with cardiovascular-kidney-metabolic syndrome: results from NHANES 2003 to 2018. Front Nutr. 2025;12:1622590. doi:10.3389/fnut.2025.1622590
39. Boesiger F, Poggioli A, Netzhammer C, et al. Changes in serum albumin concentrations over 7 days in medical inpatients with and without nutritional support. A secondary post-hoc analysis of a randomized clinical trial. Eur J Clin Nutr. 2023;77:989–997. doi:10.1038/s41430-023-01303-w
40. Im IJ, Choi HJ, Jeong SM, Kim HJ, Son JS, Oh HJ. The association between muscle mass deficits and arterial stiffness in middle-aged men. Nutr Metab Cardiovasc Dis. 2017;27:1130–1135. doi:10.1016/j.numecd.2017.10.002
41. Ogawa A, Shimizu K, Nakagami T, Maruoka H, Shirai K. Physical function and cardioankle vascular index in elderly heart failure patients. Int Heart J. 2020;61:769–775. doi:10.1536/ihj.20-058
42. He N, Zhang Y, Zhang L, Zhang S, Ye H. Relationship between sarcopenia and cardiovascular diseases in the elderly: an overview. Front Cardiovasc Med. 2021;8:743710. doi:10.3389/fcvm.2021.743710
43. Dvoretskiy S, Lieblein-Boff JC, Jonnalagadda S, Atherton PJ, Phillips BE, Pereira SL. Exploring the association between vascular dysfunction and skeletal muscle mass, strength and function in healthy adults: a systematic review. Nutrients. 2020;12(3):715. doi:10.3390/nu12030715
44. Petro JL, Gallo-Villegas J, Calderón JC. Myonectin and metabolic health: a systematic review. Front Endocrinol. 2025;16:1557142. doi:10.3389/fendo.2025.1557142
45. Yin MT, Guo L. Exercise in atherosclerosis: its beneficial effects and underlying mechanism. Front Cell Dev Biol. 2025;13:1598794. doi:10.3389/fcell.2025.1598794
 © 2026 The Author(s). This work is published and licensed by Dove Medical Press Limited. The
full terms of this license are available at https://www.dovepress.com/terms
and incorporate the Creative Commons Attribution
- Non Commercial (unported, 4.0) License.
By accessing the work you hereby accept the Terms. Non-commercial uses of the work are permitted
without any further permission from Dove Medical Press Limited, provided the work is properly
attributed. For permission for commercial use of this work, please see paragraphs 4.2 and 5 of our Terms.
© 2026 The Author(s). This work is published and licensed by Dove Medical Press Limited. The
full terms of this license are available at https://www.dovepress.com/terms
and incorporate the Creative Commons Attribution
- Non Commercial (unported, 4.0) License.
By accessing the work you hereby accept the Terms. Non-commercial uses of the work are permitted
without any further permission from Dove Medical Press Limited, provided the work is properly
attributed. For permission for commercial use of this work, please see paragraphs 4.2 and 5 of our Terms.
Recommended articles
Possible Clinical Benefits of Cardio-Ankle Vascular Index Measurement in Urological Diseases
Bulbul E, Ozilhan MO, Sezer A, Yetisen M, Ilki FY
Vascular Health and Risk Management 2023, 19:127-132
Published Date: 9 March 2023
Pulse Wave Morphology Changes in Aortic Valve Stenosis Detected with Cardio-Ankle Vascular Index
Plunde O, Franco-Cereceda A, Bäck M
Vascular Health and Risk Management 2023, 19:325-328
Published Date: 24 May 2023