Back to Journals » Journal of Inflammation Research » Volume 16
Serological Biomarker-Based Machine Learning Models for Predicting the Relapse of Ulcerative Colitis
Authors Pang W ![]() , Zhang B, Jin L
, Zhang B, Jin L ![]() , Yao Y, Han Q
, Yao Y, Han Q ![]() , Zheng X
, Zheng X
Received 26 May 2023
Accepted for publication 11 August 2023
Published 21 August 2023 Volume 2023:16 Pages 3531—3545
DOI https://doi.org/10.2147/JIR.S423086
Checked for plagiarism Yes
Review by Single anonymous peer review
Peer reviewer comments 3
Editor who approved publication: Professor Ning Quan
Wenwen Pang,1,* Bowei Zhang,2,* Leixin Jin,3 Yao Yao,3 Qiurong Han,3 Xiaoli Zheng1
1Department of Clinical Laboratory, Tianjin Union Medical Center, Nankai University, Tianjin, People’s Republic of China; 2School of Medicine, Nankai University, Tianjin, People’s Republic of China; 3School of Integrative Medicine, Tianjin University of Traditional Chinese Medicine, Tianjin, People’s Republic of China
*These authors contributed equally to this work
Correspondence: Xiaoli Zheng, 190 Huayuan Road, Tianjin, People’s Republic of China, Tel +86 13612135765, Fax +022 87729595, Email [email protected]
Purpose: To explore whether machine learning models using serological markers can predict the relapse of Ulcerative colitis (UC).
Patients and Methods: This clinical cohort study included 292 UC patients, and serological markers were obtained when patients were discharged from the hospital. Subsequently, four machine learning models including the random forest (RF) model, the logistic regression model, the decision tree, and the neural network were compared to predict the relapse of UC. A nomogram was constructed, and the performance of these models was evaluated by accuracy, sensitivity, specificity, and the area under the receiver operating characteristic curve (AUC).
Results: Based on the patients’ characteristics and serological markers, we selected the relevant variables associated with relapse and developed a LR model. The novel model including gender, white blood cell count, percentage of leukomonocyte, percentage of monocyte, absolute value of neutrophilic granulocyte, and erythrocyte sedimentation rate was established for predicting the relapse. In addition, the average AUC of the four machine learning models was 0.828, of which the RF model was the best. The AUC of the test group was 0.889, the accuracy was 76.4%, the sensitivity was 78.5%, and the specificity was 76.4%. There were 45 variables in the RF models, and the relative weight coefficients of these variables were determined. Age has the greatest impact on classification results, followed by hemoglobin concentration, white blood cell count, and platelet distribution width.
Conclusion: Machine learning models based on serological markers had high accuracy in predicting the relapse of UC. The model can be used to noninvasively predict patient outcomes and can be an effective tool for determining personalized treatment plans.
Keywords: ulcerative colitis, relapse, serological markers, machine learning, random forest model
Graphical Abstract:

Introduction
Ulcerative colitis (UC) is a chronic inflammatory disease of the colonic mucosa, and its incidence is rising worldwide.1 It starts in the rectum and extends proximally to part or the entire colon in a continuous manner.2 UC usually presents with bloody diarrhea and the aim of management is to induce and maintain remission, defined as relief of symptoms and endoscopic healing.3 The diagnosis of UC is based on symptoms, endoscopic findings, and other alternative diagnoses. Endoscopy is the gold standard test for evaluating UC activity and healing, but it is an expensive, invasive, and uncomfortable procedure for patients. Diagnostic modalities need to be improved for more rigorous monitoring of disease activity.
UC has evolved into a global burden given its high rate of relapse, which requires a two-pronged solution that includes research on interventions to prevent UC and innovation in providing care for UC patients. Treatment for UC patients includes 5-aminosalicylic acids (5-ASA), steroids, and immunosuppressants. Patients might have anemia, iron deficiency, leucocytosis, or thrombocytosis. Hypoalbuminaemia may be a predictor of colectomy and adverse reactions to biological drugs.4 Some biomarkers of inflammation, such as erythrocyte sedimentation rate (ESR) and C-reactive protein, can be elevated (severe UC) or normal (mild to moderate disease).5 The course of clinical relapse of UC is difficult to predict. Strict and effective management is the key to improving the prognosis of UC patients.6 Therefore, it is urgent to accurately predict UC relapse.
The diagnostic armamentarium for ulcerative colitis is expanding, and the serological markers have become a focus for the diagnosis and prognosis of UC because they are convenient, non-invasive, and relatively inexpensive compared to other markers in biopsy tissue or stool.7 Classical serological markers, such as perinuclear anti-neutrophil cytoplasmic antibodies (p-ANCA) and anti-Saccharomyces cerevisiae antibodies (ASCAs), are initially used for diagnostic purposes, and later used to predict the course and outcome of UC.8,9 However, there is still no ideal biomarker for monitoring UC, since these antibodies are sometimes negative in patients with UC.10 In addition to the antibodies, there is growing evidence that other serological markers, including the neutrophil to lymphocyte ratio (NLR), platelets, and leukocyte count, are significant to predict the recurrence of UC patients, and can reflect systemic inflammation to a certain extent.11,12 The combination of various serological biomarkers is valuable for improving the prediction of UC relapse.
It is of great significance to establish a clinical prediction model with good performance to guide the diagnosis and treatment of UC. With the development of technology, machine learning algorithms have become a new method of medical data processing.13 For example, the random forest (RF) model has proven useful in Alzheimer’s disease and diabetic nephropathy.14 In addition, the logistic regression model (LR), the decision tree (DT), and the neural network (NN) have shown strong capabilities in medical data processing.15,16 Previous studies have demonstrated that machine learning algorithms improve the accuracy of identifying and distinguishing UC compared to using serological markers alone.17 However, these prediction tools have not been used in the relapse of UC patients. Thus, our study aims to establish a predictive relapse model of UC, incorporating various serological biomarkers into computational algorithms to provide information for predicting disease activity.
In this study, we analyzed serological biomarkers from UC patients and used machine learning algorithms to evaluate the predictive value of serological markers on the relapse of UC. We aimed to develop, validate, and compare the machine learning models for predicting the relapse of UC patients using serological markers, which may help predict patient outcomes and determine personalized treatment plans.
Materials and Methods
Study Population
This population-based retrospective study was conducted at the Tianjin Union Medical Center. We collected the medical records of UC patients who were hospitalized from January 2017 to December 2021. The inclusion criteria were as follows: (1) aged 18–80 years, (2) hospitalized with intestinal symptoms, (3) diagnosed with UC by colonoscopy, (4) experienced routine blood testing, ASCA-lgA, ASCA-lgG, anti-pancreatic acinar antibodies (PAB), anti-intestinal goblet cell antibodies (GAB) and pANCA test. The exclusion criteria included patients with other gastrointestinal diseases (ie, gastrointestinal tumors, irritable bowel syndrome, and intestinal polyps), or other autoimmune diseases. The flowchart of this study is presented in Figure 1.
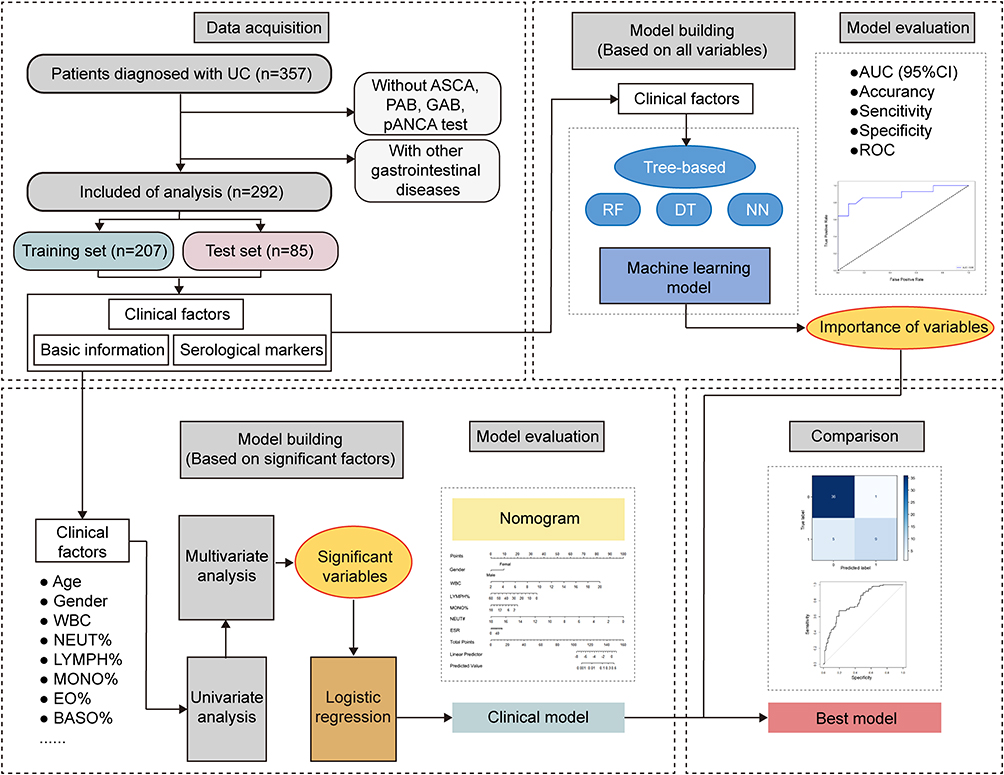 |
Figure 1 The flowchart of the study. Abbreviations: UC, Ulcerative colitis; RF, random forest; DT, decision tree; NN, neural network; AUC, the area under the curve. |
Based on the criteria described, patients diagnosed with UC were enrolled in this study cohort. The patients were treated and followed according to the established procedures for at least one year in the hospital. The UC patients were treated with 5-ASA only and did not use biotherapy or surgery, and patients in clinical remission were allowed to be discharged from the hospital. The clinical recurrence in UC patients was identified by reviewing lists of patients re-admitted to our hospital within one year, and the patients were divided into the relapse group. The patients were hospitalized with intestinal symptoms and confirmed to be UC by colonoscopy. Meanwhile, the other UC patients were divided into the group without relapse.
Data Collection
The medical records included all information about relapse symptoms, patients’ demographic parameters, laboratory tests performed, medical procedures applied, medications administered, or medical history. In the first place, we concluded the common recurrent symptoms by summarizing the medical records of the relapse group. As for demographic parameters, only the age and sex of patients were available in the data analysis of this study. The clinical indices contain Blood Routine Indexes, and ASCA-lgA, ASCA-lgG, PAB, GAB, and pANCA.
At the time of discharge, the blood values were examined again. Venous blood specimens were drawn into sterile standard tubes and evaluated within two hours. Routine blood testing was detected by Mindray® (BC6800PLUS/SC-120), which included white blood cell count (WBC), red blood cell count (RBC), hemoglobin (HGB), platelet count (PC), red blood cell distribution width (RDW), mean platelet volume (MPV), prothrombin time (PT), D-dimer and so on. Moreover, ASCA-lgA, ASCA-lgG, PAB, GAB, and pANCA were detected by indirect immunofluorescence using a commercial test kit® (EUROIMMUN). In this study, all the values were then obtained directly through the medical database.
Statistical Analysis
The medical records were saved and processed into the pseudonymized form of the first step and the later anonymous forms through Excel and SPSS (IBM Corp) software packages. The data of serological markers were expressed as mean ± standard deviation if they were in accordance with normal distribution, and as median and interquartile interval otherwise. If the data conformed to a normal distribution, the T-test was used to compare the differences of data. If the data did not conform to a normal distribution, the chi-square test was used.
Next, the serological markers of UC patients were collected and used to develop and validate the Machine Learning Prediction Model, including LR, RF, DT, and NN. To be specific, LR is a commonly used binary linear classifier. RF is an idea of ensemble learning, which inputs many weak learners through random sampling of data, and it could measure the relative importance of each feature for the prediction.14 The DT is a classification and regression model based on a tree structure, which classifies or predicts data through a series of decisions.18 The NN is an updated technology based on models with fewer assumptions, which relies on multi-layers of representation of data with continuous transformations, and it is capable of handling more complex data.19
We have performed LR, RF, DT, and NN based on age, gender, blood routine indexes, and ASCA-lgA, ASCA-lgG, PAB, GAB, and pANCA results to predict the relapse of UC. These 45 indicators are closely related to UC recurrence.7 In the LR model, we used univariate logistic regression to calculate odds ratio (OR) values of variables, followed by multiple logistic regression selection of potential variables, and P values <0.05 in univariate analysis were included to establish the model. According to the clinical characteristics and statistically significant variables, a nomogram was constructed to facilitate clinical application. Next, we plotted the receiver operating characteristic curve and calculated the AUC to evaluate the validation. In the end, four machine learning prediction models were validated by resampling from the original data set using a bootstrapping method. The train/test split was used where 70% of the data was used for the training model, and the remaining 30% was used for the testing model. Through a comprehensive evaluation of the performance of each model, the optimal model was obtained, and the variables in the model have been ranked in order of importance.
All statistical analyses were performed using R4.1.3 software. The LR model used the glm function in this study. Univariate analysis was performed using the t.test and wilcox.test functions. The nomogram used lrm and nomogram functions. The calibration curve used the calibrate function. The ROC curves used the roc function, and the DCA curve used the plot_decision_curve function. In addition, the RF model used the randomForest function of the randomForest package, and the importance of variables could be obtained. The NN model used the neuralnet function of the neuralnet package. The DT model used the rpart function of the rpart package. A p-value of <0.05 was considered statistically significant.
Results
The Clinical Characteristics of UC Patients
A total of 292 UC patients were followed up and analyzed when they were hospitalized during their first admission. The median age was 47.29 years (18 ~ 79 years), and 159 (54.45%) were men.
During one year of follow-up, 178 cases of UC patients were re-admitted due to recurrence, and 114 UC patients had no recurrence. The characteristics of UC patients are shown in Table 1. The UC patients were re-admitted at a mean of 7.69 months and a median of 7 months, and the range of relapse dates was 2 to 12 months after the first diagnosis. The median age of the relapse group and the group without relapse was 49.78 and 46.38 years, respectively.
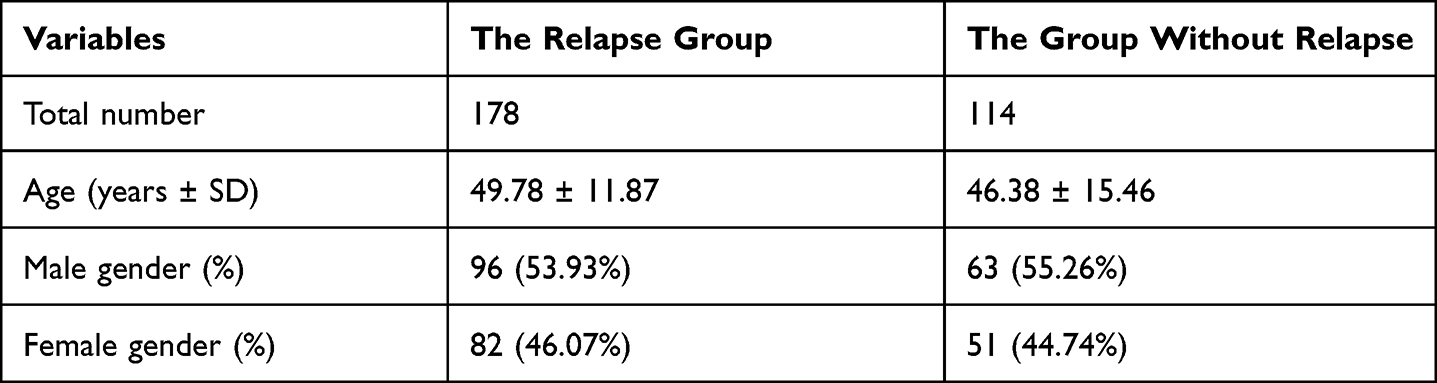 |
Table 1 Characteristics of UC Patients Followed for One Year |
The Relapse of UC Patients
The recurrence rate in follow-up UC patients was about 60.96%. According to the medical records, relapsing patients who come to the hospital were mostly affected by symptoms. The common symptoms that prompt admission to the hospital were abdominal pain, most of which were lower abdominal pain, with a few around the navel and upper abdomen. All patients had diarrhea, and some patients were accompanied by tenesmus. They had a defecation frequency of 3 ~ 15 times per day and presented with purulent, bloody, and mucoid loose bowel motions. In terms of fever, many patients had a low-grade fever, while a few had a fever up to 38 °C. There were some patients with anorexia, hiccups, or even vomiting. Other parenteral symptoms mentioned were joint pain, ulcers and so on.
The Serological Markers of UC Patients
To investigate differences in blood routine indexes and the expression of ASCA-lgA, ASCA-IgG, PAB, GAB, pANCA, and ANA and their relationship with relapse, the patients were divided into the relapse group and the group without relapse. The serological markers of UC patients are shown in Table 2.
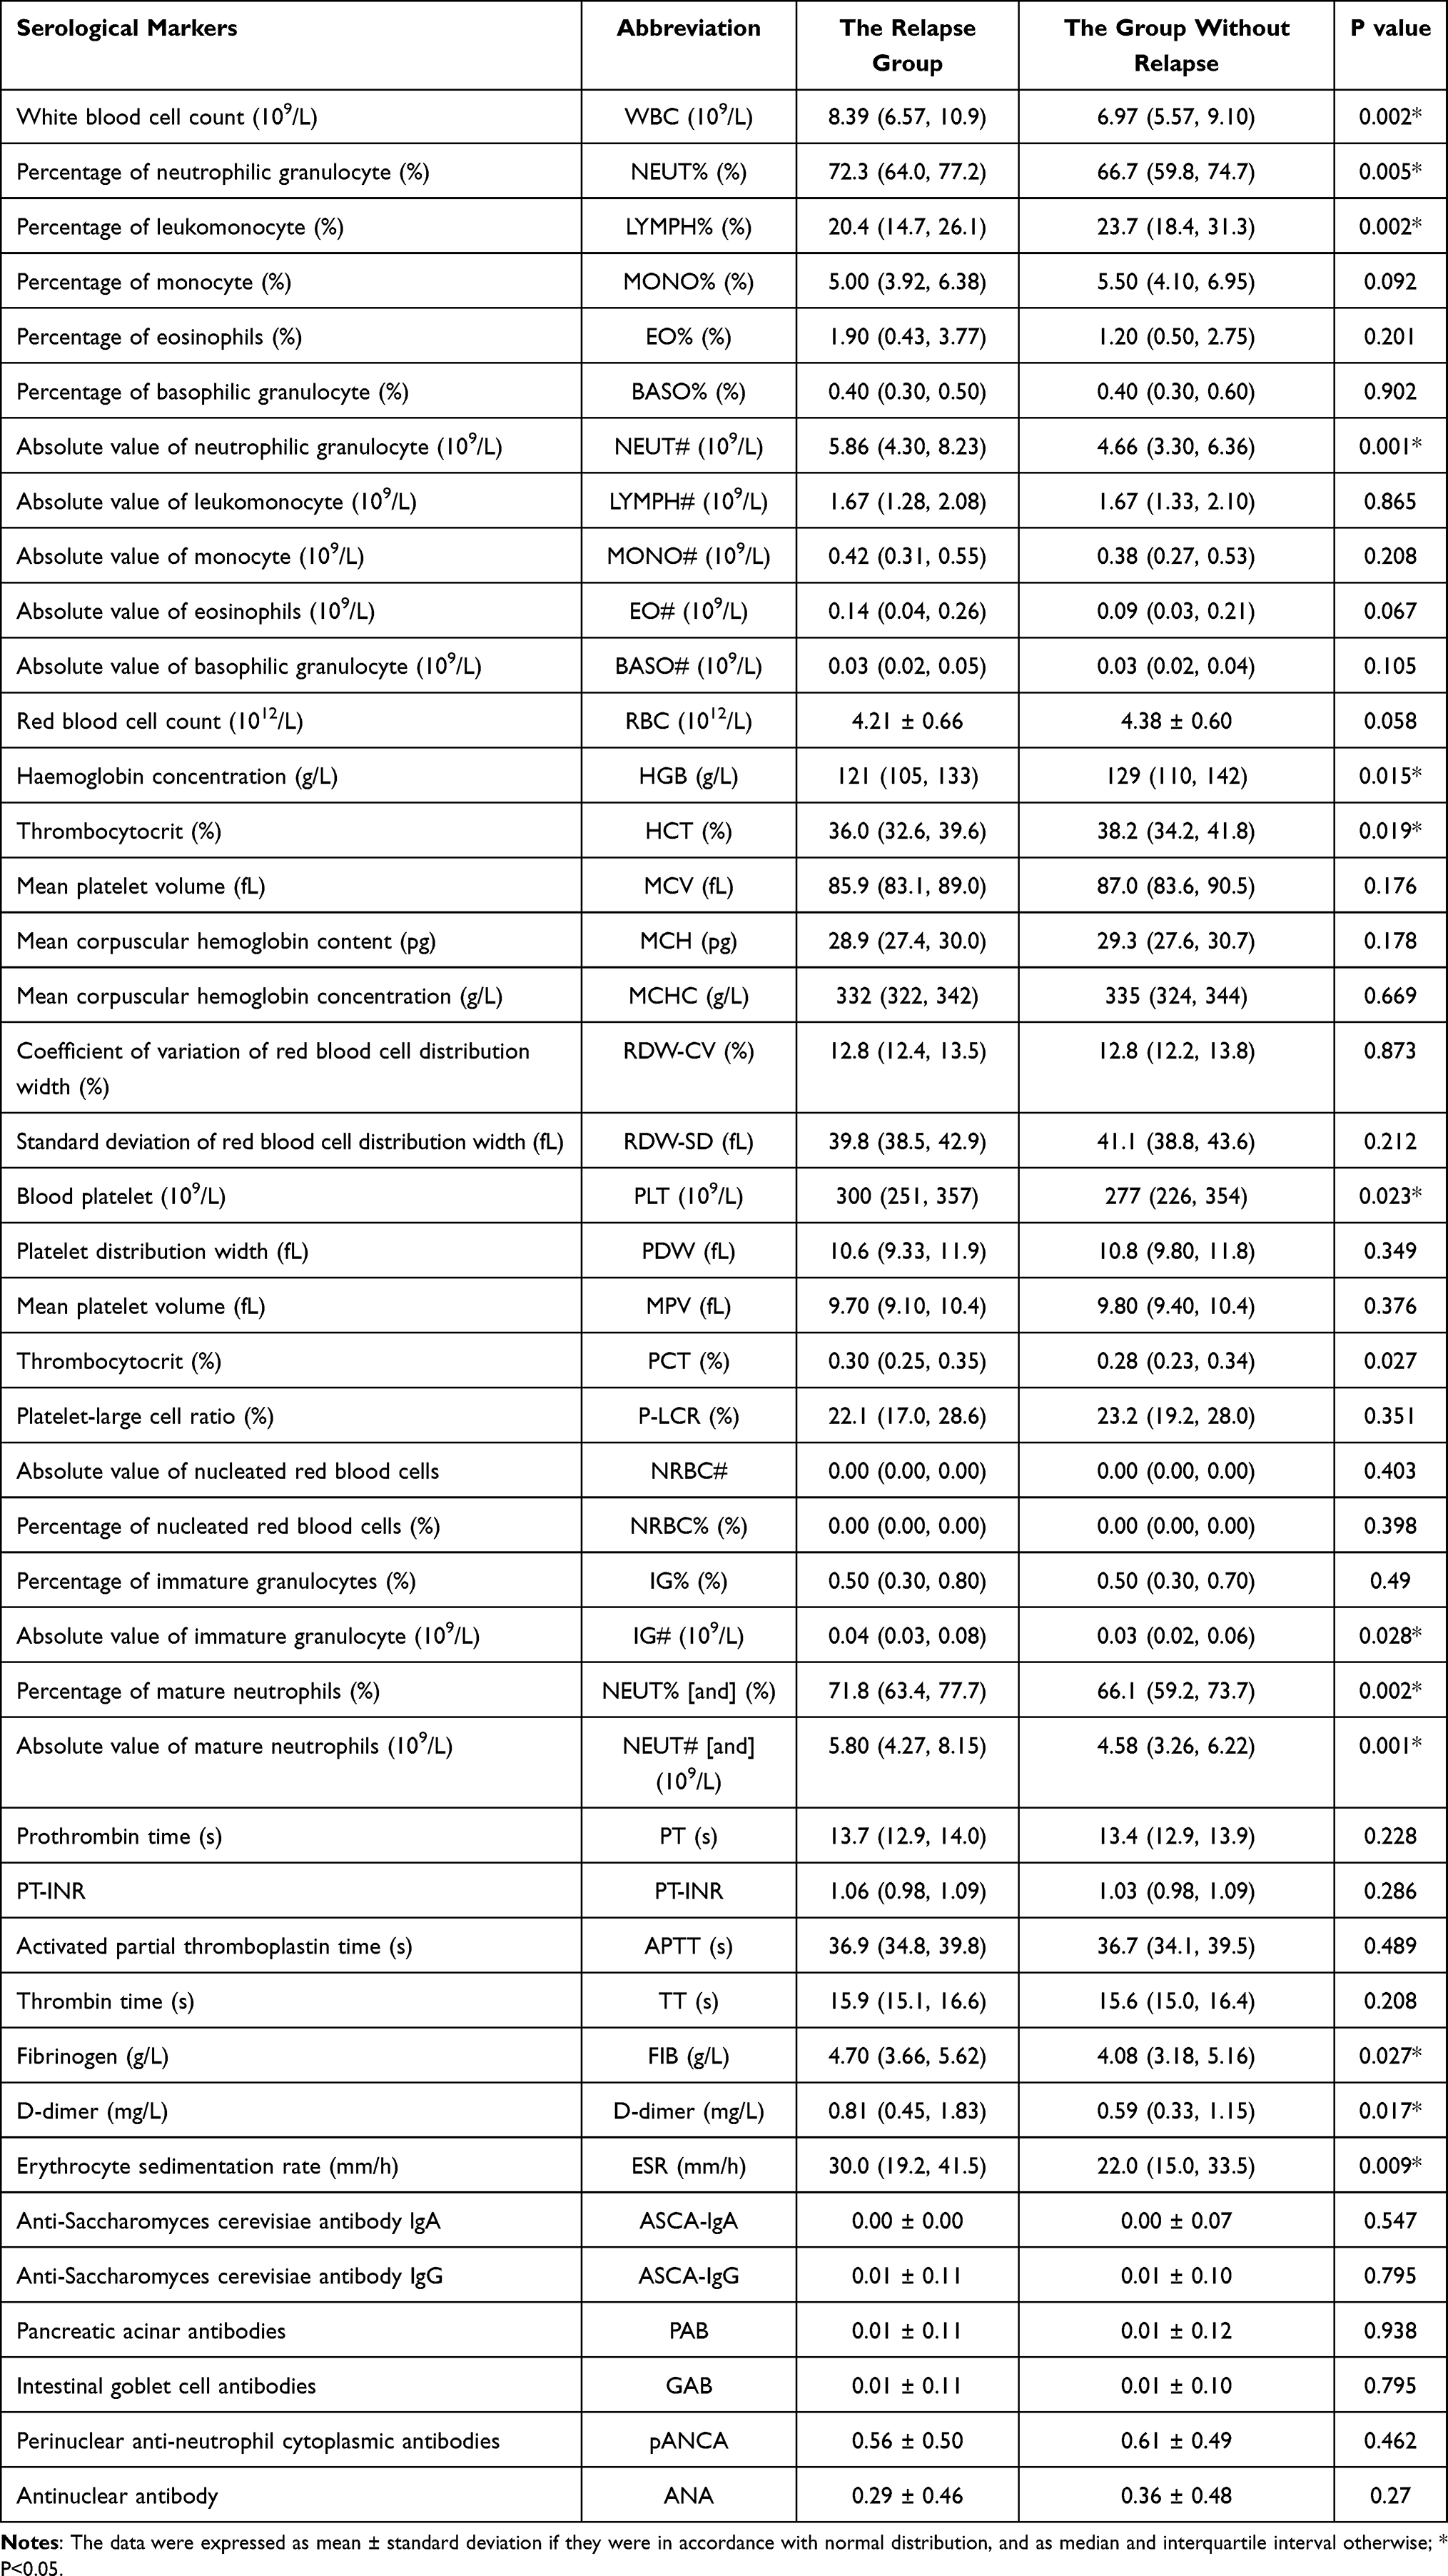 |
Table 2 The Serological Markers of UC Patients |
When comparing the values of the serological markers between the relapse group and the group without relapse, a total of 13 variables had statistically significant differences, including WBC, percentage of neutrophilic granulocyte (NEUT%), percentage of leukomonocyte (LYMPH%), absolute value of neutrophilic granulocyte (NEUT#), HGB, thrombocytocrit (HCT), blood platelet (PLT), absolute value of immature granulocyte (IG#), percentage of mature neutrophils (NEUT% [and]), absolute value of mature neutrophils (NEUT# [and]), fibrinogen (FIB), D-dimer, ESR.
Compared with the group without relapse, WBC (109/L) (8.39 [6.57, 10.9] vs 6.97 [5.57, 9.10], P = 0.002), NEUT% (%) (72.3 [64.0, 77.2] vs 66.7 [59.8, 74.7], P = 0.005), NEUT# (109/L) (5.86 [4.30, 8.23] vs 4.66 [3.30, 6.36], P = 0.001), PLT (109/L) (300 [251, 357] vs 277 [226, 354], P = 0.023), IG# (109/L) (0.04 [0.03, 0.08] vs 0.03 [0.02, 0.06], P = 0.028*), NEUT% [and] (%) (71.8 [63.4, 77.7] vs 66.1 [59.2, 73.7], P = 0.002*), NEUT# [and] (109/L) (5.80 [4.27, 8.15] vs 4.58 [3.26, 6.22], P = 0.001*), FIB (g/L) (4.70 [3.66, 5.62] vs 4.08 [3.18, 5.16], P = 0.027*), D-dimer (mg/L) (0.81 [0.45, 1.83] vs 0.59 [0.33, 1.15], P = 0.017*) and ESR (mm/h) (30.0 [19.2, 41.5] vs 22.0 [15.0, 33.5], P = 0.009*) in the relapse group were significantly elevated.
By contrast, three serological markers of re-admitted patients had lower values, being these differences statistically significant for LYMPH% (%) (20.4 [14.7, 26.1] vs 23.7 [18.4, 31.3], P = 0.002), HGB (g/L) (121 [105, 133] vs 129 [110, 142], P = 0.015), HCT (%) (36.0 [32.6, 39.6] vs 38.2 [34.2, 41.8], P = 0.019).
There were some significant differences in parameters of the routine blood test, while there was no significant difference in classical antibody markers, such as ASCA-lgA, ASCA-lgG, PAB, GAB, and pANCA between the two groups (P ≥ 0.05). The above results suggested that the serological markers of the relapse group are different, which can be further analyzed for the relapse of UC patients.
Construction of LR Models
We screened out 16 statistically significant potential predictors from the 36 variables in the training set using univariate regression analysis. After the variables were screened by stepwise regression, the multivariate regression analysis showed that gender, WBC, LYMPH%, percentage of monocyte (MONO%), NEUT#, and ESR were independent influencing factors. Among them, gender, WBC, and ESR were risk factors (OR > 1). LYMPH%, MONO% and NEUT# were protective factors (OR < 1). The univariate and multivariate Cox regression analyses in UC patients of the training set are shown in Table 3. We created a probability equation based on the above six predictors as follows.
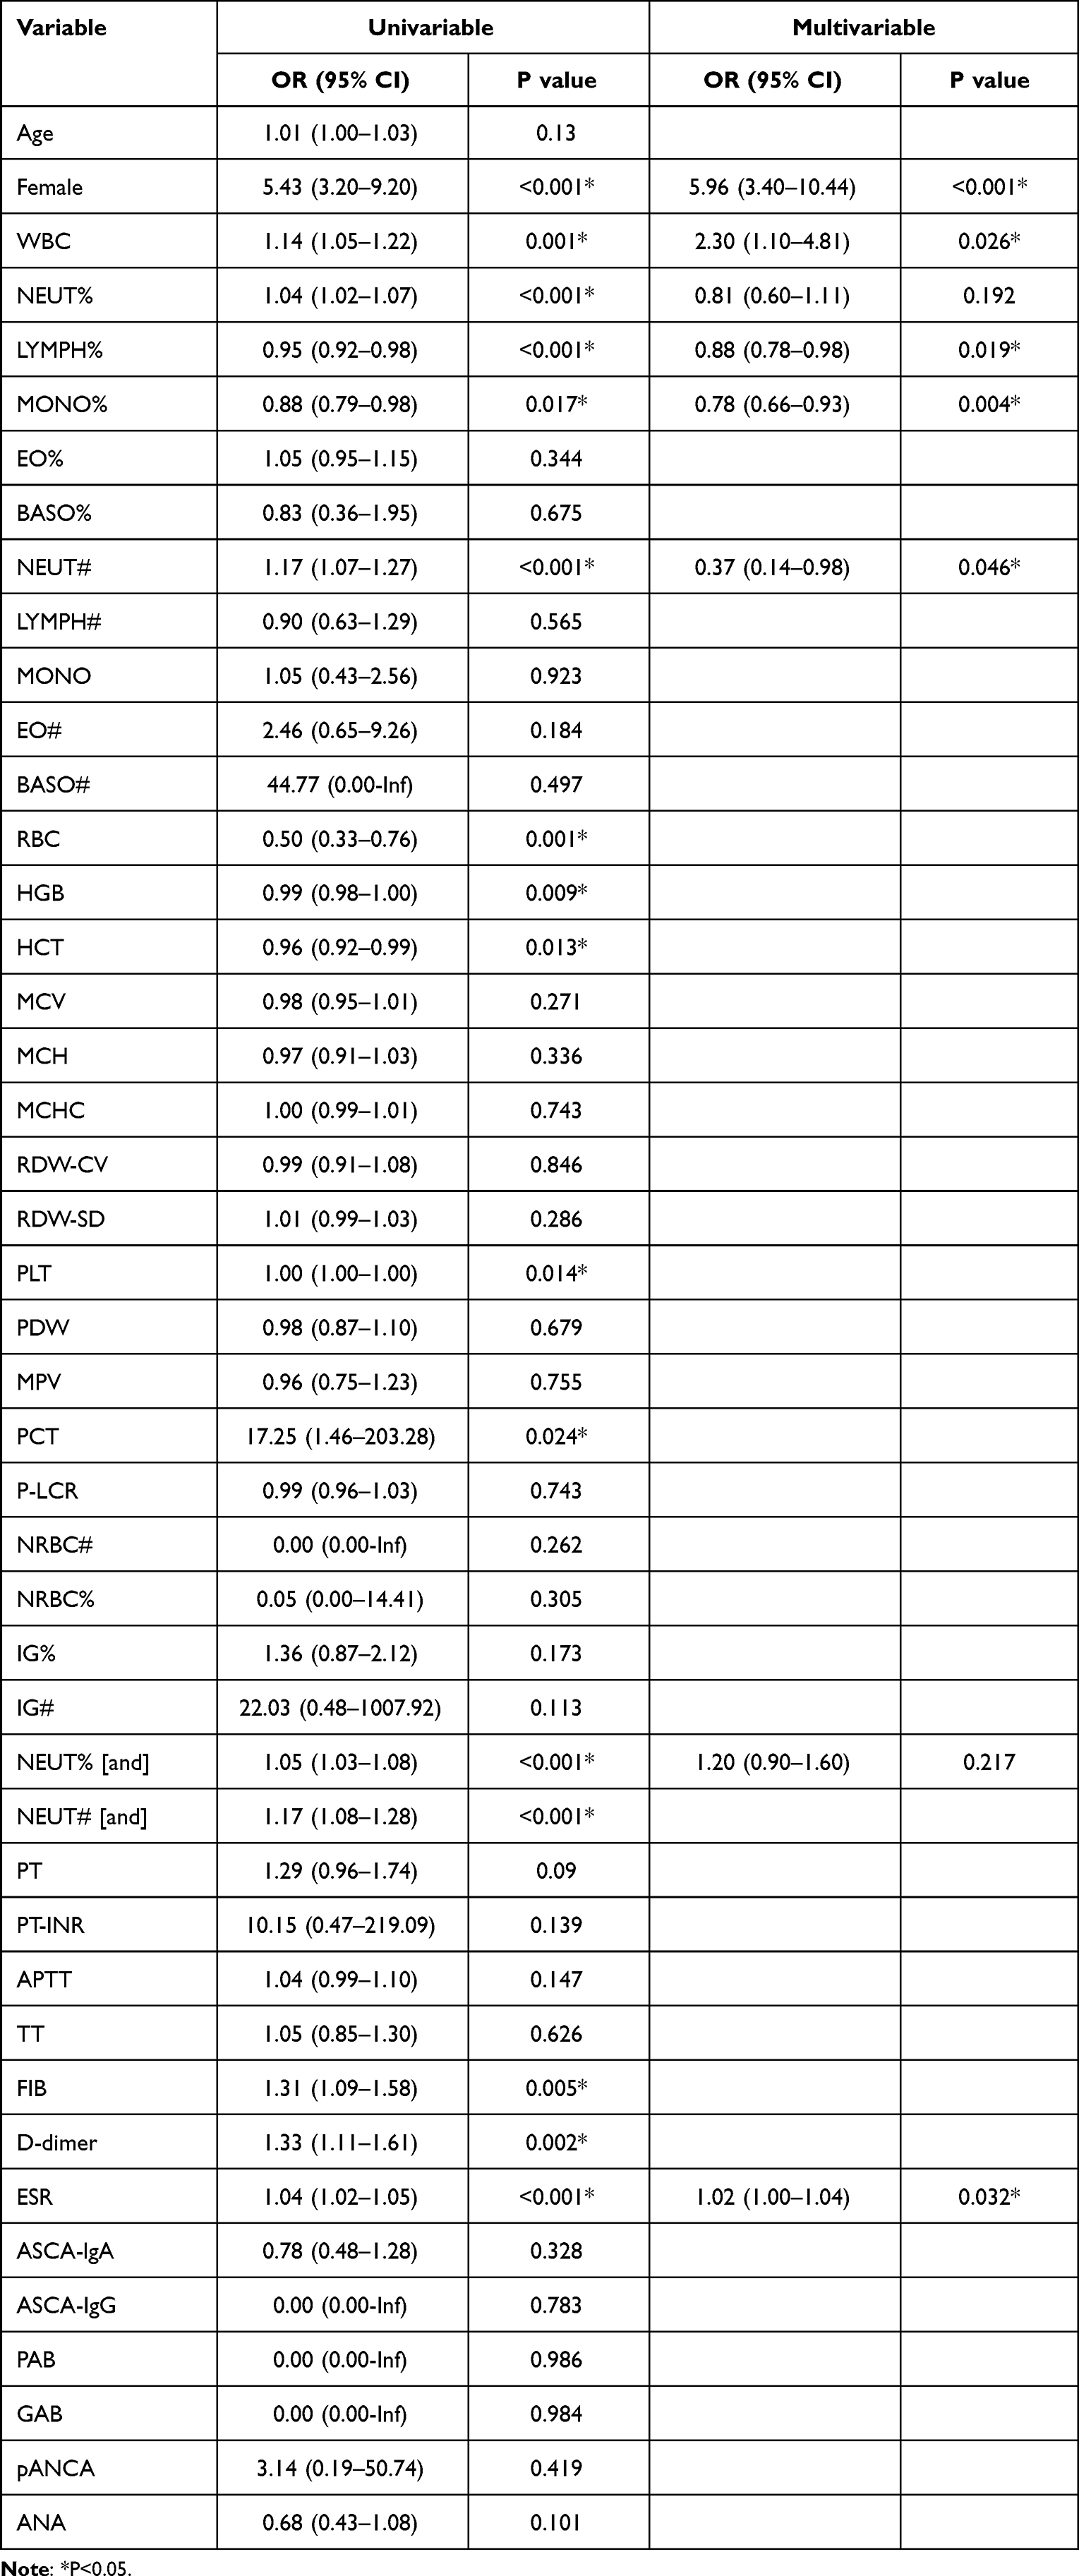 |
Table 3 Univariate and Multivariate Cox Regression Analysis in UC Patients |
Y = 1.800*Female + 0.856*WBC - 0.108*LYMPH% - 0.208*MONO% - 1.039*NEUT# + 0.023*ESR - 0.146
Development and Assessment of the Nomogram
In order to make the prediction model easy to use, we constructed a nomogram based on the above six variables (Figure 2). The value of each variable can be represented by drawing a straight line up from the corresponding value of the variable to the “point” line. Add the scores and mark them in the “Total points” line. Draw straight lines downward to the corresponding “predicted value” axis and obtain the possibility of relapse in UC patients.
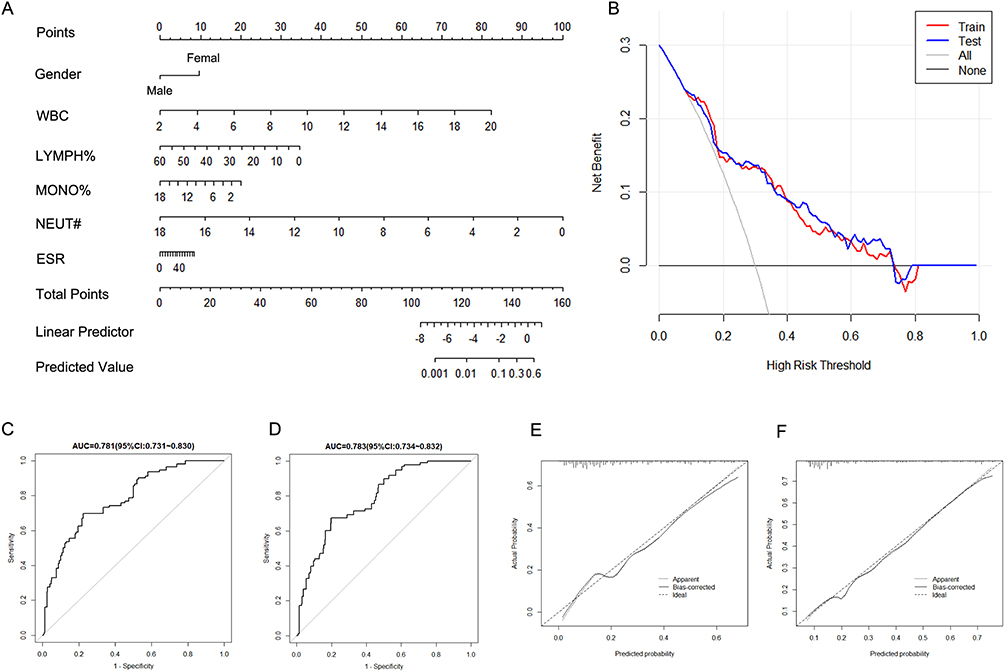 |
Figure 2 The nomogram predicting the relapse of UC. Abbreviations: WBC, white blood cell count; LYMPH%, Percentage of leukomonocyte; MONO%, Percentage of monocyte; NEUT#, Absolute value of neutrophilic granulocyte; ESR, erythrocyte sedimentation rate. Notes: The nomogram (A); Decision curve analysis for UC relapse prediction nomogram (B); AUC of the nomogram model in the test set (C) or training set (D); Calibration curve of discrimination nomogram in the test set (E) or training set (F), and the x-axis represents the predicted probability of UC relapse. |
The receiver operating curve analysis was performed to evaluate the predictive effectiveness of the model, and the AUC was considered to be an important indicator to evaluate the validity of the model. In the training set, AUC was 0.783 (accuracy = 0.769, sensitivity = 0.673, specificity = 0.801). Subsequently, we verified the validity of the test set, which showed an AUC of 0.781 (accuracy = 0.754, sensitivity = 0.696, specificity = 0.777). The high value of AUC indicates that the model has a strong ability to predict UC relapse. The calibration curve and decision curve of the nomogram are shown in Figure 2. Our calibration curve showed that the model had reliable calibration ability and small prediction errors. In addition, the decision curve showed that within the threshold probability interval between 0.1 and 0.8, the nomogram had strong clinical utility in predicting the relapse of UC patients.
Construction of RF, DT, and NN Models
Based on serological markers of UC patients, three other machine learning prediction models were further trained, including RF, DT, and NN. The average AUC of the four machine learning models was 0.828. The performance of the four machine learning classifiers in the test set and training set are shown in Table 4.
 |
Table 4 The Performance of Machine Learning Prediction Models |
The RF model showed the best performance (AUC = 0.889, accuracy = 0.764, sensitivity = 0.785, specificity = 0.764). The DT model had the second-best performance (AUC = 0.838, accuracy = 0.745, sensitivity = 0.735, specificity = 0.745). Except for the LR model, the NN model performed comparatively poorly, because it had a strong learning ability in the training set but performed poorly in the test set.
The best performances of models in the test set were obtained as representative results. The ROC curves and AUCs of the three models in the test set were measured (Figure 3). These data demonstrated that the model had a reliable predictive value. Although all models performed well on the training set, the RF model was found to have performed best in the test set. Therefore, the RF classifier was found to perform best.
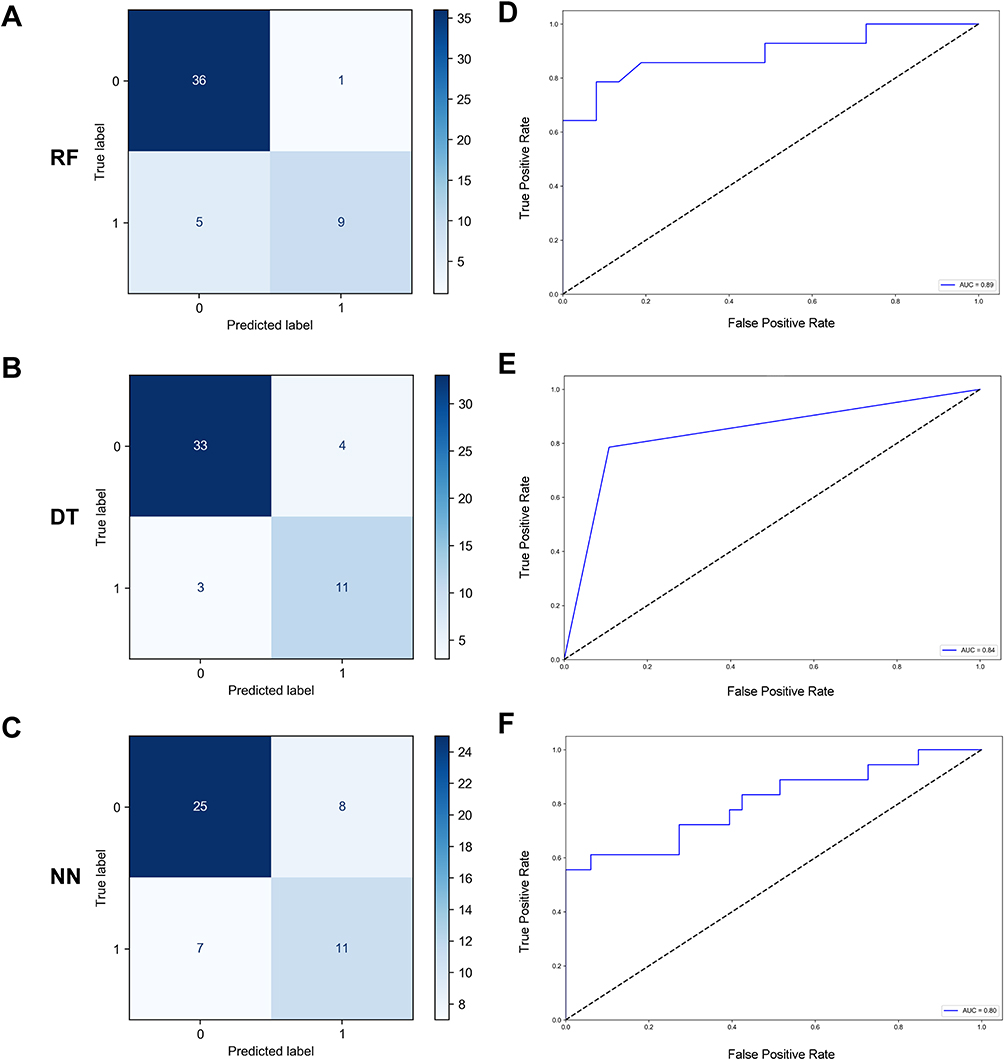 |
Figure 3 The performances of machine learning models. Abbreviations: RF, random forest; DT, decision tree; NN, neural network. Notes: Confusion matrix of the LR model (A), the DT model (B), and the NN model (C) in the test set; ROC curves the LR model (D), the DT model (E), and the NN model (F) in the test set. |
In the RF model, there were 45 variables including 43 serological markers, age, and gender. The relative weight coefficients of the variables were determined. The importance of variables is shown in Figure 4. We found that age had the greatest impact on classification results, followed by HGB, WBC, platelet distribution width (PDW), and RBC. In addition, the results of ASCA-lgA, ASCA-lgG, PAB, GAB, pANCA, and ANA were qualitative data and had poor performance. Among these antibodies that are closely associated with diagnosis, pANCA was the most important modeling variable.
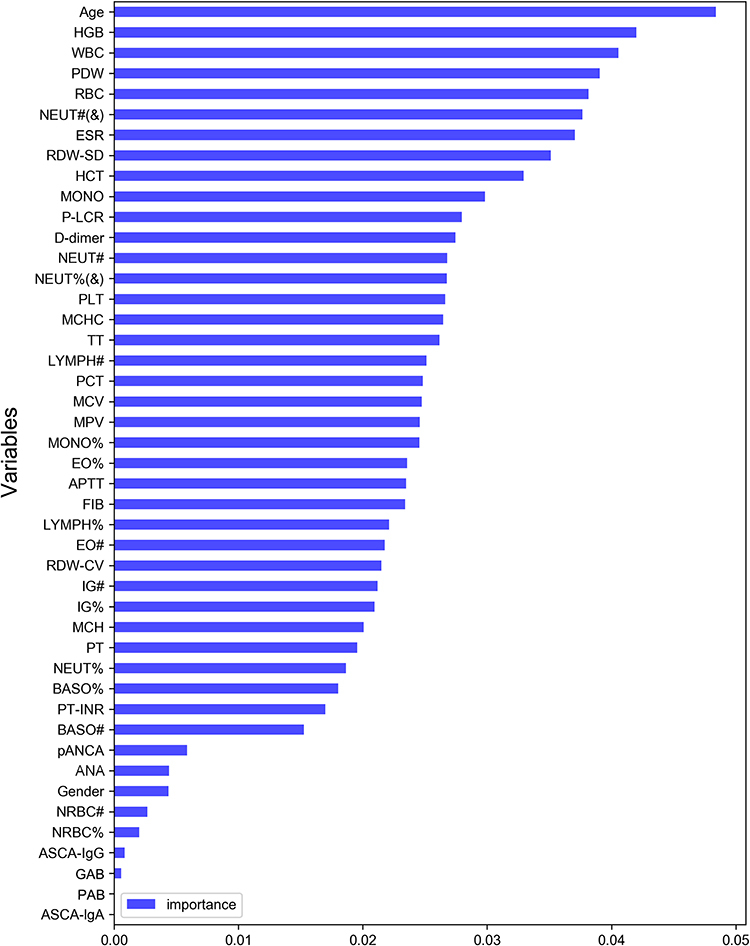 |
Figure 4 The importance of variables in the RF model. |
Discussion
Ulcerative colitis (UC) is a progressive immune-mediated disease characterized by chronic inflammation of the intestinal tract. UC is of great concern in Asian countries as the incidence has been increasing over the past few decades.6 UC usually has a long-term treatment and unpredictable relapse.20 Early evaluation of UC relapse can determine the treatment and reduce surgical rates.21 Therefore, it is very important to find a cost-effective, convenient, and accurate method to predict the relapse of UC.
In addition to the antibodies typically associated with UC, recent evidence suggests that serological markers involved in angiogenesis and inflammation may provide additional information to help better identify and predict the relapse of UC.22 The serological markers are readily available and at low cost. Studies have shown that the serological markers have a certain significance in the prognosis of patients with liver cancer, cervical cancer, and malignant melanoma, and to some extent reflect systemic inflammation.23,24 In recent years, prediction models based on serological markers have been increasingly developed in various diseases. Therefore, we aimed to combine four machine learning algorithms to explore the relationship between serological markers and UC relapse.
Blood indicators have been proven to correlate with UC relapse in multiple investigations. For example, NLR in peripheral blood is a novel effective predictor of the prognosis of UC. In a retrospective study of 129 UC patients, the cumulative recurrence rate was significantly higher in the low NLR group than in the high NLR group, and multivariate analysis determined that high NLR was an independent prognostic factor for clinical relapse (hazard ratio: 1.74; 95% CI: 1.02–2.98).25 Another study of 45 patients included similarly identified pretreatment NLR as an independent predictor of clinical relapse.26 The serological markers may aid in the determination of suitable treatment techniques and clinical practice judgments. It is recognized that mucosal healing in UC patients is associated with better outcomes.27 According to clinical studies, platelet count is independently and negatively associated with mucosal healing and may be a predictor of UC relapse.28 ASCA-lgA, ASCA-lgG, PAB, GAB, and pANCA are important auxiliary diagnostic indicators, which are often used for early diagnosis of colitis, and can also be used to predict UC recurrence. It has been shown that p-ANCA may be associated with pouchitis after proctocolectomy with ileal pouch-anal anastomosis for UC.29 Moreover, polymorphonuclear neutrophils and eosinophils are associated with UC relapse.30,31 Therefore, we identified UC patients who relapsed within one year and analyzed blood markers.
We found that the serological markers in patients with UC relapse were different from those in the group without relapse. A total of 13 variables had statistically significant differences, including WBC, NEUT%, LYMPH%, NEUT#, and HGB, etc., which were worthy of further analysis to predict the relapse. More clinical data could be collected in the future to enhance the analysis. Although deep learning is more popular than traditional methods, LR is still widely used in various fields due to its unique advantages. The most prominent that model is a simple and interpretability the model.32 Subsequently, the results of LR showed that female, patients with higher WBC levels, higher ESR levels, lower LYMPH% levels, lower MONO% levels, and lower NEUT# levels were more likely to relapse. In addition, a nomogram was constructed, and the performance was evaluated. Based on multivariate Cox regression analysis, the nomogram adopts a line segment with scale and draws it on the same plane in a certain proportion. Thus, the predicted value of the individual outcome event is calculated. The nomogram transforms the complex regression equation into a visual graph, making the results of the prediction model more readable.33 The six variables in the nomogram are routine clinical variables that are readily available to clinicians. The decision curve showed the clinical utility of our model, suggesting that it may be beneficial for clinicians to use the nomogram to predict UC relapse. The model might help clinicians treat UC patients in a timely manner and improve their prognosis.
Then, we used these serological markers to develop other three machine learning classifiers to predict the relapse of UC, including RF, DT, and NN. The models typically employ machine learning algorithms to assess the importance of variables in prediction, and provide information for subsequent clinical decisions. Diseases such as Alzheimer’s,34 acute kidney injury,35 pancreatitis,36 and breast cancer37 already utilized these algorithms. As a machine learning technique inspired by the human neuronal synapse system, the NN model has better predictive ability than the logistic Cox regression model.38 The DT model is simple to implement and provides an intuitive way to predict the outcomes. The algorithm distinguishes between “high” and “low” values of the predictors associated with the outcome. As a classifier containing multiple-decision trees, the RF model produces one of the best accuracies to date and has important advantages over other techniques in terms of the ability to handle highly nonlinear biological data, robustness to noise, simplicity of tuning, and the opportunity for efficient parallel processing.39 In this study, we collected clinical data from 292 UC patients and applied four machine learning algorithms. The results have shown that the AUC performance of LR, RF, DT, and NN models trained using serological markers is satisfactory, and their predictive value is reliable in our study. Even though all models did well on the training set, the RF fared best and has excellent predictive effectiveness with an AUC of 0.889 in the test set. It is observed that the RF classifier performed the best and has the greatest clinical application potential. The serological biomarker-based machine learning models can inform individuals about the future development of their diseases, guide doctors and patients to make joint decisions in further treatment, and assist in the formulation of clinical treatment plans. Accurate recurrence prediction is of great value to both medical research and practice.
Conclusion
The serological diagnostic markers have good predictive performance. We found that machine learning algorithms could effectively predict the recurrence of UC, which is worthy of clinical application. The predictive value of LR, RF, DT, and NN models using serological markers is reliable, and RF has the best performance. The model is simple and fast, which can help doctors treat UC patients in a timely manner. Unlike colonoscopy, the models do not have any contraindications, so they can be used more widely in the hospital.
Our study is an attempt at translational medicine to predict patients’ relapse with routine clinical variables readily available to clinicians. The serological biomarker-based machine learning models for the recurrence of UC can help clinicians to formulate corresponding treatments for patients and assist clinical decision support. The machine learning models of these serological markers along with the activity of UC should be further explored.
Ethical Approval
This study was approved by the Tianjin Union Medical Center Ethics Review Committee (2023-B30) and complied with the Declaration of Helsinki. By anonymizing information, the data used for analysis did not contain information such as name, ID number, or place of residence, so the requirement for informed written consent was waived. Study protocols were performed by ethical guidelines and regulations.
Acknowledgments
This work was funded by Tianjin Health Technology Project (Grant number TJWJ2023QN040), and the Science and Technology Program of Tianjin, China (Grant number 22JCQNJC01200). This research was supported by Tianjin Municipal Natural Science Foundation (Grant number 22JCQNJC0120).
Disclosure
The authors report no conflicts of interest in this work.
References
1. Wang R, Li Z, Liu S, et al. Global, regional and national burden of inflammatory bowel disease in 204 countries and territories from 1990 to 2019: a systematic analysis based on the Global Burden of Disease Study 2019. BMJ Open. 2023;13(3):e065186.
2. M’Koma AE. Inflammatory bowel disease: clinical diagnosis and pharmaceutical management. Med Res Arch. 2023;11(1):
3. Ungaro R, Mehandru S, Allen PB, et al. Ulcerative colitis. Lancet. 2017;389(10080):1756–1770.
4. Ho GT, Mowat C, Goddard CJ, et al. Predicting the outcome of severe ulcerative colitis: development of a novel risk score to aid early selection of patients for second-line medical therapy or surgery. Aliment Pharmacol Ther. 2004;19:1079–1087.
5. Dignass A, Eliakim R, Magro F, et al. Second European evidence-based consensus on the diagnosis and management of ulcerative colitis part 1: definitions and diagnosis. J Crohns Colitis. 2012;6:965–990.
6. Ng SC, Shi HY, Hamidi N, et al. Worldwide incidence and prevalence of inflammatory bowel disease in the 21st century: a systematic review of population-based studies [published correction appears in Lancet. Lancet. 2020;396(10256):
7. Chen P, Zhou G, Lin J, et al. Serum Biomarkers for Inflammatory Bowel Disease. Front Med. 2020;7:123.
8. Høie O, Aamodt G, Vermeire S, et al. Serological markers are associated with disease course in ulcerative colitis. A study in an unselected population-based cohort followed for 10 years. J Crohns Colitis. 2008;2(2):114–122.
9. Pang Y, Ruan H, Wu D, et al. Assessment of clinical activity and severity using serum ANCA and ASCA antibodies in patients with ulcerative colitis. Allergy Asthma Clin Immunol. 2020;16:37.
10. Singh S, Ananthakrishnan AN, Nguyen NH, et al. AGA Clinical Practice Guideline on the Role of Biomarkers for the Management of Ulcerative Colitis. Gastroenterology. 2023;164(3):344–372.
11. Ma L, Pang X, Ji G, et al. Application of the neutrophil to lymphocyte ratio in the diagnosis and activity determination of ulcerative colitis: a meta-analysis and systematic review. Medicine. 2021;100(42):e27551.
12. Plevy S, Silverberg MS, Lockton S, et al. Combined serological, genetic, and inflammatory markers differentiate non-IBD, Crohn’s disease, and ulcerative colitis patients. Inflamm Bowel Dis. 2013;19(6):1139–1148.
13. Wang T, Yu W, Wu F, Zhang Y, Shang J, Zhao Z. Construction of a Nomogram Discriminating Malignancy-Associated Membranous Nephropathy From Idiopathic Membranous Nephropathy: a Retrospective Study. Front Oncol. 2022;12:914092.
14. Chen W, Zhang L, Cai G, et al. Machine learning-based multimodal MRI texture analysis for assessing renal function and fibrosis in diabetic nephropathy: a retrospective study. Front Endocrinol (Lausanne). 2023;14:1050078.
15. Hadi F, Sumarsono B, Lee KS, et al. A treatment prediction strategy for overactive bladder using a machine learning algorithm that utilized data from the FAITH study. Neurourol Urodyn. 2023. doi:10.1002/nau.25190
16. Feng C, Di J, Jiang S, et al. Machine learning models for prediction of invasion Klebsiella pneumoniae liver abscess syndrome in diabetes mellitus: a singled centered retrospective study. BMC Infect Dis. 2023;23(1):284.
17. Li H, Lai L, Shen J. Development of a susceptibility gene based novel predictive model for the diagnosis of ulcerative colitis using random forest and artificial neural network. Aging. 2020;12(20):20471–20482.
18. Bamber JH, Evans SA. The value of decision tree analysis in planning anaesthetic care in obstetrics. Int J Obstet Anesth. 2016;27:55–61.
19. Kriegeskorte N, Golan T. Neural network models and deep learning. Curr Biol. 2019;29(7):R231–R236.
20. Zhao M, Gönczi L, Lakatos PL, et al. The Burden of Inflammatory Bowel Disease in Europe in 2020. J Crohns Colitis. 2021;15(9):1573–1587.
21. Yuan W, Marwaha JS, Rakowsky ST, et al. Trends in Medical Management of Moderately to Severely Active Ulcerative Colitis: a Nationwide Retrospective Analysis. Inflamm Bowel Dis. 2023;29(5):695–704.
22. Kraszewski S, Szczurek W, Szymczak J, et al. Machine Learning Prediction Model for Inflammatory Bowel Disease Based on Laboratory Markers. Working Model in a Discovery Cohort Study. J Clin Med. 2021;10(20):4745.
23. Bolander A, Agnarsdóttir M, Wagenius G, et al. Serological and immunohistochemical analysis of S100 and new derivatives as markers for prognosis in patients with malignant melanoma. Melanoma Res. 2008;18(6):412–419.
24. Ou Z, Mao W, Tan L, et al. Prediction of Postoperative Pathologic Risk Factors in Cervical Cancer Patients Treated with Radical Hysterectomy by Machine Learning. Curr Oncol. 2022;29(12):9613–9629.
25. Kurimoto N, Nishida Y, Hosomi S, et al. Neutrophil-to-lymphocyte ratio may predict clinical relapse in ulcerative colitis patients with mucosal healing. PLoS One. 2023;18(1):e0280252.
26. Nishida Y, Hosomi S, Yamagami H, et al. Pretreatment neutrophil-to-lymphocyte ratio predicts clinical relapse of ulcerative colitis after tacrolimus induction. PLoS One. 2019;14(3):e0213505.
27. Furukawa S, Yagi S, Shiraishi K, et al. Association between platelet count and mucosal healing in Japanese patients with ulcerative colitis: a cross-sectional study. BMC Gastroenterol. 2020;20(1):384.
28. Nakarai A, Kato J, Hiraoka S, et al. Prognosis of ulcerative colitis differs between patients with complete and partial mucosal healing, which can be predicted from the platelet count. World J Gastroenterol. 2014;20(48):18367–18374.
29. Fleshner PR, Vasiliauskas EA, Kam LY, et al. High level perinuclear antineutrophil cytoplasmic antibody (pANCA) in ulcerative colitis patients before colectomy predicts the development of chronic pouchitis after ileal pouch-anal anastomosis. Gut. 2001;49(5):671–677.
30. Li Y, Zhang YY, Yang LT, et al. FcγRI plays a critical role in patients with ulcerative colitis relapse. Eur J Immunol. 2021;51(2):459–470.
31. Mookhoek A, Haasnoot ML, Bredenoord AJ, et al. The Clinical Significance of Eosinophils in Ulcerative Colitis: a Systematic Review. J Crohns Colitis. 2022;16(8):1321–1334.
32. Li H, Mo Y, Huang C, et al. An MSCT-based radiomics nomogram combined with clinical factors can identify Crohn’s disease and ulcerative colitis. Ann Transl Med. 2021;9(7):572.
33. Wu F, Zhang Y, Cui W, et al. Development and validation of a discrimination model between primary PLA2R-negative membranous nephropathy and minimal change disease confirmed by renal biopsy. Sci Rep. 2021;11(1):18064.
34. James C, Ranson JM, Everson R, et al. Performance of Machine Learning Algorithms for Predicting Progression to Dementia in Memory Clinic Patients. JAMA Netw Open. 2021;4(12):e2136553.
35. Chiofolo C, Chbat N, Ghosh E, et al. Automated Continuous Acute Kidney Injury Prediction and Surveillance: a Random Forest Model. Mayo Clin Proc. 2019;94(5):783–792.
36. Hong W, Lu Y, Zhou X, et al. Usefulness of Random Forest Algorithm in Predicting Severe Acute Pancreatitis. Front Cell Infect Microbiol. 2022;12:893294.
37. Sammut SJ, Crispin-Ortuzar M, Chin SF, et al. Multi-omic machine learning predictor of breast cancer therapy response. Nature. 2022;601(7894):623–629.
38. Chen KA, Joisa CU, Stem JM, et al. Prediction of Ureteral Injury During Colorectal Surgery Using Machine Learning. Am Surg. 2023;31348231173981.
39. Hasannejadasl H, Osong B, Bermejo I, et al. A comparison of machine learning models for predicting urinary incontinence in men with localized prostate cancer. Front Oncol. 2023;13:1168219.
 © 2023 The Author(s). This work is published and licensed by Dove Medical Press Limited. The
full terms of this license are available at https://www.dovepress.com/terms
and incorporate the Creative Commons Attribution
- Non Commercial (unported, 3.0) License.
By accessing the work you hereby accept the Terms. Non-commercial uses of the work are permitted
without any further permission from Dove Medical Press Limited, provided the work is properly
attributed. For permission for commercial use of this work, please see paragraphs 4.2 and 5 of our Terms.
© 2023 The Author(s). This work is published and licensed by Dove Medical Press Limited. The
full terms of this license are available at https://www.dovepress.com/terms
and incorporate the Creative Commons Attribution
- Non Commercial (unported, 3.0) License.
By accessing the work you hereby accept the Terms. Non-commercial uses of the work are permitted
without any further permission from Dove Medical Press Limited, provided the work is properly
attributed. For permission for commercial use of this work, please see paragraphs 4.2 and 5 of our Terms.
Recommended articles
The Impact of Cytomegalovirus Infection on Ulcerative Colitis Relapse: A Multicenter Retrospective Cohort Study
Xiao L, Ma J, Chen R, Chen J, Wang Q, Tang N, Zhao X, Zhang H, Jiao C
Journal of Inflammation Research 2024, 17:9059-9070
Published Date: 19 November 2024
Role of Aging in Ulcerative Colitis Pathogenesis: A Focus on ETS1 as a Promising Biomarker

Ni M, Peng W, Wang X, Li J
Journal of Inflammation Research 2025, 18:1839-1853
Published Date: 6 February 2025
Identification of Senescence-Related Genes for the Prediction of Ulcerative Colitis Based on Interpretable Machine Learning Models
Ma J, Chen C, Wang N, Fang T, Liu Y, He P, Dong W
Journal of Inflammation Research 2025, 18:3431-3447
Published Date: 10 March 2025
Identification and Validation of Feature Genes Related to Mitochondrial Dysfunction and Oxidative Stress in Ulcerative Colitis
Wu Y, Tan Z, Lan Q, Liu Y, Liu C, He H, Zhang J, Dong W
Journal of Inflammation Research 2025, 18:5835-5850
Published Date: 30 April 2025
Immune Microenvironment Characterization and Machine Learning-Guided Identification of Diagnostic Biomarkers for Ulcerative Colitis

Zheng Q, Wang L, Zhang Y, Peng J, Hou J, Wang H, Ma Y, Tang P, Li Y, Li H, Chen Y, Li J, Chen Y
Journal of Inflammation Research 2025, 18:8977-8992
Published Date: 9 July 2025