")
Back to Journals » International Journal of General Medicine » Volume 15
SEMA3D Plays a Critical Role in Peptic Ulcer Disease-Related Carcinogenesis Induced by H. pylori Infection
Authors Wang Z, Wei Y, An L, Wang K, Hong D, Shi Y, Zang A, Su S, Li W
Received 5 November 2021
Accepted for publication 11 January 2022
Published 9 February 2022 Volume 2022:15 Pages 1239—1260
DOI https://doi.org/10.2147/IJGM.S343635
Checked for plagiarism Yes
Review by Single anonymous peer review
Peer reviewer comments 2
Editor who approved publication: Dr Scott Fraser
Zhiyu Wang, Yaning Wei, lin An, Kunjie Wang, Dan Hong, Yan Shi, Aimin Zang, Shenyong Su, Wenwen Li
Department of Medical Oncology, Affiliated Hospital of Hebei University, Baoding, Hebei Province, People’s Republic of China
Correspondence: Wenwen Li
Department of Medical Oncology, Affiliated Hospital of Hebei University, Baoding, 071000, Hebei Province, People’s Republic of China
, Email [email protected]
Background: Immune cell infiltration plays a critical role in regulating peptic ulcer disease (PUD) and gastrointestinal cancer (GC). However, regulators of the cell signaling hubs remain unclear.
Aim: This study characterizes genes that are differentially expressed in PUD and GC tissue samples. Bioinformatics is used to define the immune-associated hub genes associated with the malignant transfer process of PUD to GC.
Methods: Total expression data from PUD and early-stage GC tissue samples were obtained from GEO and TCGA. Differentially expressed genes were assessed and immunological enrichment analysis was performed. Protein–protein interaction (PPI) and Cytoscape analysis were used together to identify the hub genes. CIBERSORT and COX analysis were used to analyze the differentially infiltrated immune cell landscapes and determine HR scores of the hub genes.
Results: Expression data identified 437 DEGs as common to both GC and PUD tissue. Of these, 49 immune-related DEGs were grouped by function, and seven hub genes were identified by PPI analysis. The NRP2 and SEMA3D genes were then selected for survival analysis. SEMA3D had a higher hazard ratio than NRP2 and was defined as the hub for PUD carcinogenesis.
Conclusion: SEMA3D was characterized as the hub gene for PUD carcinogenesis.
Keywords: SEMA3D, peptic ulcer disease, gastric cancer, H. pylori, immunological micro-environment
Introduction
Helicobacter pylori (HP) is a Gram-negative gastrointestinal bacterium that infects nearly half of the world population.1 HP infection is associated with the occurrence and progress of peptic ulcer disease (PUD) and gastrointestinal cancer (GC).2,3 The causes of GC, and its connection to PUD, remain poorly defined. Recently, HP-induced chronic inflammation has been shown to play an important role in GC occurrence and development.4 Prior studies defined several chemokines and cytokines involved in inflammation of the gastric epithelium.5
The cell microenvironment is the environment where tumor cells originate and develop. This region also consists of stromal cells, the tumor vascular system, immune cells, the extracellular matrix (ECM), and the acidic and hypoxic environment of the tumor.6,7 Immune cells are the major cell types in the microenvironment and release many chemokines and cytokines that dictate disease outcomes in response to infection.8 During the development of peptic ulcers caused by HP infection, NF-kB signaling is activated by inflammatory factors like IL-8.9
In recent years, bioinformatics tools and software have been developed to quickly explore differentially expressed target genes and identify hub genes that contribute to disease progression.10 The CIBERSORT algorithm is a newly developed tool to assess the association between immune cell landscapes in the cell microenvironment using the existing 22 immune cell signatures.11 This method has been successfully used to identify prognostic immune markers in lung, breast, and gastric cancer.12,13 The present study used the CIBERSORT algorithm to calculate the proportions of 22 immune cells that infiltrate the ECM during PUD and GC, based on The Cancer Genome Atlas (TCGA) (for early-stage GC) and the Gene Expression Omnibus GEO (for PUD) databases. Inflammation and differentially expressed genes (DEGs) associated with tumors were also assessed and SEMA3D was shown to correlate with the development of peptic ulcers and the immune cell signatures. SEMA3D is a member of Class-3 semaphorins (SEMA3s), which are reported to play pivotal roles in immune response, angiogenesis, apoptosis, cell migration, and local and metastatic cancer spread in pan-cancer.14,15 SEMA3E, a gene in the same family as SEMA3D, is a lymph node metastasis-related gene expressed in gastric cancer.16 SEMA3E deficiency dysregulates many immune cell functions both directly and indirectly.17,18 Prior studies indicated that Semaphorin 3D and 3E have similar cellular functions, however, the exact role of SEMA3D in gastric cancer remains poorly understood.19,20 Inappropriately regulated gastric immune responses to HP in the cell microenvironment are critical to the development of gastroduodenal disease and responses to treatment.5 For example, CD4+T cell-derived IFN-γprovides the key stimulus for the development of gastric premalignant lesions that progress to GC.9 SEMA3D also contributes to CD4+T cell infiltration in osteoarthritis joints.21 Other immune cells, including macrophages, dendritic cells (DCs), B cells, and gastric epithelial cells (GECs) contribute to the mucosal response to HP infection.18,22 DCs affect the Treg/Th17 balance induced by HP infection and indirectly activate T cells.19,23 In the current study, SEMA3D expression was primarily found in DCs from PUD samples. Similarly, prior research indicates that SEMA3E regulates DC function.17,20 Thus, it was hypothesized that SEMA3D contributes to gastric epithelium carcinogenesis by regulating immune cell infiltration. He findings reported here indicate that SEMA3D may play an essential role in the cell microenvironment and could serve as a promising prognostic biomarker for the malignant transformation of peptic ulcers.
Materials and Methods
Data Preparation
Gene expression data from 118 early-stage GC samples and 32 PUD gastric mucosa (uninfected or HP-infected) were downloaded from TCGA and GEO databases, respectively (Table 1. GC patients who were diagnosed with stages I or II according to the 6th and 7th editions of the AJCC Cancer Staging Manual were included in this study. Clinical information for each patient was obtained from the TCGA database following TCGA publication guidelines and data access policies. Patients were excluded if they had recurrent GC, therapies performed before admission, other observed clinical disorders, or other GC clinical stages. PUD gene expression information was obtained from the GSE60427 dataset. The microarray platform for GSE60427 was GPL1707. Eight mucosa tissue samples were included in the normal group (GSM1479654, GSM1479655, GSM1479656, GSM1479657, GSM1479670, GSM1479671, GSM1479672 and GSM1479673) and 24 samples were included in the HP+ group (GSM1479658, GSM1479659, GSM1479660, GSM1479661, GSM1479662, GSM1479663, GSM1479664, GSM1479665, GSM1479666, GSM1479667, GSM1479668, GSM1479669, GSM1479674, GSM1479675, GSM1479676, GSM1479677, GSM1479678, GSM1479679, GSM1479680, GSM1479681, GSM1479682, GSM1479683, GSM1479684 and GSM1479685). The 32 samples used for microarray analysis were selected from 293 patient subjects. All the patients provided written informed consent and the protocols were approved by the ethics committees of Oita University (Japan). Patients with PUD and GC were identified by endoscopy. Gastritis was defined as HP gastritis in the absence of peptic ulcers or gastric malignancy. Patients with a history of partial gastric resection or who had received HP eradication therapy or treatment with antibiotics, bismuth-containing compounds, H2-receptor blockers, or proton pump inhibitors within four weeks prior to the study were excluded. All the clinical information was obtained from the previous papers.14 The number of included and excluded subjects in the study was summarized in Flow Chart (Figure S1). The protocols described above were approved by the ethics committees of Affiliated Hospital of Hebei University (AHHU20211029).
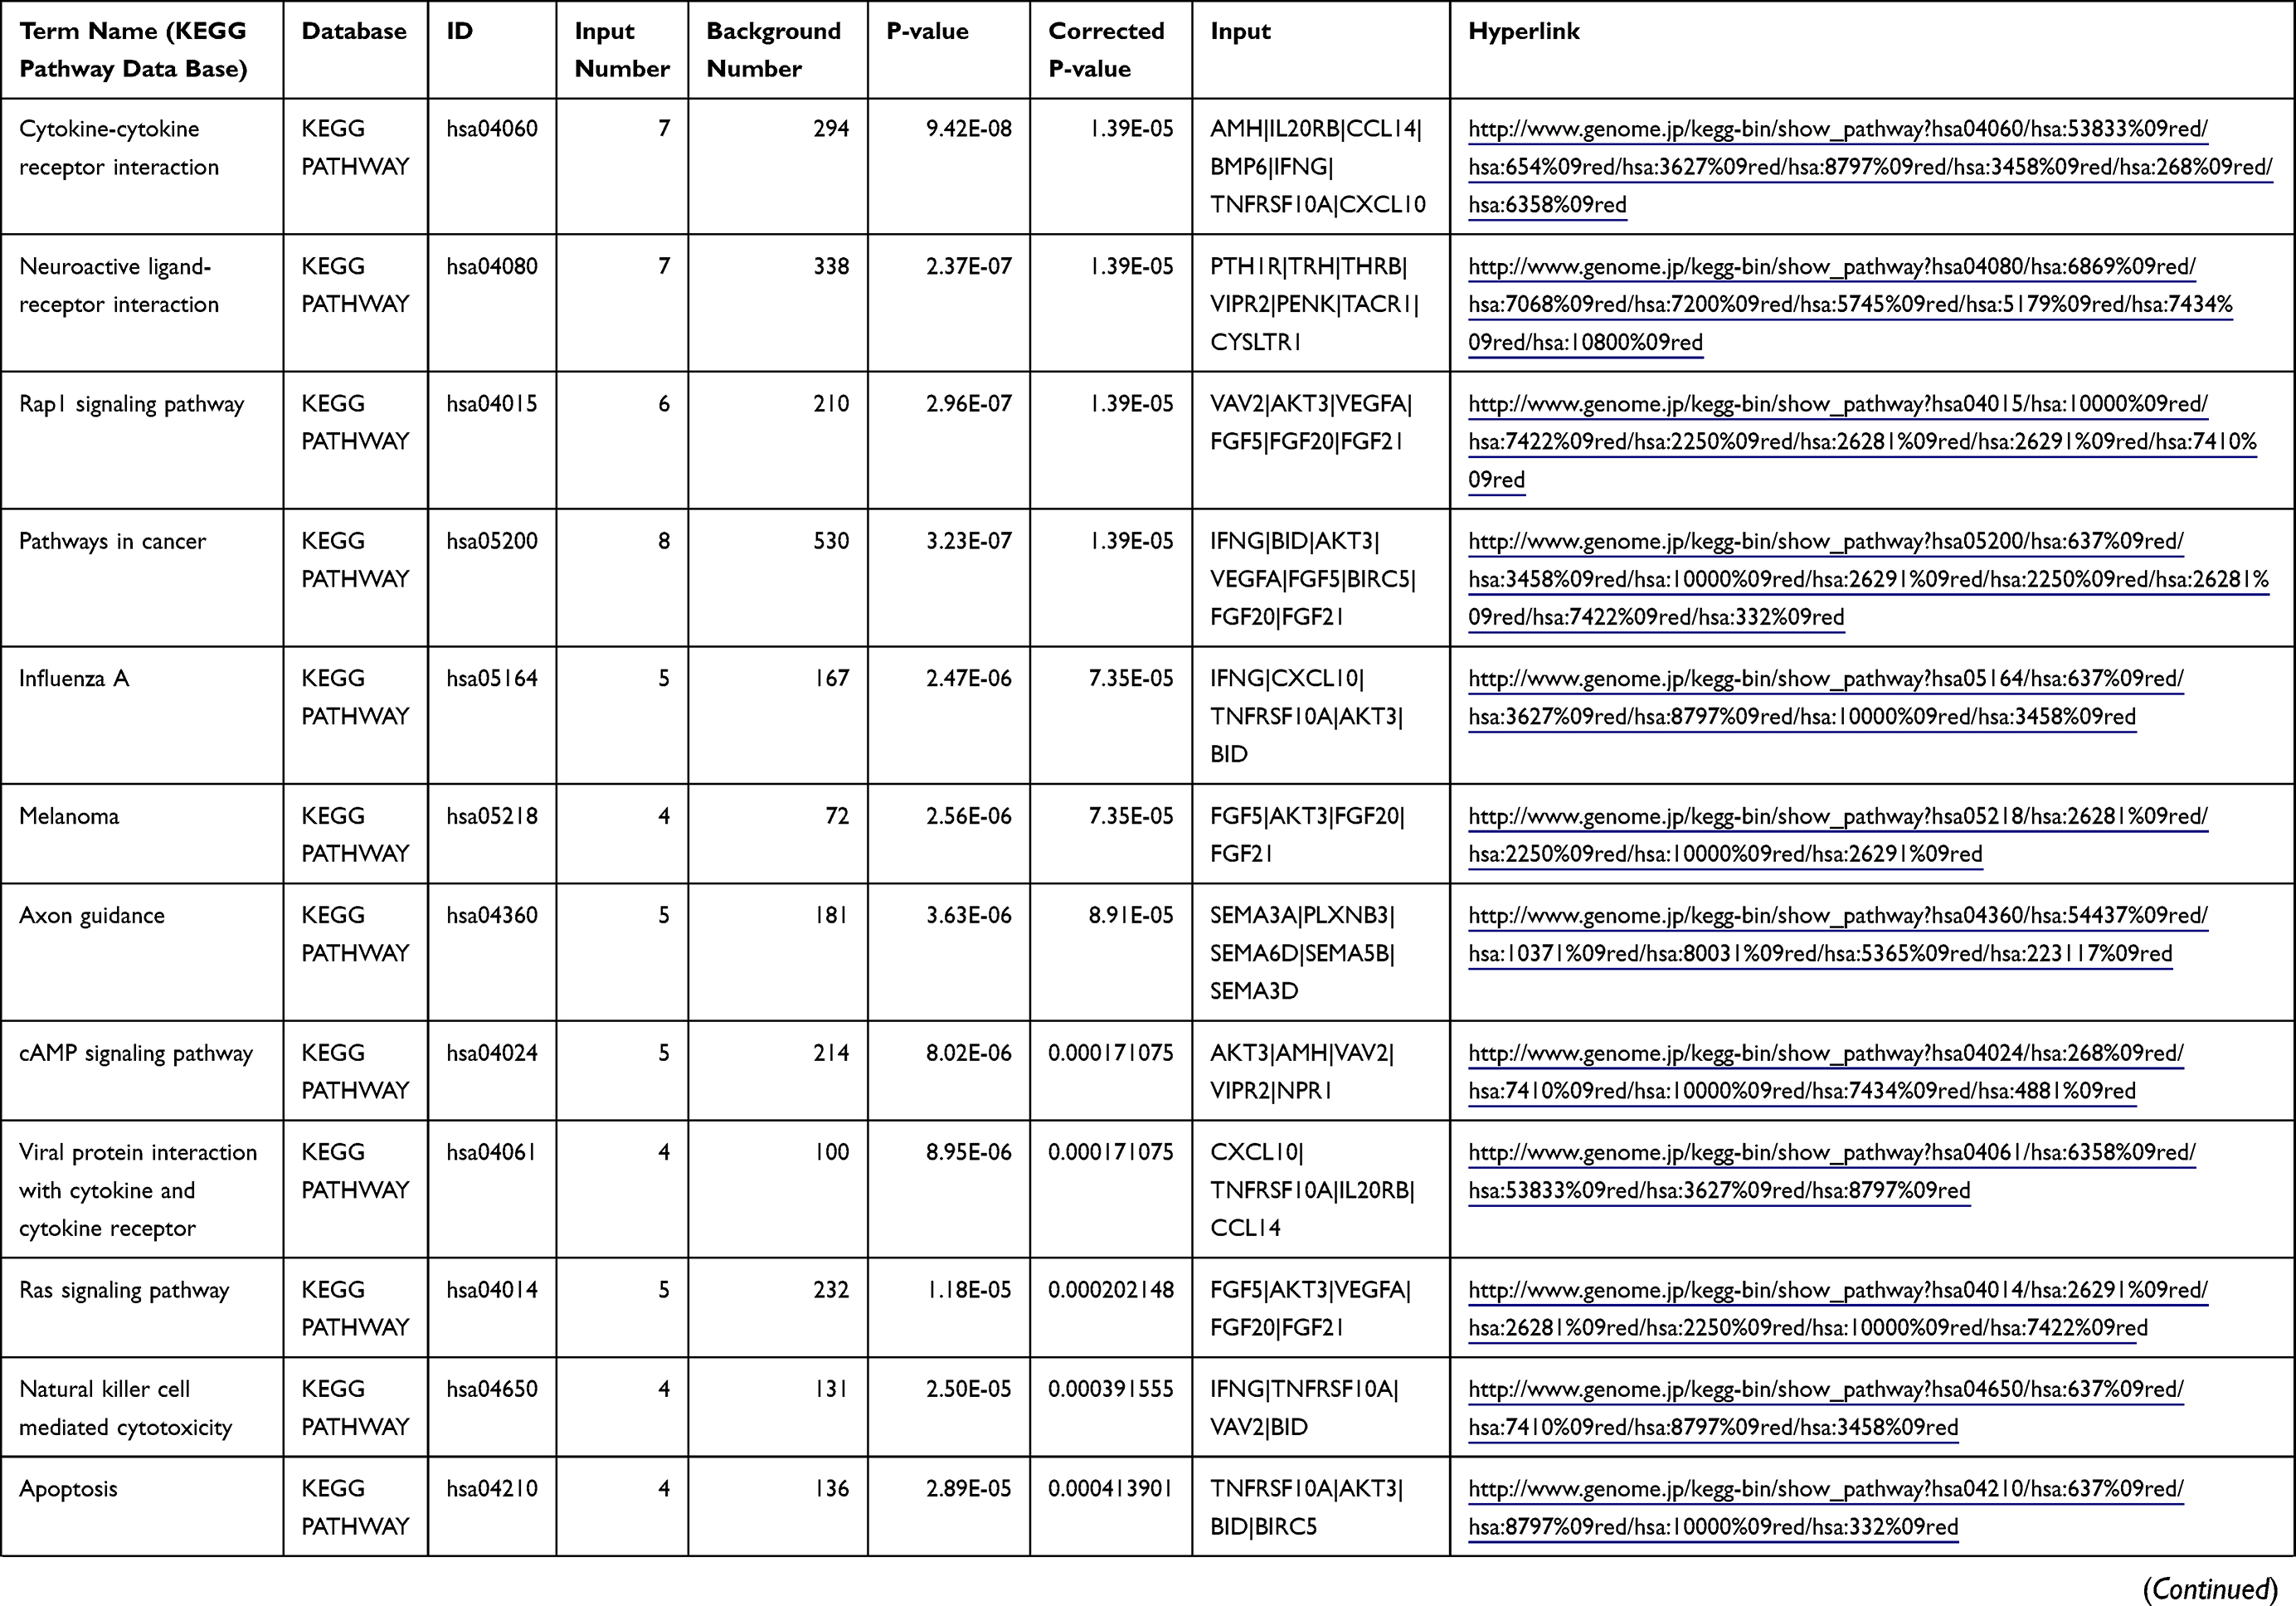 | 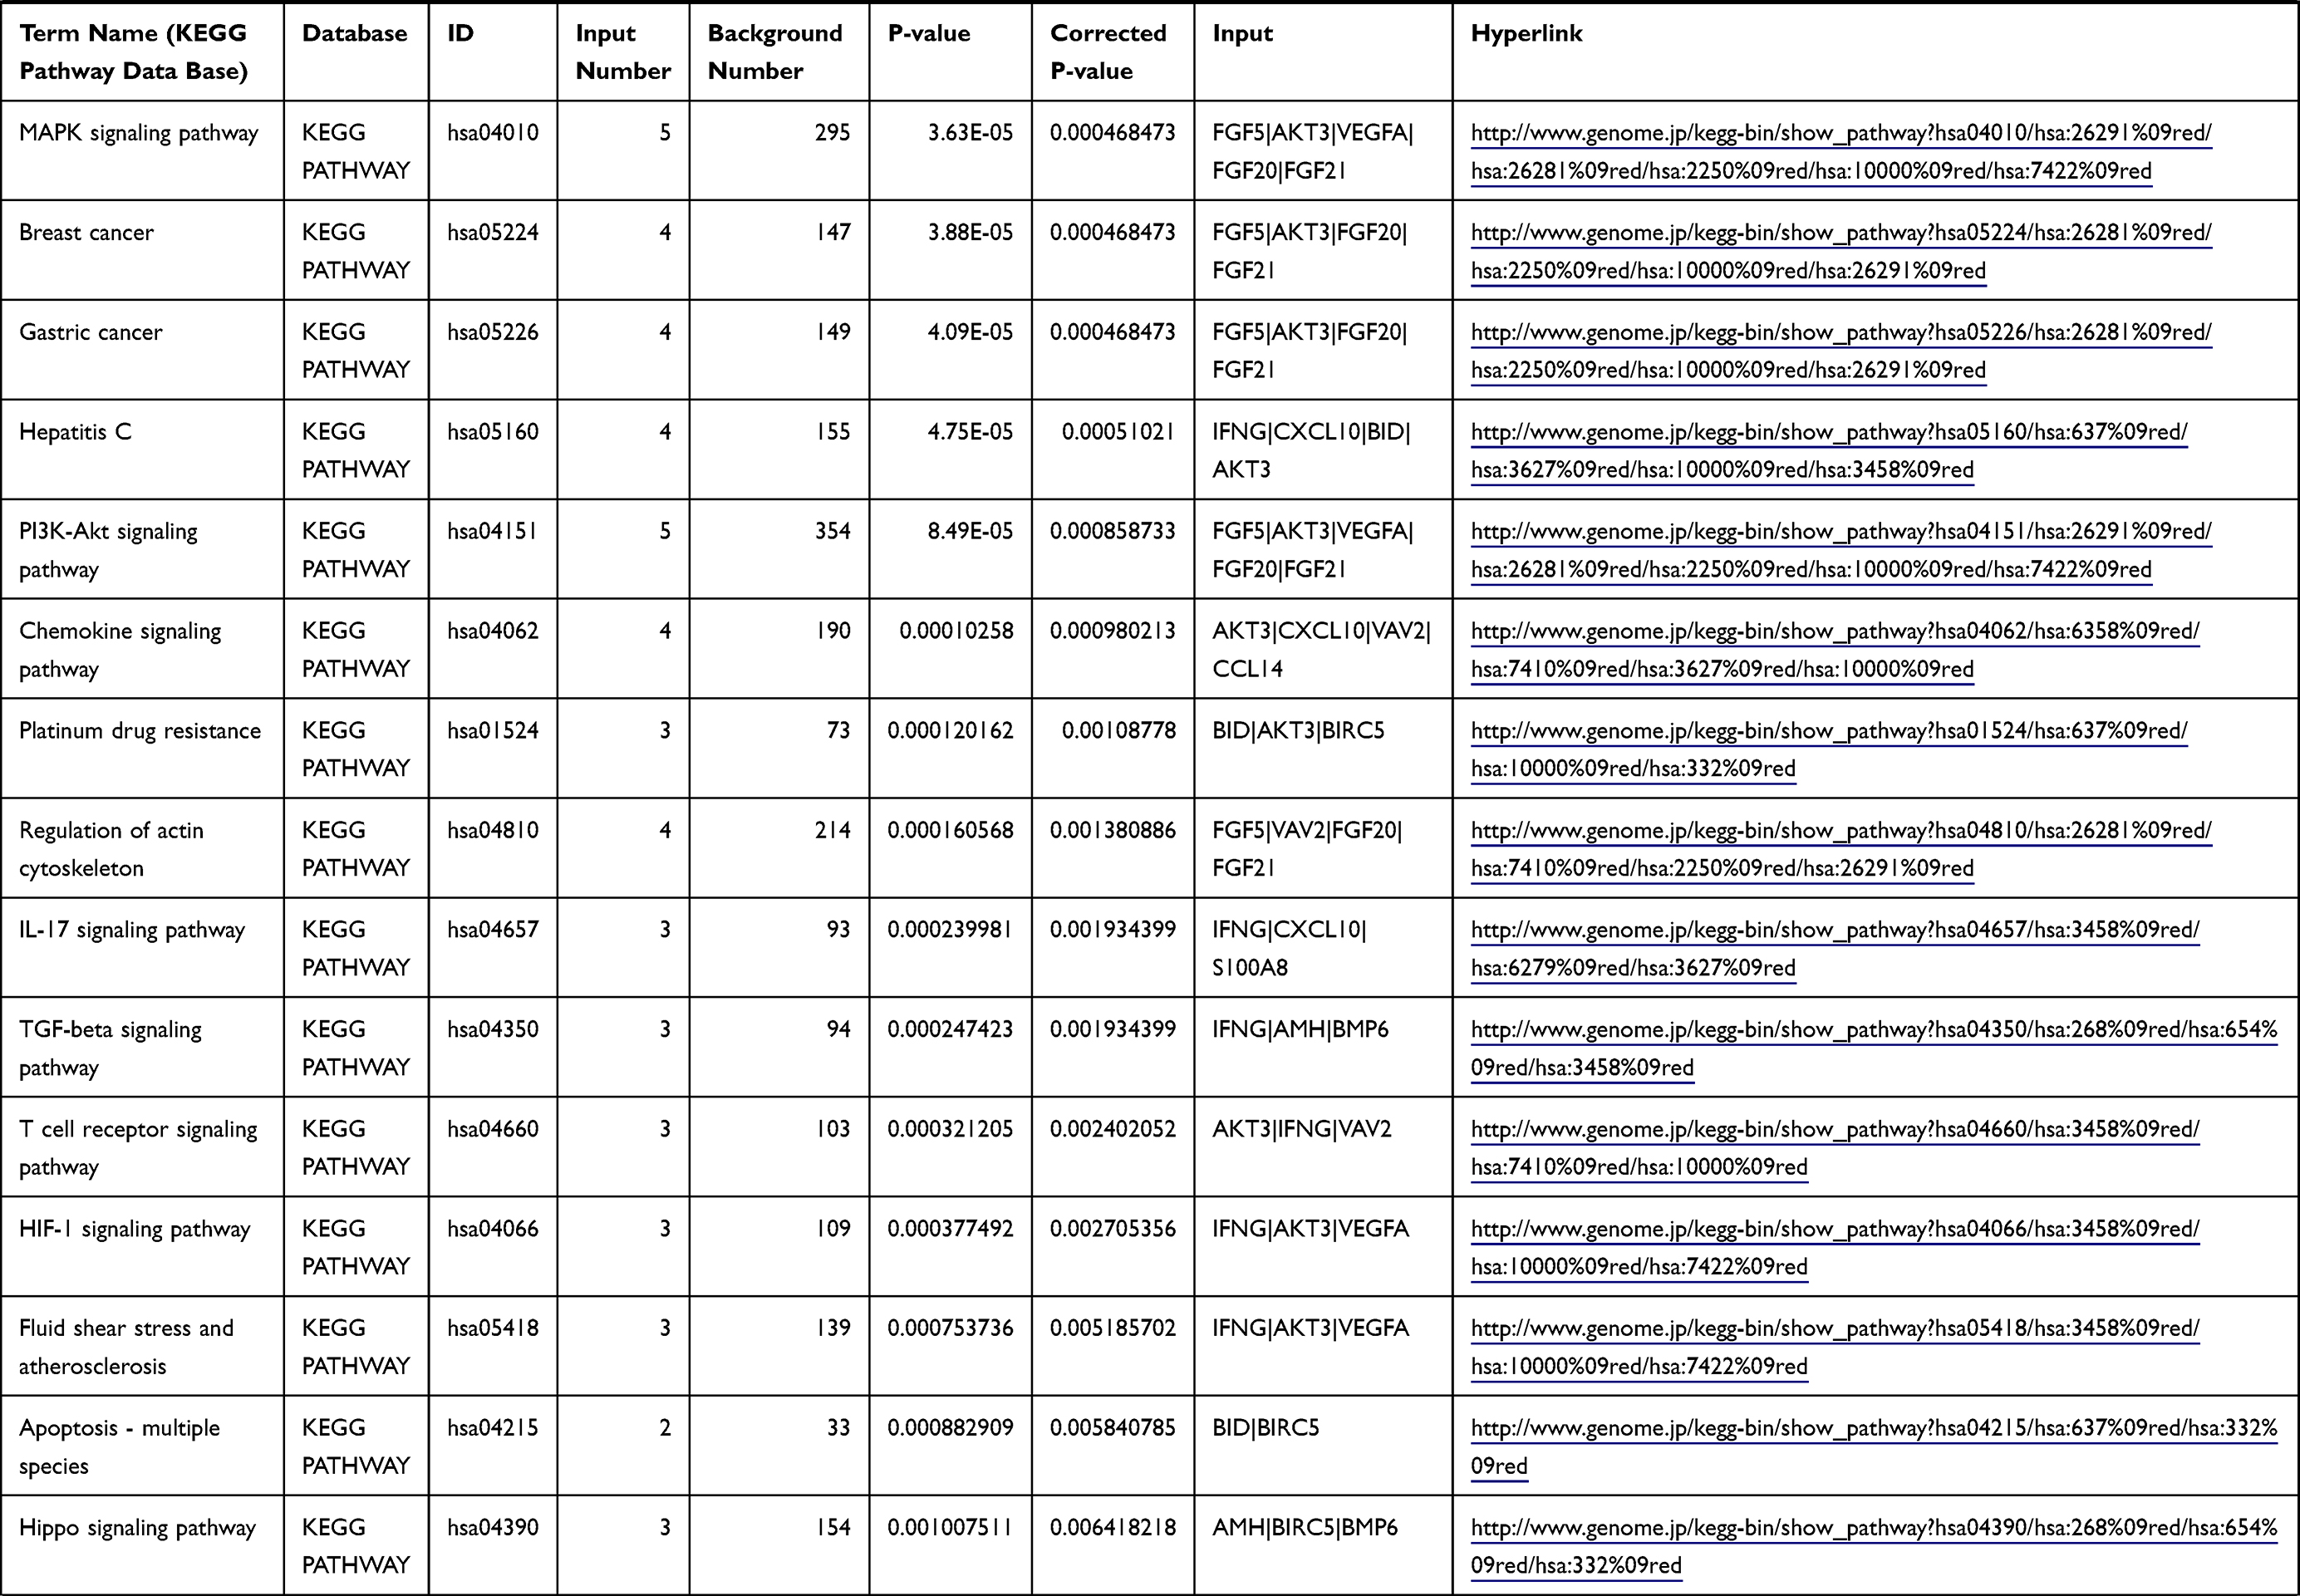 | 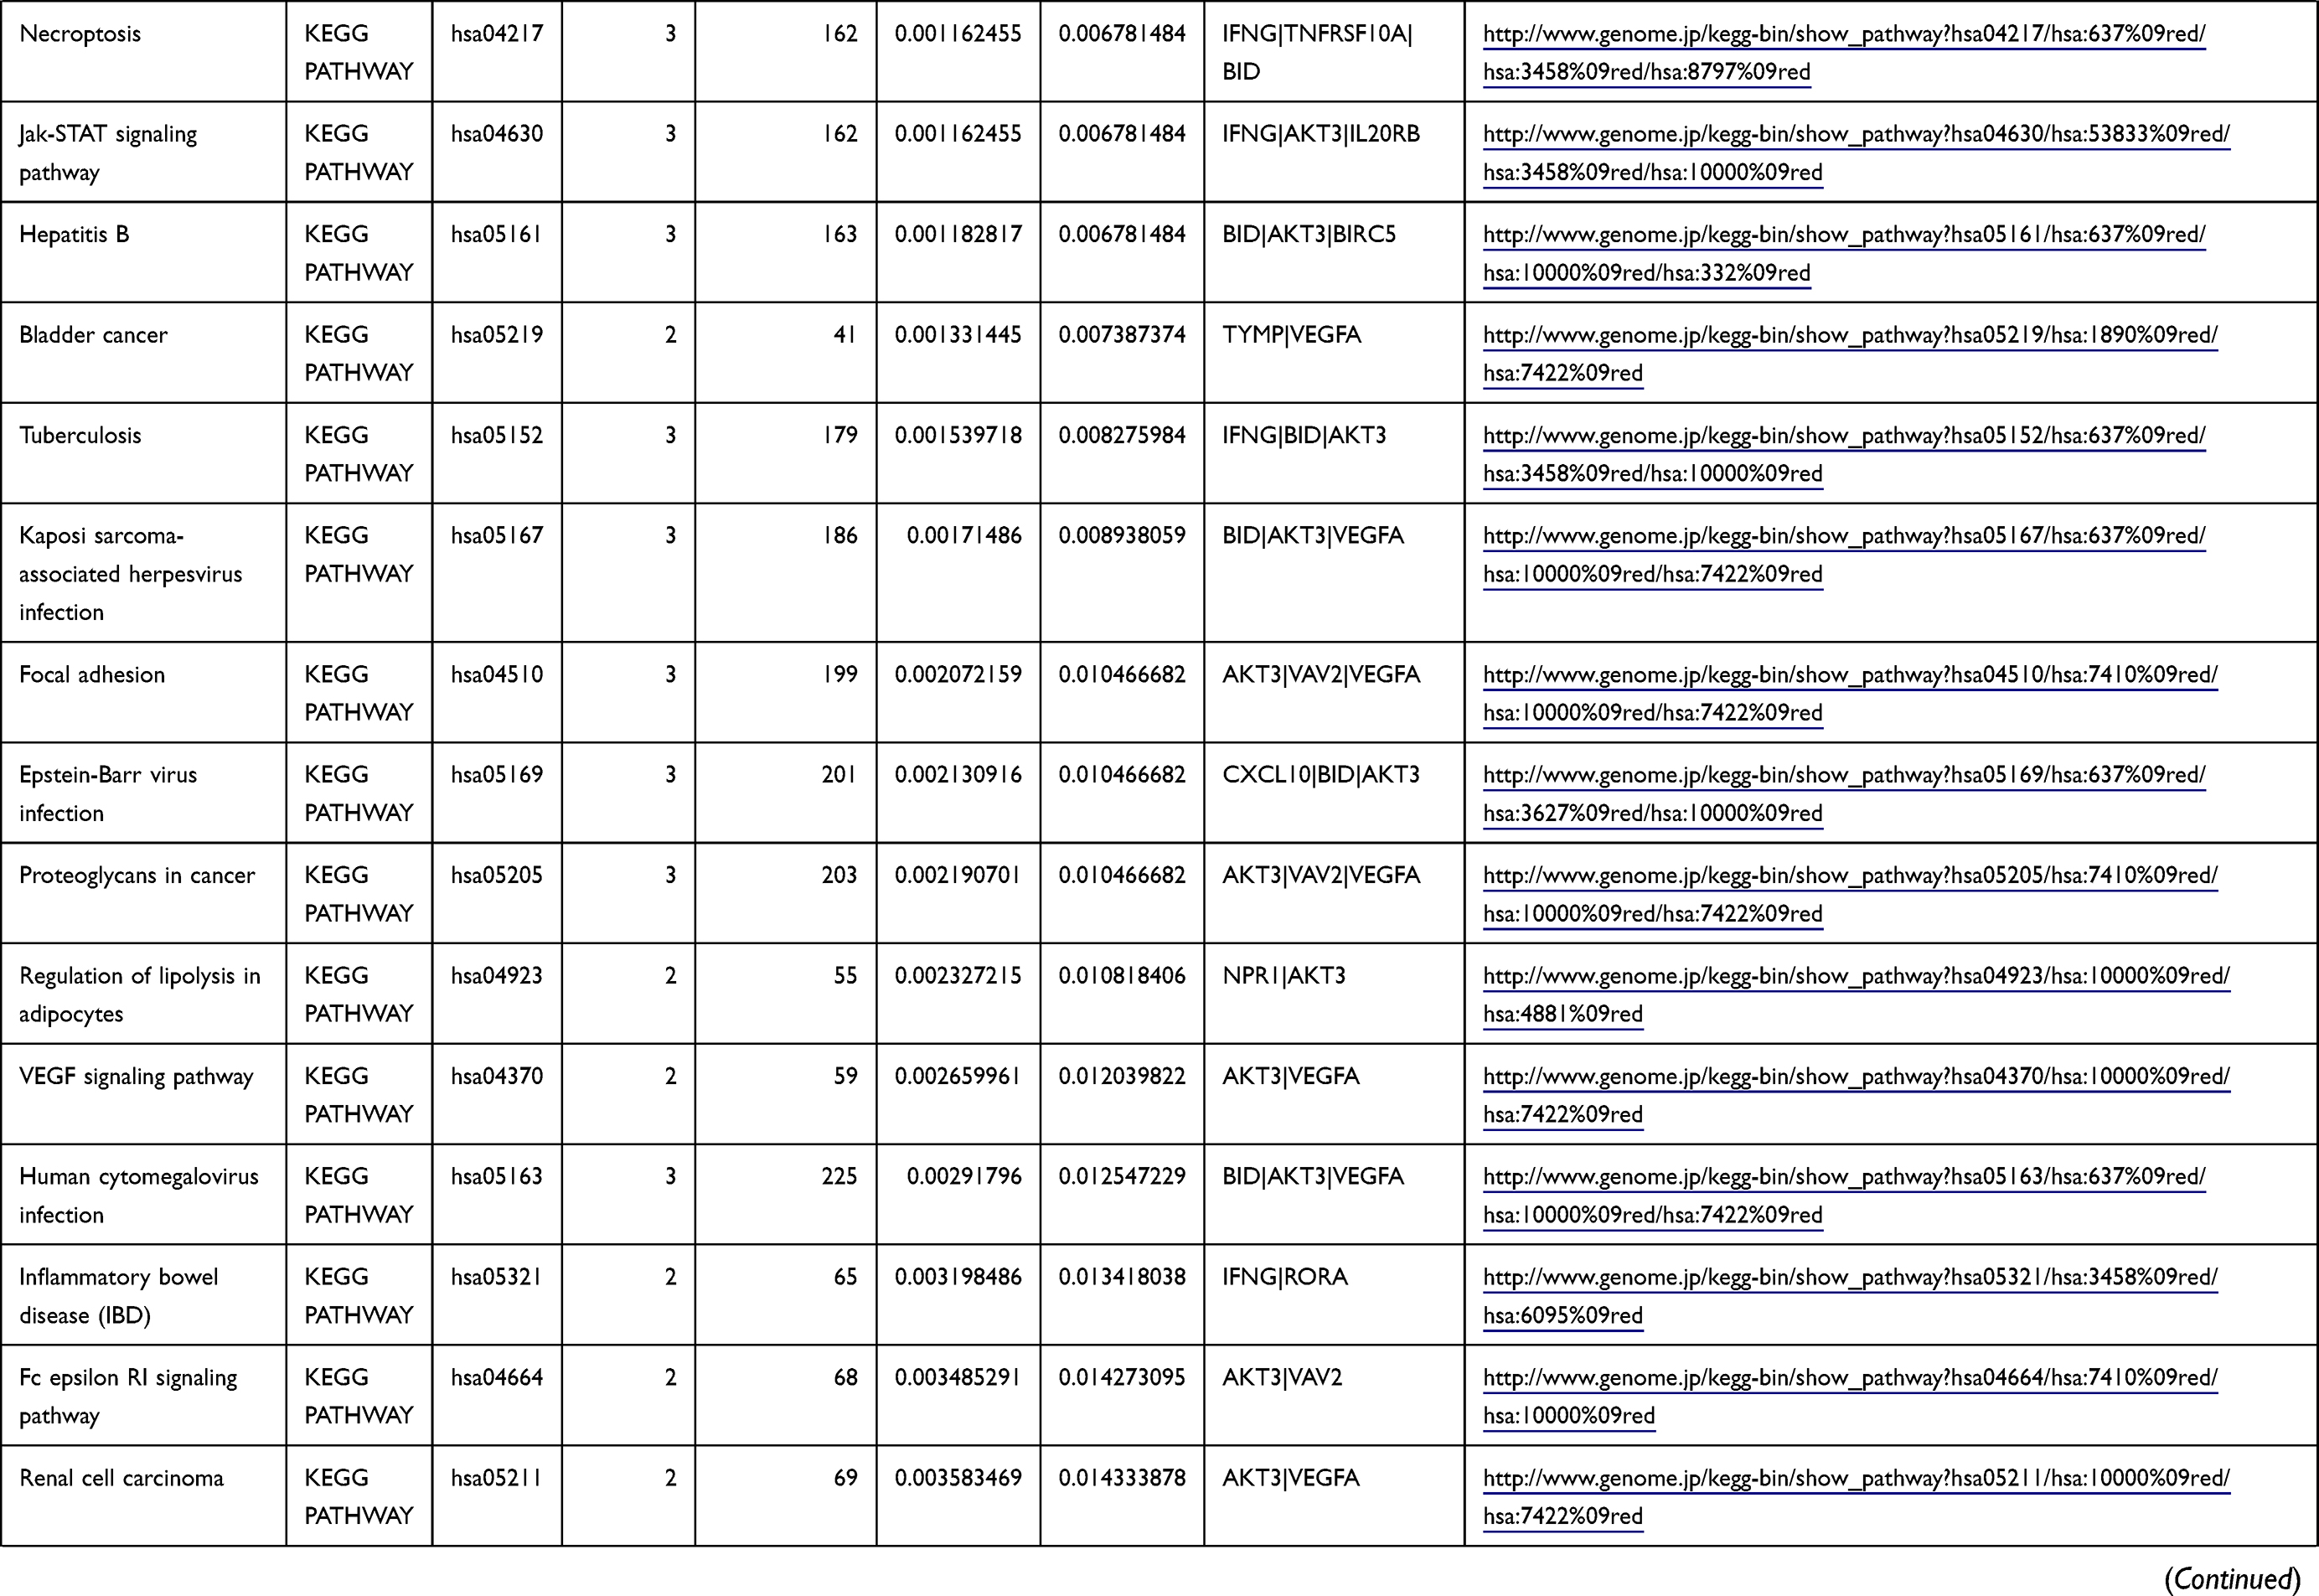 | 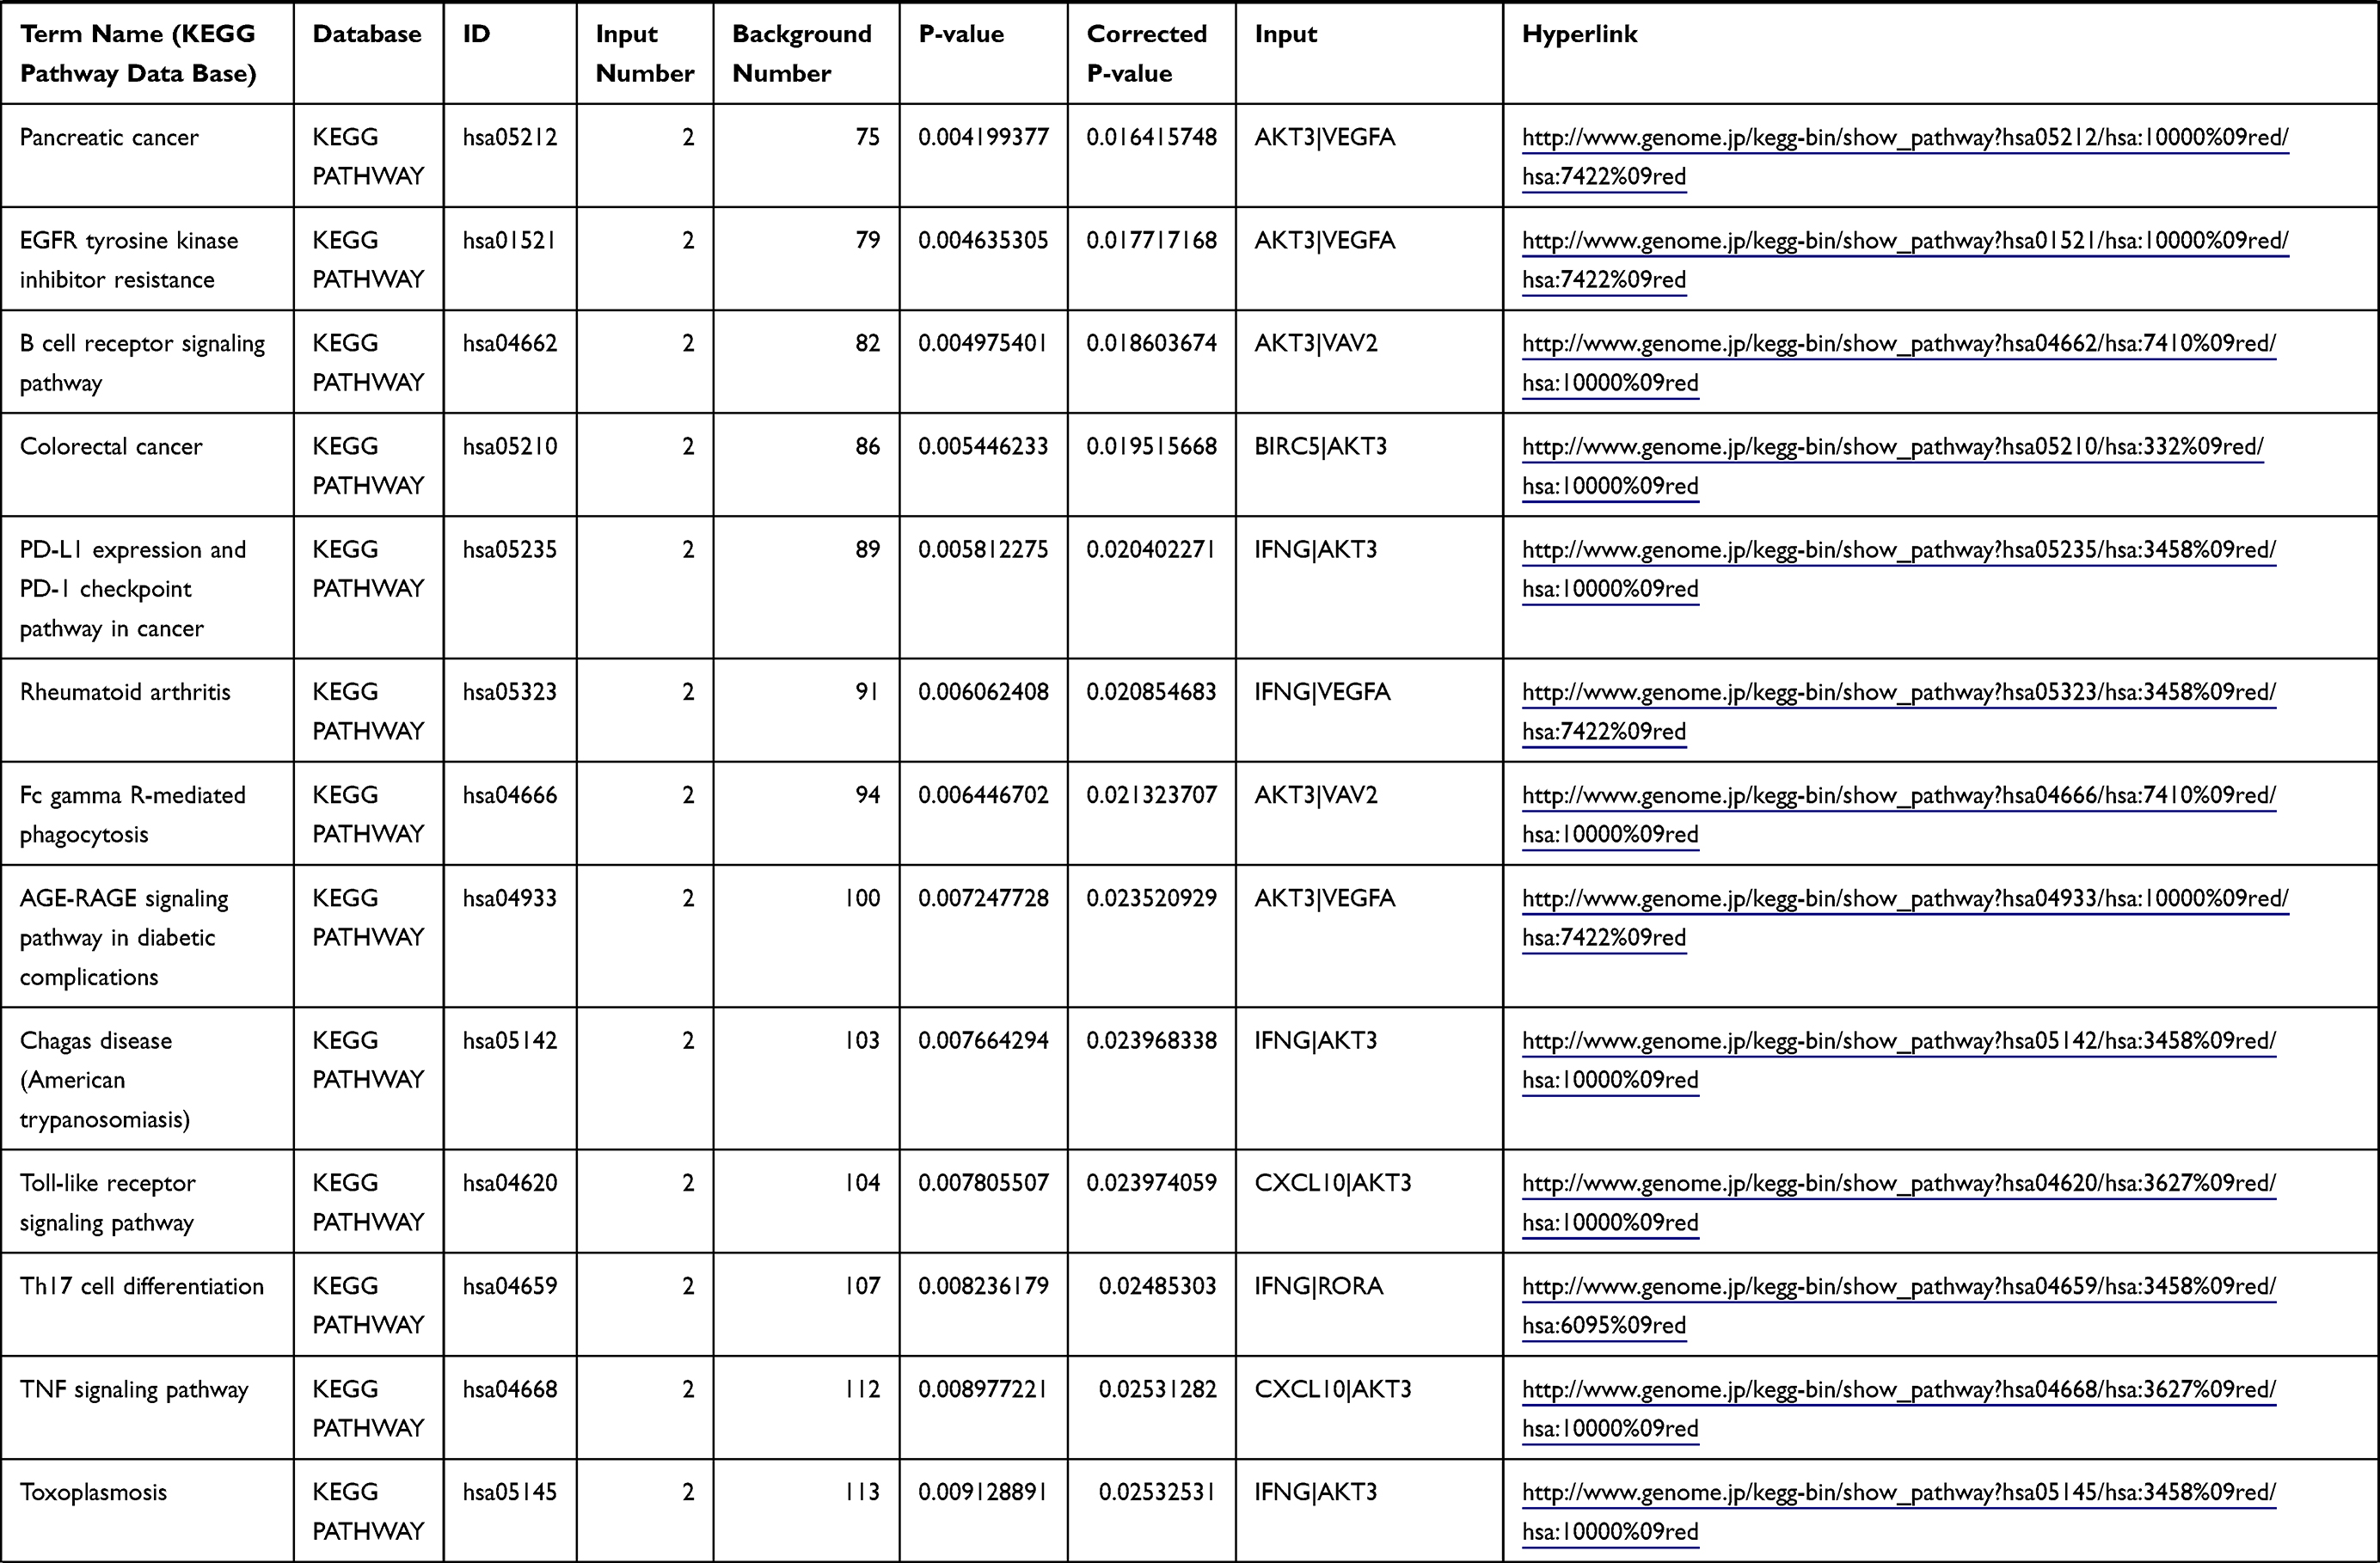 | 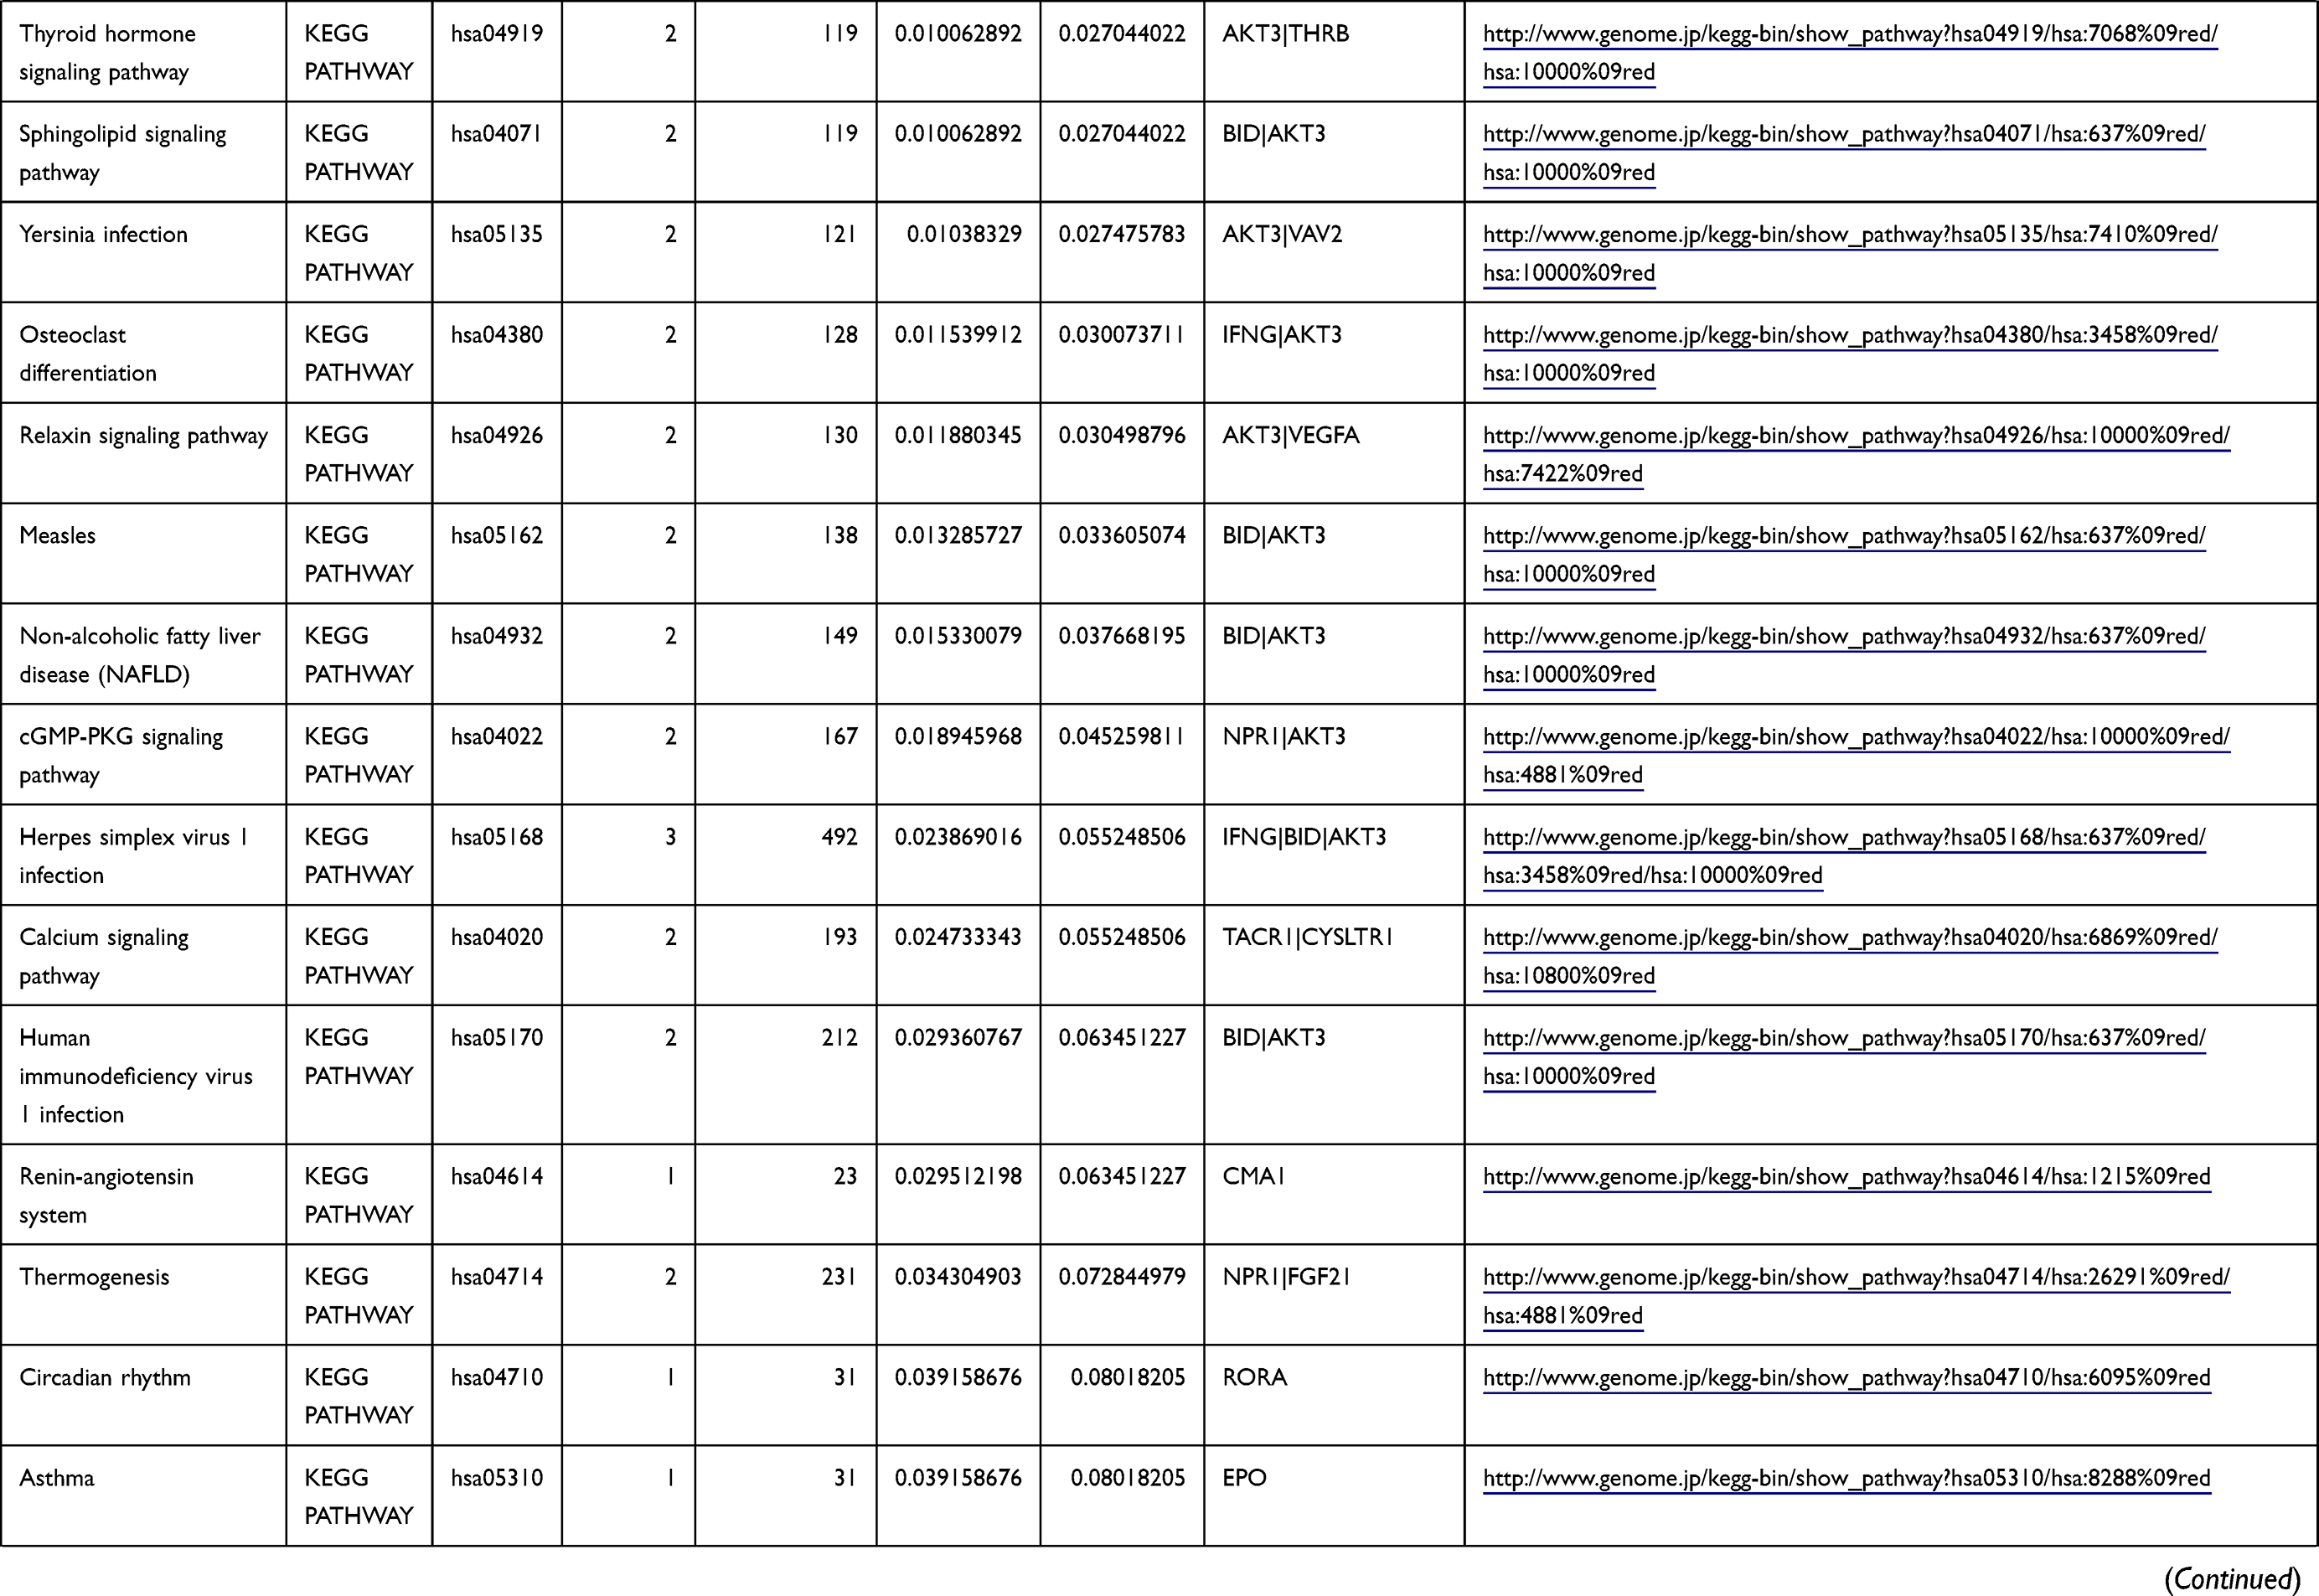 | 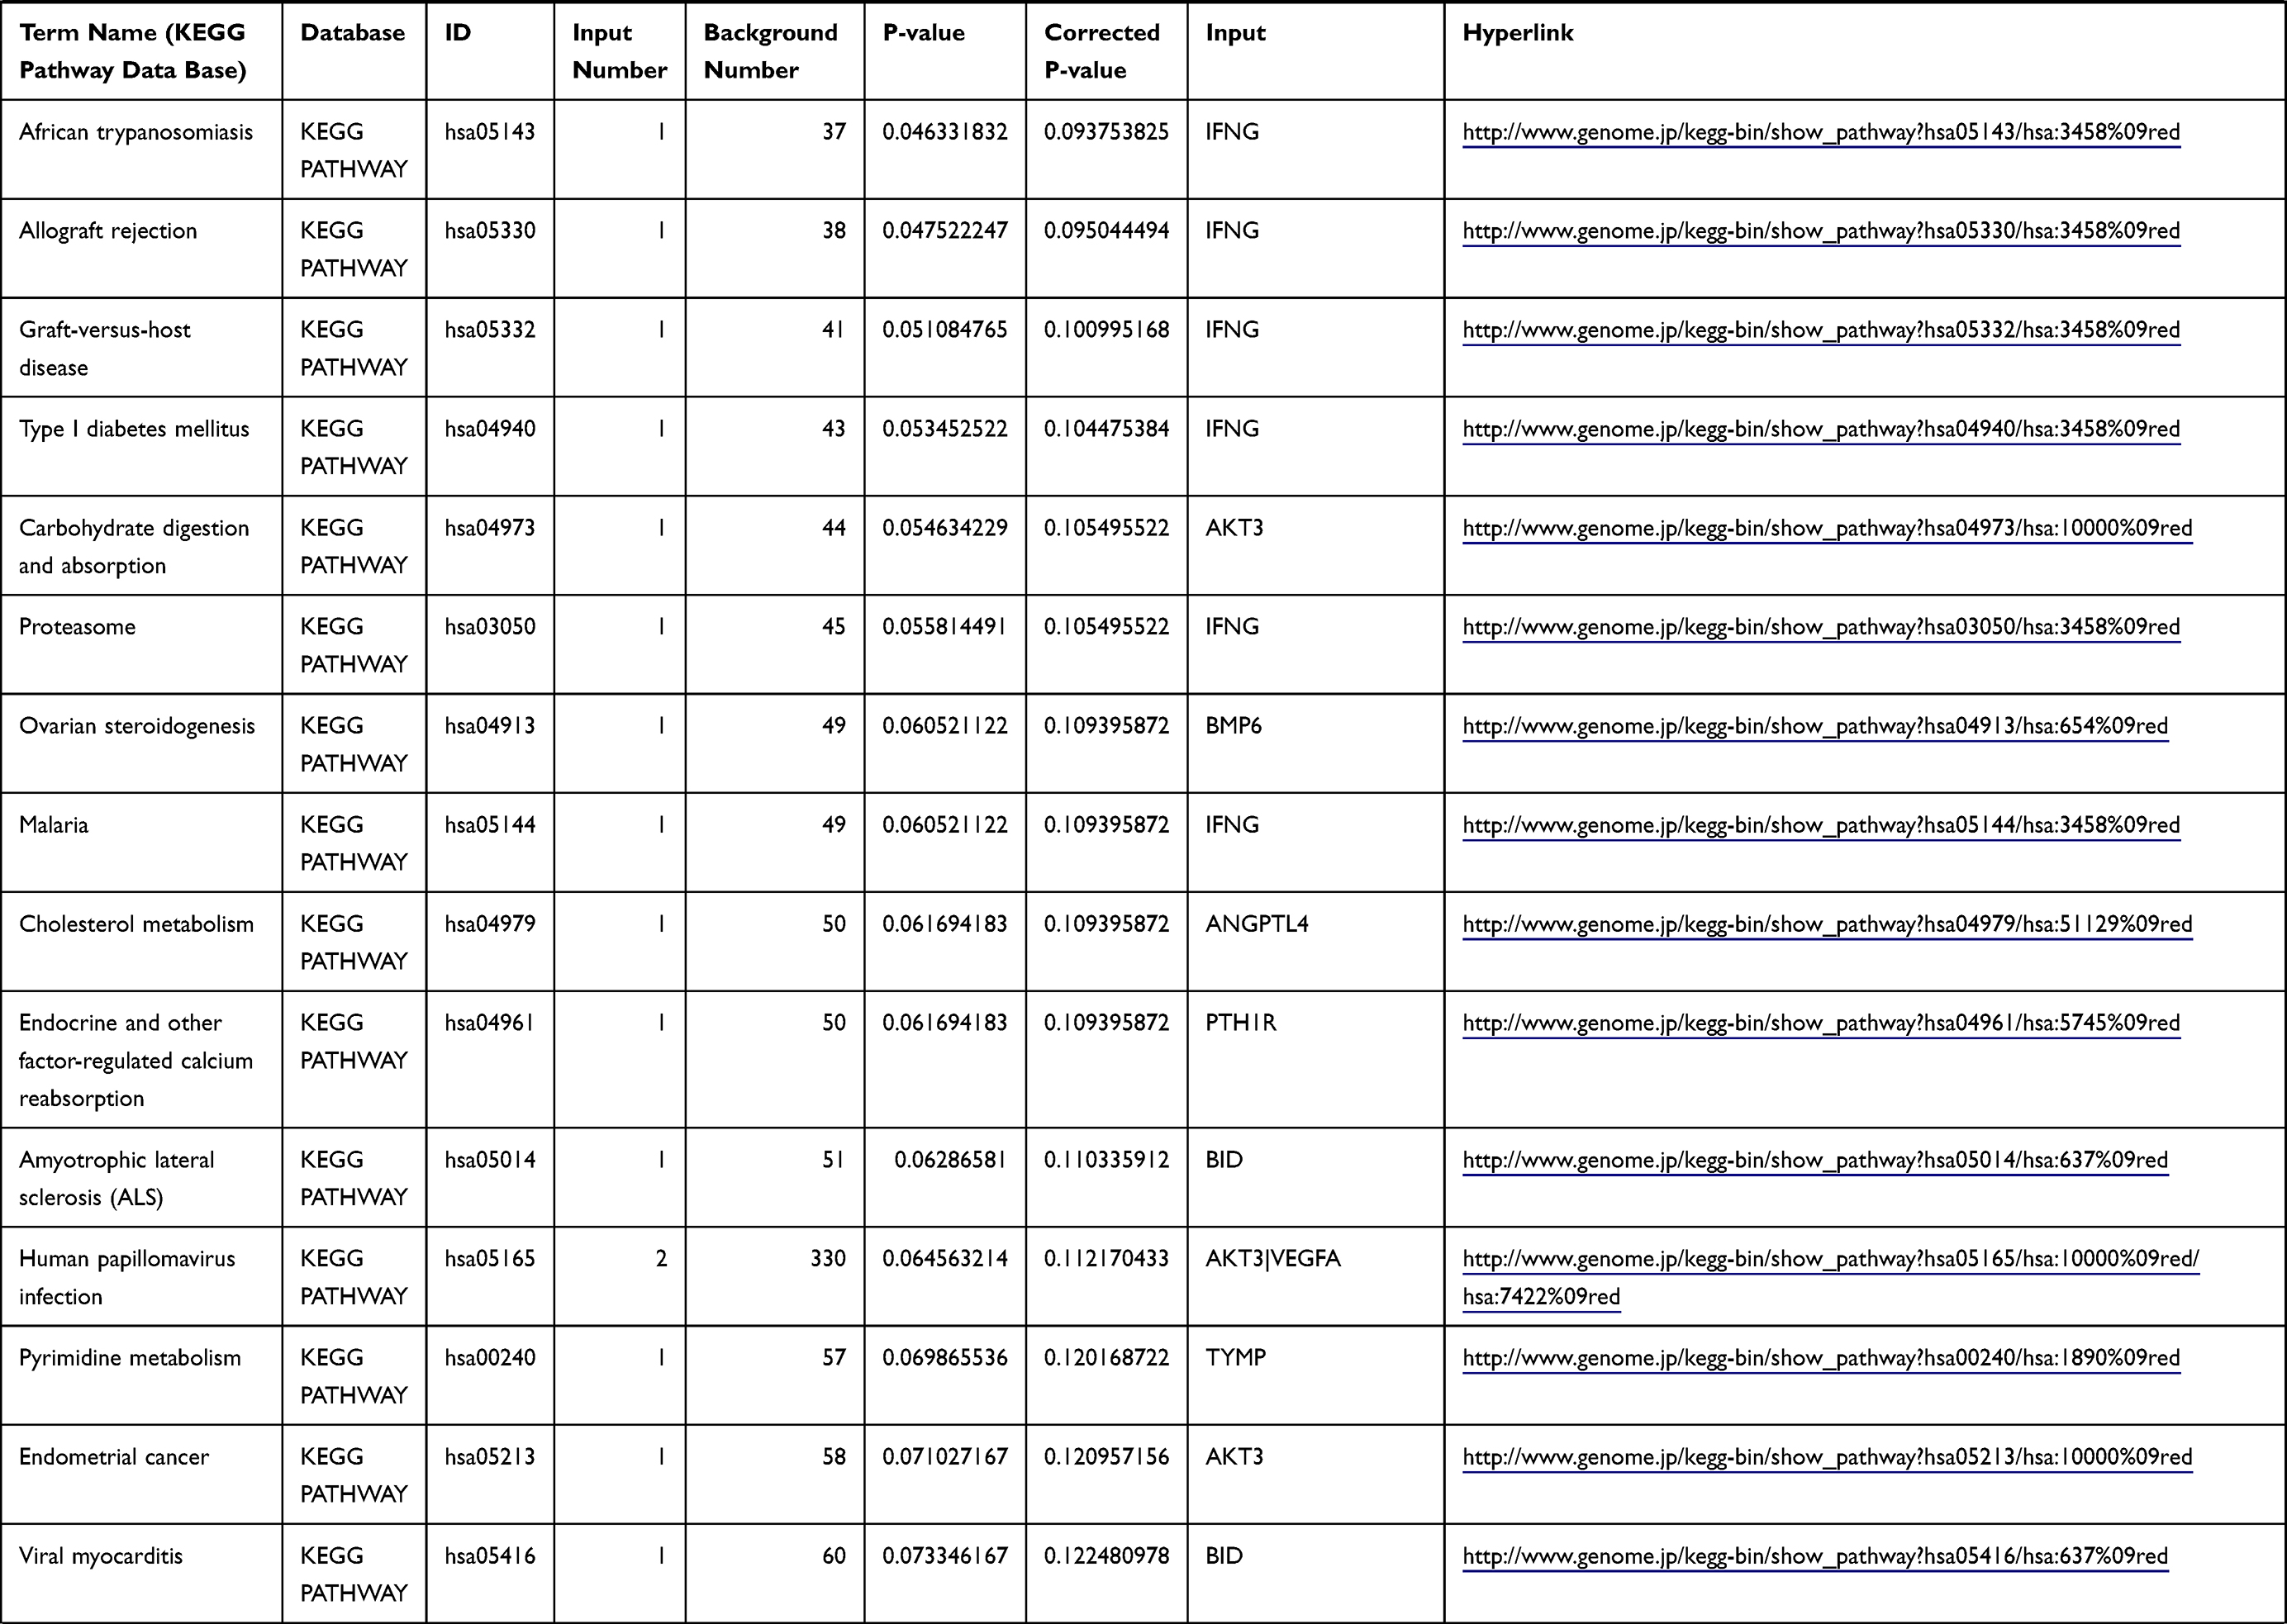 | 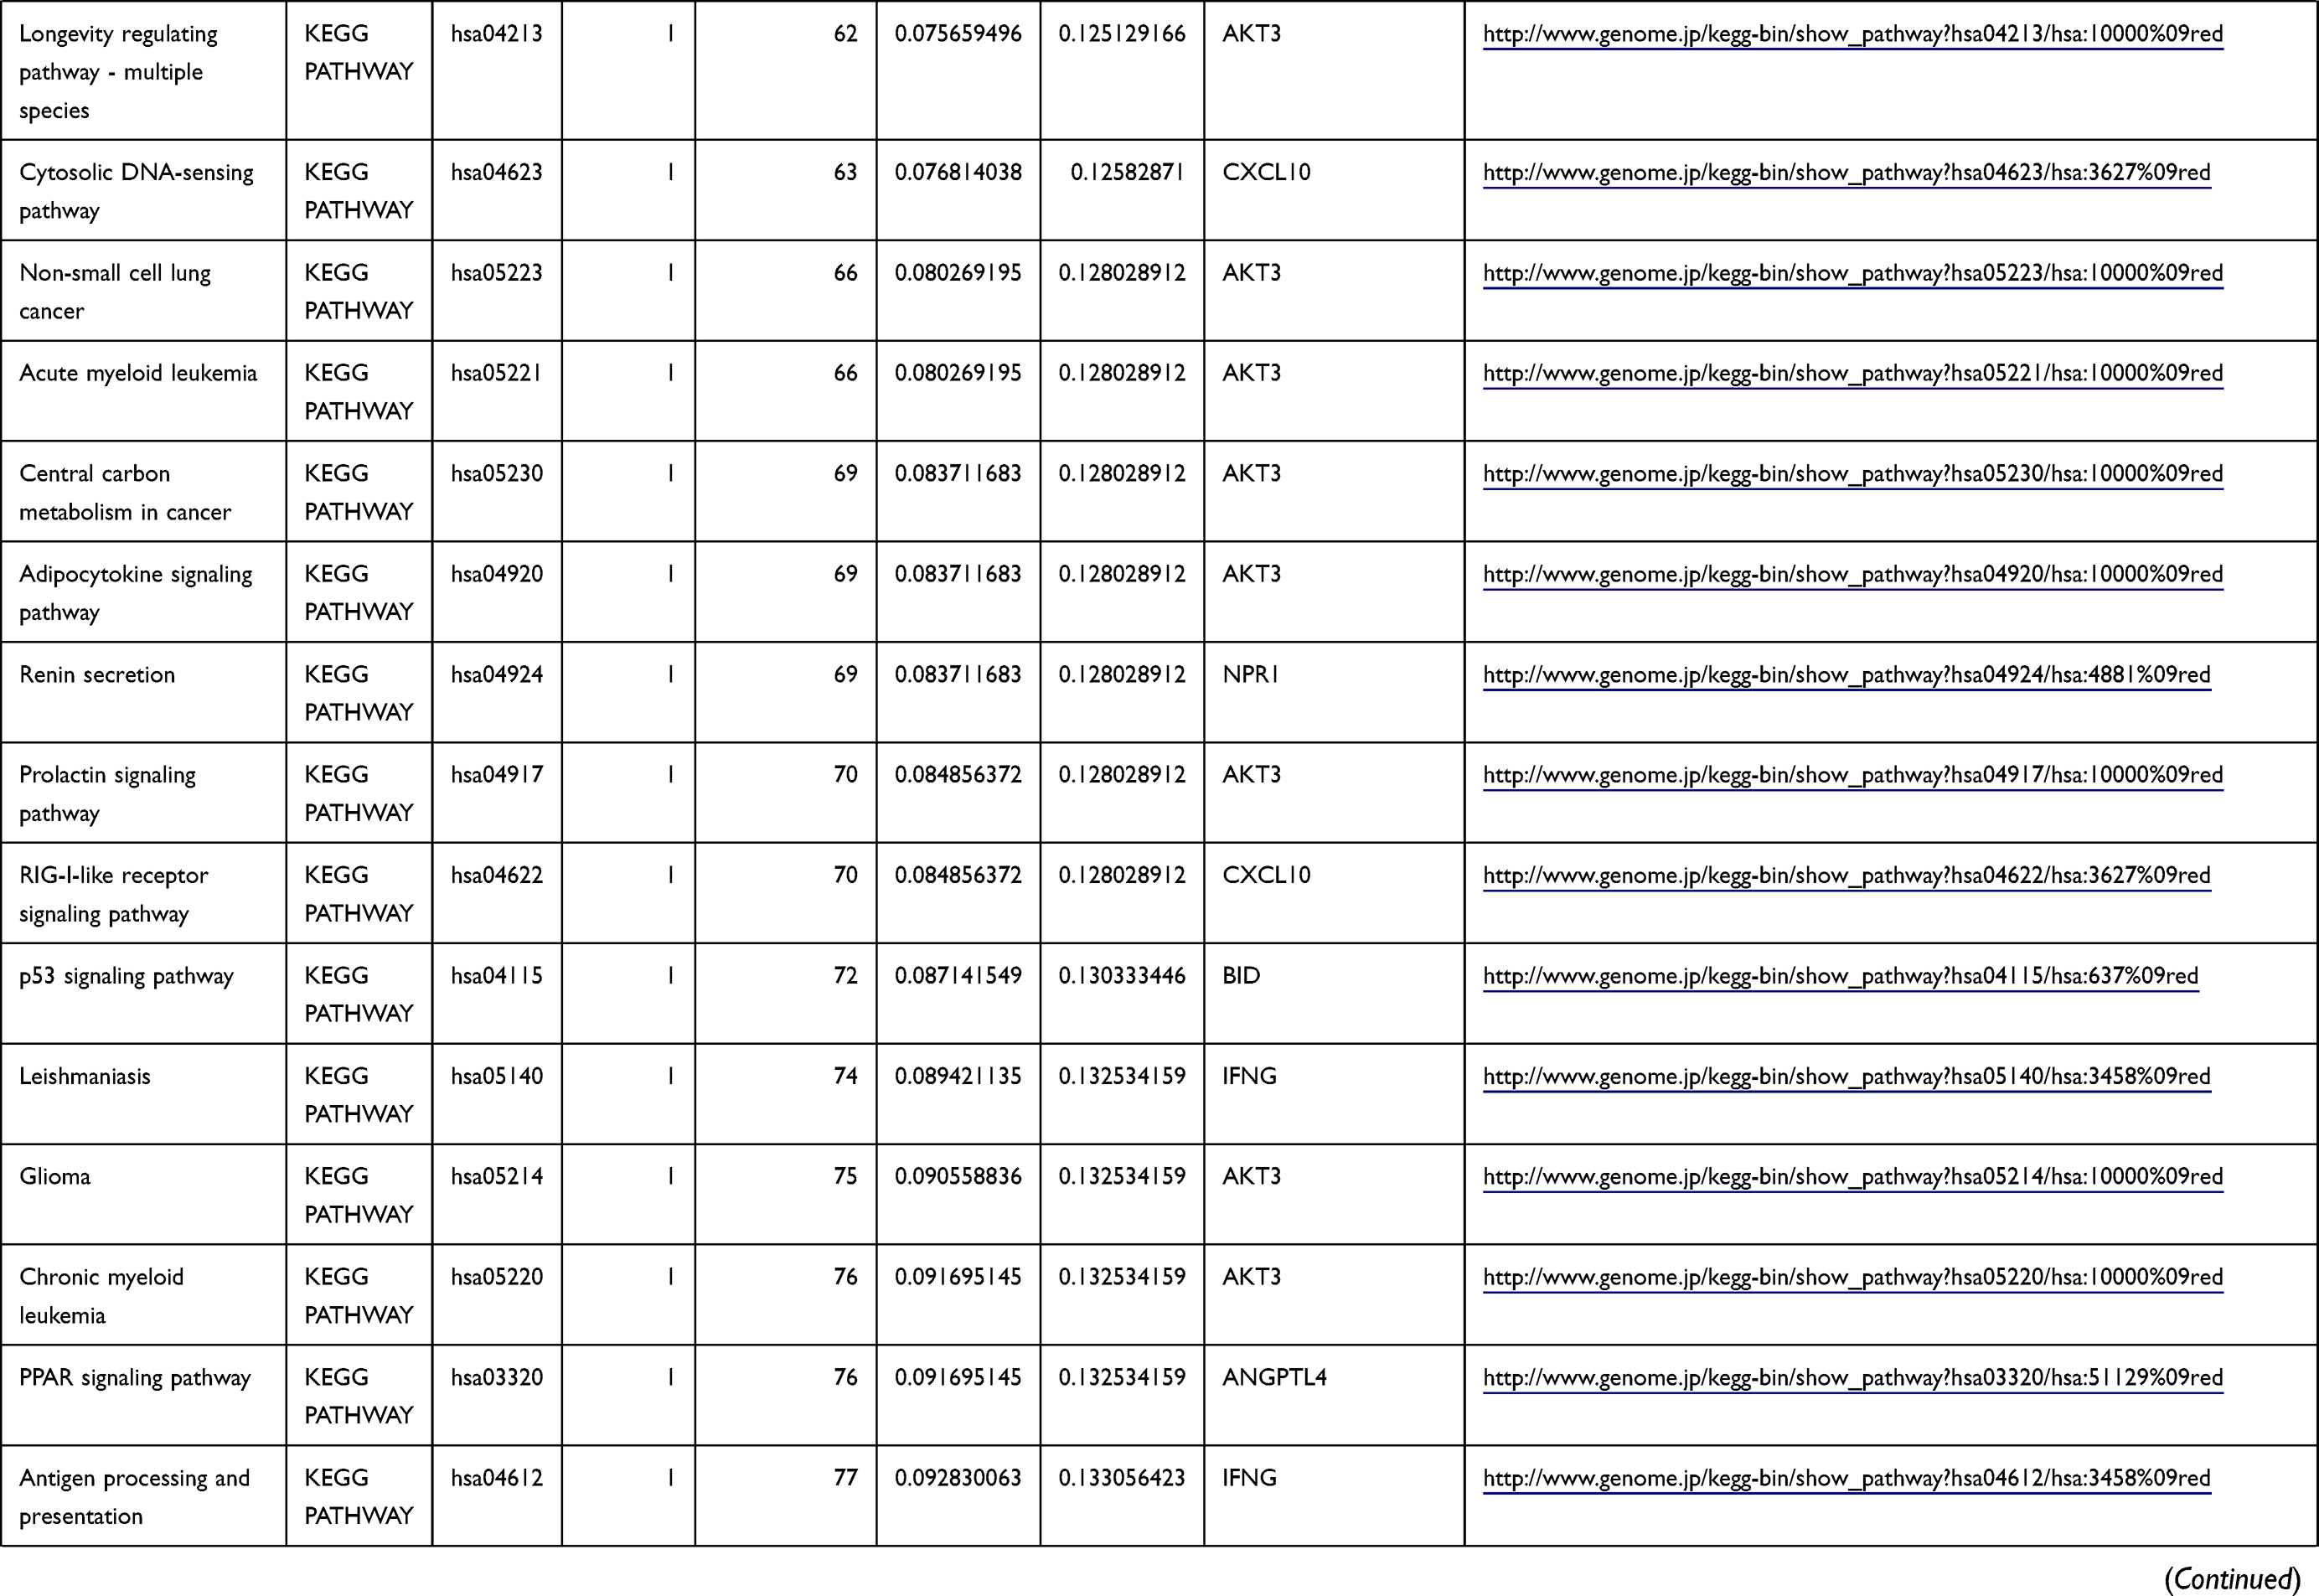 | 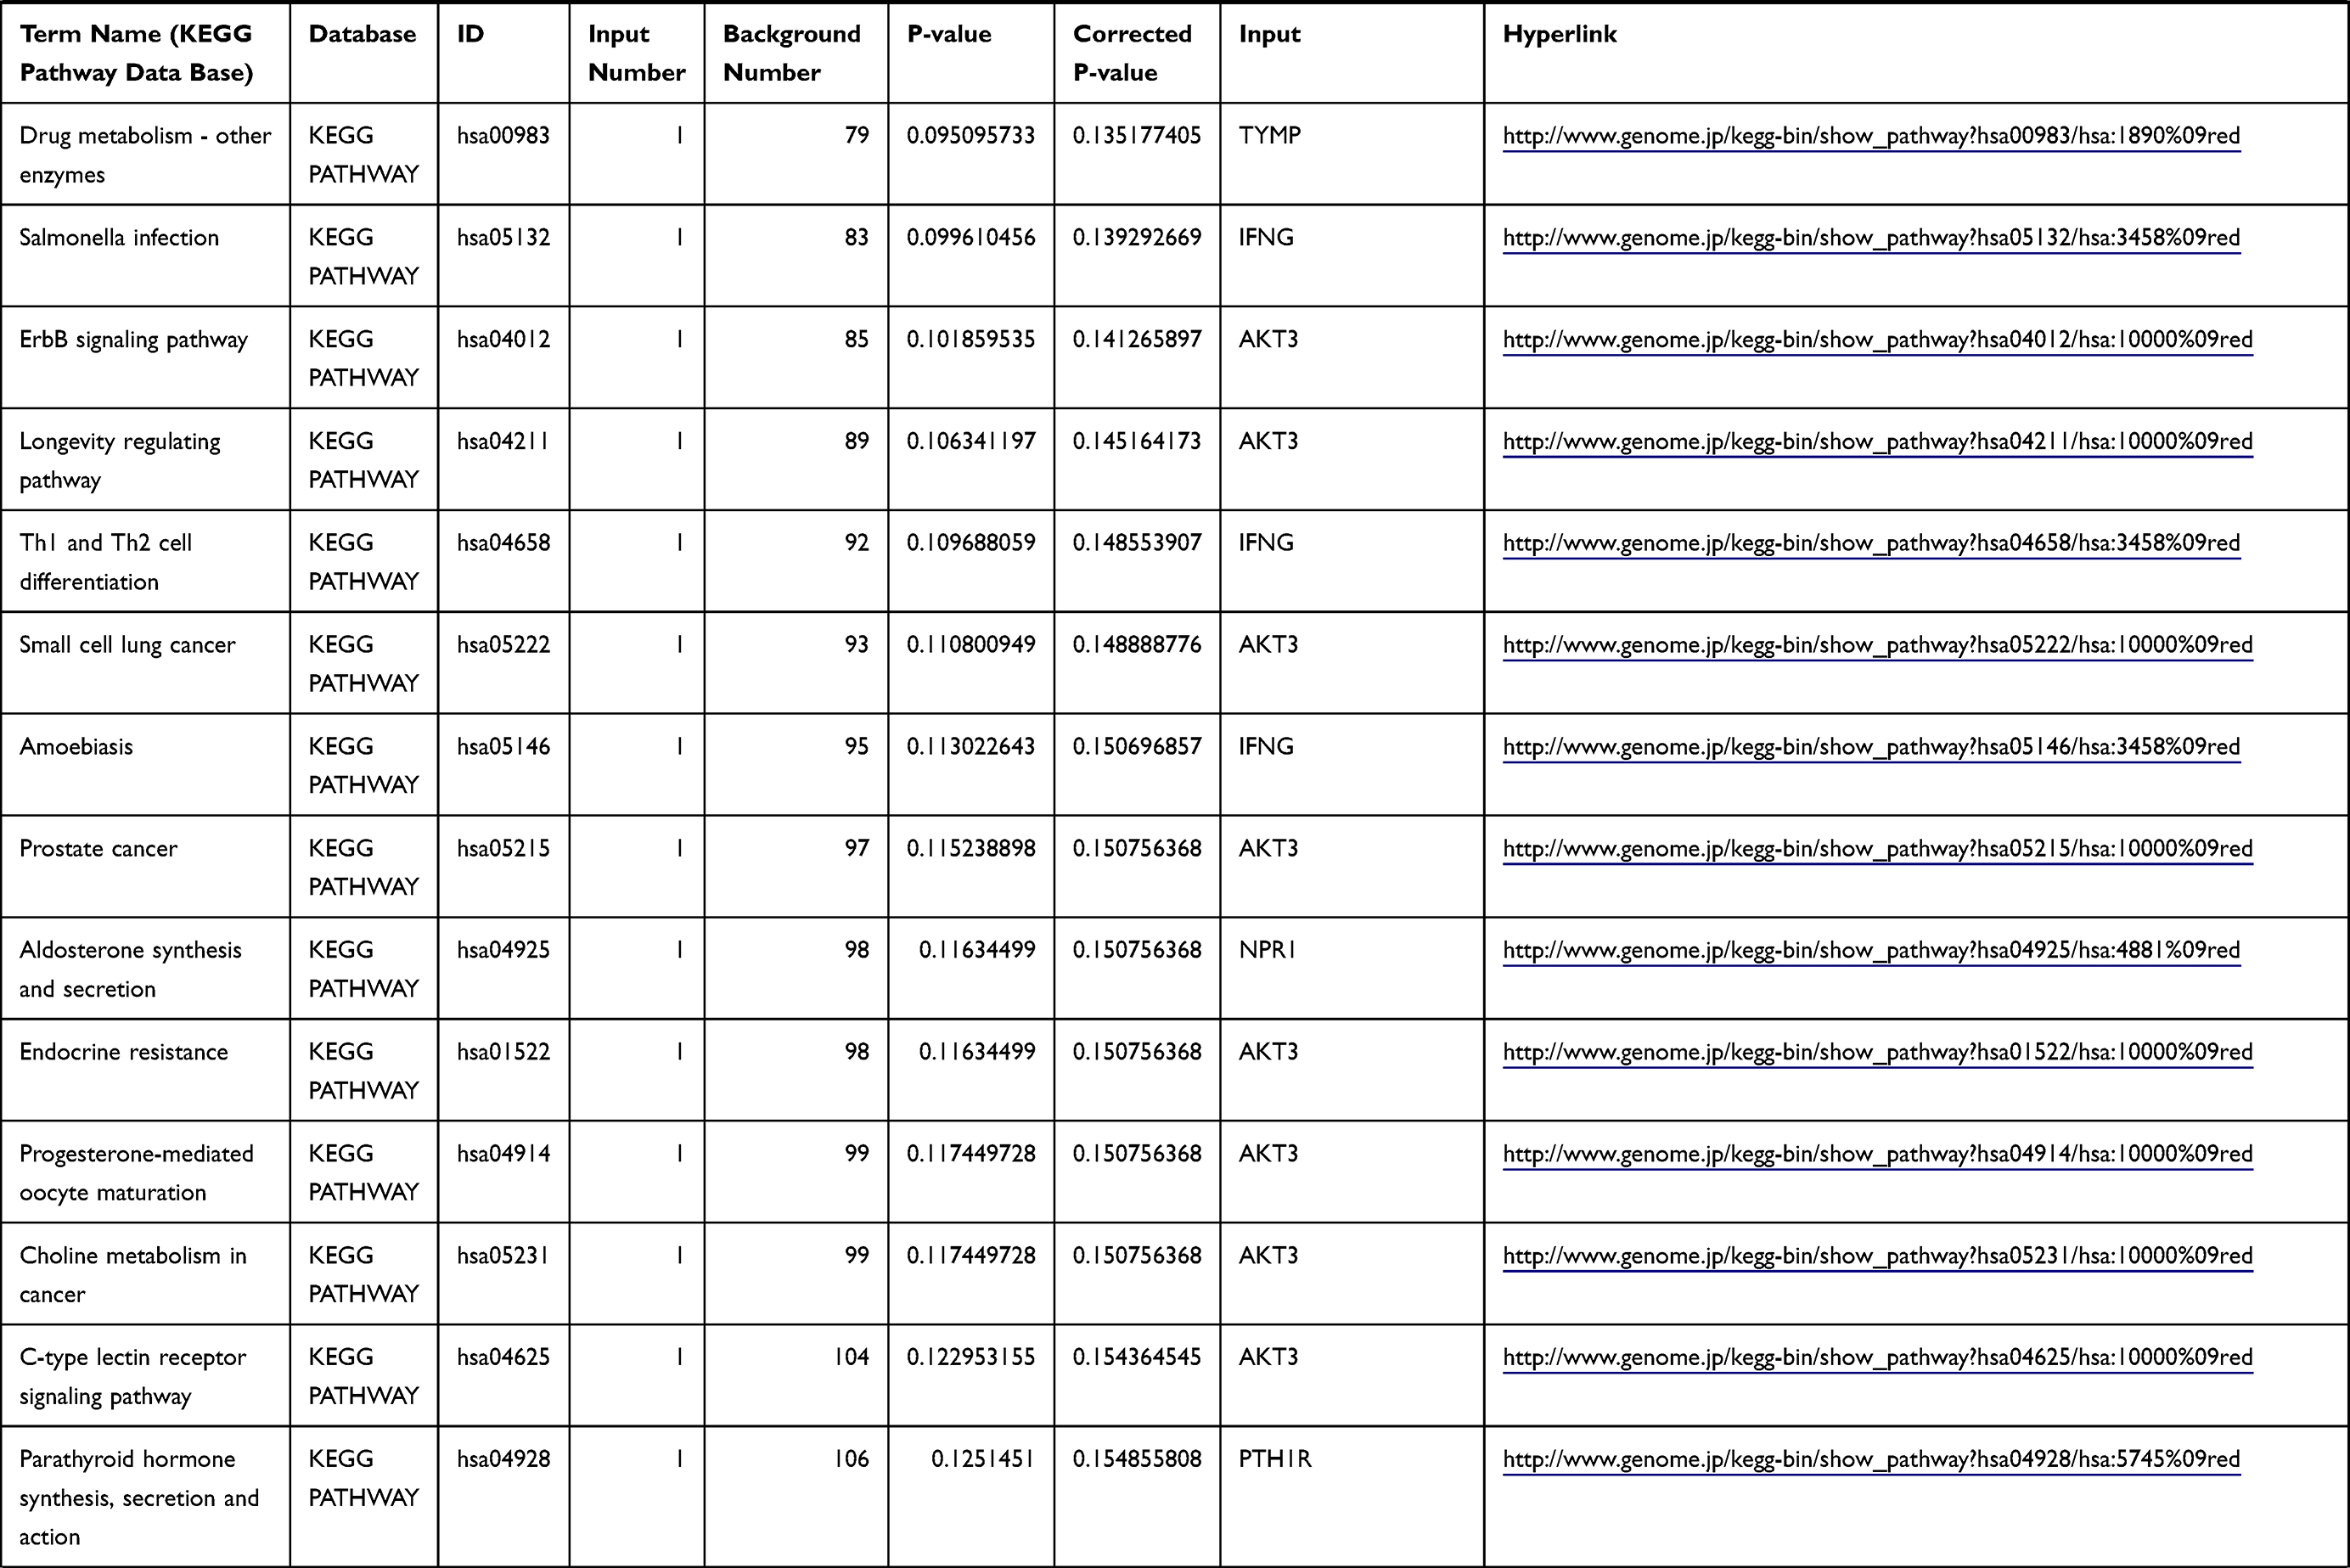 | 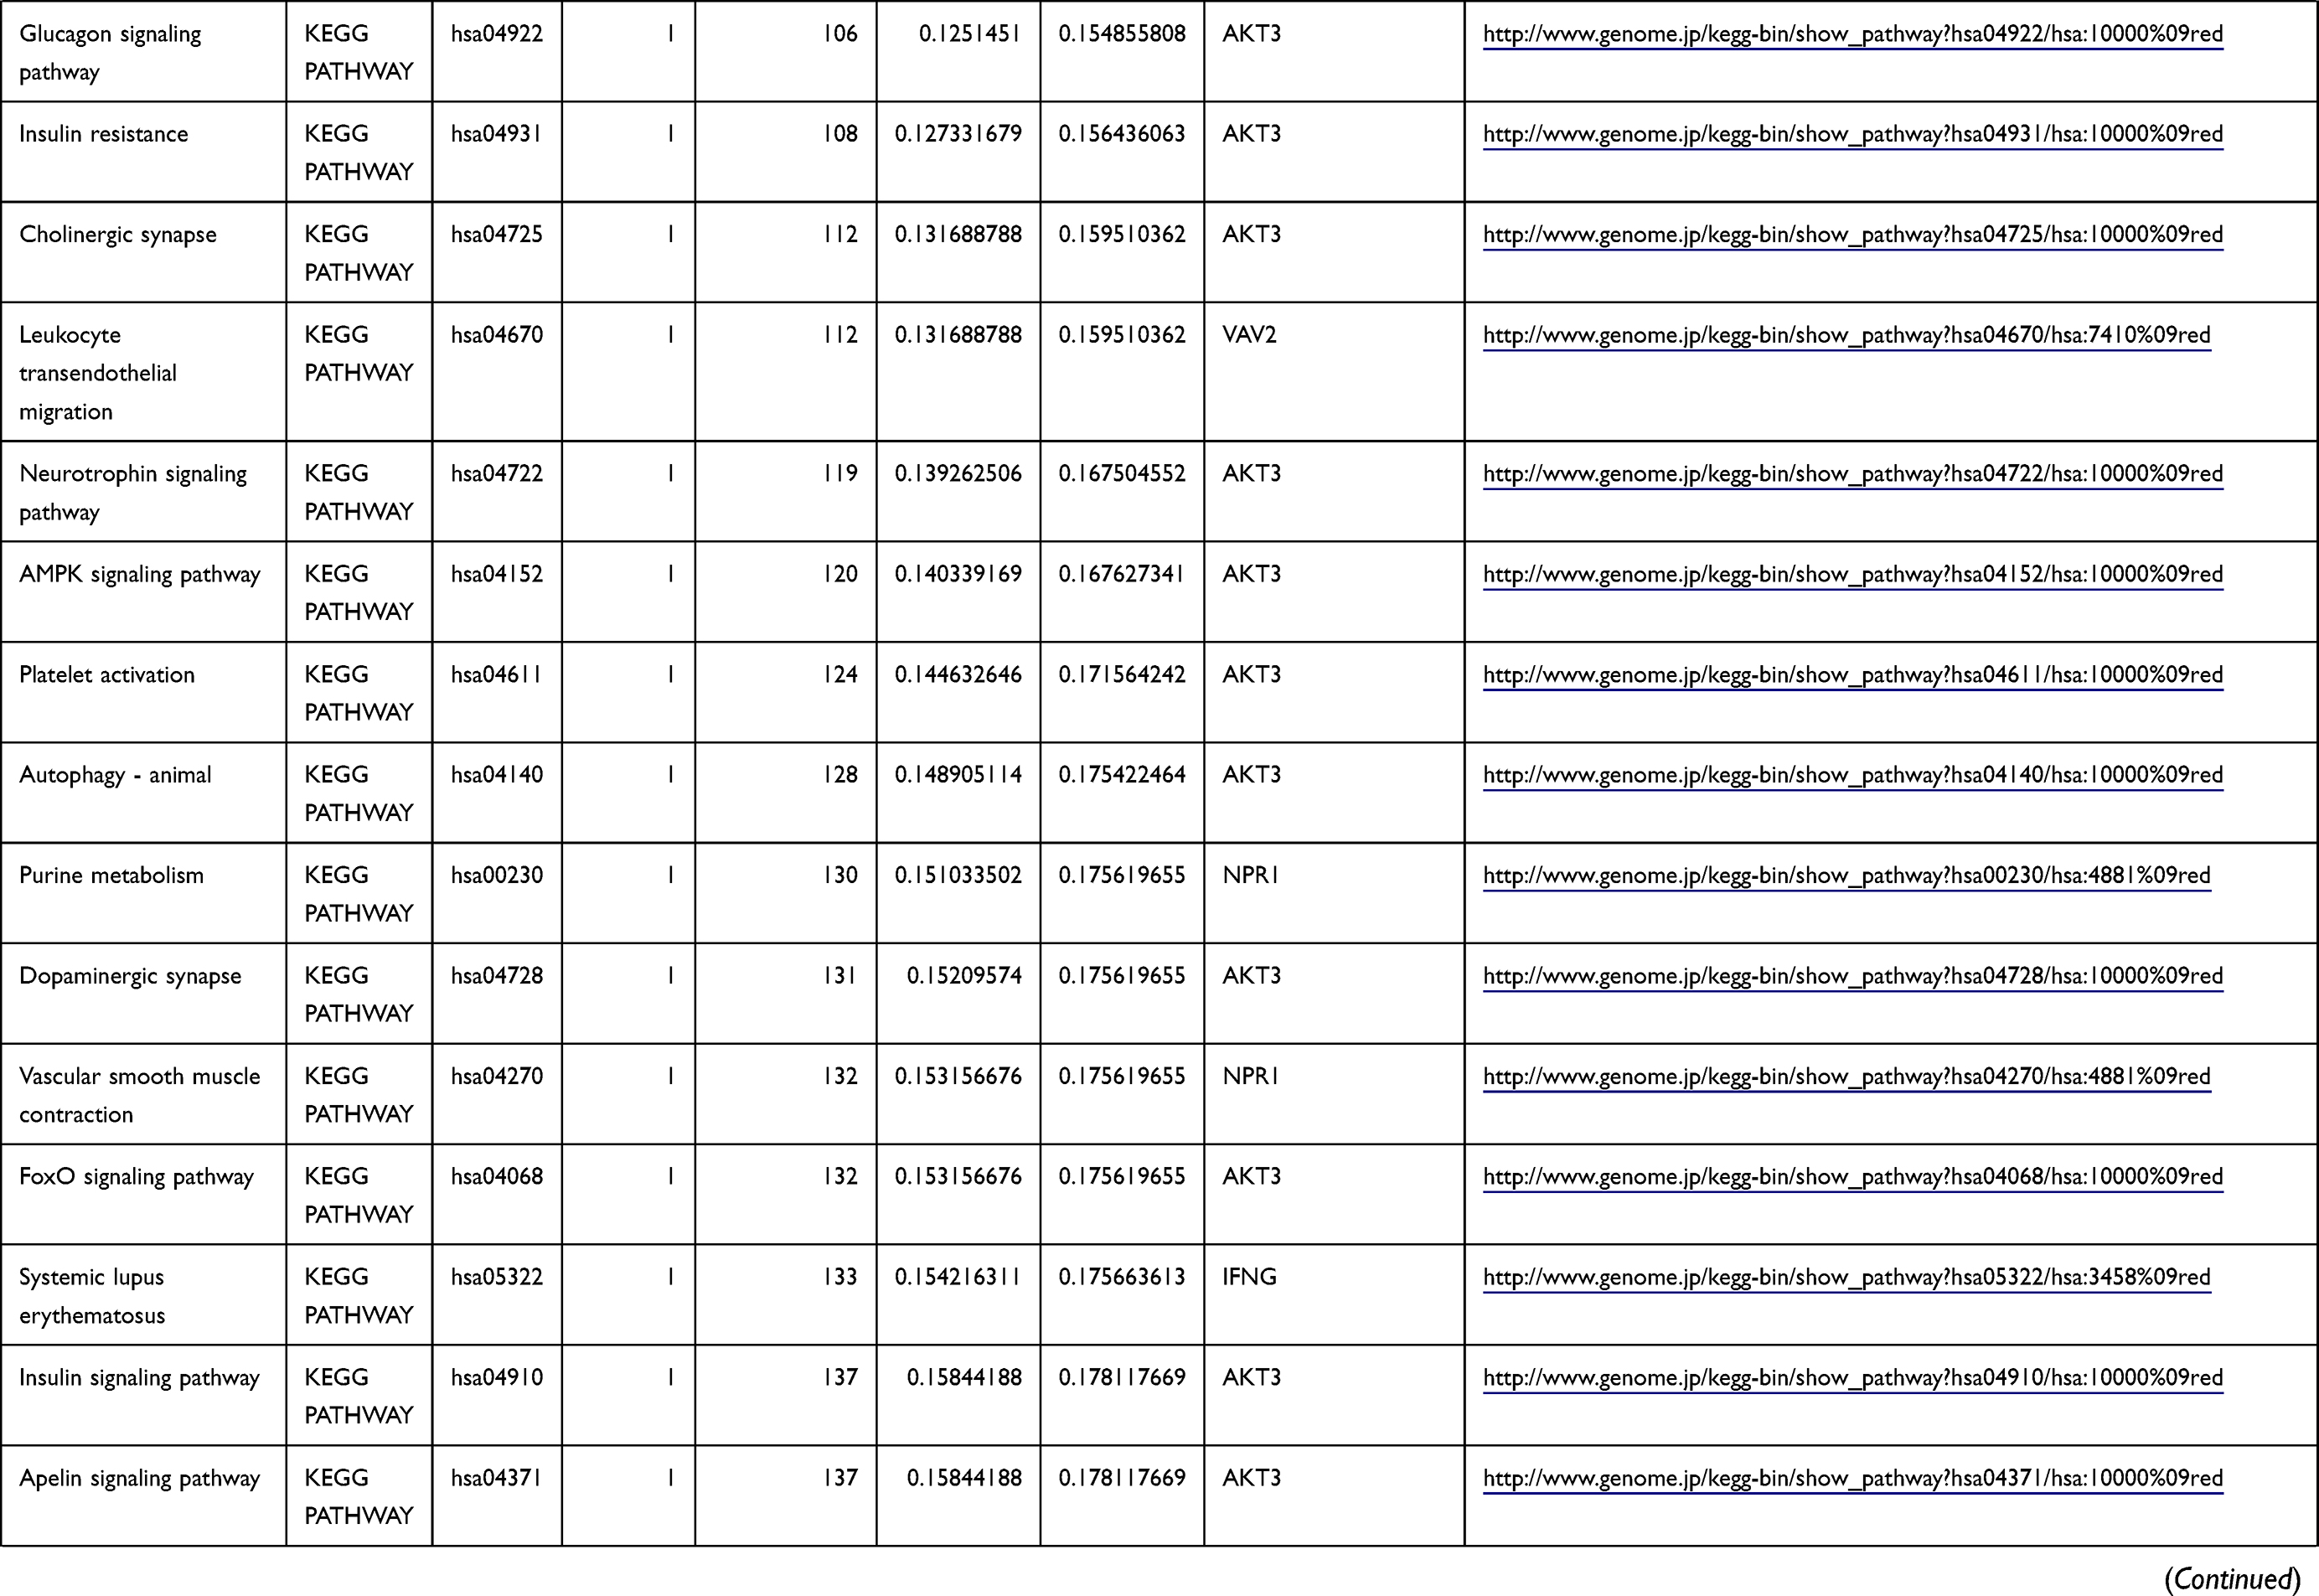 | 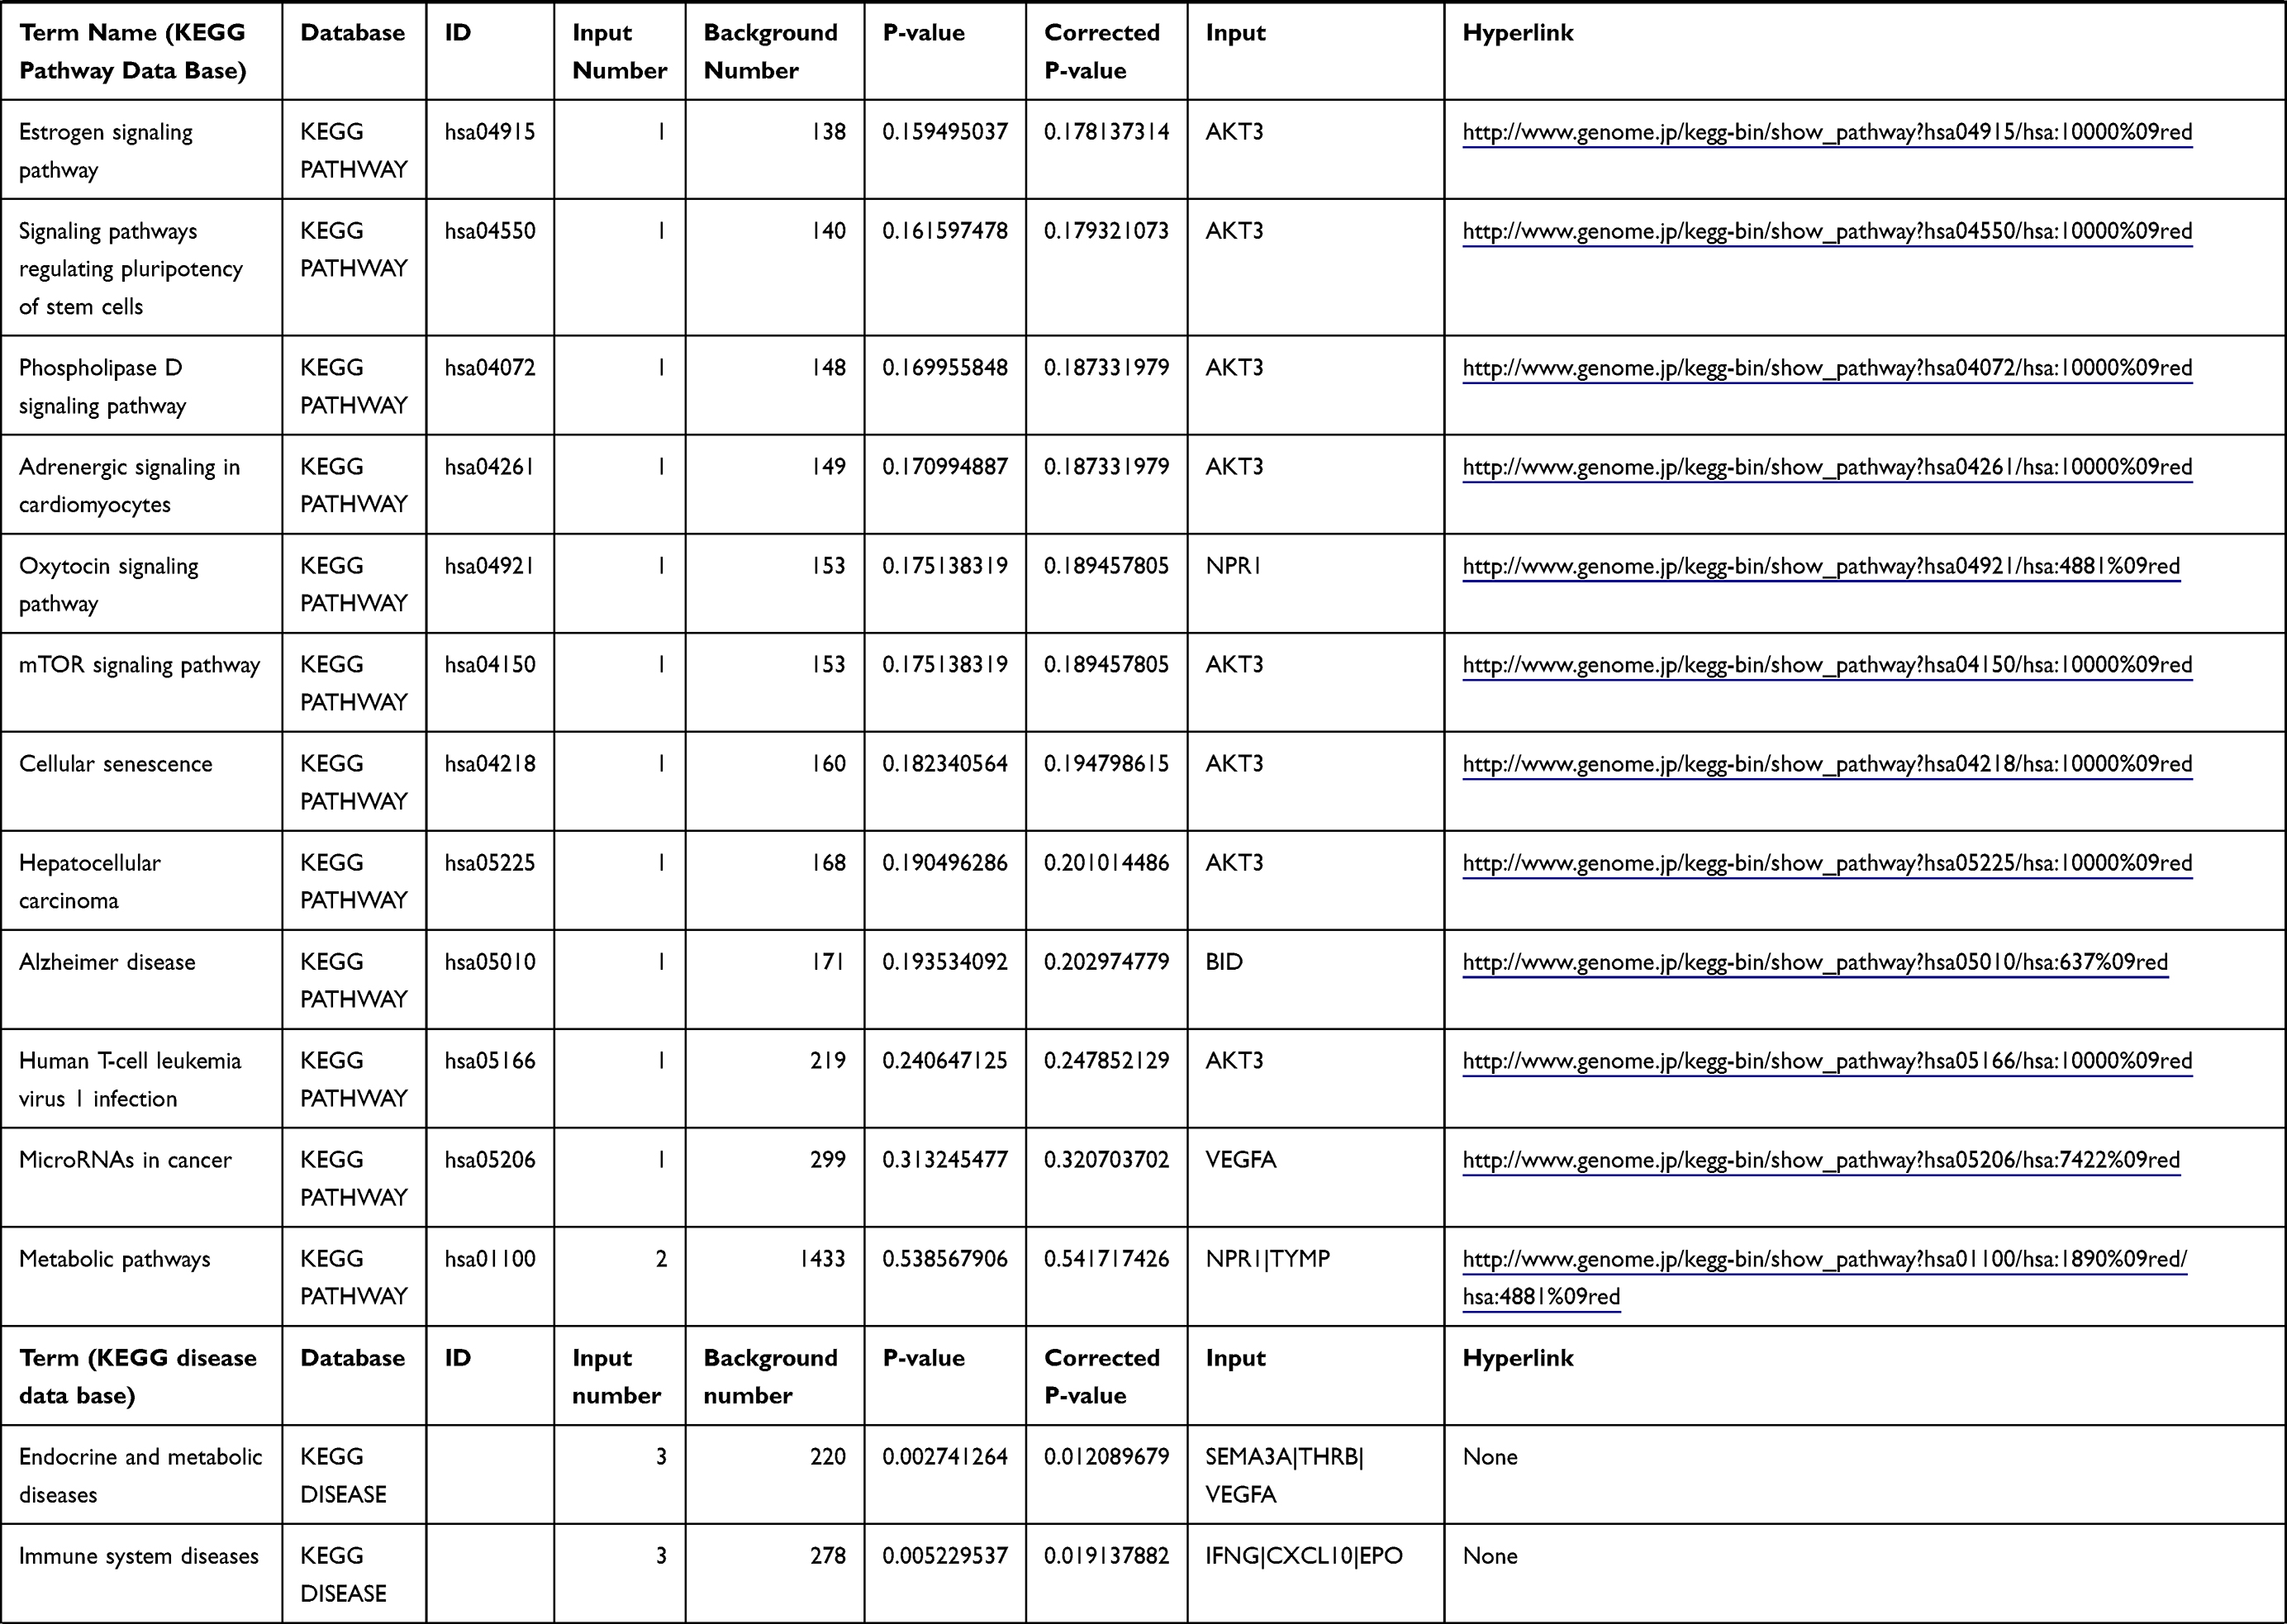 | 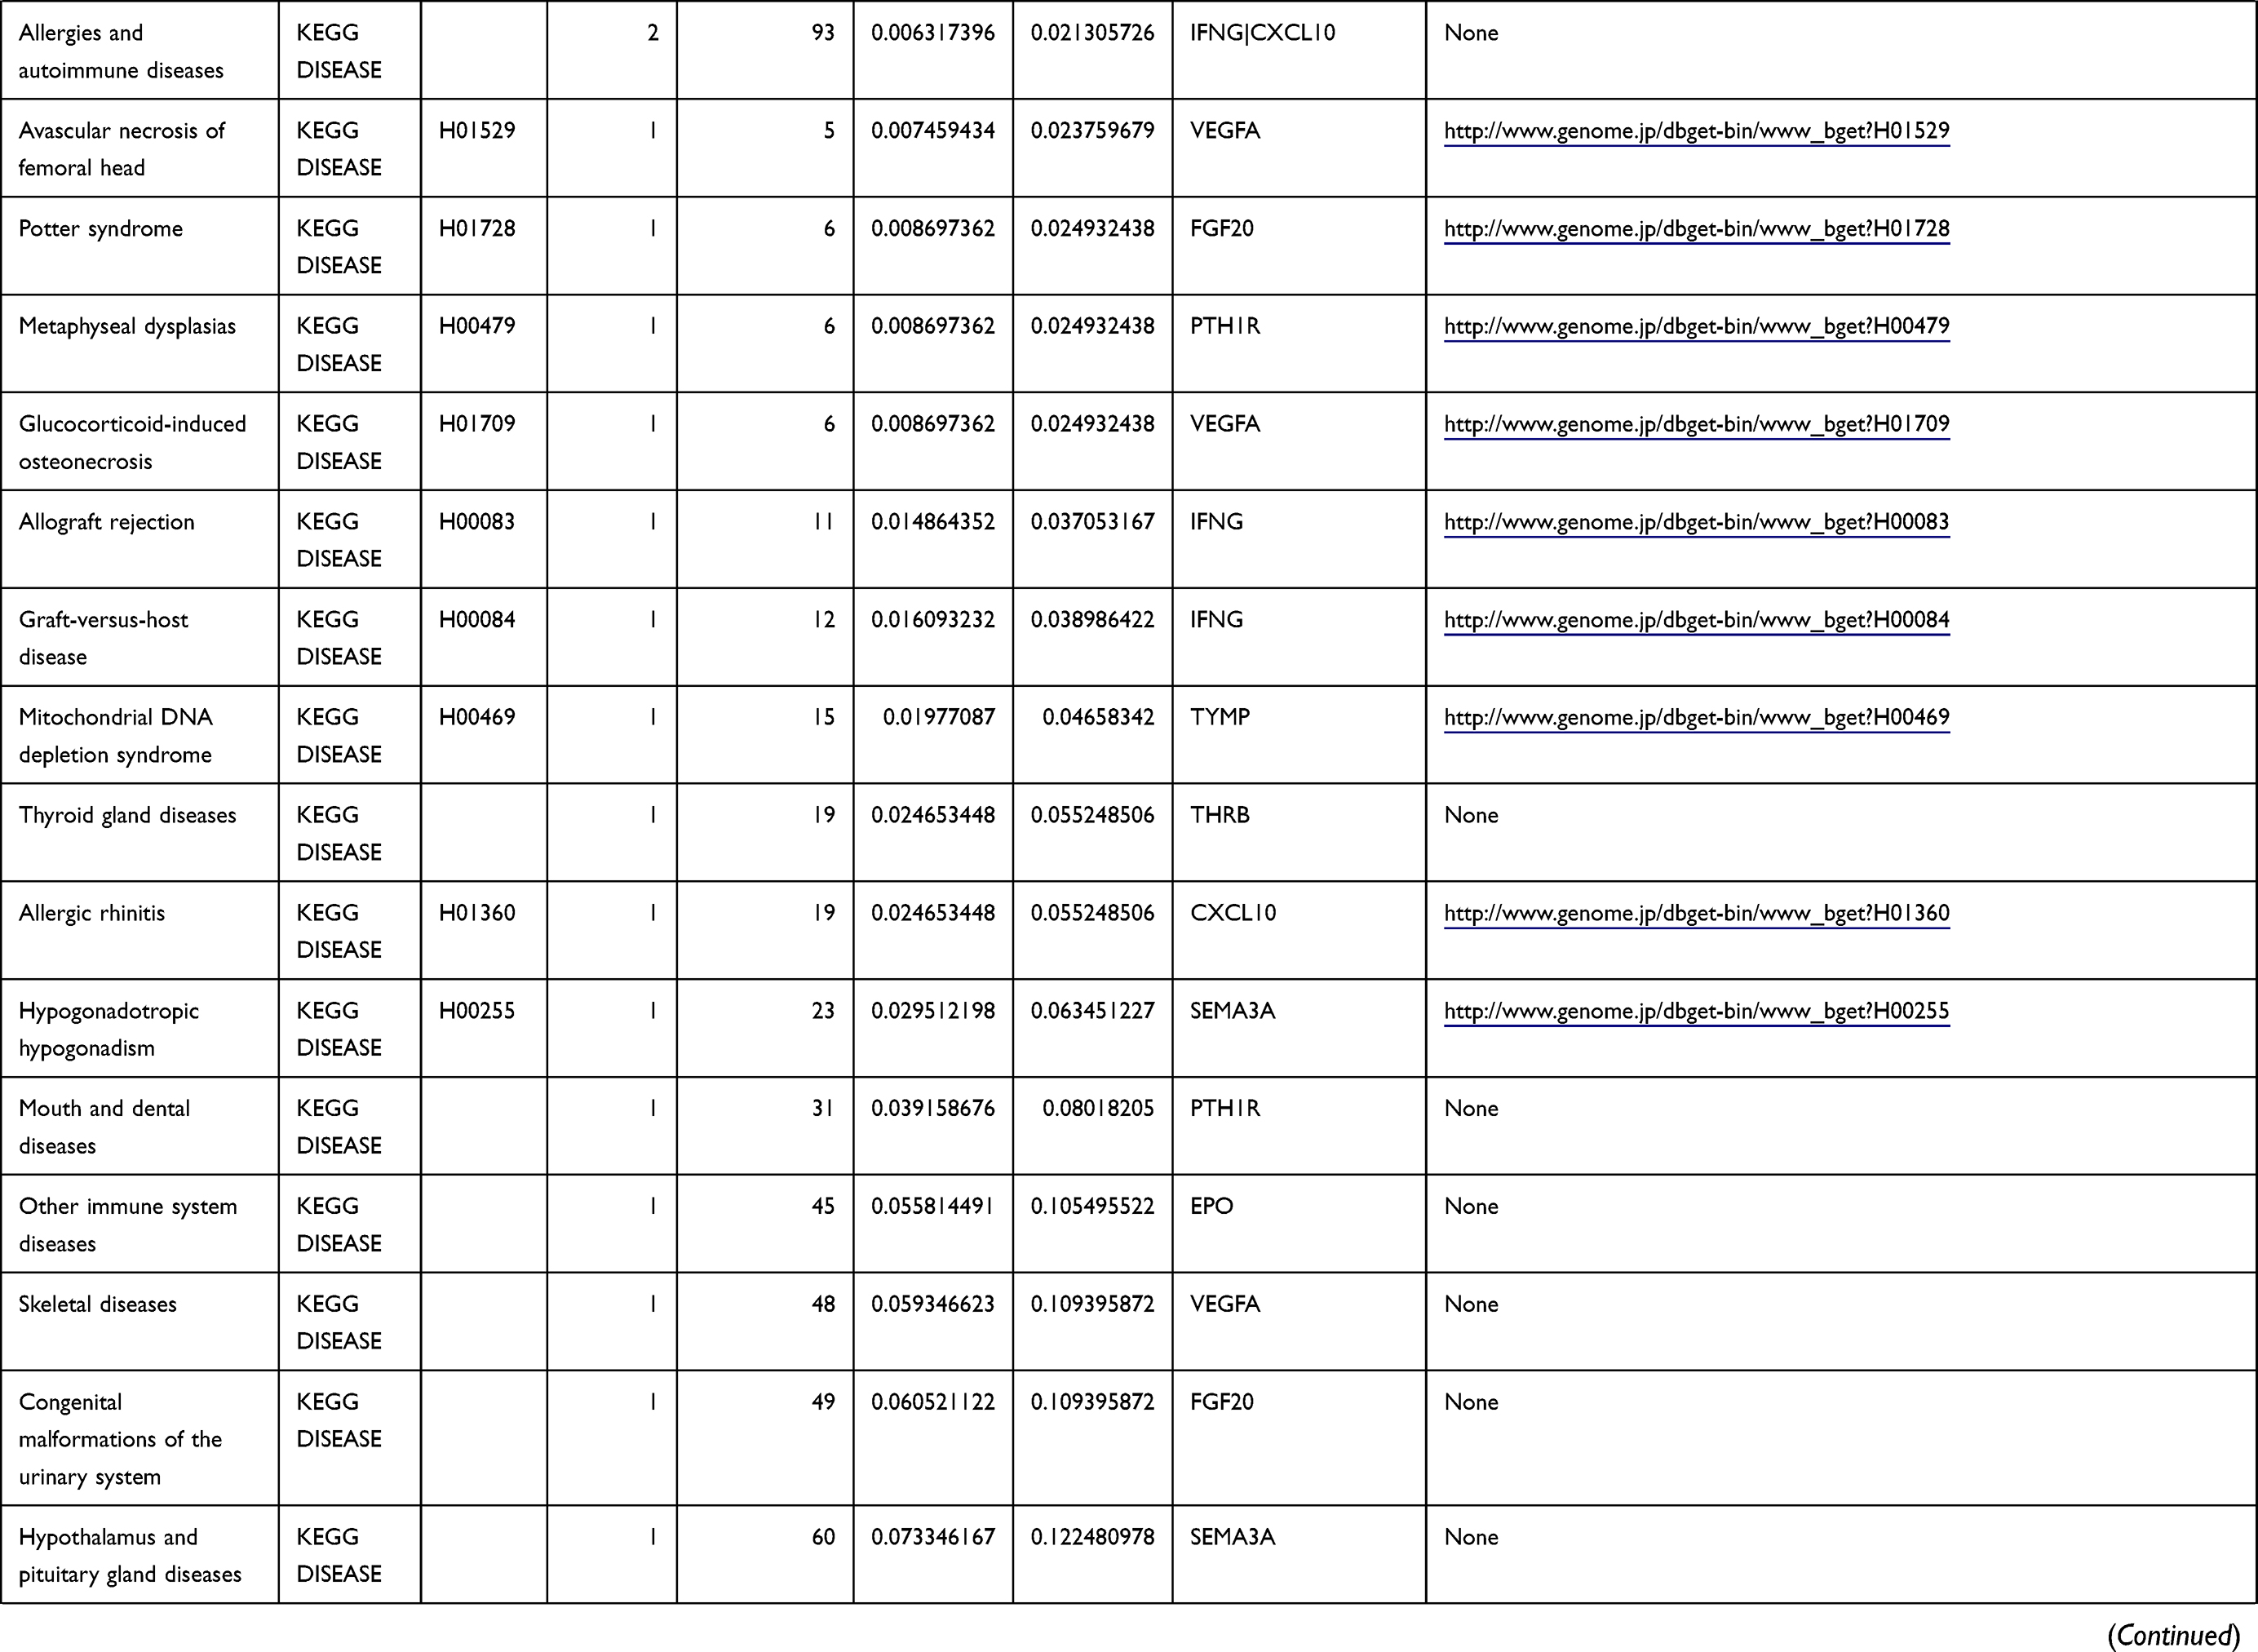 | 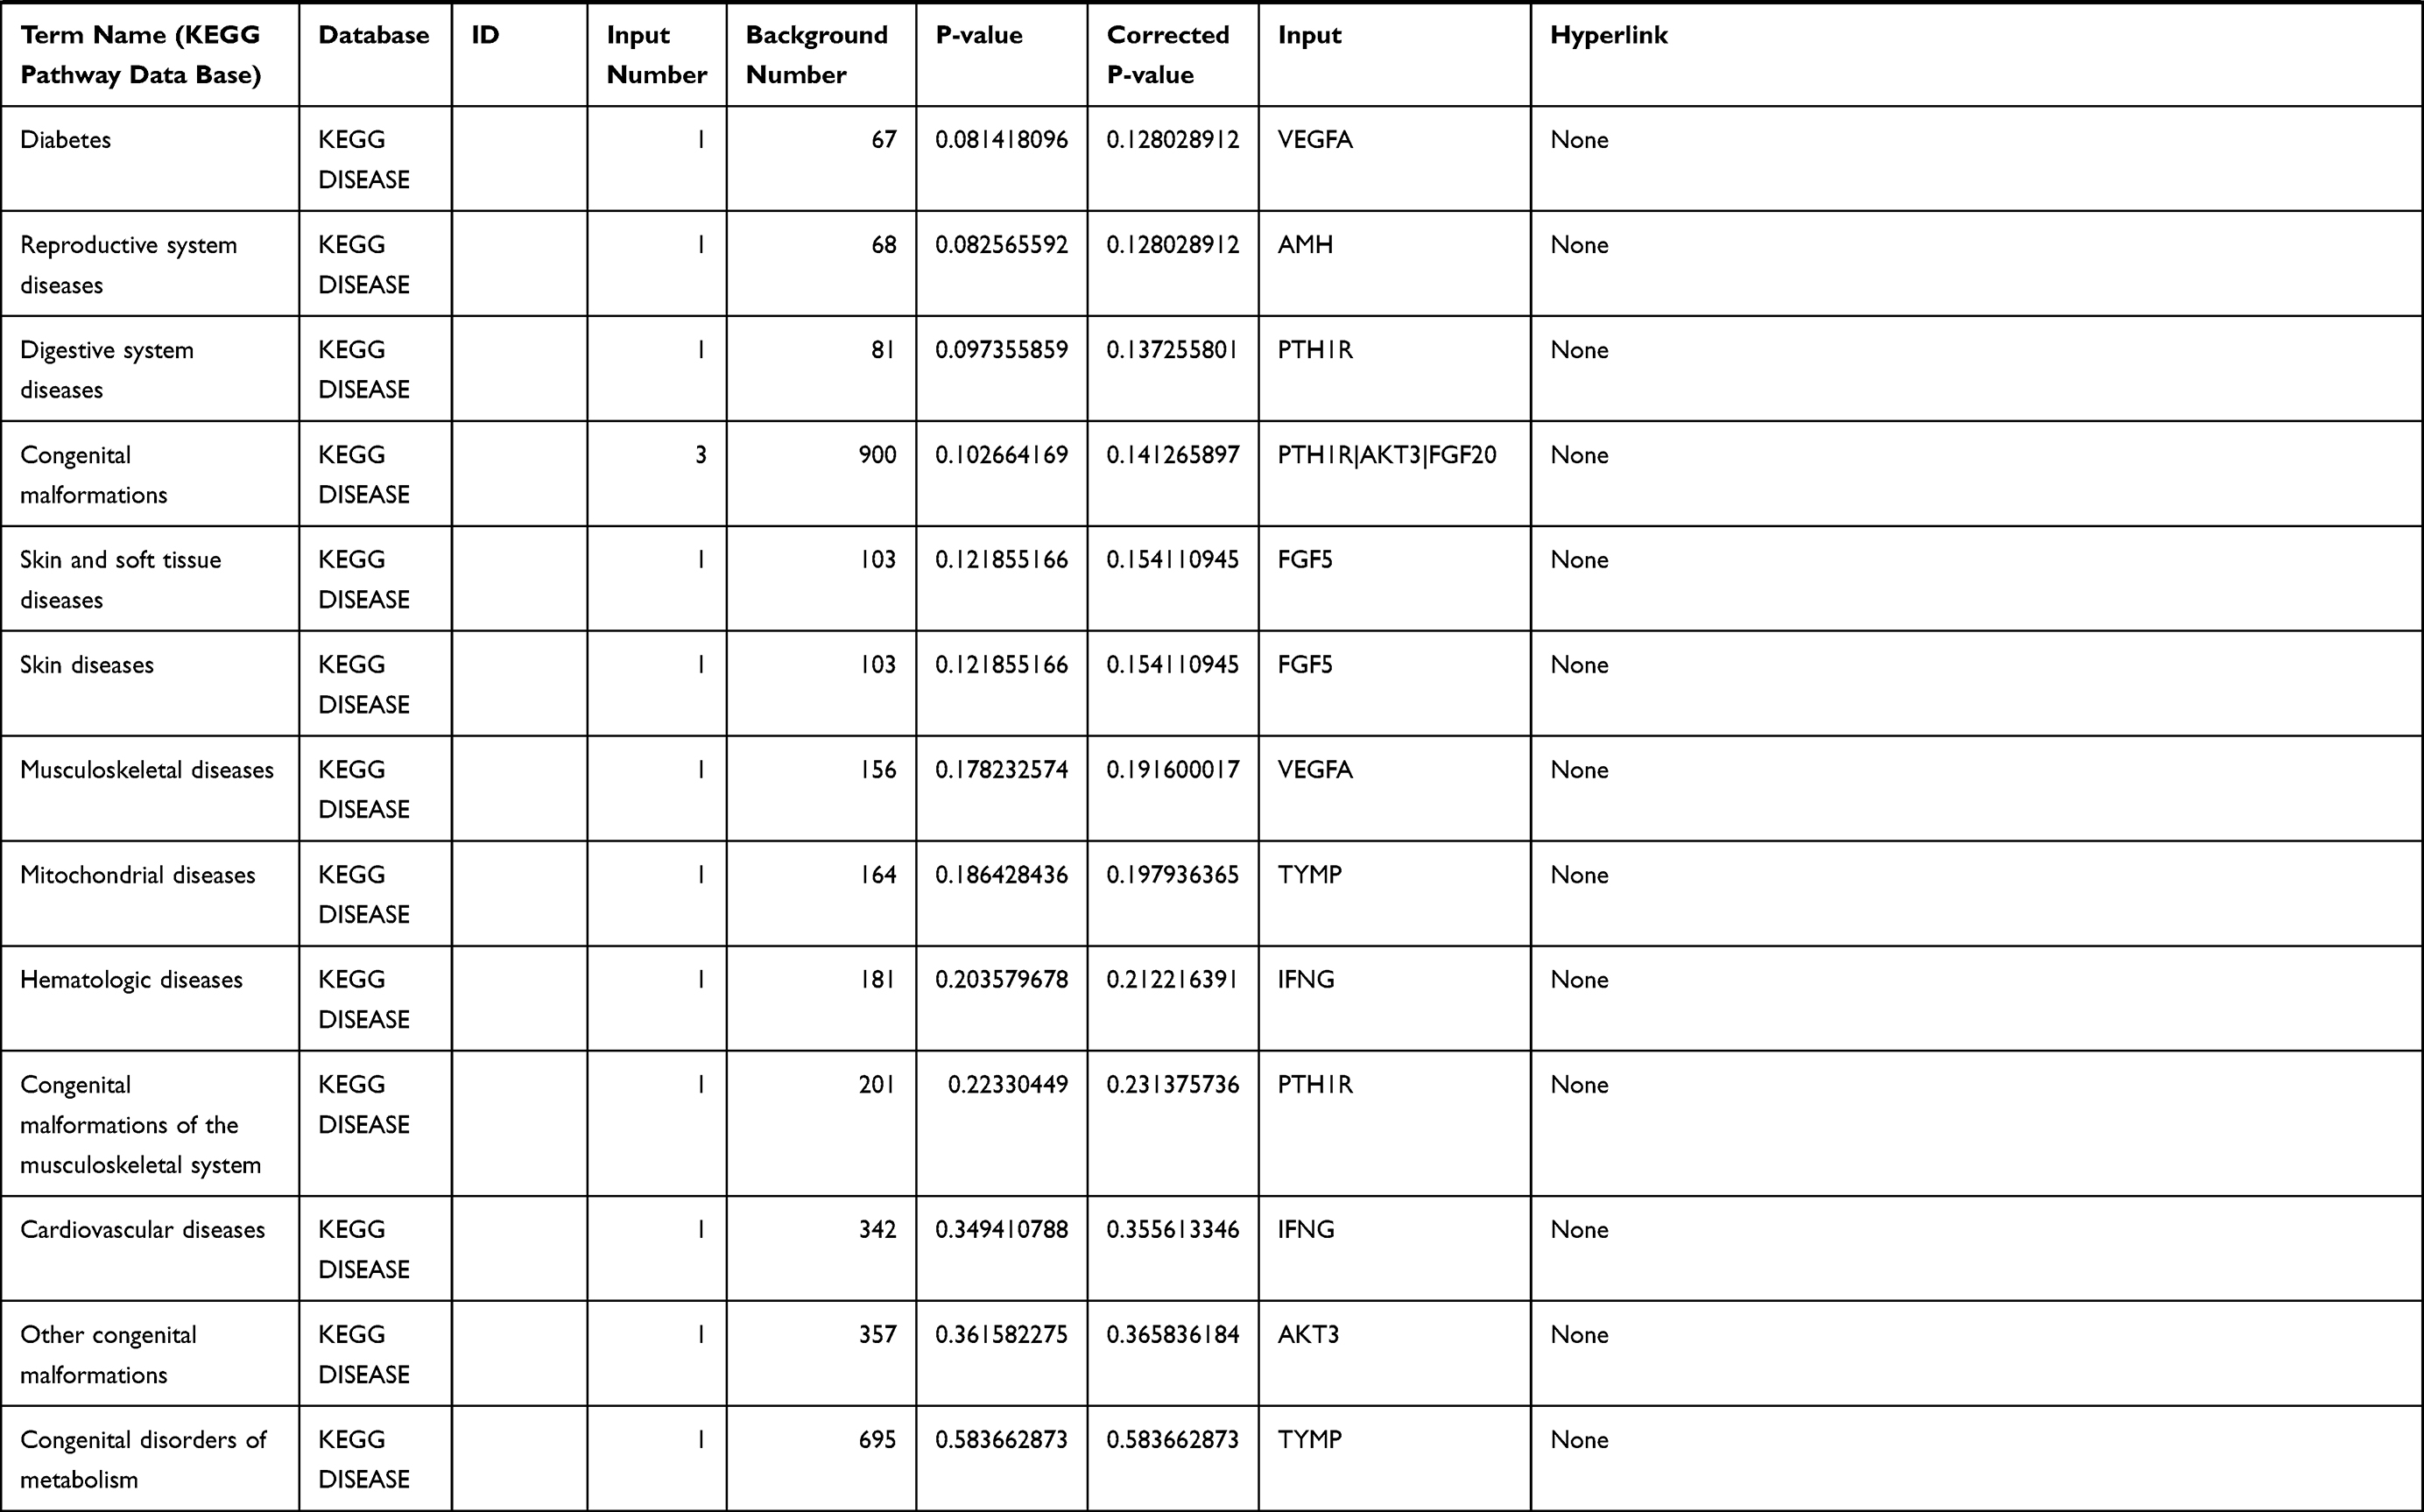 |
Table 1 The KEGG Enrichment Pathway List |
DEG Identification
Gene expression profiles were screened using the R package, and DEGs were identified in both groups. Based on PUD and GC integrated analysis, a common gene set was identified for the two groups. DEGs were determined based on an absolute value of log2 fold change (|log2FC|) >1 and a false discovery rate (FDR) <0.05. Heatmaps of DEGs were drawn using the “pheatmap” package in R and the common differentially expressed genes between the two datasets were determined using the “Venn diagrams” in R. Immune-related genes were extracted from the DEGs after KEGG enrichment analysis. Immune-related genes were downloaded from the IMMPORT database (https://www.immport.org/home).
Pathway Enrichment and Annotation
Enrichment analysis of the Kyoto Encyclopedia of Genes and Genomes (KEGG) pathway for DEGs was performed using the KOBAS online tool (http://kobas.cbi.pku.edu.cn/index.php). KEGG analysis showed DEG enrichment in the signaling pathways.
PPI Network Analysis
The immune-associated DEGs were then used for PPI analysis. The DEG PPI network was constructed using the STRING database. Nodes with the confidence of interactive relationship > 0.7 were defined as the threshold. Subsequently, CytoHubba was utilized to identify the top ten hub genes and Venn diagrams were used to visualize common genes between the top 20 hub genes from GC and PUD patients, respectively.
Gene Set Enrichment Analysis (GSEA) and CIBERSORT Algorithm
To explore the role of the ten hub genes in regulating the cell immunological micro-environment, the CIBERSORT algorithm was applied to assess the proportion of immune cells that infiltrated the ECM using the LM22 signature. The LM22 signature consisting of 547 genes was used to identify 22 types of infiltrating immune cells. The cell fraction of the PUD and GC datasets was identified. Difference and correlation analyses were performed to explore the correlation between SMA3D expression and the types of immune cells that infiltrated the GC and PUD microenvironment (P < 0.05).
Clinicopathological Characteristics Analysis and Survival Analysis
GC patients were classified into a high- and low-group based on SMA3D and NRP2 expression levels. The association between clinicopathological characteristics and SMA3D and NRP2 expression was evaluated. K-M plotter was used to plot survival curves, which were compared using the Log rank test. Univariate and multivariate analyses were performed using the Cox proportional hazards model to investigate the influence of genotypes on cancer risk. P<0.05 was regarded as statistically significant.
Statistical Analysis
Statistical analyses were performed using R software (version 4.0.2) and GraphPad Prism. All statistical methods and appropriate R packages were described throughout the study. Hypergeometric test/Fisher’s exact test was employed to perform KEGG enrichment analysis. Method proposed by Benjamini & Hochberg was used to control for the false discovery rate (FDR).24 ANOVA (one-way) and the Tukey’s test were used to compare multiple groups. Chi-square was used to analyze the correlation between SEMA3D and NRP2 expression in GC tissues and the patient clinical data. P and q<0.05 were considered statistically significant.
Results
DEGs Identification and Enrichment Analysis
Differential analysis was performed to determine immune-related DEGs. Heatmaps showed the differential gene expression profiles of GC and PUD patients (Figure 1A and B). A total of 6032 and 2032 DEGs were identified between the stromal low-score and high-score groups in each data set, respectively. The threshold of difference was |log2FC| >1 and FDR <0.05. In both the GC and PUD groups, 437 DEGs were identified as common DEGs using Venn diagrams (Figure 1C). The common DEGs were overlapped with immune-related gene sets from the IMMPORT database and 49 immune-related DEGs were grouped to identify their primary functions (Figure 1D). The top three KEGG enrichment scores indicated that these DEGs were enriched in the cytokine-cytokine receptor interaction, neuroactive ligand-receptor interaction, and Rap1 signaling pathway pathways (Figure 1E). The complete pathways list of the KEGG enrichment is shown in Table 1.
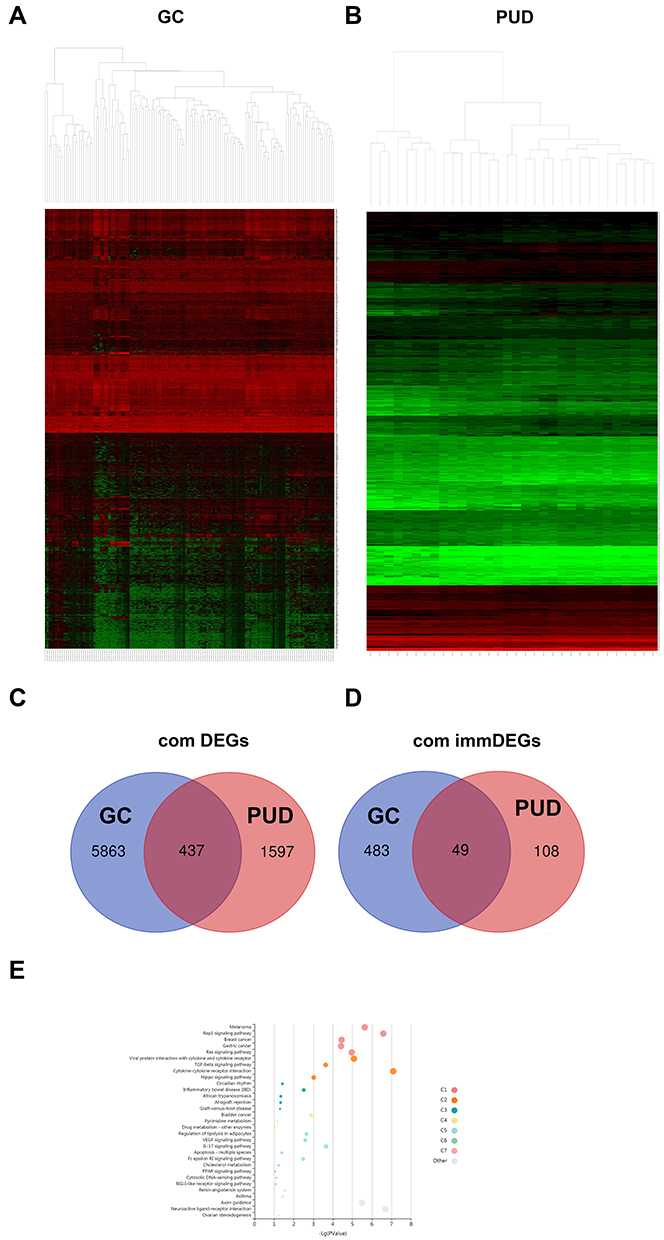 |
Figure 1 DEGs commonly expressed in three datasets. (A and B) Hierarchical clustering heatmap of upregulated and downregulated DEGs in the PUD or GC groups from each dataset (green points) and genes without significance (black points). The differences threshold was set as |log2FC| >1.0 and adjusted P-value <0.05. The Venn diagram shows 437 DEGs (C) and 49 immune-related DEG (D) commonly expressed across the two datasets. (E) KEGG enrichment analysis of immune-related DEGs. |
PPI Network Construction
The STRINGs database was used to assess the interaction between immune-associated DEGs (Figure 2A). A PPI network was then constructed with a confidence of interactive relationship >0.7 as the threshold. CytoHubba, a plug-in of the Cytoscape software, was used to screen the hub gene through three terms of degrees, closeness, and betweenness. Seven hub genes were identified as described in the methods (Figure 2B and C).
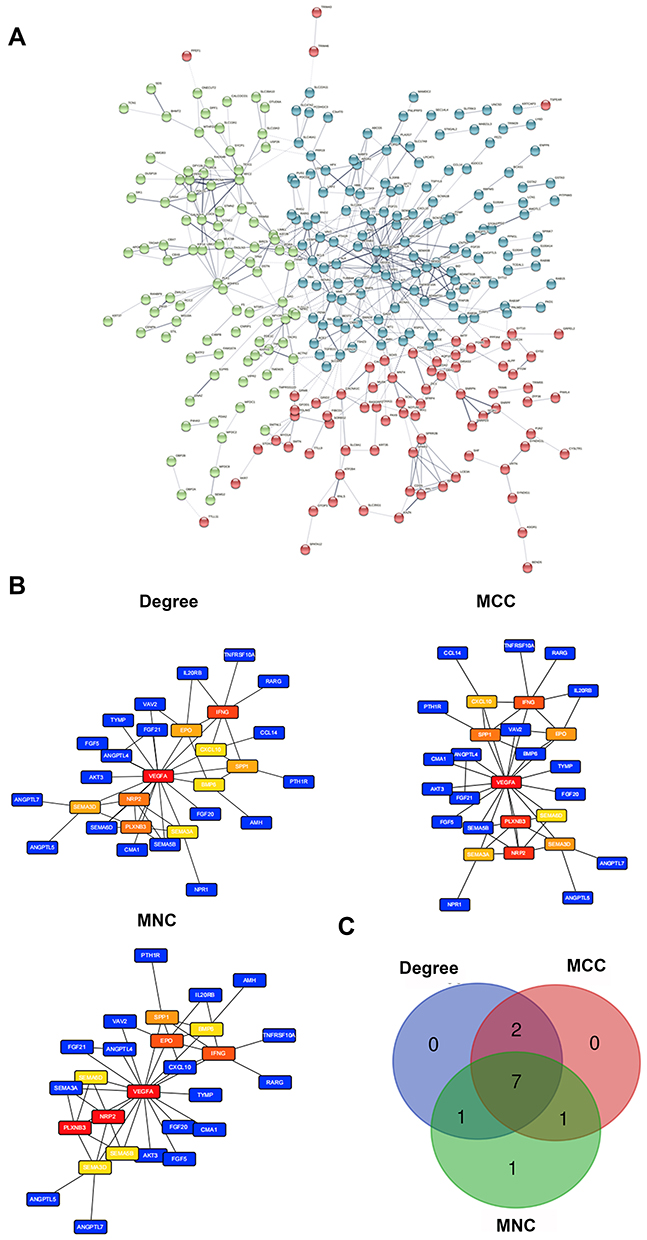 |
Figure 2 PPI networks and hub gene analysis of commonly expressed DEGs in the immune-related dataset. (A) PPI networks constructed by the STRINGs. (B) Major PPI network analysis of the top 10 hub genes using Cytohubba software by three methods. The node color reflects the degree of connectivity. (C) The Venn diagram of the three methods. |
Correlation of the Survival and Clinicopathological Characteristics with Hub Gene Expression
Of the seven hub genes, VEGFA, EPO, SPP1, IFNG, and PLXNB3 were closely related to GC progression. NRP2 and SEMA3D were selected for survival comparative analysis in the GC group. The Kaplan-Meier survival curve showed that GC patients with low expression of SEMA3Dlow had a better overall survival rate than those with high expression (Figure 3; P<0.05; adjust HR=2.446, 95% CI 1.225–4.882). In contrast, differences in NRP2 expression did not have much effect on overall survival (Figure 3B). The correlation between SEMA3D expression and clinical characteristics was assessed using COX analysis. SEMA3D expression was closely correlated with advanced disease stages but not with TNM classification, indicating that SEMASD merits a higher clinical prognostic value (Table 2, *p<0.05).
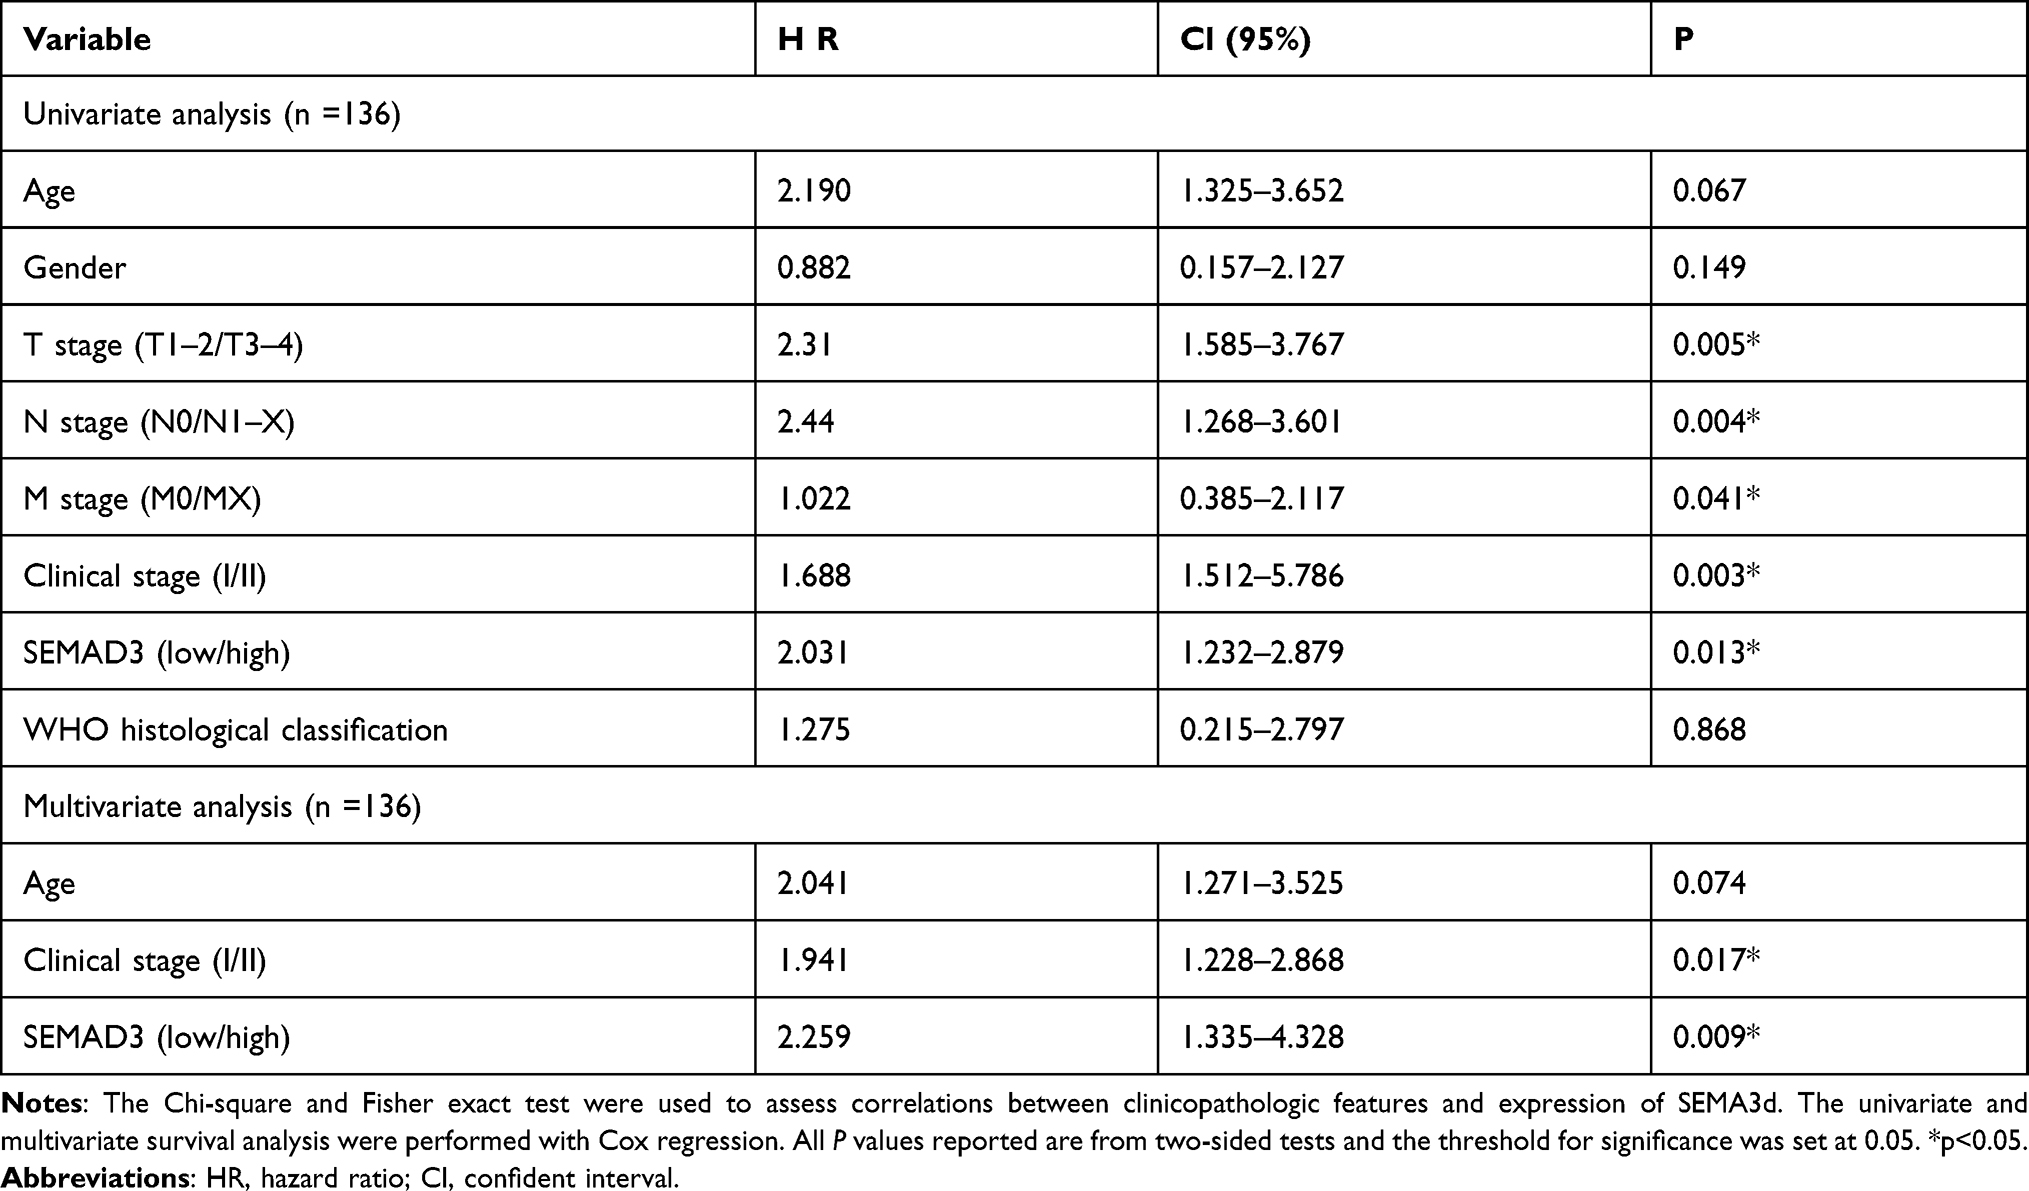 |
Table 2 Cox Regression Analysis of Many Clinical-Pathological Characteristic in GC Dataset with SEMAD3 |
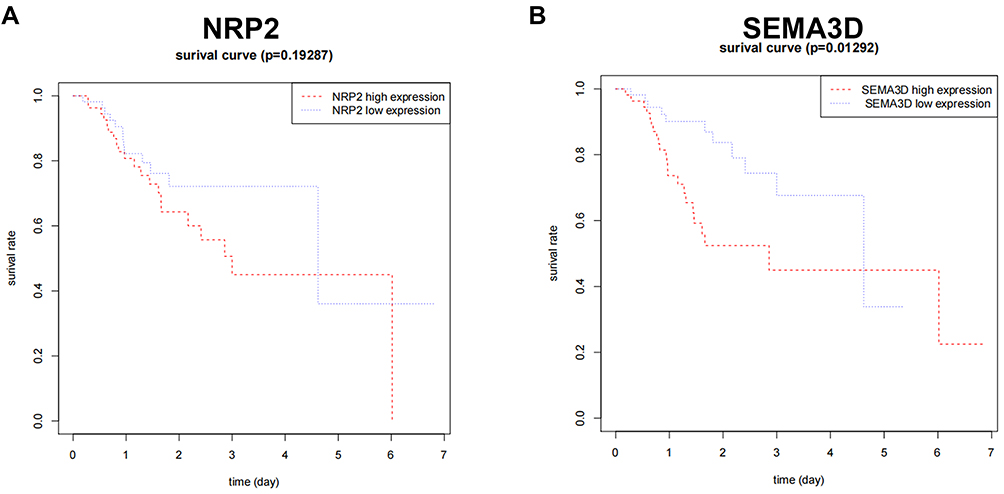 |
Figure 3 Correlation of NRP2 (A) and SEMA3D (B) expression with GC patient survival. COX analysis was performed to get an adjusted HR: (SEMA3D: P=0.01292; adjust HR=2.446, 95% CI 1.225–4.882), (NRP2: P=0.19287; adjust HR=1.313, 95% CI 10.6540–2.635). |
Immune Cell Infiltration Analysis and Correlation Analysis
The CIBERSORT algorithm with 22 immune cells signature was employed to perform immune cell infiltration analysis using GC and PUD tissue samples. A higher fraction of active mast cells were found in the GC group than in the PUD group (Figure 4A). As shown in Figure 4B, SEMA3D expression and active mast cells showed a significant positive correlation in the GC group, but SEMA3D expression and DCs were positively correlated in the PUD group.
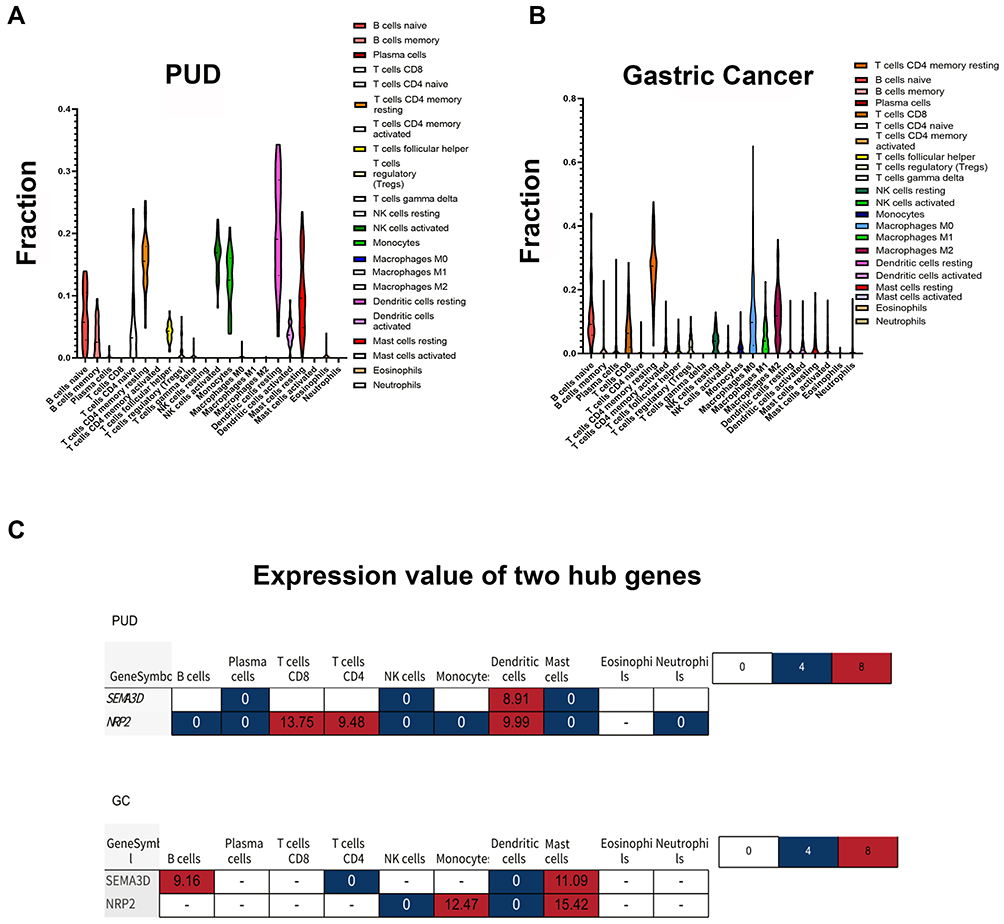 |
Figure 4 Immune cell infiltration analysis and correlation analysis. (A) Violin plot showing significant changes in immune cell infiltration in GC compared with PUD groups (P-value <0.05). (B) Correlation between gene expression and the relative percentages of immune cells in PUD and GC tissue.(C) The expression value of the two hub genes in different immune cells. |
Discussion
The primary goal of this study was to explore significant hub genes associated with the malignant transformation of PUD into early GC. Seven significant hub genes were identified using bioinformatics. The SEMA3D gene was found to correlate with advanced clinicopathological stages of GC and patient survival.
KEGG pathway enrichment analysis showed that DEGs regulate many types of immune response in clinical tissue. SEMA3s always require additional neuropilin (NRP) receptors to bind VEGF, and the VEGF/SEMA3s balance is a prognostic marker of disease.25 Results from this study showed that high expression of SEMA3D and NRP2 correlated with activation of the non-canonical VEGF pathway, while VEGFA signaling was inhibited. Given the TLR4 was shown to mediate CD8+T cell activation during particular innate immune responses to disease, VEGF pathway was regarded as a critical regulator in pro-inflammatory responses.21,26,27
SEMA3D, which encodes a semaphorin III family secreted protein, is a critical regulator of neuron development and diverse tumorigenic processes like proliferation, invasion, and angiogenesis.19,28,29 Abnormal SEMA3D expression is associated with a poor prognosis in many nervous system diseases and cancers.20,25,30–32 Decreased SEMA3D expression in gastrointestinal tumors correlates significantly with colorectal cancer progression while overexpression is a favorable prognostic factor for survival.33 SEMA3D is reported to participate in the recruitment of immune cells to the disease site.34 Results from this study showed that SEMA3D was significantly correlated with PUD patient outcomes. These findings imply that SMA3D could serve as a potential biomarker for early diagnosis of GC.
PPI and KEGG analyses showed that SEMA3D was involved in regulating immune-related pathways and the extracellular microenvironment of GC. The proportions of immune cells that infiltrated the cellular microenvironment were estimated using the CIBERSORT algorithm and NRP2 and SEMA3D were expressed in similar cell types. SEMA3D expression was primarily correlated with three infiltrating immune cell types, CD4+T cells, DCs, and mast cells. Interestingly, SEMA3D and NER2 expression were enriched in CD4+T cells and DCs from the PUD samples but primarily expressed in CD4+T cells and mast cells from the GC samples. Different DC subsets can differentially regulate T cell function. In PUD samples, DCs primarily functioned to induce T and B cell activation.23 Mast cell function during cancer remains unclear, however. Recent studies show that mast cells promote gastric tumor cancer by releasing angiogenic cytokines.35 Results from this study suggest that while SEMA3D expression in DCs from PUD tissue samples may help them to subvert the host immune response by activating T cells, SEMASD expression in mast cells may promote tumorigenesis. Similar heterogeneous functions of other SEMA3s are reported in other cancers.36 A diagram that summarizes the findings of this study and hypothesizes how SEMA3D expression impacts DC and mast cell function is shown in Hypothetic Diagram (Figure S2). The detailed molecular mechanism of how this occurs requires additional study.
Results from this study defined seven hub genes associated with PUD-related carcinogenesis, provided strong evidence that SEMA3D correlates with tumor-related immune activation or dysfunction, and provided a new direction to study how hub gene functions during PUD and GC. However, this study does not describe the detailed mechanism by which hub genes participate in DC and mast cell function during PUD inflammation or the potential relationship between these genes and HP infection. HP-induced PUD is associated with gastric cancer, but there are few biomarkers that aid disease prognosis in clinical practice. In this study, SEMASD was defined as a potential prognostic molecule for PUD and GC, though its mechanism of action and clinical value require further research.
Conclusions
Using comprehensive bioinformatics, this study found that the hub gene, SEMA3D, was associated with the infiltration of immune cells, in particular DCs and mast cells, into PUD and GC tissue samples. Additional research on how SEMASD impacts immune cell function in the PUD and GC dataset will help to elucidate the mechanism of malignant transformation during PUD.
Abbreviations
SEMA3s, Class-3 semaphorins; DC, dendritic cell; ECM, extracellular matrix; FDR, false discovery rate; GC, gastrointestinal cancer; GEO, Gene Expression Omnibus; HP, Helicobacter pylori; KEGG, Kyoto Encyclopedia of Genes and Genomes; PPI, Protein-protein interaction; PUD, Peptic ulcer disease; TCGA, The Cancer Genome Atlas.
Ethical Approval and Consent to Participate
This study was approved and conducted in compliance with the guidelines by the ethics committee of Affiliated Hospital of Hebei University (AHHU20211029). All the data used in the study was downloaded from TCGA and GEO database. Written informed consent was acquired from all enrolled patients. These original research has been carried out in accordance with the World Medical Association Declaration of Helsinki.
Author Contributions
All authors made a significant contribution to the work reported, whether that is in the conception, study design, execution, acquisition of data, analysis and interpretation, or in all these areas; took part in drafting, revising or critically reviewing the article; gave final approval of the version to be published; have agreed on the journal to which the article has been submitted; and agree to be accountable for all aspects of the work.
Funding
This research received no specific grant from any funding agency in the public, commercial, or not-for-profit sectors.
Disclosure
The authors report no conflicts of interest in this work.
References
1. Suerbaum S, Michetti P. Helicobacter pylori infection. N Engl J Med. 2002;347(15):1175–1186. doi:10.1056/NEJMra020542
2. Uemura N, Okamoto S, Yamamoto S, et al. Helicobacter pylori infection and the development of gastric cancer. N Engl J Med. 2001;345(11):784–789. doi:10.1056/NEJMoa001999
3. Camilo V, Sugiyama T, Touati E. Pathogenesis of Helicobacter pylori infection. Helicobacter. 2017;22(Suppl 1). PMID: 28891130. doi:10.1111/hel.12405.
4. Wessler S, Krisch LM, Elmer DP, Aberger F. From inflammation to gastric cancer - the importance of Hedgehog/GLI signaling in Helicobacter pylori-induced chronic inflammatory and neoplastic diseases. Cell Commun Signal. 2017;15(1):15.
5. Bagheri N, Azadegan-Dehkordi F, Rahimian G, Rafieian-Kopaei M, Shirzad H. Role of regulatory T-cells in different clinical expressions of helicobacter pylori infection. Arch Med Res. 2016;47(4):245–254. doi:10.1016/j.arcmed.2016.07.013
6. Valkenburg KC, de Groot AE, Pienta KJ. Targeting the tumour stroma to improve cancer therapy. Nat Rev Clin Oncol. 2018;15(6):366–381.
7. Chen Q, Liu G, Liu S, et al. Remodeling the tumor microenvironment with emerging nanotherapeutics. Trends Pharmacol Sci. 2018;39(1):59–74. doi:10.1016/j.tips.2017.10.009
8. Jiang Y, Zhang Q, Hu Y, et al. ImmunoScore signature: a prognostic and predictive tool in gastric cancer. Ann Surg. 2018;267(3):504–513. doi:10.1097/SLA.0000000000002116
9. Marta ŻN, Agnieszka W, Jacek P, et al. NFKB2 gene expression in patients with peptic ulcer diseases and gastric cancer. Mol Biol Rep. 2020;47(3):2015–2021. doi:10.1007/s11033-020-05299-5
10. Zeng D, Li M, Zhou R, et al. Tumor microenvironment characterization in gastric cancer identifies prognostic and immunotherapeutically relevant gene signatures. Cancer Immunol Res. 2019;7(5):737–750. doi:10.1158/2326-6066.CIR-18-0436
11. Newman AM, Liu CL, Green MR, et al. Robust enumeration of cell subsets from tissue expression profiles. Nat Methods. 2015;12(5):453–457. doi:10.1038/nmeth.3337
12. Bense RD, Sotiriou C, Piccart-Gebhart MJ, et al. Relevance of tumor-infiltrating immune cell composition and functionality for disease outcome in breast cancer. J Natl Cancer Inst. 2017;109(1):djw192. doi:10.1093/jnci/djw192
13. Chen B, Khodadoust MS, Liu CL, Newman AM, Alizadeh AA. Profiling tumor infiltrating immune cells with CIBERSORT. Methods Mol Biol. 2018;1711:243–259.
14. Angelopoulou E, Piperi C. Emerging role of plexins signaling in glioma progression and therapy. Cancer Letter. 2018;414:81–87. doi:10.1016/j.canlet.2017.11.010
15. Toledano S, Nir-Zvi I, Engelman R, Kessler O, Neufeld G. Class-3 semaphorins and their receptors: potent multifunctional modulators of tumor progression. Int J Mol Sci. 2019;20(3):556. doi:10.3390/ijms20030556
16. Wu J, Xiao Y, Xia C, et al. Identification of biomarkers for predicting lymph node metastasis of stomach cancer using clinical DNA methylation data. Dis Markers. 2017;2017:5745724. doi:10.1155/2017/5745724
17. Movassagh H, Shan L, Koussih L, et al. Semaphorin 3E deficiency dysregulates dendritic cell functions: in vitro and in vivo evidence. PLoS One. 2021;16(6):e0252868. doi:10.1371/journal.pone.0252868
18. Choi YI, Duke-Cohan JS, Ahmed WB, et al. PlexinD1 glycoprotein controls migration of positively selected thymocytes into the medulla. Immunity. 2008;29(6):888–898. doi:10.1016/j.immuni.2008.10.008
19. Aghajanian H, Choi C, Ho VC, Gupta M, Singh MK, Epstein JA. Semaphorin 3d and semaphorin 3e direct endothelial motility through distinct molecular signaling pathways. J Biol Chem. 2014;289(26):17971–17979.
20. Kigel B, Varshavsky A, Kessler O, Neufeld G. Successful inhibition of tumor development by specific class-3 semaphorins is associated with expression of appropriate semaphorin receptors by tumor cells. PLoS One. 2008;3(9):e3287.
21. Gaddis DE, Padgett LE, Wu R, Hedrick CC. Neuropilin-1 expression on CD4 T cells is atherogenic and facilitates T cell migration to the aorta in atherosclerosis. J Immunol. 2019;203(12):3237–3246. doi:10.4049/jimmunol.1900245
22. Reyes VE, Peniche AG. Helicobacter pylori deregulates T and B cell signaling to trigger immune evasion. Curr Top Microbiol Immunol. 2019;421:229.
23. Kao JY, Zhang M, Miller MJ, et al. Helicobacter pylori immune escape is mediated by dendritic cell-induced Treg skewing and Th17 suppression in mice. Gastroenterology. 2010;138(3):1046–1054. doi:10.1053/j.gastro.2009.11.043
24. Benjamini Y, Hochberg Y. Controlling the false discovery rate: a practical and powerful approach to multiple testing. J R Stat Soc Series B Stat Methodol. 1995;57(1):289–300.
25. Karayan-Tapon L, Wager M, Guilhot J, et al. Semaphorin, neuropilin and VEGF expression in glial tumours: SEMA3G, a prognostic marker? Br J Cancer. 2008;99(7):1153–1160.
26. Li S, Liu M, Do MH, et al. Cancer immunotherapy via targeted TGF-β signalling blockade in TH cells. Nature. 2020;587(7832):121–125. doi:10.1038/s41586-020-2850-3
27. Yun H, Yee MB, Lathrop KL, Kinchington PR, Hendricks RL, St Leger AJ. Production of the cytokine VEGF-A by CD4+ T and myeloid cells disrupts the corneal nerve landscape and promotes herpes stromal keratitis. Immunity. 2020;53(5):1050–1062.e5. doi:10.1016/j.immuni.2020.10.013
28. Berndt JD, Halloran MC. Semaphorin 3d promotes cell proliferation and neural crest cell development downstream of TCF in the zebrafish hindbrain. Development. 2006;133(20):3983–3992. doi:10.1242/dev.02583
29. Sabag AD, Bode J, Fink D, Kigel B, Kugler W, Neufeld G. Semaphorin-3D and semaphorin-3E inhibit the development of tumors from glioblastoma cells implanted in the cortex of the brain. PLoS One. 2012;7(8):e42912. doi:10.1371/journal.pone.0042912
30. Foley K, Rucki AA, Xiao Q, et al. Semaphorin 3D autocrine signaling mediates the metastatic role of annexin A2 in pancreatic cancer. Sci Signal. 2015;8(388):ra77. doi:10.1126/scisignal.aaa5823
31. Luzon-Toro B, Fernandez RM, Torroglosa A, et al. Mutational spectrum of semaphorin 3A and semaphorin 3D genes in Spanish Hirschsprung patients. PLoS One. 2013;8:e54800. doi:10.1371/journal.pone.0054800
32. Hu Z, Zhu D, Wang W, et al. Genome-wide profiling of HPV integration in cervical cancer identifies clustered genomic hot spots and a potential microhomology-mediated integration mechanism. Nat Genet. 2015;47(2):158–163. doi:10.1038/ng.3178
33. Wang Z, Ding M, Qian N, et al. Decreased expression of semaphorin 3D is associated with genesis and development in colorectal cancer. World J Surg Oncol. 2017;15(1):67. doi:10.1186/s12957-017-1128-1
34. McGeachie MJ, Wu AC, Tse SM, et al. CTNNA3 and SEMA3D: promising loci for asthma exacerbation identified through multiple genome-wide association studies. J Allergy Clin Immunol. 2015;136(6):1503–1510. doi:10.1016/j.jaci.2015.04.039
35. Sammarco G, Varricchi G, Ferraro V, et al. Mast cells, angiogenesis and lymphangiogenesis in human gastric cancer. Int J Mol Sci. 2019;20(9):2106. doi:10.3390/ijms20092106
36. Zhang X, Klamer B, Li J, Fernandez S, Li L. A pan-cancer study of class-3 semaphorins as therapeutic targets in cancer. BMC Med Genomics. 2020;13(Suppl 5):45. doi:10.1186/s12920-020-0682-5
 © 2022 The Author(s). This work is published and licensed by Dove Medical Press Limited. The full terms of this license are available at https://www.dovepress.com/terms.php and incorporate the Creative Commons Attribution - Non Commercial (unported, v3.0) License.
By accessing the work you hereby accept the Terms. Non-commercial uses of the work are permitted without any further permission from Dove Medical Press Limited, provided the work is properly attributed. For permission for commercial use of this work, please see paragraphs 4.2 and 5 of our Terms.
© 2022 The Author(s). This work is published and licensed by Dove Medical Press Limited. The full terms of this license are available at https://www.dovepress.com/terms.php and incorporate the Creative Commons Attribution - Non Commercial (unported, v3.0) License.
By accessing the work you hereby accept the Terms. Non-commercial uses of the work are permitted without any further permission from Dove Medical Press Limited, provided the work is properly attributed. For permission for commercial use of this work, please see paragraphs 4.2 and 5 of our Terms.