Back to Journals » International Journal of Nanomedicine » Volume 17
Selective Polyetheretherketone Implants Combined with Graphene Cause Definitive Cell Adhesion and Osteogenic Differentiation
Authors Su Z ![]() , Zhang J, Tan P, Zhu S, Jiang N
, Zhang J, Tan P, Zhu S, Jiang N
Received 28 June 2022
Accepted for publication 30 October 2022
Published 15 November 2022 Volume 2022:17 Pages 5327—5338
DOI https://doi.org/10.2147/IJN.S380345
Checked for plagiarism Yes
Review by Single anonymous peer review
Peer reviewer comments 2
Editor who approved publication: Professor Farooq A. Shiekh
Zhan Su,* Jie Zhang,* Peijie Tan, Songsong Zhu,* Nan Jiang*
State Key Laboratory of Oral Diseases, National Clinical Research Center for Oral Diseases, Department of Oral & Maxillofacial Surgery, West China Hospital of Stomatology, Sichuan University, Chengdu, 610041, People’s Republic of China
*These authors contributed equally to this work
Correspondence: Songsong Zhu; Nan Jiang, Email [email protected]; [email protected]
Introduction: Polyetheretherketone (PEEK) has good biosafety and chemical stability for bone repair. However, PEEK is biologically inert and cannot promote bone apposition. This study investigated whether graphene-modified PEEK (G-PEEK) could improve cell adhesion and osteogenic differentiation.
Methods: G-PEEK was prepared by melted blending and was characterized. In vitro, the biocompatibility of G-PPEK and the ability to promote cell adhesion and osteogenic differentiation in rabbit bone marrow mesenchymal stem cells (rBMSCs) were examined using live and dead cell double staining, the cell counting kit-8 (CCK-8) assay, immunofluorescence and quantitative real-time PCR (qRT‒PCR). An in vivo rabbit extra-articular graft-to-bone healing model was established. At 4 and 12 weeks after surgery, CT analysis and histological evaluation were performed.
Results: In vitro, G-PEEK significantly improved the adhesion and proliferation of rBMSCs, with good biocompatibility. In vivo, G-PEEK promoted new bone formation at the site of the bone defect.
Conclusion: G-PEEK showed excellent osteogenesis performance, which promises new applications in implant materials.
Keywords: polyetheretherketone, graphene, nanocomposites, cell adhesion, osteogenic differentiation
Introduction
In the current field of bone repair, various functional bioactive materials with excellent biocompatibility have emerged, and many have been applied in clinical practice.1–3 The most widely used bone repair biomaterials are metal materials with high elastic modulus such as titanium and its alloys.4,5 However, the high elastic modulus of metal differs significantly from that of natural bone.6 This mismatch will cause a stress shielding effect: the metal implant bears a major load when the bone and the implant are simultaneously stressed, which may lead to adjacent bone atrophy or implant failure.5,7 In addition, metal implants may interact with body fluids and undergo electrochemical corrosion, and metal ions can act as haptens and cause an inflammatory response.8–10
Fabricating a bone implant material with an elastic modulus matching that of natural bone would be ideal to address these problems. Polyetheretherketone (PEEK) is an aromatic thermoplastic polymer material with outstanding biosecurity and chemical stability that is used in bone repair; intriguingly, it has properties similar to natural bone.11,12 PEEK is currently used as the molding material for cranioplasty in cranial and maxillofacial surgery and is also used as the intervertebral fusion apparatus in spinal surgery.13,14
However, although PEEK meets the basic mechanical and biological requirements of a bone implant material, it is biologically inert with a poor local osteogenic effect after implantation, which makes it challenging to achieve osseointegration.15,16 This limitation strongly hinders the development of PEEK-based applications in orthopedics. Improving the biological activity of PEEK and endowing it with an osseointegration capability comparable to that of metal implants is currently an active area of investigation in the field of PEEK matrix bone repair materials.17
In recent years, the functional nanomaterial graphene (G) and its derivatives have been widely used in catalysis, drug delivery, tissue engineering and other fields.18–20 Nanographene is a two-dimensional nanomaterial composed of carbon atoms separated from graphite. It has gained considerable attention because of its high mechanical strength and excellent biocompatibility.21 Nanographene can promote the adhesion, proliferation and osteogenic differentiation of bone marrow stromal stem cells (BMSCs), showing its considerable potential in tissue regeneration.22,23 The unique characteristics and excellent biological properties of nanographene make it a powerful choice for the composite preparation of medical bone repair materials.24–27 G has been widely incorporated into polymers to form nanocomposites for various structural and functional applications.28–30 Although surface-modified G-PEEK has been studied to enhance its biocompatibility,30–32 based on the literature, no work has been conducted to investigate the tissue regeneration properties of melt-processed bulk-reinforced G-PEEK composites.
In this study, G-PEEK nanocomposites were prepared using an injection molding process. The effect of G loading on composite properties was investigated through a wide range of characterization techniques. The biocompatibility, osteogenic differentiation potential and tissue regeneration ability of the composites were evaluated in vitro and in vivo, and we found that in addition to having ideal mechanical properties, G-PEEK could significantly enhance the biocompatibility and promote the osteogenic differentiation of rBMSCs. We believe that G-PEEK implants provide a promising strategy for enhancing the performance of future regenerative bone implants.
Materials and Methods
Characterization of PEEK and G-PEEK
The surface details of the different morphologies of all coupons were tested using scanning electron microscopy (SEM, FEI Inspect F50, USA). The surface roughness and nanoscale surfaces were analyzed by atomic force microscopy (AFM, SPM-9600, Japan). Each sample was measured at six random areas, and the average roughness value was recorded. X-ray diffraction (XRD, DX-2500, China) was used to confirm the surface crystallinity of all samples. Thermogravimetric analysis (TGA) was performed with a thermal analysis system (TG 209 F1, Germany). The process was conducted in the temperature range of 25–1500 °C under a N2 atmosphere with a constant heating rate of 20 °C/min. The water contact angle (CA) was used to assess the wettability of the surface of the samples. The mechanical properties of all coupons were tested using a universal mechanical testing machine (MTS, Exceed E45, China) following established methods. The speed was set to 4 mm/min for compressive and flexural tests.
In vitro Examination of Cytotoxicity
Live and dead cell double staining was used to investigate cell survival in each group. rBMSCs were cultured on the surface of tested samples in a 24-well plate. On Days 1, 3, 5, and 7, the cells were rinsed with phosphate-buffered saline (PBS). A fluorescein diacetate (FDA, Sigma, USA) and propidium iodide (PI, Solarbio, China) mixture (5 μg/mL of each dye) was used to double-dye under dark conditions at 37 °C for 30 min followed by washing in PBS three times to remove excess dye. The samples were kept moist, and the cell condition was observed and imaged under the green and red channels using a laser confocal microscope (TCS SP8, Leica, USA).
Cell Adhesion and Proliferation Analysis Using rBMSCs
Rhodamine phalloidin (Solarbio, China) was used to stain microfilaments. rBMSCs were incubated at 37 °C and 5% CO2 for 2 h and then rinsed with PBS followed by fixation in 4% paraformaldehyde for 15 min. After rinsing with PBS three times, the cells were dyed with rhodamine phalloidin for 30 min and 4’,6-diamidino-2-phenylindole (DAPI) for 3 min. The samples were kept moist, and the cell conditions were observed and imaged under the red and blue channels using a laser confocal microscope.
After rBMSCs were cultured on the surface of the samples (10 mm × 10 mm × 1 mm) for 1, 3, 5 and 7 d, cell proliferation was tested using CCK-8 (APE x BIO, USA). For each group (n=3), 2×10⁴ viable cells were seeded per sample, with α-minimal essential medium (α-MEM) as the blank control. At each predetermined time interval, samples were rinsed 3 times with PBS to remove unattached cells and transferred to new 24-well plates containing 500 μL of 10% CCK-8 solution (APE x BIO, USA) per well. The plates were incubated in the dark at 37 °C for 1 h, and 100 μL of each solution was transferred into 96-well plates in triplicate and read at 450 nm using a microplate reader (Multiskan FC, Thermo Scientific, USA).
Quantitative Real-Time PCR
qRT‒PCR was used to quantify the mRNA expression of adhesion-related and osteogenic differentiation-related genes in the cells of each group. After culture for 2 or 6 h, total RNA was extracted from the cells according to the manufacturer’s protocol (Takara, USA). Nanodrop plates (Tecan Infinite M200, USA) were used to measure the concentration and purity of RNA. The RNA content in each group was adjusted to 1 μg, and reverse transcription was performed using the PrimeScript RT Reagent Kit (Bio-Rad, USA). qRT‒PCR was performed with a CFX96 fluorescence quantitative PCR machine (Bio-Rad, USA), and the key adhesion-related genes integrin β1, vinculin, intercellular cell adhesion molecule-1 (ICAM-1), and vascular cell adhesion molecule-1 (VCAM-1) were assessed. β-actin was used as the reference gene to standardize the expression levels of other genes. The standard ΔΔCt (threshold cycle) method was used to analyze the experimental data. To detect osteogenic differentiation, the cells were cultured for 5 d following the method outlined above. qRT‒PCR was completed using a SYBR premix EX Taq PCR kit (Takara, Japan) to evaluate the mRNA levels of alkaline phosphatase (ALP), run-related transcription Factor 2 (Runx2), and osteopontin (OPN). The mRNA levels were normalized to the housekeeping gene glyceraldehyde-3-phosphate dehydrogenase (GAPDH).
In vivo Evaluation by Micro-CT and Histological Analysis
Male New Zealand rabbits (2–3 months old, 2.5 kg ± 0.3 kg) were obtained from Chengdu Dossy Experimental Animals Corporation. All animals were acclimated under standard laboratory conditions and had free access to standard water and food. All procedures were conducted in accordance with the Guide for the Care and Use of Laboratory Animals (8th edition, NIH Publications) and were approved by the Animal Ethics Committee of the State Key Laboratory of Oral Diseases and West China School of Stomatology, Sichuan University (approval number: WCHSIRB-D-2017-278).
The rabbits were randomly divided into 4 groups (6 per group) for bone defect model preparation surgery after anesthesia (Zoletil-50, France). The implants (PEEK and 0.1%, 1%, 5% G-PEEK) were embedded into a square defect of 4×1×3 mm created in the medial and lateral malleolus. The rabbits were randomly euthanized at 4 weeks or 12 weeks postoperation. Samples were collected from the molding area.
The femoral bone samples collected at 4 weeks or 12 weeks postoperation were analyzed by micro-CT (Scanco Medical Detachment -CT 50, Switzerland). After 3D reconstruction using the color distribution of trabecular thickness, bone volume ratios (BV/TV) were measured. The femoral bones from each group (n=3) were fixed in 4% paraformaldehyde and dehydrated. After embedding, tissue samples were sectioned (EXAKT, Germany) into 50–100 μm thick slices. The newly formed bone was stained with methylene blue and acid magenta.
Statistical Analysis
Reported data are presented as the mean ± standard deviation. The statistical significance of the collected data was analyzed using a one-way ANOVA and multiple comparisons test. A p < 0.05 was considered statistically significant.
Results
Material Characterization
The surface morphology of G-PEEK samples is presented in Figure 1A. Compared with the control group (pure PEEK), the surfaces of the G-PEEK samples showed a relatively coarse structure with uniform shallow pits. The more detailed coating microstructure was revealed by AFM (Figure 1B), and all G-PEEK showed a peak-like structure on the nanoscale. The quantitative results of roughness showed that the values of the vertical range (Rz) of 5% G-PEEK and 1% G-PEEK were statistically significantly higher than that of PEEK, and 5% G-PEEK had the roughest surface. There was no significant difference between the 0.1% roughness and control groups (Table 1).
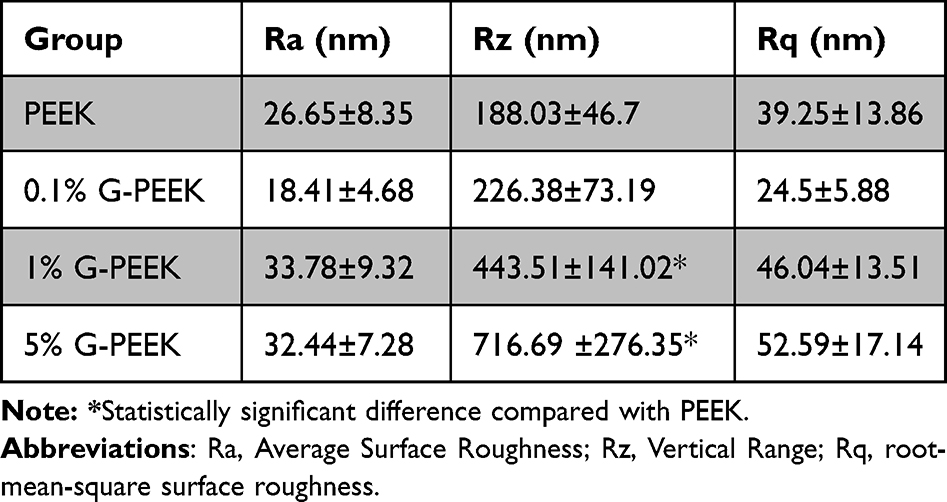 |
Table 1 Quantitative Analysis of Surface Roughness by AFM (Mean ± SD) |
 |
Figure 1 The characterization of PEEK and G-PEEK. (A) SEM images of samples. (B) AFM images of samples. (C) XRD of PEEK and G-PEEK. (D) TGA and DTG of G and G-PEEK. (E) The water contact angle of PEEK and G-PEEK. |
Figure 1C shows the XRD patterns of all samples. Compared with pure PEEK, new diffraction peaks were not identified for surfaces with G-PEEK. G exhibited typical (002) peaks at 26.5°. As the concentration of G changed, the typical peak for G disappeared in all G-PEEK composites. Additionally, a perceivable shift of the characteristic peak of PEEK toward higher 2θ was detected for all G-PEEK samples.
The thermal stability of the samples was investigated using TGA, and their decomposition curves are shown in Figure 1D. The results showed that the weight loss of PEEK was 49.16%, whereas the weight loss of G-PEEK (0.1%, 1%, and 5%) was 48.95%, 48.44% and 46.78% lower, respectively, than that of PEEK. The degradation temperatures of the maximum rate of weight loss for G-PEEK at 0, 1, 3, and 5% G were 605°C, 604°C, and 609°C, respectively, as observed from the differential thermogravimetric analysis (DTG) curves. Pure PEEK exhibited the maximum rate of weight loss at 604°C, which was not significantly different from that of G-PEEK.
The water contact angle (CA) was used to investigate the hydrophilicity of the surface of the samples (Figure 1E). The CA values of PEEK and G-PEEK (0.1%, 1%, and 5%) were 73.49°, 70.91°, 68.43°, and 62.25°, respectively (p < 0.05). The variation in CA values on different surfaces may result from differences in surface structure and chemistry. The lower CA value of the G-PEEK surface indicates special wettability, which may facilitate protein adhesion.
For compressive testing, the compressive modulus of all samples was in the range of 2271–2516 MPa (Figure 2A), which is similar to that of natural cancellous bone (1500–2500 MPa).33,34 The flexural modulus of 0.1% G-PEEK was similar to that of pure PEEK. Further addition of G (1%) led to an approximately 12% increase in the flexural modulus of the composites, which gradually decreased as the G concentration increased to 5% (Figure 2B). This result could occur if the increased G concentration lead to filler agglomeration, which could serve as stress concentration sites and compromise the structural integrity of the composites.35,36
 |
Figure 2 Mechanical properties testing of PEEK and G-PEEK. (A) The modulus from compressive testing. (B) The modulus from flexural testing. The statistical significance of reported data is represented as * (p < 0.05), ns (P>0.05). |
Cytotoxicity Test
Live/dead cell staining is an intuitive way to observe whether material is toxic to the cells growing on it. The viability of rBMSCs on PEEK and 0.1%, 1%, and 5% G-PEEK for 1, 3, and 5 d was characterized, and the results are shown in Figure 3. At each time point, most cells showed excellent activity, and no dead cells were observed in any group, which indicates that the biocompatibility of the material was not altered after graphene was applied.
 |
Figure 3 Fluorescent micrographs of rBMSCs cells cultured for 1, 3 and 5 d on samples. Living cells (green) and dead cells (red) are shown. All scale bar lengths are 250μm. |
Cell Adhesion and Proliferation
The cell morphology results of rBMSCs incubated on PEEK and G-PEEK for 2 h are shown in Figure 4A. Cells on PEEK exhibited incomplete extension of cell protrusions, and the aggregation of actin filaments was observed on the periphery of spherical cells. In the G-PEEK groups, cells showed a better spreading state, bundles of F-actin fibers appeared in the attached cells, and the flat cells presented a typical polygon shape. The results were consistent with the quantitative analysis of the area of F-actin expression. The cell spreading state was proportionate to the content of nanographene in the composite materials. These results indicate that G-PEEK could significantly promote cell adhesion and spreading.
 |
Figure 4 Cell morphology and proliferation assays. (A) Fluorescent micrographs of rBMSCs after 2 h. Actin cytoskeleton (red) and nucleus (blue) are shown. The scale bars are 100μm; in the zoomed view, scale bars are 20μm. (B) The proliferation rate of rBMSCs at 1–7 d. The statistical significance of reported data is represented as ** (p < 0.01), ns (P>0.05). |
The CCK-8 assay results showed that the cell viability of the pure PEEK and all G-PEEK groups increased daily, indicating that all groups had good biocompatibility (Figure 4B). There was no significant difference in cell viability among groups (p > 0.05). In addition, the OD values of all G-PEEK groups did not differ significantly at any time interval, suggesting that the ability of G modification to accelerate cell proliferation was limited.
qRT‒PCR Test
Integrin β1 and vinculin are important cell adhesion molecules that mediate cell adhesion to the substrate, and ICAM-1 and VCAM-1 are significant for intercellular adhesion. The mRNA expression levels of vinculin, integrin β1, ICAM-1, and VCAM-1 were measured using qRT‒PCR after 2- or 6-h incubations. At both time points, the results revealed elevated mRNA expressions of vinculin, integrin β1, ICAM-1, and VCAM-1 (Figure 5A and B), and 1% and 5% G-PEEK significantly increased expressions compared with those of the control group, indicating that G-PEEK can promote cell adhesion, and that cell adhesion is positively correlated with G concentration.
 |
Figure 5 The adhesion and osteogenic differentiation of BMSCs. (A) The qRT‒PCR analysis for integrin β1, vinculin, ICAM-1, and VCAM-1 expressions by rBMSCs cultured on PEEK samples for 2 h. (B) The qRT‒PCR analysis for integrin β1, vinculin, ICAM-1, and VCAM-1 expression by rBMSCs cultured on PEEK samples for 6 h. (C) The qRT‒PCR analysis for ALP, Runx2 and OPN expressions by rBMSCs cultured on PEEK samples for 5 d. Statistical significance of reported data is represented as * (p < 0.05), ** (p < 0.01), and *** (p < 0.001), ****(P <0.0001). |
The mRNA expression levels of ALP, Runx2 and OPN in rBMSCs cultured on different sample surfaces were also evaluated (Figure 5C). Compared with the control group, the expression levels of ALP, Runx2 and OPN in G-PEEK samples were significantly upregulated (except for 0.1% G-PEEK). The strongest osteogenic enhancements reflected by Runx2 (the early marker in osteoblastic differentiation) and OPN (the late marker in osteoblastic differentiation) were found in the 5% G-PEEK group.37,38
Micro-CT Evaluation
As shown in the 3D reconstruction images, the materials were stable in bone, and the new bone was reconstructed at a specific density (Figure 6A). After 4 weeks, the surface of the G-PEEK groups was partially covered by new bone, whereas there was obviously less new bone on the surface of PEEK. The bone volume analysis demonstrated better bone-healing effects in the G-PEEK groups (Figure 6B).
 |
Figure 6 Micro-CT rendered images and data on bone formation. (A) Micro-CT 3D reconstruction image showed the volume and trabecular thickness of the region of interest. The color gradient indicates trabecular bone density with the red color representing dense bone. (B) Qualitative analysis of BV/TV. The statistical significance of reported data is represented as * (p < 0.05), ** (p < 0.01). |
Three-dimensional reconstruction after 12 weeks showed that significant bone growth appeared in all groups. At this stage, the osteogenic performances of the 0.1% and 1% G-PEEK groups were not significantly different from that of the control group, whereas the 5% G-PEEK group showed a significantly superior osseointegration effect.
Histological Analysis
The histological results of undecalcified sections and the quantification of bone-implant contact areas were consistent with the micro-CT results. All G-PEEK groups had more bone coverage than that of the control group at both time points. At 4 weeks, loosely arranged trabeculae were first formed around the G-PEEK implants. The bone coverage on the implant-bone interface was still incomplete. At 12 weeks, the surrounding bone tissues of the G-PEEK implants were modified, and the bone contact rate was significantly increased compared with that at 4 weeks, as shown in Figure 7A.
 |
Figure 7 Histological staining and quantitative analysis of bone regeneration at the bone-implant interface. (A) Representative histological images of implants. (B) Qualitative analysis of bone-implant contact ratio. The statistical significance of reported data is represented as ** (p < 0.01) and *** (p < 0.001). |
At both time points, the 5% G-PEEK implant surface showed the most prominent bone coverage, and the greater amount of newly formed bone demonstrated that the 5% G-PEEK implants had the best bone remodeling performance (Figure 7B). The bone implant contact ratios (BICRs) of all G-PEEK groups were higher than that of the PEEK group, particularly the 1% and 5% G-PEEK groups. After 12 weeks of new bone accumulation around the implants, the BICRs of the G-PEEK groups remained higher than that of the PEEK group, whereas there was no significant difference among the G-PEEK groups.
Discussion
The surface structure and chemistry of an implant can influence the biological behavior of cells, which is the biological basis for a role in bone repair.39–41 It has been found that surface roughness is conducive to cell adhesion, which further promotes cell aggregation.42 The SEM and AFM images showed that PEEK doped with G had shallow pit-like patterns. Quantitative analysis also confirmed that G-PEEK had good roughness, in contrast with pure PEEK. The 5% G-PEEK group showed the highest value of Rz. XRD revealed the crystallinity of the G-PEEK composites. Compared with PEEK peaks, all samples of G-PEEK were shifted toward higher 2θ, indicating a change in the crystallinity of G-PEEK. The addition of G slightly increased the thermal stability of G-PEEK. This is consistent with the peak shift toward higher 2θ in the XRD analysis, signifying a strong nucleation effect of the graphene nanoplatelets with elevating temperature. Surface wettability is affected by the roughness of the material surface and may be beneficial to protein adsorption and cell adhesion.43,44 The CA results revealed that the hydrophilicity of PEEK was improved by the addition of G, which is consistent with the AFM analysis results. The results of the mechanical experiments showed that the addition of G does not significantly affect the mechanical properties of PEEK. G-PEEK has a compression modulus close to that of natural bone, which indicates that as an implant, G-PEEK can effectively avoid stress concentrations at the contact surface.
As the first step in the interaction between cells and materials, cell adhesion is the foundation for cell anchoring and the premise for cell spreading and proliferation on the surface of materials.45,46 In this study, in the initial cell adhesion and spreading stage, all G-PEEK groups showed better adhesion based on fluorescence staining. Adhesion-related and osteogenic differentiation-related genes were significantly upregulated in all G-PEEK groups compared with those in the control group. However, the expression of intercellular adhesion molecules was upregulated only in the higher graphene concentration groups (1% and 5%). This consequence is consistent with previous research results, illustrating that nanographene can eliminate hydrophobicity and promote cell adhesion.47,48 This mechanism may contribute to the strong noncovalent bonding ability of graphene and the microtopography of the composite surface. Some studies have indicated that graphene has a strong noncovalent binding ability. Due to the strong pi-pi stacking interactions between the aromatic rings of proteins and graphene sp2 carbons, proteins aggregate on their surface.49,50 The cell adhesion reaction could be initiated by adhesion-related proteins absorbed by graphene. Moreover, the protein adsorbed to the material can change the material surface energy and thus prompt cell adhesion.51,52
The morphology-induced collective behavior of cells has attracted wide attention in recent years.53,54 Substrate morphology significantly influences cell adhesion to the substrate and intercellular interactions, thereby regulating cell adhesion and arrangement behaviors.55 First, nanographene is intrinsically nonflat and has nanoscale ripples and folds on the surface. The particular surface morphology of nanographene may be responsible for the adhesion of cells. Second, the incorporation of graphene in the composite material leads to the random distribution of graphene on the material surface, which may lead to anisotropic mechanical distribution.56,57 The random microstructure formed by the structural characteristics of graphene and its arrangement in the matrix may be more evident in the higher graphene concentration PEEK groups (ie, 1% and 5% G-PEEK). Therefore, protein adsorption capacity and topographic factors may synergistically promote cell adhesion and intercellular connection.
The cell-substrate interaction can drive osteogenic differentiation of rBMSCs.58 In this study, the blending of graphene with PEEK significantly improved the osteogenic effect of the material in vitro and in vivo. In random microtopography, the osteogenic differentiation of stem cells was improved. The random microstructure formed by the structural characteristics of graphene and its arrangement in the matrix may accelerate the osteogenic ability of cells and improve the osteogenic effects of the materials.59 Another possibility is that graphene can adsorb specific proteins in the osteogenic microenvironment to accelerate osteogenesis. Lee et al revealed the underlying mechanism of improved mesenchymal stem cell differentiation on nanographene substrates. They suggested that the strong noncovalent binding ability of nanographene may serve as a preconcentration area for osteogenic media, which accelerates cell osteogenic differentiation.22
Notably, both the histological analysis and micro-CT evaluation showed that the higher graphene concentration samples (1% and 5%) had a particularly significant promoting effect on osteogenesis during the early osteogenesis stage, which corresponded to the results of cell adhesion. Liu et al indicated that genes associated with cell adhesion, osteogenic pathways, and mineralization were successively upregulated in the osteogenic lineage differentiation of stem cells. The above pathways intersect and influence biomaterial-induced cell biological behavior such as proliferation, adhesion, and differentiation.60 Thus, the early cell adhesion advantage might drive osteogenic lineage differentiation.
Conclusions
Compared with pure PEEK, the composite materials with graphene did not affect cell viability and significantly improved cell adhesion and biocompatibility. The effect of graphene on osteogenesis has been well demonstrated in vivo. These promising results show the strong potential of G-PEEK in future bone implant applications. In conclusion, nanographene can be used as a filler of PEEK to achieve excellent osteogenic enhancement, providing an economical and effective alternative for PEEK biological modification.
Data Sharing Statement
The raw data used and/or analyzed during the current study are available from the corresponding author on reasonable request.
Ethics Approval and Consent to Participate
All the animals were acclimated under standard laboratory conditions and had free access to standard water and food. All procedures were conducted in accordance with the Guide for the Care and Use of Laboratory Animals (8th edition, NIH Publications), and were approved by the Animal Ethics Committee of the State Key Laboratory of Oral Diseases and West China School of Stomatology, Sichuan University (approval number: WCHSIRB-D-2017-278).
Acknowledgments
This work was supported by the National Natural Science Foundation of China (No. 81901026) and the Department of Science and Technology of Sichuan Province (No. 2021YFH0139).
Disclosure
The authors report no conflicts of interest in this work.
References
1. Wei W, Dai H. Articular cartilage and osteochondral tissue engineering techniques: recent advances and challenges. Bioact Mater. 2021;6(12):4830–4855. doi:10.1016/j.bioactmat.2021.05.011
2. Xu L, Gao S, Zhou R, Zhou F, Qiao Y, Qiu D. Bioactive Pore-Forming Bone Adhesives Facilitating Cell Ingrowth for Fracture Healing. Adv Mater. 2020;32(10):e1907491. doi:10.1002/adma.201907491
3. Zhao D, Zhu T, Li J, et al. Poly(lactic-co-glycolic acid)-based composite bone-substitute materials. Bioact Mater. 2021;6(2):346–360. doi:10.1016/j.bioactmat.2020.08.016
4. Guglielmotti MB, Olmedo DG, Cabrini RL. Research on implants and osseointegration. Periodontol. 2019;79(1):178–189. doi:10.1111/prd.12254
5. Kong W, Cox SC, Lu Y, et al. Microstructural Evolution, Mechanical Properties, and Preosteoblast Cell Response of a Post-Processing-Treated TNT5Zr beta Ti Alloy Manufactured via Selective Laser Melting. ACS Biomater Sci Eng. 2022;8(6):2336–2348. doi:10.1021/acsbiomaterials.1c01277
6. Soro N, Attar H, Brodie E, Veidt M, Molotnikov A, Dargusch MS. Evaluation of the mechanical compatibility of additively manufactured porous Ti-25Ta alloy for load-bearing implant applications. J Mech Behav Biomed Mater. 2019;97:149–158. doi:10.1016/j.jmbbm.2019.05.019
7. Chouirfa H, Bouloussa H, Migonney V, Falentin-Daudre C. Review of titanium surface modification techniques and coatings for antibacterial applications. Acta Biomater. 2019;83:37–54. doi:10.1016/j.actbio.2018.10.036
8. Ma L, Wang X, Zhao N, et al. Integrating 3D Printing and Biomimetic Mineralization for Personalized Enhanced Osteogenesis, Angiogenesis, and Osteointegration. ACS Appl Mater Interfaces. 2018;10(49):42146–42154. doi:10.1021/acsami.8b17495
9. Pacheco KA. Allergy to Surgical Implants. Clin Rev Allergy Immunol. 2019;56(1):72–85. doi:10.1007/s12016-018-8707-y
10. Su Z, Liu D, Chen L, et al. CD44-Targeted Magnetic Nanoparticles Kill Head And Neck Squamous Cell Carcinoma Stem Cells In An Alternating Magnetic Field. Int J Nanomedicine. 2019;14:7549–7560. doi:10.2147/IJN.S215087
11. Kurtz SM, Devine JN. PEEK biomaterials in trauma, orthopedic, and spinal implants. Biomaterials. 2007;28(32):4845–4869. doi:10.1016/j.biomaterials.2007.07.013
12. Wang H, Fu X, Shi J, et al. Nutrient Element Decorated Polyetheretherketone Implants Steer Mitochondrial Dynamics for Boosted Diabetic Osseointegration. Adv Sci. 2021;8(20):e2101778. doi:10.1002/advs.202101778
13. Delaney LJ, MacDonald D, Leung J, et al. Ultrasound-triggered antibiotic release from PEEK clips to prevent spinal fusion infection: initial evaluations. Acta Biomater. 2019;93:12–24. doi:10.1016/j.actbio.2019.02.041
14. Panayotov IV, Orti V, Cuisinier F, Yachouh J. Polyetheretherketone (PEEK) for medical applications. J Mater Sci Mater Med. 2016;27(7):118. doi:10.1007/s10856-016-5731-4
15. Zhang S, Feng Z, Hu Y, et al. Endowing Polyetheretherketone Implants with Osseointegration Properties: in Situ Construction of Patterned Nanorod Arrays. Small. 2022;18(5):e2105589. doi:10.1002/smll.202105589
16. Wan T, Jiao Z, Guo M, et al. Gaseous sulfur trioxide induced controllable sulfonation promoting biomineralization and osseointegration of polyetheretherketone implants. Bioact Mater. 2020;5(4):1004–1017. doi:10.1016/j.bioactmat.2020.06.011
17. He M, Huang Y, Xu H, et al. Modification of polyetheretherketone implants: from enhancing bone integration to enabling multi-modal therapeutics. Acta Biomater. 2021;129:18–32. doi:10.1016/j.actbio.2021.05.009
18. Geim AK. Graphene: status and prospects. Science. 2009;324(5934):1530–1534. doi:10.1126/science.1158877
19. Sattari S, Adeli M, Beyranvand S, Nemati M. Functionalized Graphene Platforms for Anticancer Drug Delivery. Int J Nanomedicine. 2021;16:5955–5980. doi:10.2147/IJN.S249712
20. Lu B, Jin X, Han Q, Qu L. Planar Graphene-Based Microsupercapacitors. Small. 2021;17(48):e2006827. doi:10.1002/smll.202006827
21. Wang XY, Yao X, Narita A, Mullen K. Heteroatom-Doped Nanographenes with Structural Precision. Acc Chem Res. 2019;52(9):2491–2505. doi:10.1021/acs.accounts.9b00322
22. Lee WC, Lim CH, Shi H, et al. Origin of enhanced stem cell growth and differentiation on graphene and graphene oxide. ACS Nano. 2011;5(9):7334–7341. doi:10.1021/nn202190c
23. Sagomonyants KB, Jarman-Smith ML, Devine JN, Aronow MS, Gronowicz GA. The in vitro response of human osteoblasts to polyetheretherketone (PEEK) substrates compared to commercially pure titanium. Biomaterials. 2008;29(11):1563–1572. doi:10.1016/j.biomaterials.2007.12.001
24. Zheng Y, Hong X, Wang J, et al. 2D Nanomaterials for Tissue Engineering and Regenerative Nanomedicines: recent Advances and Future Challenges. Adv Healthc Mater. 2021;10(7):e2001743. doi:10.1002/adhm.202001743
25. Guo B, Feng X, Wang Y, Wang X, He Y. Biomimetic and immunomodulatory baicalin-loaded graphene oxide-demineralized bone matrix scaffold for in vivo bone regeneration. J Mater Chem B. 2021;9(47):9720–9733. doi:10.1039/d1tb00618e
26. Dantas PCL, Martins-Junior PA, Coutinho DCO, et al. Nanohybrid composed of graphene oxide functionalized with sodium hyaluronate accelerates bone healing in the tibia of rats. Mater Sci Eng C Mater Biol Appl. 2021;123:111961. doi:10.1016/j.msec.2021.111961
27. Xue W, Du J, Li Q, et al. Preparation, Properties, and Application of Graphene-Based Materials in Tissue Engineering Scaffolds. Tissue Eng Part B Rev. 2022;28(5):1121–1136. doi:10.1089/ten.TEB.2021.0127
28. He M, Zhu C, Xu H, et al. Conducting Polyetheretherketone Nanocomposites with an Electrophoretically Deposited Bioactive Coating for Bone Tissue Regeneration and Multimodal Therapeutic Applications. ACS Appl Mater Interfaces. 2020;12(51):56924–56934. doi:10.1021/acsami.0c20145
29. Huang Z, Wan Y, Zhu X, et al. Simultaneous engineering of nanofillers and patterned surface macropores of graphene/hydroxyapatite/polyetheretherketone ternary composites for potential bone implants. Mater Sci Eng C Mater Biol Appl. 2021;123:111967. doi:10.1016/j.msec.2021.111967
30. Ouyang L, Deng Y, Yang L, et al. Graphene-Oxide-Decorated Microporous Polyetheretherketone with Superior Antibacterial Capability and In Vitro Osteogenesis for Orthopedic Implant. Macromol Biosci. 2018;18(6):e1800036. doi:10.1002/mabi.201800036
31. Addai Asante N, Wang Y, Bakhet S, et al. Ambient temperature sulfonated carbon fiber reinforced PEEK with hydroxyapatite and reduced graphene oxide hydroxyapatite composite coating. J Biomed Mater Res B Appl Biomater. 2021;109(12):2174–2183. doi:10.1002/jbm.b.34865
32. Yan JH, Wang CH, Li KW, et al. Enhancement of surface bioactivity on carbon fiber-reinforced polyether ether ketone via graphene modification. Int J Nanomedicine. 2018;13:3425–3440. doi:10.2147/IJN.S160030
33. Blondel M, Abidine Y, Assemat P, Palierne S, Swider P. Identification of effective elastic modulus using modal analysis; application to canine cancellous bone. J Biomech. 2020;110:109972. doi:10.1016/j.jbiomech.2020.109972
34. Fiume E, Tulyaganov D, Ubertalli G, Verne E, Baino F. Dolomite-Foamed Bioactive Silicate Scaffolds for Bone Tissue Repair. Materials. 2020;13(3):628. doi:10.3390/ma13030628
35. Santiago E, Poudyal SS, Shin SY, Yoon HJ. Graphene Oxide Functionalized Biosensor for Detection of Stress-Related Biomarkers. Sensors. 2022;22(2):558. doi:10.3390/s22020558
36. Yaragalla S, Zahid M, Panda JK, Tsagarakis N, Cingolani R, Athanassiou A. Comprehensive Enhancement in Thermomechanical Performance of Melt-Extruded PEEK Filaments by Graphene Incorporation. Polymers. 2021;13(9):1425. doi:10.3390/polym13091425
37. Deshpande R, Shukla S, Sayyad R, Salunke S, Nisal A, Venugopalan P. Silk fibroin and ceramic scaffolds: comparative in vitro studies for bone regeneration. Bioeng Transl Med. 2021;6(3):e10221. doi:10.1002/btm2.10221
38. Jeon S, Lee JH, Jang HJ, et al. Spontaneously promoted osteogenic differentiation of MC3T3-E1 preosteoblasts on ultrathin layers of black phosphorus. Mater Sci Eng C Mater Biol Appl. 2021;128:112309. doi:10.1016/j.msec.2021.112309
39. Kumar S, Nehra M, Kedia D, Dilbaghi N, Tankeshwar K, Kim KH. Nanotechnology-based biomaterials for orthopaedic applications: recent advances and future prospects. Mater Sci Eng C Mater Biol Appl. 2020;106:110154. doi:10.1016/j.msec.2019.110154
40. Chen Q, Zhang D, Gu J, et al. The impact of antifouling layers in fabricating bioactive surfaces. Acta Biomater. 2021;126:45–62. doi:10.1016/j.actbio.2021.03.022
41. Hou Y, Yu L, Xie W, et al. Surface Roughness and Substrate Stiffness Synergize To Drive Cellular Mechanoresponse. Nano Lett. 2020;20(1):748–757. doi:10.1021/acs.nanolett.9b04761
42. Khanmohammadi chenab K, Sohrabi B, Rahmanzadeh A. Superhydrophobicity: advanced biological and biomedical applications. Biomater Sci. 2019;7(8):3110–3137. doi:10.1039/c9bm00558g
43. Fan H, Guo Z. Bioinspired surfaces with wettability: biomolecule adhesion behaviors. Biomater Sci. 2020;8(6):1502–1535. doi:10.1039/c9bm01729a
44. Nakamura M, Hori N, Ando H, et al. Surface free energy predominates in cell adhesion to hydroxyapatite through wettability. Mater Sci Eng C Mater Biol Appl. 2016;62:283–292. doi:10.1016/j.msec.2016.01.037
45. Grolman JM, Weinand P, Mooney DJ. Extracellular matrix plasticity as a driver of cell spreading. Proc Natl Acad Sci U S A. 2020;117(42):25999–26007. doi:10.1073/pnas.2008801117
46. Nishida K, Anada T, Kobayashi S, Ueda T, Tanaka M. Effect of bound water content on cell adhesion strength to water-insoluble polymers. Acta Biomater. 2021;134:313–324. doi:10.1016/j.actbio.2021.07.058
47. Zahid M, Rashid A, Akram S, et al. Fabrication and Characterization of Sulfonated Graphene Oxide-Doped Polymeric Membranes with Improved Anti-Biofouling Behavior. Membranes. 2021;11(8). doi:10.3390/membranes11080563
48. Wang W, Chen JX, Hou Y, Bartolo P, Chiang WH. Investigations of Graphene and Nitrogen-Doped Graphene Enhanced Polycaprolactone 3D Scaffolds for Bone Tissue Engineering. Nanomaterials. 2021;11(4). doi:10.3390/nano11040929
49. Mann JA, Rodriguez-Lopez J, Abruna HD, Dichtel WR. Multivalent binding motifs for the noncovalent functionalization of graphene. J Am Chem Soc. 2011;133(44):17614–17617. doi:10.1021/ja208239v
50. Xia J, Zhu Y, He Z, Wang F, Wu H. Superstrong Noncovalent Interface between Melamine and Graphene Oxide. ACS Appl Mater Interfaces. 2019;11(18):17068–17078. doi:10.1021/acsami.9b02971
51. Donor MT, Mroz AM, Prell JS. Experimental and theoretical investigation of overall energy deposition in surface-induced unfolding of protein ions. Chem Sci. 2019;10(14):4097–4106. doi:10.1039/c9sc00644c
52. Snyder DT, Jones BJ, Lin YF, et al. Surface-induced dissociation of protein complexes on a cyclic ion mobility spectrometer. Analyst. 2021;146(22):6861–6873. doi:10.1039/d1an01407b
53. Wang Y, Yang Y, Wang X, Kawazoe N, Yang Y, Chen G. The varied influences of cell adhesion and spreading on gene transfection of mesenchymal stem cells on a micropatterned substrate. Acta Biomater. 2021;125:100–111. doi:10.1016/j.actbio.2021.01.042
54. Choi D, Gonzalez Z, Ho SY, Bermudez A, Lin NYC. Cell-cell adhesion impacts epithelia response to substrate stiffness: morphology and gene expression. Biophys J. 2022;121(2):336–346. doi:10.1016/j.bpj.2021.11.2887
55. Ibrahim AMH, Takacova M, Jelenska L, et al. The effect of surface modification of TiMg composite on the in-vitro degradation response, cell survival, adhesion, and proliferation. Mater Sci Eng C Mater Biol Appl. 2021;127:112259. doi:10.1016/j.msec.2021.112259
56. Reinhart-King CA, Dembo M, Hammer DA. The dynamics and mechanics of endothelial cell spreading. Biophys J. 2005;89(1):676–689. doi:10.1529/biophysj.104.054320
57. Jones CA, Cibula M, Feng J, et al. Micromechanics of cellularized biopolymer networks. Proc Natl Acad Sci U S A. 2015;112(37):E5117–22. doi:10.1073/pnas.1509663112
58. Song Y, Long J, Dunkers JP, et al. Micromechanical Compatibility between Cells and Scaffolds Directs the Phenotypic Transition of Stem Cells. ACS Appl Mater Interfaces. 2021;13(48):58152–58161. doi:10.1021/acsami.1c17504
59. Qiu J, Geng H, Wang D, et al. Layer-Number Dependent Antibacterial and Osteogenic Behaviors of Graphene Oxide Electrophoretic Deposited on Titanium. ACS Appl Mater Interfaces. 2017;9(14):12253–12263. doi:10.1021/acsami.7b00314
60. Liu W, Wei Y, Zhang X, Xu M, Yang X, Deng X. Lower extent but similar rhythm of osteogenic behavior in hBMSCs cultured on nanofibrous scaffolds versus induced with osteogenic supplement. ACS Nano. 2013;7(8):6928–6938. doi:10.1021/nn402118s
 © 2022 The Author(s). This work is published and licensed by Dove Medical Press Limited. The
full terms of this license are available at https://www.dovepress.com/terms
and incorporate the Creative Commons Attribution
- Non Commercial (unported, 3.0) License.
By accessing the work you hereby accept the Terms. Non-commercial uses of the work are permitted
without any further permission from Dove Medical Press Limited, provided the work is properly
attributed. For permission for commercial use of this work, please see paragraphs 4.2 and 5 of our Terms.
© 2022 The Author(s). This work is published and licensed by Dove Medical Press Limited. The
full terms of this license are available at https://www.dovepress.com/terms
and incorporate the Creative Commons Attribution
- Non Commercial (unported, 3.0) License.
By accessing the work you hereby accept the Terms. Non-commercial uses of the work are permitted
without any further permission from Dove Medical Press Limited, provided the work is properly
attributed. For permission for commercial use of this work, please see paragraphs 4.2 and 5 of our Terms.