Back to Journals » Journal of Inflammation Research » Volume 7
Seasonal changes in nasal cytology in mite-allergic patients
Authors Gelardi M, Peroni D, Incorvaia C ![]() , Quaranta N, De Luca C, Barberi S, Dell'Albani I, Landi M, Frati F, de Beaumont O
, Quaranta N, De Luca C, Barberi S, Dell'Albani I, Landi M, Frati F, de Beaumont O
Received 16 September 2013
Accepted for publication 15 November 2013
Published 28 March 2014 Volume 2014:7 Pages 39—44
DOI https://doi.org/10.2147/JIR.S54581
Checked for plagiarism Yes
Review by Single anonymous peer review
Peer reviewer comments 5
Matteo Gelardi,1 Diego G Peroni,2 Cristoforo Incorvaia,3 Nicola Quaranta,1 Concetta De Luca,1 Salvatore Barberi,4 Ilaria Dell'Albani,5 Massimo Landi,6 Franco Frati,5 Olivier de Beaumont7
1Otolaryngology Unit, Department of Neuroscience and Sensory Organs, University of Bari, Bari, Italy; 2Department of Pediatrics, University of Verona, Verona, Italy; 3Allergy/Pulmonary Rehabilitation, ICP Hospital, Milan, Italy; 4Department of Pediatrics, San Paolo Hospital, Milan, Italy; 5Medical and Scientific Department, Stallergenes, Milan, Italy; 6Department of Pediatrics, National Healthcare System, ASL TO1, Turin, Italy; 7Medical Affairs Department, Stallergenes, Antony, France
Background: House dust mites (HDMs) are a major cause of allergic rhinitis (AR) and asthma worldwide. Recent studies suggested that the allergen load presents seasonal modifications, giving rise to seasonal variation in nasal inflammation and symptoms. The aim of this study was to evaluate by nasal cytology whether nasal inflammation in mite-allergic patients changes with the seasons of the year.
Methods: The study included 16 patients (seven males and nine females, mean age 38.1 years) with persistent AR caused by monosensitization to HDMs. Nasal cytology was performed in all patients once monthly for 1 year.
Results: Nasal cytology showed that the cells most commonly detected in the nasal mucosa were neutrophils. During the period from October to April, a peak in the number of neutrophils and also the presence of significant numbers of eosinophils, mast cells, and lymphocytes/plasma cells were found, which shows the occurrence of more intense inflammation during these months.
Conclusion: Nasal cytology provides useful data in detecting nasal inflammation and its association with the clinical stage of AR. The seasonal variations in nasal cytology are likely to be induced by the fluctuations in the HDM allergen that have been uncovered in recent investigations.
Keywords: allergens, allergic rhinitis, house dust mite, nasal inflammation
Introduction
House dust mites (HDMs), and particularly the species Dermatophagoides pteronyssinus and Dermatophagoides farinae, are a major cause of allergic rhinitis (AR) and asthma worldwide.1,2 HDMs belong to the Aracnidae family, are ubiquitous under the altitude of 2,000 meters, and proliferate better in humid and warm environments, the most limiting factor for their growth being air humidity. In fact, larger mite populations are found when absolute indoor humidity is above 7 g/kg (45% relative humidity at 20°C).3 The allergen components of HDMs have been well characterized and cloned, the major allergens being Group 1 proteins (Der p 1 and Der f 1) and Group 2 proteins (Der p 2 and Der f 2).4 HDMs are generally considered as a perennial allergen source, but recent data suggest that their allergen load presents seasonal variations.5–8 In countries with a moderate climate, the optimum temperature and humidity for mite proliferation occurs in early autumn, with further fluctuations determined by the presence or absence of house heating, these fluctuations being more marked in the no-heating season.5 The changes in mite allergen concentration have an obvious influence on allergic symptoms in sensitized subjects, and also on the production of mite-specific immunoglobulin E (IgE) antibodies.8 A further approach to assess the variations in nasal inflammation caused by exposure to HDMs is nasal cytology, which was proposed as a nasal test in the 1970s9 and later showed the characteristics to be used in clinical practice10 and the capacity to provide very useful data in staging the severity of AR.11,12 This present study aimed to evaluate, by nasal cytology, whether nasal inflammation in mite-allergic patients changes with the seasons of the year.
Materials and methods
The study included 16 patients (seven males and nine females, mean age 38.1 years, standard deviation 8.7 years) with persistent AR caused by monosensitization to HDMs, as demonstrated by a positive skin-prick test and negative results to any other allergen. Based on the certainty of diagnosis, no other test, such as in-vitro tests or nasal provocation test, was performed. Patients must also have had a negative history for other nasal disorders. In addition, patients must have been untreated for AR from at least 7 days before nasal cytology to avoid influence of drugs on the rhinocytogram. Nasal cytology was performed in all patients once monthly for 1 year by anterior rhinoscopy with the technique previously described.11 The following steps characterize the cytological technique: sampling, processing (with fixing and staining), and observation through microscopy. The cytological sampling consists of collecting the nasal mucosa surface cells by the Rhino-probe (Arlington Scientific, Springville, UT, USA).12 The sampling step must be carefully performed through anterior rhinoscopy, using a nasal speculum and good lighting. When the sampling is obtained, the material is placed on a glass slide, fixed by air drying, and stained by the May-Grunwald-Giemsa method, which allows the detection of all the cellular components of the nasal mucosa, including those cells that are associated with the immune inflammation process (such as neutrophils, eosinophils, lymphocytes, and mast cells). The slide is then observed through a light microscope supplied with an object-glass, able to magnify up to 1,000×. For the rhinocytogram analysis, at least 50 microscopic fields have to be read in order to detect all the cells present in the sample.
According to clinical data, the nasal obstruction parameter was expressed by a quali-quantitative scale ranging from 0 (no obstruction) to 10 (complete obstruction). This parameter was evaluated along with the number of eosinophils recorded for each patient, by means of correlation analysis, in order to verify whether these two variables are associated and to determine the degree of association of the combined change. Two distinct correlation analyses were performed: per patient (the evaluation was carried out by correlating, for 12 months, the two variables [eosinophils and nasal obstruction], so as to have exactly 12 pairs of values for each patient); and per month (in this case, the evaluation was carried out by correlating, for the 16 patients, the two variables [eosinophils and nasal obstruction], so as to have exactly 16 pairs of values for each month).
No interventions, except clinical routine practice, were performed during this study. Since the study completely reflected real-life clinical practice, it was simply notified to the local ethics committee (University of Bari). Written informed consent was obtained by each participant.
Results
Nasal cytology showed that the cells most commonly detected in the nasal mucosa were neutrophils, which define the condition named as minimal persistent inflammation.13 During the period from October to April, a peak in the number of neutrophils and also the presence of significant numbers of eosinophils, mast cells, and lymphocytes/plasma cells were found, which show the occurrence in these months of more intense inflammation. Figure 1 shows the counts of the different cells. The range, the mean values, and the standard error were as follows: for neutrophils, from 27 cells per microscopic field in August to 200 cells in November, with a mean of 79.1±65.7 cells (standard error 18.96); for eosinophils, from four cells in July to 36 cells in March, with a mean of 9.2±7.9 cells (standard error 2.30); for mast cells, from 0 cells in July and August to 0.4 cells in April, October, and November, with a mean of 0.19±0.16 cells (standard error 0.05); for lymphocytes/plasma cells, from 0.2 cells in June–August to six cells in April, with a mean of 1.32±2.02 cells (standard error 0.58).
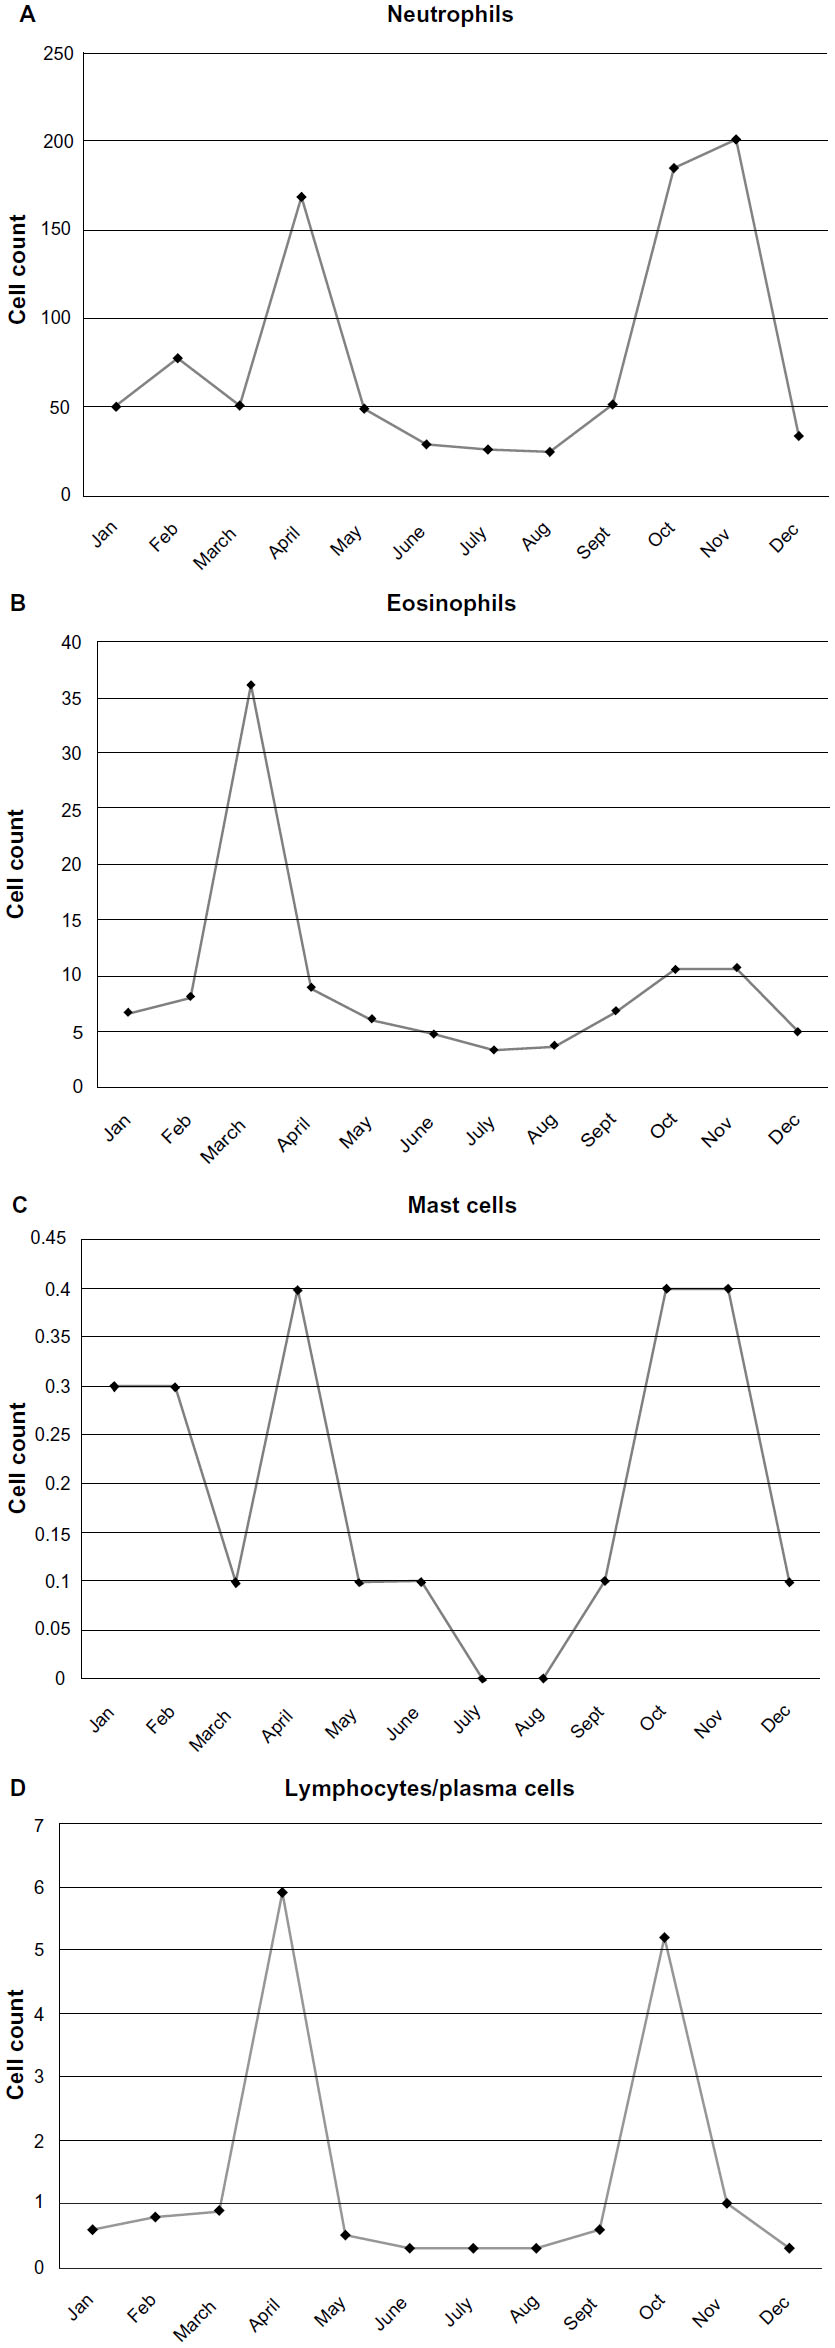 | Figure 1 Variations in the cell count of neutrophils (A), eosinophils (B), mast cells (C), and lymphocytes/plasma cells (D) in the different months of the year. |
According to the correlation between nasal cytology and nasal obstruction, the results were as follows. In the “per patient” analysis, the two variables were found to be directly related in the sense that the increase in the number of eosinophils increased the degree of nasal obstruction. In some patients, this correlation was statistically significant (patients 1, 2, 3, 4, 8, and 9); in others, it confirmed a trend of direct correlation (patients 5, 6, 7, 10, 12, 13, 14, and 16) but was not statistically significant; and in two patients (11 and 15), the correlation was indirect and not statistically significant. The evaluation of the average value from the total number of patients for 12 months confirmed a direct and statistically significant correlation. In the “per month” analysis, the two variables were found to be directly related in the sense that the increase in the number of eosinophils increased the degree of nasal obstruction. In some months, this correlation was statistically significant (January, May, July, and September); in others, it confirmed a trend of direct correlation (February, March, April, June, October, and November) but was not statistically significant; and in two months (August, December), the correlation was indirect and not statistically significant. The evaluation of the average value from the total number of months for the 16 patients confirmed a direct and statistically significant correlation (Figure 2).
 | Figure 2 Correlation between eosinophil count and nasal obstruction over 1 year. |
Discussion
Exposure to HDMs is typically perennial and is mirrored by a persistent occurrence of allergic symptoms in sensitized subjects. However, it is long known that the intensity of symptoms may remarkably change over the year, although a minimal persistent inflammation may be detected when mite-allergic patients are asymptomatic.13 Actually, only extreme measures of mite avoidance, such as staying at high altitude, are able to virtually ablate airway inflammation,14 which is present in sensitized patients and related to the indoor levels of HDM allergens. In fact, inflammatory markers are directly influenced by the HDM allergen levels detected in the houses of patients. This was shown also for subjects living in the same regions where the patients of the present study resided.15 Previous studies have investigated the effects of HDM exposure on inflammatory markers of allergic diseases, considering only the actual levels of allergen at the time of exposure.14–16 However, recent studies have shown that the concentration of HDMs fluctuates throughout the year.5–8 Evaluating the seasonal dynamics in dust samples collected from bedrooms, the highest number of positive samples and the greatest taxonomic richness of mites was observed in the October–December period.5 Furthermore, a study from Australia found that the mite concentrations in beds had a 2–3-fold annual fluctuation during a 7-year period of observation, showing the highest values in late autumn and the lowest values in summer.6 This confirmed previous observations that the wide seasonal variations in humidity and temperature, both in houses and apartments, are correlated with HDM allergen concentrations, which show similar seasonal fluctuations, being higher in autumn.7 From a clinical point of view, another study investigated the effect of climate on the seasonal variations of D. pteronyssinus specific IgE (sIgE) in serum during a 10-year period; D. pteronyssinus sIgE levels showed a seasonal pattern with an annual peak in November, and multivariate analyses indicated that solar radiation and relative humidity were independent factors associated with D. pteronyssinus sIgE levels.8
Nasal cytology assesses the consequence of the IgE-mediated inflammation in the target organ of AR. We recently demonstrated that the results of nasal cytology are correlated with the stage of AR, as established by the Allergic Rhinitis and its Impact on Asthma (ARIA) guidelines,17 which classifies the disease according to the duration and intensity of symptoms.18 This was obtained in patients sensitized to grass pollen. In a study on 64 patients with grass pollen-induced AR, 22 patients (34.4%) had mild intermittent, 21 (32.8%) had moderate-to-severe intermittent, ten (15.6%) had mild persistent, and eleven (17.2%) had moderate-to-severe persistent AR.12 Nasal cytology detected neutrophils in 49 patients, eosinophils in 41 patients, mast cells in 21 patients, and lymphocytes or plasma cells in 28 patients. The patients with moderate-to-severe AR had significantly more mast cells and lymphocytes/plasma cells than those with mild AR. This showed that the ARIA classification of AR is associated with different cell counts in nasal cytology and that moderate-to-severe AR shows significantly increased counts of mast cells and lymphocytes or plasma cells. To the best of our knowledge, no study is available investigating this issue in mite-induced AR. The results of the present study show that a similar cytologic picture occurs in mite-allergic patients. In particular, the cells most commonly detected in the nasal mucosa were neutrophils, and during the period from October to April, a peak in the number of neutrophils and also the presence of significant numbers of eosinophils, mast cells, and lymphocytes/plasma cells were found, showing that in these months there is more intense inflammation. The clinical significance of this finding is demonstrated by the correlation between cytology data and nasal obstruction we found in most patients. This confirms the observations from studies indicating that the mite concentration in the indoor environment has seasonal fluctuations.5–7
Conclusion
As previously demonstrated for grass pollen, nasal cytology provides useful data in detecting nasal inflammation and its association with the clinical stage of AR. The seasonal variations in the cellularity of nasal cytology are likely to be induced by the fluctuations in the HDM allergen that have been demonstrated in recent investigations. These findings could pave the way to novel approaches in the treatment of HDM-induced AR.
Disclosure
No funding was secured for this study. Ilaria Dell’Albani and Franco Frati are employees of Stallergenes Italy. Olivier de Beaumont is an employee of Stallergenes France. Cristoforo Incorvaia is a scientific consultant for Stallergenes Italy. The remaining authors report no conflicts of interest in this work.
References
Asher MI, Montefort S, Björkstén B, et al; ISAAC Phase III Study Group. Worldwide time trends in the prevalence of symptoms of asthma, allergic rhinoconjunctivitis, and eczema in childhood: ISAAC Phases One and Three repeat multicountry cross-sectional surveys. Lancet. 2006;368:733–743. | |
Blomme K, Tomassen P, Lapeere H, et al. Prevalence of allergic sensitization versus allergic rhinitis symptoms in an unselected population. Int Arch Allergy Immunol. 2012;160:200–207. | |
Hart BJ. Life cycle and reproduction of house dust mites: environmental factors influencing mite populations. Allergy. 1998;53:13–17. | |
Bessot JC, Pauli G. Mite allergens: an overview. Eur Ann Allergy Clin Immunol. 2011;43:141–156. | |
Kosik-Bogacka DI, Kalisinska E, Henszel L, Kuzna-Grygiel W. Seasonal dynamics of house dust mites in dust samples collected from sleeping places in north-western Poland. Zoonoses Public Health. 2012;9:8–15. | |
Crisafulli D, Almqvist C, Marks G, Tovey E. Seasonal trends in house dust mites in children’s beds over a 7-year period. Allergy. 2007;62:1394–1400. | |
Cho SI, Ramachandran G, Grengs J, Ryan AD, Eberly LE, Adgate JL. Longitudinal evaluation of allergen and culturable fungal concentrations in inner-city households. J Occup Environ Hyg. 2008;5:107–118. | |
Hervás D, Pons J, Milá J, Matamoros N, Hervás JA, García-Marcos L. Specific IgE levels to Dermatophagoides pteronyssinus are associated with meteorological factors. Int Arch Allergy Immunol. 2013;160:383–386. | |
Holopainen E. Nasal cytology as a nasal test. Rhinology. 1976;14:29–35. | |
Meltzer EO, Jalowayski AA. Nasal cytology in clinical practice. Am J Rhinol. 1988;2:47–54. | |
Gelardi M, Fiorella ML, Leo G, Incorvaia C. Cytology in the diagnosis of rhinosinusitis. Pediatr Allergy Immunol. 2007;18:50–52. | |
Gelardi M, Incorvaia C, Fiorella ML, et al; Italian Academy of Nasal Cytology. The clinical stage of allergic rhinitis is correlated to inflammation as detected by nasal cytology. Inflamm Allergy Drug Targets. 2011;10:472–476. | |
Ciprandi G, Buscaglia S, Pesce G, et al. Minimal persistent inflammation is present at mucosal level in patients with asymptomatic rhinitis and mite allergy. J Allergy Clin Immunol. 1995;96:971–979. | |
Boner AL, Peroni DG, Piacentini GL, Venge P. Influence of allergen avoidance at high altitude on serum markers of eosinophil activation in children with allergic asthma. Clin Exp Allergy. 1993;23:1021–1026. | |
Bodini A, Peroni D, Loiacono A, et al. Exhaled nitric oxide daily evaluation is effective in monitoring exposure to relevant allergens in asthmatic children. Chest. 2007;132:1520–1525. | |
Sette L, Comis A, Marcucci F, Sensi L, Piacentini GL, Boner AL. Benzyl-benzoate foam: effects on mite allergens in mattress, serum and nasal secretory IgE to Dermatophagoides pteronyssinus, and bronchial hyperreactivity in children with allergic asthma. Pediatr Pulmonol. 1994;18:218–227. | |
Gelardi M, Incorvaia C, Passalacqua G, Quaranta N, Frati F. The classification of allergic rhinitis and its cytological correlate. Allergy. 2011;66:1624–1625. | |
Bousquet J, Van Cauwenberge P, Khaltaev N; Aria Workshop Group; World Health Organization. Allergic rhinitis and its impact on asthma. J Allergy Clin Immunol. 2001;108(Suppl 5):S147–S334. |
 © 2014 The Author(s). This work is published and licensed by Dove Medical Press Limited. The
full terms of this license are available at https://www.dovepress.com/terms
and incorporate the Creative Commons Attribution
- Non Commercial (unported, 3.0) License.
By accessing the work you hereby accept the Terms. Non-commercial uses of the work are permitted
without any further permission from Dove Medical Press Limited, provided the work is properly
attributed. For permission for commercial use of this work, please see paragraphs 4.2 and 5 of our Terms.
© 2014 The Author(s). This work is published and licensed by Dove Medical Press Limited. The
full terms of this license are available at https://www.dovepress.com/terms
and incorporate the Creative Commons Attribution
- Non Commercial (unported, 3.0) License.
By accessing the work you hereby accept the Terms. Non-commercial uses of the work are permitted
without any further permission from Dove Medical Press Limited, provided the work is properly
attributed. For permission for commercial use of this work, please see paragraphs 4.2 and 5 of our Terms.