Back to Journals » Journal of Inflammation Research » Volume 14
Screening of Key Genes of Sepsis and Septic Shock Using Bioinformatics Analysis
Authors Zeng X, Feng J, Yang Y, Zhao R, Yu Q ![]() , Qin H, Wei L, Ji P, Li H, Wu Z, Zhang J
, Qin H, Wei L, Ji P, Li H, Wu Z, Zhang J ![]()
Received 12 January 2021
Accepted for publication 26 February 2021
Published 11 March 2021 Volume 2021:14 Pages 829—841
DOI https://doi.org/10.2147/JIR.S301663
Checked for plagiarism Yes
Review by Single anonymous peer review
Peer reviewer comments 2
Editor who approved publication: Professor Ning Quan
Xiaoliang Zeng,* Jihua Feng,* Yanli Yang, Ruzhi Zhao, Qiao Yu, Han Qin, Lile Wei, Pan Ji, Hongyuan Li, Zimeng Wu, Jianfeng Zhang
Department of Emergency Medicine, The Second Affiliated Hospital of Guangxi Medical University, Nanning, 530007, People’s Republic of China
*These authors contributed equally to this work
Correspondence: Zimeng Wu; Jianfeng Zhang
The Second Affiliated Hospital of Guangxi Medical University, No. 166 Daxuedong Road, Nanning, Guangxi, 530007, People’s Republic of China
Tel +867713277166
Fax +867713277285
Email [email protected]; [email protected]
Objective: Sepsis is a disease associated with high mortality. We performed bioinformatic analysis to identify key biomarkers associated with sepsis and septic shock.
Methods: The top 20% of genes showing the greatest variance between sepsis and controls in the GSE13904 dataset (children) were screened by co-expression network analysis. The differentially expressed genes (DEGs) were identified through analyzing differential gene expression between sepsis patients and control in the GSE13904 (children) and GSE154918 (adult) data sets. Intersection analysis of module genes and DEGs was performed to identify common DEGs for enrichment analysis, protein-protein interaction network (PPI network) analysis, and Short Time-series Expression Miner (STEM) analysis. The PPI network genes were ranked by degree of connectivity, and the top 100 sepsis-associated genes were identified based on the area under the receiver operating characteristic curve (AUC). In addition, we evaluated differences in immune cell infiltration between sepsis patients and controls in children (GSE13904, GSE25504) and adults (GSE9960, GSE154918). Finally, we analyzed differences in DNA methylation levels between sepsis patients and controls in GSE138074 (adults).
Results: The common genes were associated mainly with up-regulated inflammatory and metabolic responses, as well as down-regulated immune responses. Sepsis patients showed lower infiltration by most types of immune cells. Genes in the PPI network with AUC values greater than 0.9 in both GSE13904 (children) and GSE154918 (adults) were screened as key genes for diagnosis. These key genes (MAPK14, FGR, RHOG, LAT, PRKACB, UBE2Q2, ITK, IL2RB, and CD247) were also identified in STEM analysis to be progressively dysregulated across controls, sepsis patients and patients with septic shock. In addition, the expression of MAPK14, FGR, and CD247 was modified by methylation.
Conclusion: This study identified several potential diagnostic genes and inflammatory and metabolic responses mechanisms associated with the development of sepsis.
Keywords: sepsis, septic shock, bioinformatics, diagnosis, immunosuppression
Introduction
Sepsis is defined as life-threatening organ dysfunction caused by a dysregulated host response to infection.1 In 2017, approximately 48.9 million sepsis cases and 11.0 million sepsis-related deaths were recorded worldwide, accounting for 19.7% of all global deaths.2 According to a recently published systematic review, sepsis with organ dysfunction occurring during hospitalization affects 24.4% of all patients in intensive care units and neonatal intensive care units.3 Septic shock is defined as sepsis complicated by hyperlactatemia and simultaneous hypotension requiring vasopressin therapy. The in-hospital mortality rate of septic shock is 30–50%.4
The World Health Organization states that the annual number of deaths due to sepsis worldwide is approximately 6 million, most of which are preventable.5 The identification of altered molecular signatures and biochemical pathways in sepsis patients has driven interest in the discovery of novel biomarkers.6 Early recognition of sepsis is essential for timely treatment and can improve sepsis outcomes.7,8 Mortality risk is higher when sepsis treatment is delayed.9 Analyzing the molecular characteristics of patients is an effective method to screen for potential diagnostic and prognostic targets.10
Patients with sepsis often present acquired immunodeficiency.11 Significant lymphopenia has been reported in sepsis patients, and apoptosis may be a major mechanism of lymphocyte death in sepsis.12 A number of anti-inflammatory and immunostimulatory agents are currently in clinical trials for sepsis and septic shock.13,14 At the same time, sepsis may result in prolonged methylation changes in monocytes, which may help stabilize them in an immunotolerant state.15 Multiple studies have shown that epigenetic alterations in sepsis may affect prognosis and serve as diagnostic biomarkers.16,17
Improved infection prevention and control strategies are urgently needed to reduce the health care burden associated with the development and progression of sepsis and septic shock, as are approaches to early diagnosis and appropriate treatment. The present study used bioinformatics to explore biomarkers and potential therapeutic targets associated with the development of sepsis.
Materials and Methods
Sepsis Data Collection
Data were downloaded from the Gene Expression Omnibus (GEO) database (https://www.ncbi.nlm.nih.gov/geo/). The GSE13904 dataset included array-based gene expression profiles of whole blood from 18 normal children, 52 children with sepsis, and 106 children with septic shock. The GSE25504 dataset included array-based gene expression profiles of whole blood from 37 control and 25 infected human neonates. The GSE9960 dataset included array-based gene expression profiles of peripheral blood mononuclear cells from 54 adult sepsis patients and 16 controls. The raw data in these three datasets were processed using the lumi package in R.18 The GSE154918 dataset included gene expression profiles based on high-throughput sequencing of peripheral blood from 65 adult sepsis patients and 40 controls. Raw counts were pre-processed and normalized using DESeq2.19
Coexpression Analysis
The variance of gene expression in GSE13904 (children) was first calculated, and the top 20% of the greatest variance was screened to construct a coexpression network through weighted gene coexpression network analysis (WGCNA) using the WGCNA package in R.20 The connections among different pairs of genes were identified and weighted based on the correlated expression levels across patients and control samples. Then the adjacency matrix was converted into a topological overlap matrix (TOM) to detect gene connectivity in the network. Genes were separated into different clusters (modules) based on their connectivity and covariance coefficients, then hierarchically clustered. The WGCNA package was employed to test the independence and average connectivity of different modules under different power values, and the power values corresponding to an independence index of R2 = 0.9 were selected. The minimum size of the gene dendrogram was 30. Potential correlations between modules and clinical characteristics of patients were explored through Pearson correlation analysis.
Difference Analysis
Gene expression profiles were constructed for each sample of septic shock patients, sepsis patients and controls. Differential analysis between sepsis patients and healthy individuals in GSE13904 (children) or GSE154918 (adults) was performed after using the limma package in R.21 A screening threshold of P < 0.05 was set to obtain the differentially expressed genes (DEGs) between sepsis patients and controls. Then, DEGs whose expression differed in the same direction in patients (up- or down-regulation) were screened for intersection analysis with module genes to obtain the common genes. DEGs between septic shock patients and sepsis patients in GSE13904 (children) was obtained using the limma package in R and a significance criterion of P < 0.05.
Enrichment Analysis
We used the clusterProfiler package in R22 to perform gene ontology (GO) and Kyoto Encyclopedia of Genes and Genomes (KEGG) pathway enrichment analysis of common genes. P < 0.05 was considered statistically significant for enrichment. The significantly enriched terms were subjected to gene set variation analysis (GSVA)23 to calculate the score for the enrichment using the gene expression profile. The up-regulation or down-regulation of enrichment terms in septic patients relative to controls was evaluated using the GSVA score in the limma package in R. Gene set enrichment analysis (GSEA) was used to identify KEGG pathway using GSEA software. The fgsea package in R was used to display the results of the GSEA.
Single Sample Gene Set Enrichment Analysis (ssGSEA)
The marker gene sets for immune cell types were obtained from Bindea et al24. The gene signatures expressed by the immune cell populations were quantified using the single-sample gene set enrichment analysis (ssGSEA) function in GSVA. Differences in immune cell infiltration between sepsis patients and healthy controls were then calculated, and a significance criterion of P < 0.05 was applied. Correlations between levels of infiltration by different types of immune cells were calculated using Pearson’s correlation, based on ssGSEA scores for the immune cell types.
PPI Network Analysis
The common genes were analyzed using the online tool STRING (https://string-db.org), and the protein-protein interaction (PPI) network based on the criterion of a combined score > 900 was constructed and displayed using Cytoscape software. Genes were ranked based on their degree of connectivity with other genes. The pROC package in R25 was used to calculate the the area under the receiver operating characteristic curve (AUC) for the top 100 genes showing the greatest connectivity in the PPI network.
Short Time-Series Expression Miner (STEM) Analysis
We performed STEM analysis to cluster the common genes in healthy individuals, sepsis patients and septic shock patients in the GSE13904 database (children).26 Significant clustering was defined as P < 0.05. The significantly clustered genes showed a trend of gradual up- or down-regulation as one moved from controls to sepsis patients and then to septic shock patients.
Methylation Analysis
The GSE138074 dataset contains array-based gene methylation profiles of monocytes from 14 adult septic patients and 11 healthy donors. Data were processed using the ChAMP package in R.27 Differences in methylation levels between sepsis patients and healthy donors were calculated using the limma package in R.
Results
Coexpression Network of Sepsis-Related Genes
The flow chart of this study is shown in Figure 1. We calculated variance of gene expression in GSE13904 (children) and then screened 4093 genes in the top 20% greatest variance genes in order to identify coexpression patterns. WGCNA identified a coexpression network containing 2550 genes (Figure 2A). These genes clustered into eight coexpression modules: the brown module had the strongest positive correlation with sepsis shock, whereas the pink module had the strongest negative correlation with sepsis shock (Figure 2B). By calculating the expression profiles of the modules in different clinical samples, we identified the expression trend for each module in sepsis development (Figure 2C). The brown module showed gradual up-regulation, while the pink module showed gradual down-regulation, in the order: controls < patients with sepsis < patients with septic shock.
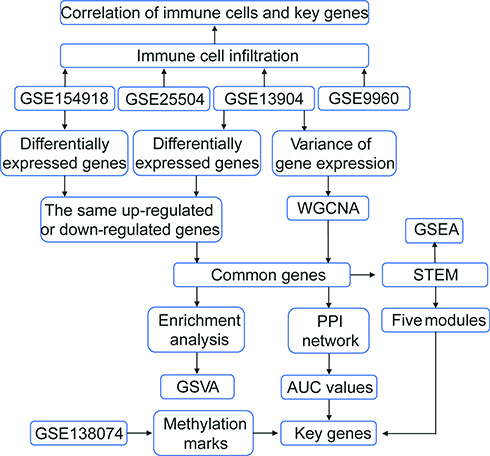 |
Figure 1 Flowchart of this study. The following datasets were used for the identification of potential diagnostic genes and mechanisms associated with the development of sepsis: GSE13904 (children), GSE25504 (children), GSE9960 (adults) and GSE154918 (adults). Abbreviations: AUC, area under the receiver operating characteristic curve; GSVA, gene set variation analysis; PPI, protein-protein interaction; STEM, short time-series expression miner; WGCNA, weighted gene coexpression network analysis. |
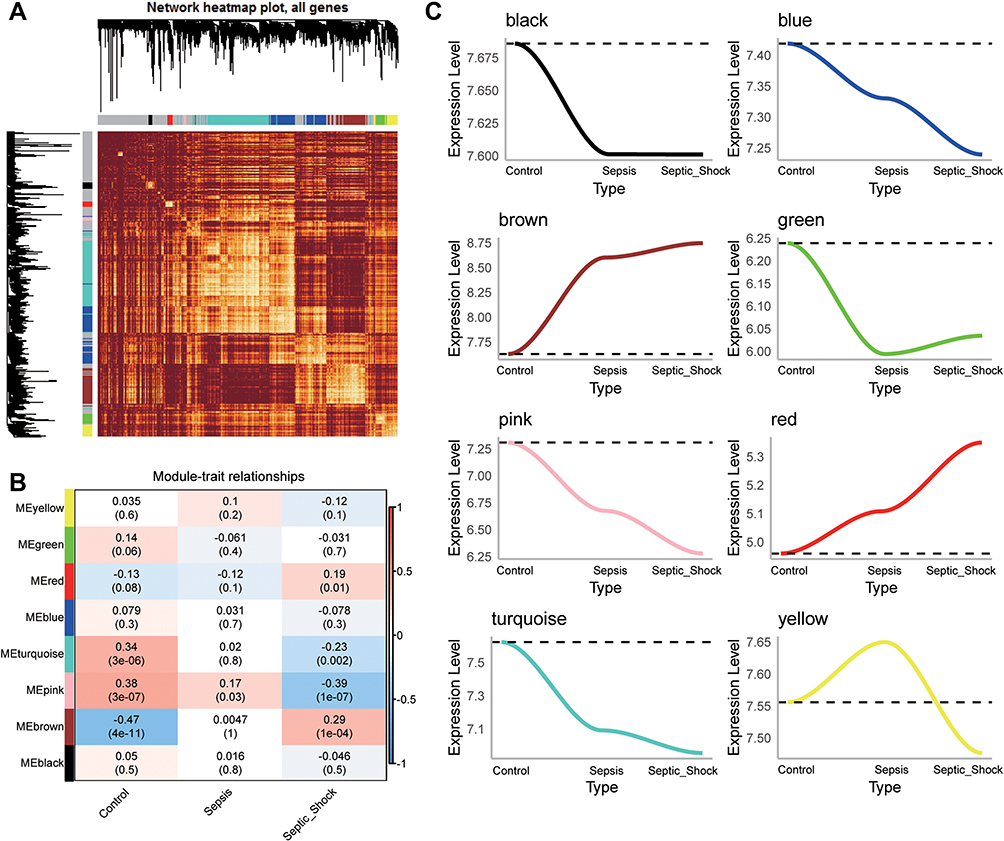 |
Figure 2 WGCNA of genes showing large expression variance in sepsis patients. (A) Network heatmap of unsupervised cluster analysis of module genes. Different colors in columns and rows represent different modules. (B) Correlation of modules with clinical traits. Each column represents a different module; each row, a different clinical phenotype. Red indicates positive correlation; blue, negative correlation. (C) Progressive up- or down-regulation in a module in the trend: healthy controls < sepsis < sepsis shock. |
DEGs in Sepsis
Of the four sets of sepsis data that we obtained, GSE13904 (children) and GSE154918 (adults) had the largest samples (Figure 3A). In GSE13904 (children), we obtained 7850 DEGs between sepsis and control samples (Figure 3B, Table S1). In GSE154918 (adults), we obtained 12496 DEGs between sepsis and control samples (Figure 3B, Table S2). By comparing the DEGs between adult and pediatric sepsis, we found 5638 genes that were common to both, 2212 that may be specific to the pediatric condition and 6857 that may be specific to the adult condition (Figure 3C). Genes at the intersection may be strongly associated with sepsis in adults and children. In addition, we screened 5143 DEGs that were simultaneously up- or down-regulated in GSE13904 (children) and GSE154918 (adults). Intersection analysis of these genes with module genes yielded 1274 common genes for subsequent analysis (Figure 3D).
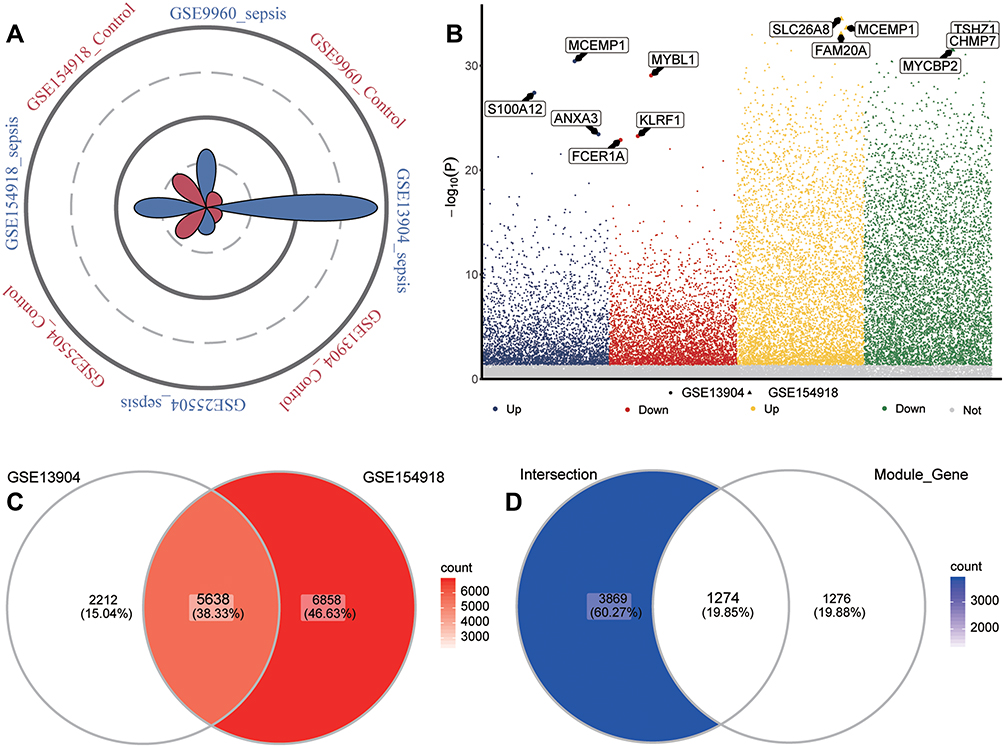 |
Figure 3 Identification of common genes in sepsis. (A) Petal plot of sample size for sepsis and control groups in four datasets. Red petals represent healthy controls; blue petals, sepsis patients. (B) Manhattan plot of differentially expressed genes between sepsis patients and healthy controls in GSE13904 and GSE154918. Up, up-regulation in sepsis; Down, down-regulation in sepsis; Not, no significant difference from controls. The three genes in each group showing the largest fold difference are labeled. (C) Venn diagram of differentially expressed genes in GSE13904 (children) and GSE154918 (adults). (D) Venn diagram showing DEGs in GSE13904 (children) and GSE154918 (adults) as well as module genes, that are common to adults and children or specific to each one of those groups. |
Biological Functions of Selected Genes
Enrichment analysis showed that, based on the common genes identified above, defensive responses to bacteria, complement-dependent cytotoxicity, and canonical glycolysis were significantly up-regulated in sepsis patients, whereas interleukin-17 production, B cell activation, and T cell receptor signaling were significantly down-regulated (Figure 4A). KEGG results showed that Hypoxia-Inducible Factor 1 (HIF-1) signaling pathway, Tumor Necrosis Factor (TNF) signaling pathway, and glycolysis/gluconeogenesis were significantly up-regulated in sepsis, whereas Th1 and Th2 cell differentiation, Th17 cell differentiation, and T cell receptor signaling pathways were significantly down-regulated (Figure 4B). KEGG results in GSEA similarly found that metabolism-related pathways were up-regulated while immune related pathways were down-regulated (Figure 4C).
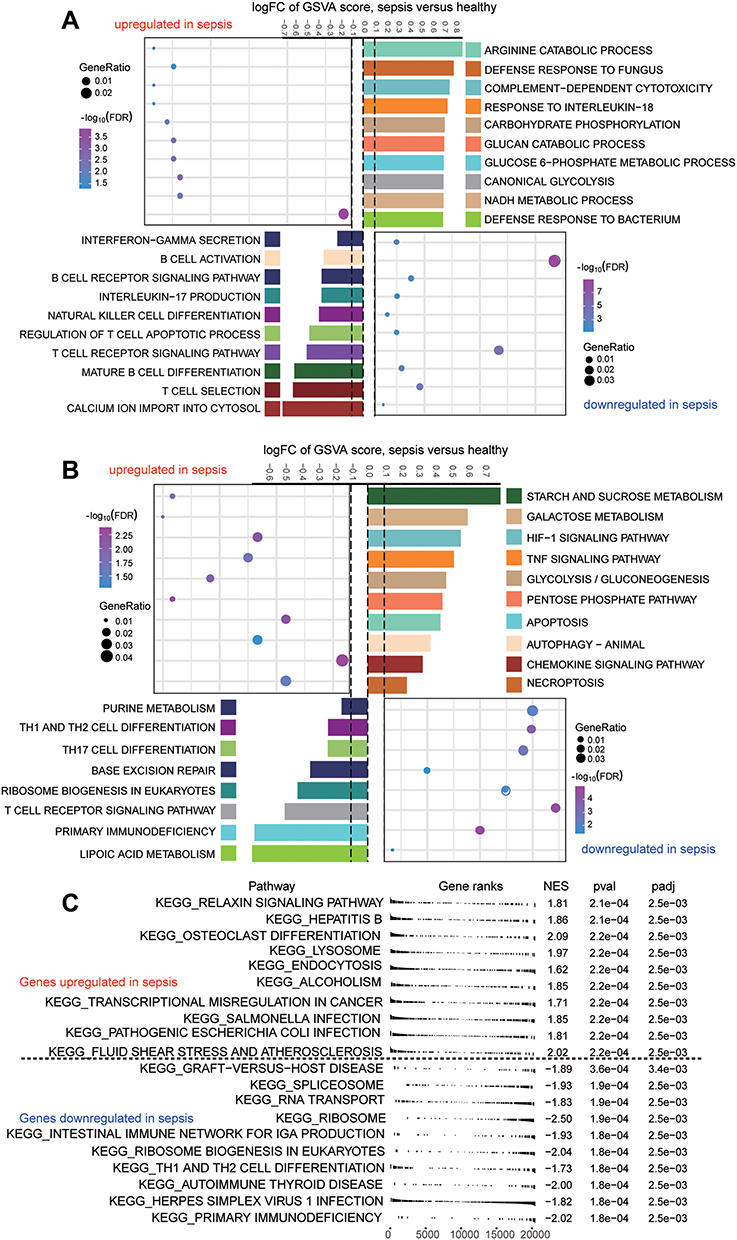 |
Figure 4 Biological functions and KEGG pathways enriched in common genes. (A) Common genes of sepsis patients relative to controls involved in up- or down-regulated biological processes, as quantified by gene set variation analysis (GSVA). FC, fold change. (B) Common genes of sepsis patients relative to controls involved in up- or down-regulated KEGG pathways, as quantified by single-sample GSVA. FC, fold change. (C) Common genes involved in up- or down-regulated KEGG pathways of GSEA results in sepsis patients relative to controls. P < 0.05 was considered statistically significant. |
Immune Cell Infiltration in Sepsis
In the enrichment results, we found that a large number of immune-related biological functions were significantly down-regulated in sepsis samples. Therefore, we assessed immune cell infiltration in sepsis patients (Figure 5A). Unsurprisingly, sepsis was associated with significantly reduced infiltration by most types of immune cells, except that infiltration by macrophages, mast cells, and neutrophils was elevated. Cytotoxic T cell types were defined based on gene markers, and CD8+ T cells were treated as one subtype of T cells with different gene markers than other subtypes.24 The ssGSEA scores for these different subtypes were used to generate immune cell interaction networks. We grouped the differentially infiltrated immune cells into four clusters (Figure 5B).
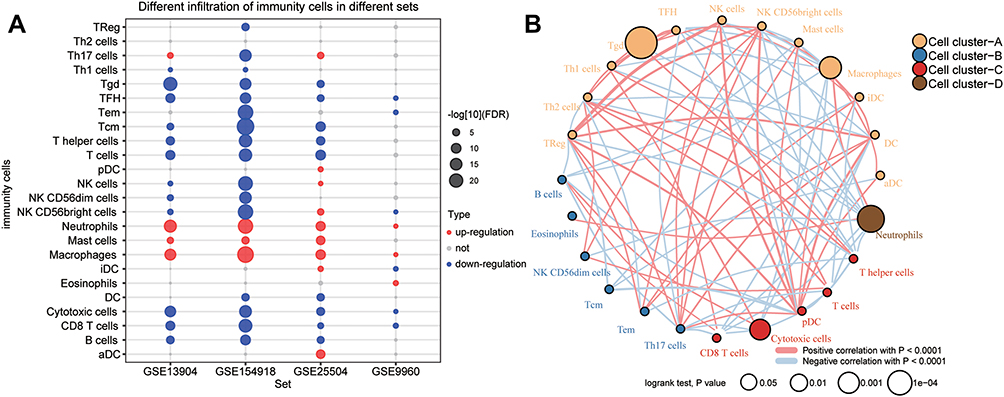 |
Figure 5 Immune cell suppression in sepsis patients. (A) Differences in immune cell infiltration between sepsis and controls. Each row represents a type of immune cell; each column, a different dataset. Red nodes represent significant up-regulation in sepsis; blue nodes, significant down-regulation. (B) Clustering and correlation of immune cell types based on infiltration levels. The size of each node represents the single-sample gene set enrichment analysis (ssGSEA) scores of each immune cell type, transformed by log10 (Log rank test P-value). Connections between immune cell types represent interactions between the two. The thickness of the line indicates the strength of the correlation, based on Pearson correlation analysis. Red lines represent positive correlations; blue lines, negative correlations. Immune cell cluster A is shown in yellow; cell cluster B, blue; cell cluster C, red; and cell cluster D, brown. |
PPI Network of Common Genes
In addition, we performed PPI network analysis of the common genes and ranked the connectivity degree between the genes in the network (Figure 6A). We screened the top 100 genes with the greatest connectivity (Figure 6B). By calculating the AUC values of these genes in GSE13904 (children) and GSE154918 (adults), we identified genes with AUC values greater than 0.9 in both sets of data, which we defined as key genes (Figure 6C). Among them, MAPK14, FGR, RHOG were up-regulated in sepsis, while LAT, PRKACB, UBE2Q2, ITK, IL2RB, and CD247 were down-regulated (Figure 6D). Importantly, the patterns of differential expression of these key genes were consistent across GSE13904, GSE154918, GSE25504, and GSE9960. Correlation analysis found that up-regulated genes had stronger negative correlation with immune cells, while down-regulated genes had stronger positive correlation with immune cells, especially T cells (Figure 6E).
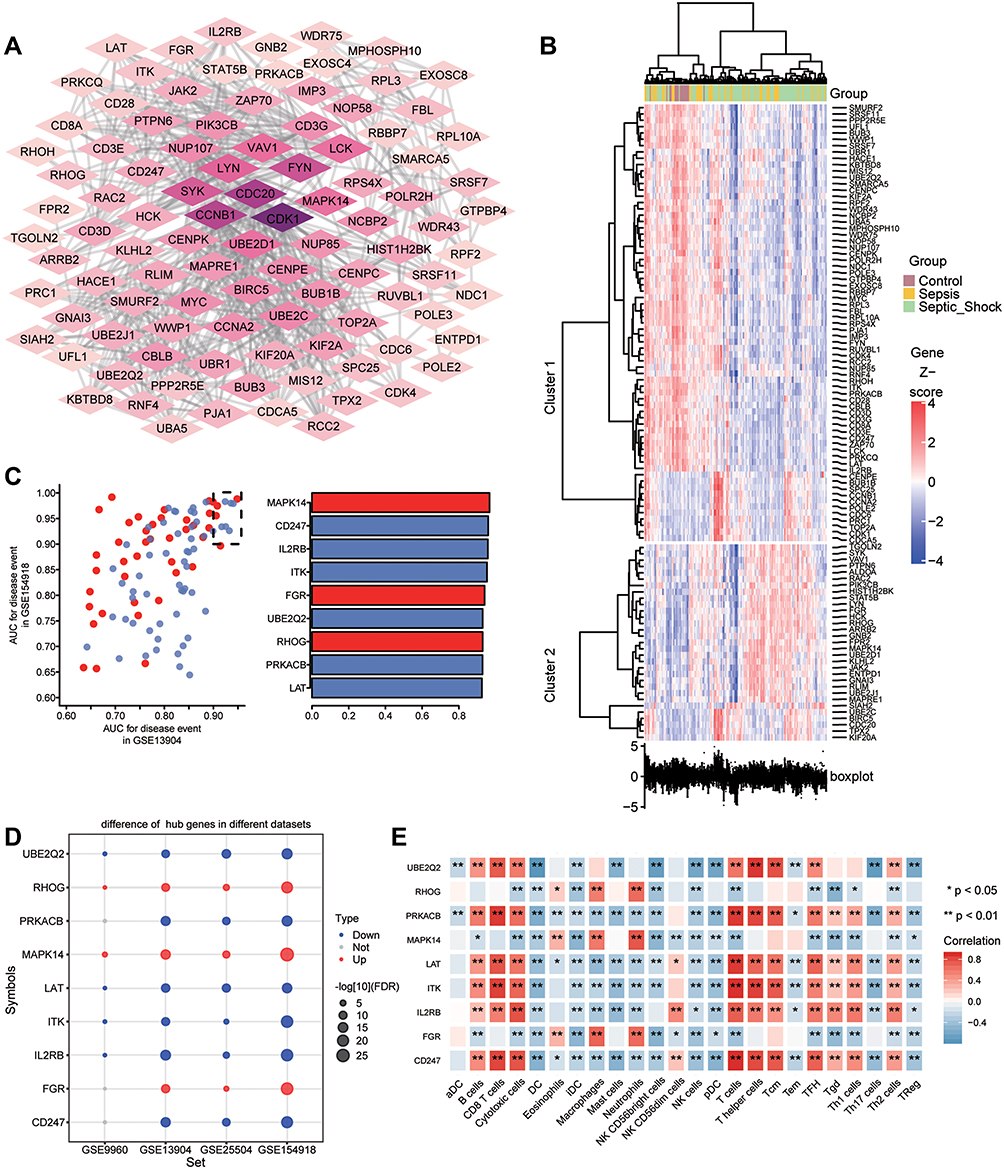 |
Figure 6 Identification of potential diagnostic genes for sepsis. (A) PPI network of common genes (top 100 with highest degree of connection). Darker color indicates higher degree of connectivity. (B) Heatmap of the top 100 genes based on degree of connectivity in the PPI network. Data from sepsis patients are shown in yellow; sepsis shock patients, green; and controls, brown. (C) Genes with areas under the receiver operating characteristic curve (AUCs) greater than 0.9 in GSE13904 (children) and GSE154918 (adults). Red represents genes with up-regulated expression in sepsis; blue, genes with down-regulated expression. The lengths of the bars represent the mean AUC values of the genes. (D) Differential expression of key genes between sepsis patients and controls. Red nodes represent genes with up-regulated expression in sepsis; blue nodes, genes with down-regulated expression; grey nodes, no significant difference from controls. (E) Correlation between key genes and immune infiltrating cells, based on Pearson correlation analysis. Red nodes represent positive correlations; blue nodes, negative correlations. *P < 0.05, **P < 0.01. |
Genes Associated with Sepsis Development
To identify the change in gene expression during the course of development from sepsis to septic shock, we utilized STEM software to identify 712 common genes showing progressive dysregulation during sepsis progression. These genes fell into five significant clusters (Figure 7A). Interestingly, all the key genes that we identified above were detected in these clusters (Figure 7B). The expression of MAPK14, FGR, RHOG was gradually up-regulated from control to sepsis then to septic shock, while the expression of LAT, PRKACB, UBE2Q2, ITK, IL2RB, and CD247 was gradually down-regulated (Figure 7C). The pathway heatmap built by GSEA algorithm showed that starch and sucrose metabolism, complement and coagulation cascades, and legionellosis were gradually up-regulated during the development of sepsis, while Th1 and Th2 cell differentiation, IgA production in the intestinal immune network, as well as antigen processing and presentation were gradually down-regulated (Figure 7D).
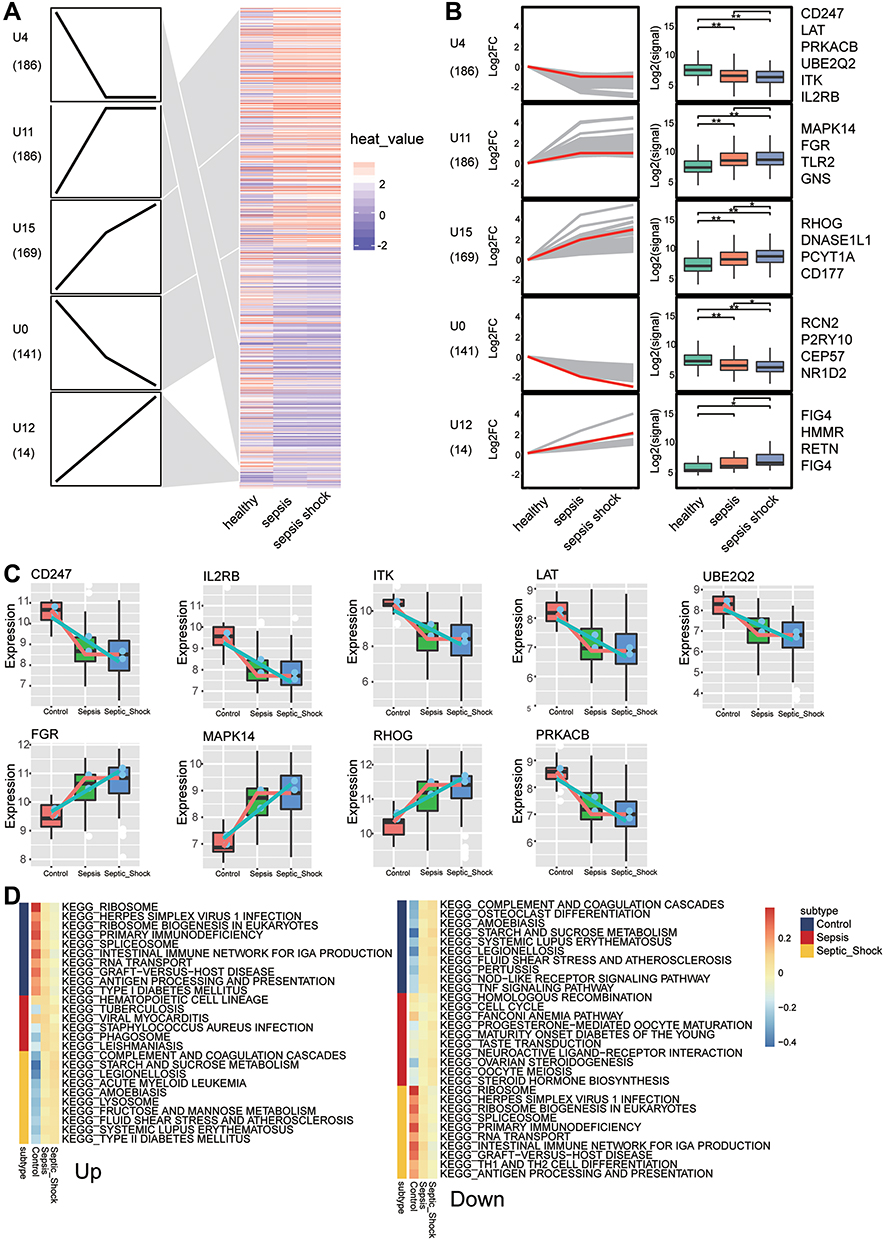 |
Figure 7 Identification of persistently dysregulated genes during progression from sepsis to septic shock. (A) Heatmap of persistently dysregulated genes identified by STEM in the trend: healthy controls < sepsis patients < septic shock patients. Gene sets were arranged based on cluster assignment in order to generate simplified expression profiles. We graphically depicted only five clusters with >10 genes. (B) The box plots of STEM genes in five clusters. Line plots and box plots were used to display log2 (fold change). Representative genes were highlighted using red lines. Key genes were in significant STEM clustering and located on the right side of the box map. *P < 0.05, **P < 0.01. (C) Expression of key genes were persistently elevated during sepsis development. (D) Signaling pathways persistently up- or down-regulated as sepsis develops. Red in the heatmap represents an enrichment score greater than 0; blue represents an enrichment score less than 0. |
Methylation Marks in Sepsis
To identify the sepsis key genes whose methylation may be modified in the disease, we first analyzed differentially methylated positions (DMPs) between sepsis samples and controls in GSE138074 (adult) (Figure 8A). DMPs with delta beta values in the opposite direction to the expression value of common DEGs were filtered and identified as methylation marks. A total of 1313 methylation marks were identified (Figure 8B). These included MAPK14, FGR, and CD247. The methylation levels of MAPK14 (cg18213931) and FGR (cg16922167) were lower in sepsis than control, and that of CD247 (cg21161394) was higher in sepsis (Figure 8C).
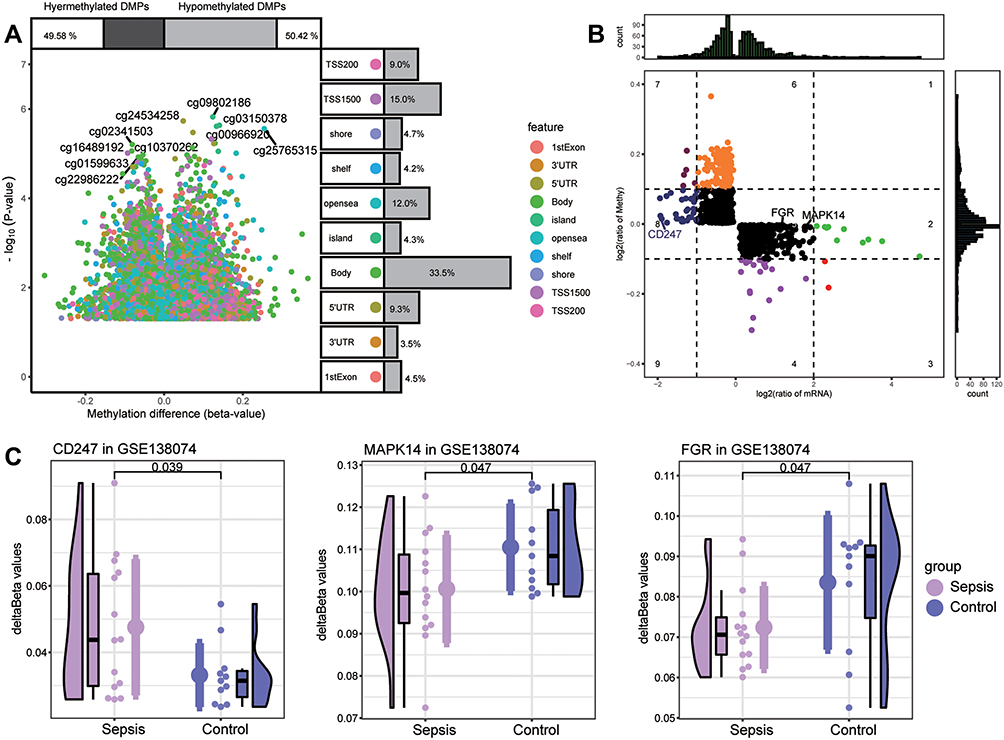 |
Figure 8 Screening of key methylation markers for sepsis in GSE138074. (A) Differentially methylated positions (DMPs) between sepsis and controls. Of all DMPs, 49.58% were hypermethylated and 50.42% were hypomethylated. The 10 sites with the highest methylation levels are labeled. Each feature color represents a different methylation site. (B) The methylation levels and the expression levels of methylation marks. Key genes are labeled. (C) Differences in key gene methylation levels between sepsis and controls. P for CD247 was 0.039; MAPK14, 0.047; FGR, 0.047. |
Discussion
Early recognition of sepsis is key to timely treatment. In this study, we subjected sepsis-related sequencing data to bioinformatics analysis in order to explore the sepsis-related molecular dysregulation mechanisms. Compared to other studies using the same datasets,28,29 the present work used WGCNA and PPI networks to identify potential diagnostic markers for sepsis not only in adults but also in children. We further identified potential biomarkers associated with septic shock as well as methylation modification status. We found that in patients with sepsis, multiple metabolic pathways were significantly up-regulated, whereas infiltration by immune cells was significantly decreased. We identified nine potential biomarkers associated with sepsis progression. In addition, we found evidence that the expression of MAPK14, FGR, and CD247 is modified by methylation, which may facilitate the diagnosis of sepsis and septic shock.
Based on analysis of variance, WGCNA and differential expression analysis, we identified genes that may be associated with sepsis and septic shock. Enrichment analysis revealed that the genes involved in inflammatory and metabolic responses were up-regulated in sepsis, whereas the genes corresponding to immune responses were significantly suppressed. This is similar to previous findings.30 Increased galactosylation of the crystallizable immunoglobulin G fragment has been linked to increased complement-dependent cytotoxicity, which in turn may contribute to pediatric sepsis.31 In patients with sepsis, increased levels of both C3a and C5a in serum have been reported.32 Monocytes from sepsis patients have significantly higher basal glycolysis than monocytes from healthy controls.33 Aerobic glycolysis has been found to contribute to sepsis development by regulating inflammasome activation in macrophages.34 Both bacterial and fungal sepsis have been observed to cause a shift in cellular metabolism towards glycolysis, which is associated with an impaired ability of leukocytes to produce pro-inflammatory cytokines upon a second stimulus.35 Moreover, lymphocyte loss, equally affecting B and T cells, was demonstrated in septic patients.36,37 Accumulating evidence supports that immunosuppression is one of the major contributors to sepsis-related mortality, and that T cell exhaustion is one of the most severe responses.38,39
Consistent with our KEGG enrichment results, HIF-1α contributes to the pathogenic role of macrophages in sepsis.40,41 HIF-1α promotes the expression of multiple gene products, including enzymes that promote glycolysis.42 Some studies consider HIF as a potential biomarker of sepsis, but this remains controversial.43 Tumor necrosis factor α (TNF-α) contributes to sepsis immunosuppression by increasing apoptosis.44 TNF-α levels in plasma increase progressively as sepsis progresses, with the highest values found in patients with septic shock. This finding supports a prognostic biomarker role for this cytokine.45 Th17 cytokine production is reduced in sepsis, which may adversely affect long-term mortality.46 Treatment with IL-7 increases the responsiveness of Th17 cells and reduces the mortality of secondary fungal infections, making IL-17 a potential therapeutic agent.47 A ratio of Th2 to Th1 cells are clearly up-regulated in severe sepsis patients, and their continuous dynamic elevation is associated with acquired infection and 28-day mortality in the intensive care unit.48
Patients with sepsis have impaired innate and adaptive antibacterial immunity, which renders them unable to control primary and secondary infections.49 Our analysis of immune cell infiltration in sepsis patients showed that the levels of infiltration of some innate immune cells, such as macrophages and mast cells, were significantly higher. The host defends against pathogens by mounting a systemic inflammatory response in innate immune cells, such as macrophages, which produce pro-inflammatory cytokines and chemokines and which initiate coagulation cascade within minutes.50 In our clustering of immune cell types based on differential infiltration, we identified four clusters. Each is characterized by unique immune responses that may influence the disease state of the patient.51
On the other hand, we found 9 key genes that may influence the development of sepsis. Among them, MAPK14, FGR, and CD247 expression may be modified by methylation. MAPK14 has already been identified as a key gene and potential therapeutic target in neonatal sepsis.52,53 Deficiency of MAPK14 in macrophages protects mice from lipopolysaccharide (LPS)-induced sepsis.54 FGR proto-oncogene (FGR) is a Src family kinase that is expressed in innate immune cells, including macrophages and granulocytes, and is considered a major signaling molecule downstream of many immune cell receptors.55 FGR −/− mice have leukocyte migration disorder, and FGR is involved in the release of proinflammatory mediators.56 Studies have shown that CD247 is a potential new biomarker for sepsis and may be beneficial for the prognosis of patients with sepsis.57,58 CD247 is involved in the immune response to sepsis caused by Staphylococcus aureus infection.59
For the other key genes, RHOG has already been linked to sepsis through its participation in inflammatory processes.60 The amount of LAT on the cell surface may determine the extent of T cell activation.61 Systemic inflammation in patients with acute sepsis causes persistent T cell dysfunction, which leads to immunosuppression.37 PRKACB is differentially expressed in neonatal sepsis, and it may influence disease progression via the MAPK signaling pathway.62,63 ITK has been found to regulate thermal homeostasis during sepsis via its effects on mast cells.64 Previous work has found that IL2RB is down-regulated in sepsis, which is consistent with our study,65 and that IL2RB is negatively correlates with organ failure and mortality in sepsis.66 Our results reveal UBE2Q2 as a potential key gene for sepsis diagnosis, and we are unaware of previous studies showing an association between UBE2Q2 and sepsis.
Our study also has certain limitations. First, the data for this analysis were from public databases and involved small samples, which may lead to biased interpretation of the results. Second, molecular experiments for validation are missing, and follow-up with larger clinical samples is needed to validate our main results. Third, further study is required to confirm whether methylation modifications found in key genes are associated with the progression of sepsis.
Conclusion
The present study demonstrated heightened metabolic response and suppressed immune response in patients with sepsis and septic shock. The nine key genes that we identified may be useful for diagnosing sepsis and monitoring its development, while their specific functions and mechanisms in the disease need further study. Indeed, further experimental analysis is needed to validate our major results.
Data Sharing Statement
Data were downloaded from the Gene Expression Omnibus (GEO) database (https://www.ncbi.nlm.nih.gov/geo/).
Acknowledgments
This study was supported by the National Natural Science Foundation of China (81960343), the Guangxi Natural Science Foundation (2017GXNSFAA198249), the Scientific Research Fund of the Population and Family Planning Commission of Guangxi Zhuang Autonomous Region (S2017009) and the High-level Medical Expert Training Program of Guangxi “139” Plan Fund (G201903027).
Disclosure
The authors report no conflicts of interest related to this work.
References
1. Singer M, Deutschman CS, Seymour CW, et al. The third international consensus definitions for sepsis and septic shock (Sepsis-3). JAMA. 2016;315(8):801–810. doi:10.1001/jama.2016.0287
2. Rudd KE, Johnson SC, Agesa KM, et al. Global, regional, and national sepsis incidence and mortality, 1990–2017: analysis for the Global Burden of Disease Study. Lancet. 2020;395(10219):200–211. doi:10.1016/S0140-6736(19)32989-7
3. Markwart R, Saito H, Harder T, et al. Epidemiology and burden of sepsis acquired in hospitals and intensive care units: a systematic review and meta-analysis. Intensive Care Med. 2020;46(8):1536–1551. doi:10.1007/s00134-020-06106-2
4. Hotchkiss RS, Moldawer LL, Opal SM, Reinhart K, Turnbull IR, Vincent JL. Sepsis and septic shock. Nat Rev Dis Primers. 2016;2:16045. doi:10.1038/nrdp.2016.45
5. Teggert A, Datta H, Ali Z. Biomarkers for point-of-care diagnosis of sepsis. Micromachines. 2020;11(3). doi:10.3390/mi11030286
6. Bandyopadhyay S, Lysak N, Adhikari L, et al. Discovery and validation of urinary molecular signature of early sepsis. Crit Care Explor. 2020;2(10):e0195. doi:10.1097/CCE.0000000000000195
7. Gatewood MO, Wemple M, Greco S, Kritek PA, Durvasula R. A quality improvement project to improve early sepsis care in the emergency department. BMJ Qual Saf. 2015;24(12):787–795. doi:10.1136/bmjqs-2014-003552
8. Seymour CW, Gesten F, Prescott HC, et al. Time to treatment and mortality during mandated emergency care for sepsis. N Engl J Med. 2017;376(23):2235–2244. doi:10.1056/NEJMoa1703058
9. Centner FS, Schoettler JJ, Fairley AM, et al. Impact of different consensus definition criteria on sepsis diagnosis in a cohort of critically ill patients-Insights from a new mathematical probabilistic approach to mortality-based validation of sepsis criteria. PLoS One. 2020;15(9):e0238548. doi:10.1371/journal.pone.0238548
10. Zhai J, Qi A, Zhang Y, Jiao L, Liu Y, Shou S. Bioinformatics analysis for multiple gene expression profiles in sepsis. Med Sci Monit. 2020;26:e920818. doi:10.12659/MSM.920818
11. Boomer JS, To K, Chang KC, et al. Immunosuppression in patients who die of sepsis and multiple organ failure. JAMA. 2011;306(23):2594–2605. doi:10.1001/jama.2011.1829
12. Hotchkiss RS, Nicholson DW. Apoptosis and caspases regulate death and inflammation in sepsis. Nat Rev Immunol. 2006;6(11):813–822. doi:10.1038/nri1943
13. Alejandria MM, Lansang MA, Dans LF, Mantaring JB
14. Qiu P, Cui X, Barochia A, Li Y, Natanson C, Eichacker PQ. The evolving experience with therapeutic TNF inhibition in sepsis: considering the potential influence of risk of death. Expert Opin Investig Drugs. 2011;20(11):1555–1564. doi:10.1517/13543784.2011.623125
15. Lorente-Sorolla C, Garcia-Gomez A, Catala-Moll F, et al. Inflammatory cytokines and organ dysfunction associate with the aberrant DNA methylome of monocytes in sepsis. Genome Med. 2019;11(1):66. doi:10.1186/s13073-019-0674-2
16. Cao L, Zhu T, Lang X, et al. Inhibiting DNA methylation improves survival in severe sepsis by regulating NF-kappaB pathway. Front Immunol. 2020;11:1360. doi:10.3389/fimmu.2020.01360
17. Feng J, Pang J, He D, et al. Identification of genes with altered methylation and its role in early diagnosis of sepsis-induced acute respiratory distress syndrome. Int J Gen Med. 2021;14:243–253. doi:10.2147/IJGM.S287960
18. Du P, Kibbe WA, Lin SM. lumi: a pipeline for processing Illumina microarray. Bioinformatics. 2008;24(13):1547–1548. doi:10.1093/bioinformatics/btn224
19. Love MI, Huber W, Anders S. Moderated estimation of fold change and dispersion for RNA-seq data with DESeq2. Genome Biol. 2014;15(12):550. doi:10.1186/s13059-014-0550-8
20. Langfelder P, Horvath S. WGCNA: an R package for weighted correlation network analysis. BMC Bioinform. 2008;9:559. doi:10.1186/1471-2105-9-559
21. Ritchie ME, Phipson B, Wu D, et al. limma powers differential expression analyses for RNA-sequencing and microarray studies. Nucleic Acids Res. 2015;43(7):e47. doi:10.1093/nar/gkv007
22. Yu G, Wang LG, Han Y, He QY. clusterProfiler: an R package for comparing biological themes among gene clusters. OMICS. 2012;16(5):284–287. doi:10.1089/omi.2011.0118
23. Hanzelmann S, Castelo R, Guinney J. GSVA: gene set variation analysis for microarray and RNA-seq data. BMC Bioinform. 2013;14:7. doi:10.1186/1471-2105-14-7
24. Bindea G, Mlecnik B, Tosolini M, et al. Spatiotemporal dynamics of intratumoral immune cells reveal the immune landscape in human cancer. Immunity. 2013;39(4):782–795. doi:10.1016/j.immuni.2013.10.003
25. Robin X, Turck N, Hainard A, et al. pROC: an open-source package for R and S+ to analyze and compare ROC curves. BMC Bioinform. 2011;12:77. doi:10.1186/1471-2105-12-77
26. Ernst J, Bar-Joseph Z. STEM: a tool for the analysis of short time series gene expression data. BMC Bioinform. 2006;7:191. doi:10.1186/1471-2105-7-191
27. Tian Y, Morris TJ, Webster AP, et al. ChAMP: updated methylation analysis pipeline for Illumina BeadChips. Bioinformatics. 2017;33(24):3982–3984. doi:10.1093/bioinformatics/btx513
28. Mohammed A, Cui Y, Mas VR, Kamaleswaran R. Differential gene expression analysis reveals novel genes and pathways in pediatric septic shock patients. Sci Rep. 2019;9(1):11270. doi:10.1038/s41598-019-47703-6
29. Manatakis DV, VanDevender A, Manolakos ES. An information-theoretic approach for measuring the distance of organ tissue samples using their transcriptomic signatures. Bioinformatics. 2020. doi:10.1093/bioinformatics/btaa654
30. Coopersmith CM, De Backer D, Deutschman CS, et al. Surviving sepsis campaign: research priorities for sepsis and septic shock. Intensive Care Med. 2018;44(9):1400–1426. doi:10.1007/s00134-018-5175-z
31. de Haan N, Boeddha NP, Ekinci E, et al. Differences in IgG Fc glycosylation are associated with outcome of pediatric meningococcal sepsis. mBio. 2018;9(3). doi:10.1128/mBio.00546-18
32. Kolev M, Markiewski MM. Targeting complement-mediated immunoregulation for cancer immunotherapy. Semin Immunol. 2018;37:85–97. doi:10.1016/j.smim.2018.02.003
33. Schenz J, Tamulyte S, Nusshag C, et al. Population-specific metabolic alterations in professional antigen-presenting cells contribute to sepsis-associated immunosuppression. Shock. 2020;53(1):5–15. doi:10.1097/SHK.0000000000001337
34. Xie M, Yu Y, Kang R, et al. PKM2-dependent glycolysis promotes NLRP3 and AIM2 inflammasome activation. Nat Commun. 2016;7:13280. doi:10.1038/ncomms13280
35. Cheng SC, Scicluna BP, Arts RJ, et al. Broad defects in the energy metabolism of leukocytes underlie immunoparalysis in sepsis. Nat Immunol. 2016;17(4):406–413. doi:10.1038/ni.3398
36. Hotchkiss RS, Tinsley KW, Swanson PE, et al. Sepsis-induced apoptosis causes progressive profound depletion of B and CD4+ T lymphocytes in humans. J Immunol. 2001;166(11):6952–6963. doi:10.4049/jimmunol.166.11.6952
37. Markwart R, Condotta SA, Requardt RP, et al. Immunosuppression after sepsis: systemic inflammation and sepsis induce a loss of naive T-cells but no enduring cell-autonomous defects in T-cell function. PLoS One. 2014;9(12):e115094. doi:10.1371/journal.pone.0115094
38. Jensen IJ, Sjaastad FV, Griffith TS, Badovinac VP. Sepsis-induced T cell immunoparalysis: the ins and outs of impaired T cell immunity. J Immunol. 2018;200(5):1543–1553. doi:10.4049/jimmunol.1701618
39. Patil NK, Bohannon JK, Sherwood ER. Immunotherapy: a promising approach to reverse sepsis-induced immunosuppression. Pharmacol Res. 2016;111:688–702. doi:10.1016/j.phrs.2016.07.019
40. Peyssonnaux C, Cejudo-Martin P, Doedens A, Zinkernagel AS, Johnson RS, Nizet V. Cutting edge: essential role of hypoxia inducible factor-1alpha in development of lipopolysaccharide-induced sepsis. J Immunol. 2007;178(12):7516–7519. doi:10.4049/jimmunol.178.12.7516
41. Kiss J, Mollenhauer M, Walmsley SR, et al. Loss of the oxygen sensor PHD3 enhances the innate immune response to abdominal sepsis. J Immunol. 2012;189(4):1955–1965. doi:10.4049/jimmunol.1103471
42. Tannahill GM, Curtis AM, Adamik J, et al. Succinate is an inflammatory signal that induces IL-1beta through HIF-1alpha. Nature. 2013;496(7444):238–242. doi:10.1038/nature11986
43. Fitzpatrick SF. Immunometabolism and Sepsis: a Role for HIF? Front Mol Biosci. 2019;6:85. doi:10.3389/fmolb.2019.00085
44. Kothari N, Bogra J, Abbas H, et al. Tumor necrosis factor gene polymorphism results in high TNF level in sepsis and septic shock. Cytokine. 2013;61(2):676–681. doi:10.1016/j.cyto.2012.11.016
45. Georgescu AM, Banescu C, Azamfirei R, et al. Evaluation of TNF-alpha genetic polymorphisms as predictors for sepsis susceptibility and progression. BMC Infect Dis. 2020;20(1):221. doi:10.1186/s12879-020-4910-6
46. Wu HP, Chung K, Lin CY, Jiang BY, Chuang DY, Liu YC. Associations of T helper 1, 2, 17 and regulatory T lymphocytes with mortality in severe sepsis. Inflamm Res. 2013;62(8):751–763. doi:10.1007/s00011-013-0630-3
47. Unsinger J, McGlynn M, Kasten KR, et al. IL-7 promotes T cell viability, trafficking, and functionality and improves survival in sepsis. J Immunol. 2010;184(7):3768–3779. doi:10.4049/jimmunol.0903151
48. Xue M, Xie J, Liu L, et al. Early and dynamic alterations of Th2/Th1 in previously immunocompetent patients with community-acquired severe sepsis: a prospective observational study. J Transl Med. 2019;17(1):57. doi:10.1186/s12967-019-1811-9
49. McBride MA, Owen AM, Stothers CL, et al. The metabolic basis of immune dysfunction following sepsis and trauma. Front Immunol. 2020;11:1043. doi:10.3389/fimmu.2020.01043
50. Vachharajani V, McCall CE. Epigenetic and metabolic programming of innate immunity in sepsis. Innate Immun. 2019;25(5):267–279. doi:10.1177/1753425919842320
51. Zeng D, Li M, Zhou R, et al. Tumor microenvironment characterization in gastric cancer identifies prognostic and immunotherapeutically relevant gene signatures. Cancer Immunol Res. 2019;7(5):737–750. doi:10.1158/2326-6066.CIR-18-0436
52. Yang J, Zhang S, Zhang J, et al. Identification of key genes and pathways using bioinformatics analysis in septic shock children. Infect Drug Resist. 2018;11:1163–1174. doi:10.2147/IDR.S157269
53. Huang L, Qiao L, Zhu H, Jiang L, Yin L. Genomics of neonatal sepsis: has-miR-150 targeting BCL11B functions in disease progression. Ital J Pediatr. 2018;44(1):145. doi:10.1186/s13052-018-0575-9
54. Wu W, Zhang W, Choi M, et al. Vascular smooth muscle-MAPK14 is required for neointimal hyperplasia by suppressing VSMC differentiation and inducing proliferation and inflammation. Redox Biol. 2019;22:101137. doi:10.1016/j.redox.2019.101137
55. Lowell CA. Src-family and Syk kinases in activating and inhibitory pathways in innate immune cells: signaling cross talk. Cold Spring Harb Perspect Biol. 2011;3(3):a002352–a002352. doi:10.1101/cshperspect.a002352
56. Kovacs M, Nemeth T, Jakus Z, et al. The Src family kinases Hck, Fgr, and Lyn are critical for the generation of the in vivo inflammatory environment without a direct role in leukocyte recruitment. J Exp Med. 2014;211(10):1993–2011. doi:10.1084/jem.20132496
57. Gong FC, Ji R, Wang YM, et al. Identification of potential biomarkers and immune features of sepsis using bioinformatics analysis. Mediators Inflamm. 2020;2020:3432587. doi:10.1155/2020/3432587
58. Chen M, Chen X, Hu Y, Cai X. Screening of key genes related to the prognosis of mouse sepsis. Biosci Rep. 2020;40(10). doi:10.1042/BSR20202649
59. Chen H, Li Y, Li T, et al. Identification of potential transcriptional biomarkers differently expressed in both S. aureus- and E. coli-induced sepsis via integrated analysis. Biomed Res Int. 2019;2019:2487921. doi:10.1155/2019/2487921
60. Yang YX, Li L. Identification of potential biomarkers of sepsis using bioinformatics analysis. Exp Ther Med. 2017;13(5):1689–1696. doi:10.3892/etm.2017.4178
61. Balagopalan L, Malik H, McIntire KM, et al. Bypassing ubiquitination enables LAT recycling to the cell surface and enhanced signaling in T cells. PLoS One. 2020;15(2):e0229036. doi:10.1371/journal.pone.0229036
62. Meng Y, Cai XH, Wang L. Potential genes and pathways of neonatal sepsis based on functional gene set enrichment analyses. Comput Math Methods Med. 2018;2018:6708520. doi:10.1155/2018/6708520
63. Sharma-Kuinkel BK, Zhang Y, Yan Q, Ahn SH, Fowler VG
64. Huang W, Morales JL, Gazivoda VP, August A. Nonreceptor tyrosine kinases ITK and BTK negatively regulate mast cell proinflammatory responses to lipopolysaccharide. J Allergy Clin Immunol. 2016;137(4):1197–1205. doi:10.1016/j.jaci.2015.08.056
65. Lu J, Li Q, Wu Z, et al. Two gene set variation indexes as potential diagnostic tool for sepsis. Am J Transl Res. 2020;12(6):2749–2759.
66. Almansa R, Heredia-Rodriguez M, Gomez-Sanchez E, et al. Transcriptomic correlates of organ failure extent in sepsis. J Infect. 2015;70(5):445–456. doi:10.1016/j.jinf.2014.12.010
 © 2021 The Author(s). This work is published and licensed by Dove Medical Press Limited. The
full terms of this license are available at https://www.dovepress.com/terms
and incorporate the Creative Commons Attribution
- Non Commercial (unported, 3.0) License.
By accessing the work you hereby accept the Terms. Non-commercial uses of the work are permitted
without any further permission from Dove Medical Press Limited, provided the work is properly
attributed. For permission for commercial use of this work, please see paragraphs 4.2 and 5 of our Terms.
© 2021 The Author(s). This work is published and licensed by Dove Medical Press Limited. The
full terms of this license are available at https://www.dovepress.com/terms
and incorporate the Creative Commons Attribution
- Non Commercial (unported, 3.0) License.
By accessing the work you hereby accept the Terms. Non-commercial uses of the work are permitted
without any further permission from Dove Medical Press Limited, provided the work is properly
attributed. For permission for commercial use of this work, please see paragraphs 4.2 and 5 of our Terms.