Back to Journals » Journal of Inflammation Research » Volume 19
Screening and Preliminary Validation of Parthanatos-Related Key Genes in Asthma Using Transcriptomic and Machine Learning Approaches
Authors Zhao J ![]() , Li D
, Li D ![]() , Yang C
, Yang C ![]() , Liu C, Ma X
, Liu C, Ma X ![]()
Received 21 August 2025
Accepted for publication 8 January 2026
Published 22 January 2026 Volume 2026:19 557154
DOI https://doi.org/10.2147/JIR.S557154
Checked for plagiarism Yes
Review by Single anonymous peer review
Peer reviewer comments 4
Editor who approved publication: Prof. Dr. Yuhan Xing
Jiawei Zhao,1,* Danni Li,2,* Chunli Yang,3 Chunyan Liu,1 Xiaolin Ma1
1Department of Pediatrics, The Fifth Affiliated Hospital of Dali University (Baoshan People’s hospital), Baoshan, People’s Republic of China; 2Department of Neonatology, The Fifth Affiliated Hospital of Dali University (Baoshan People’s hospital), Baoshan, People’s Republic of China; 3Department of Gynecology, The Fifth Affiliated Hospital of Dali University (Baoshan People’s Hospital), Baoshan, People’s Republic of China
*These authors contributed equally to this work
Correspondence: Xiaolin Ma, Baoshan People’s Hospital, Qingyang Road& Longquan Road, Longyang District, Baoshan, Yunnan, People’s Republic of China, Tel +8613312791321, Email [email protected]
Purpose: Parthanatos, a Poly polymerase 1 mediated programmed cell death pathway, remains poorly characterized in asthma pathogenesis. This study integrated transcriptomic data from public asthma datasets and parthanatos-related genes (PRGs) to identify the key molecular players.
Patients and Methods: Asthma-related datasets GSE69683 (411 asthma and 87 control samples) and GSE134544 (10 asthma and 21 control samples) were obtained from public databases. Through differential expression analysis, weighted gene co-expression network analysis (WGCNA), and machine learning, three genes (ANXA3, CEACAM6, and 8d) were prioritized. Functional enrichment linked these genes to inflammatory and metabolic pathways, including complement/coagulation cascades, spliceosomes, and citrate cycle.
Results: Immune infiltration analysis revealed significant disparities in naive B cells, eosinophils, neutrophils, resting mast cells, and CD8 + T cells between asthmatic and control groups. These genes are correlated with lung injury, neoplasms, and broader respiratory diseases, highlighting their clinical relevance. Predictive analysis identified environmental compounds (eg benzo(a)pyrene, and estradiol) interacting with all three genes, suggesting therapeutic targets. Preliminary experimental validation via RT-qPCR suggested the upregulation of CEACAM6 and CRISP3 expression in asthmatic blood samples.
Conclusion: In conclusion, we identified and preliminarily validated ANXA3, CEACAM6, and CRISP3 as parthanatos-related key genes in asthma, providing a foundational gene signature for subsequent research into asthma diagnostics and mechanisms.
Keywords: asthma, parthanatos, key genes, enrichment analysis, immune infiltration
Introduction
Asthma is a widespread long-term inflammatory condition that affects bronchial passages and is defined by sustained bronchial hyperreactivity and persistent inflammatory activity, manifesting clinically through recurrent wheezing episodes, dyspnea, and thoracic constriction.1,2 Global epidemiological data from 2019 indicate that asthma affects approximately 262 million individuals worldwide, 5–10% of asthmatics developing severe phenotypes. Notably, one subset demonstrates refractory symptomatology that is unresponsive to optimized inhaled corticosteroid (ICS) regimens combined with adjunctive controller therapies.3 Patients with severe asthma face numerous formidable challenges: they are at an increased risk of exacerbations, hospitalization, and mortality, leading to poor quality of life and imposing a significant socioeconomic burden.4 Emerging evidence implicates multifactorial determinants of asthma exacerbation severity, including hypovitaminosis D, dysbiosis of enteric and bronchial microbiota, inhalation exposure to cigarette smoke, ambient particulate matter, hereditary predisposition loci, and diverse environmental cofactors.5 Emerging research has proposed a precision medicine framework employing phenotypic profiling of modifiable biomarkers with demonstrated translational capacity for refining diagnostic specificity and implementing dynamic therapeutic algorithms. However, the etiopathogenetic mechanisms underlying asthmatic disease progression remain incompletely delineated.6 These pathophysiological uncertainties underscore the necessity of implementing advanced diagnostic protocols with temporal precision, concurrent with pioneering translational research pipelines targeting novel molecular phenotyping and pharmacotherapeutic discovery, to optimize therapeutic stratification of asthmatic disorders.
Parthanatos is a specialized cell death modality characterized by PARP-1 hyperactivation-mediated chromatinolysis, exhibiting pathophysiological signatures distinct from canonical programmed cell death mechanisms.7 PARP1-mediated cell death is triggered by excessive activation of poly ADP-ribose polymerase-1 following exposure to pathological conditions, including oxidative damage and inflammatory responses.8 PARP-1 is a pivotal stress-responsive enzyme that consists of 1014 amino acids, has a total molecular weight of approximately 113 kDa, and contributes to the maintenance of genomic stability and DNA repair.9,10 Pathological stimuli induce excessive PARP-1 activation, resulting in abnormal accumulation of poly(ADP-ribose) polymers. The synthesized PAR polymers subsequently translocate from the nuclear compartment to the cytoplasmic space via membrane transport mechanisms. Within the cytoplasmic milieu, mobilized PAR species specifically interact with apoptosis-inducing factor (AIF), forming molecular complexes that facilitate AIF’s retrograde trafficking of AIF to the nuclear region. This subcellular redistribution culminates in the activation of parthanatos, a distinct caspase-independent programmed cell death pathway.10,11 As a non-apoptotic form of regulated necrosis, parthanatos induce cell death through chromatin destabilization and plasma membrane permeabilization. This molecular pathway contributes to the pathogenesis of multiple disorders by mediating genomic instability and inflammatory signaling activation through damage-associated molecular pattern (DAMP) release.8 Bronchial epithelium obtained from chronic smokers demonstrated upregulated parthanato signaling, as evidenced by PAR polymer accumulation and nuclear-to-cytoplasmic AIF translocation. Pharmacological PARP-1 suppression through talazoparib (BMN673) administration significantly attenuated cigarette smoke extract-induced parthanato activation, as quantified by reduced PARylation and mitochondrial-nuclear AIF redistribution in primary HBE cultures.12 The overexpression of PARP1 activates the expression of inflammatory cytokines and signalling pathways in macrophages.13 In intestinal epithelial models, oxidative stress-mediated genomic instability triggers sequential molecular events. PARP-1 hyperactivation leads to excessive poly, mitochondrial-nuclear shuttling of apoptosis-inducing factors, collectively activating the parthanato cascade. This programmed necrosis pathway subsequently amplifies inflammatory signaling.14 Parthanatoss-mediated inflammation plays a crucial role in disease progression. While apoptosis and necroptosis have been studied in asthma, the specific role of PARP1-dependent parthanatos remains largely unexplored. A systematic analysis to identify key drivers of this pathway in the asthmatic airway is lacking.
We hypothesized that parthanatos contributes to asthma pathology, and that key genes driving this process could be identified through a comprehensive bioinformatic approach. Therefore, this study was based on transcriptomic data from public databases and employed bioinformatic methods to identify key genes related to parthanatos in asthma. A deep learning architecture was engineered using the identified genetic biomarkers, implementing a feedforward neural network for diagnostic prediction modeling. Subsequently, the immune microenvironment, enriched pathways, and regulatory networks were analyzed to determine their potential roles. Finally, drug predictions were made based on key genes. Furthermore, the validation of key genes in clinical samples is essential. In summary, this study is based on publicly available transcriptomic data of asthma and aims to screen key genes associated with parthanatos in asthma using bioinformatics and machine learning methods, reveal their potential mechanisms of action, and evaluate their potential as diagnostic biomarkers.
Materials and Methods
Data Collection
Asthma-related datasets (GSE69683 and GSE134544) were downloaded from Gene Expression Omnibus (GEO; http://www.ncbi.nlm.nih.gov/geo) database. GSE69683 (GPL13158), comprising 411 asthma and 87 control peripheral blood samples, was used as the training set. The GSE134544 repository (GPL10558) included 10 asthma and 21 control blood samples, and served as the validation set. The parthanatos-related genes (PRGs) used in this study were obtained by integrating gene sets from published literature. Specifically, we included nine genes reported by Li et al (Journal of Molecular Neuroscience, 2024)15 and twenty-three genes reported by Li et al (Medicine, 2024).16 After removing duplicates, a total of twenty-nine unique PRGs were acquired for subsequent analyses.
Differential Expression Analysis
The linear modeling framework (version 3. 54. 0)17 was utilized to conduct differential expression analysis to detect differentially expressed genes (DEGs) between the asthmatic and non-asthmatic groups in the training set. DEGs were identified using a significance threshold of p < 0. 05 and |log2Fold Change (FC)| > 0. 5. Subsequently, ggplot2 (v3. 4. 4)18 was implemented to construct a volcano map of DEGs, whereas the pheatmap library (v1. 0. 12)19 was used to generate heat maps depicting the top ten upregulated and downregulated DEGs.
Weighted Gene Co-Expression Network Analysis (WGCNA)
Initially, single-sample gene set enrichment analysis (ssGSEA) scores of PRGs expressed in the training set were calculated across all samples using GSVA package (version 1. 46. 0).20 The Wilcoxon test (p < 0. 05) was used to analyze the differences in ssGSEA scores between patients with asthma and controls. WGCNA was conducted on the training set to identify module genes highly correlated with ssGSEA scores, using the WGCNA package (version 1. 71).21 Hierarchical clustering based on Euclidean distances of expression levels was performed to detect potential outliers among samples. Subsequently, optimal soft thresholding (β) was implemented for co-expression network construction, with a threshold set with R2 at an appropriate value and mean connectivity near 0 to achieve a scale-free topology. This approach ensures that the network accurately reflects the underlying biological relationships. Gene modules were identified using the following specific parameters: minModuleSize = 100, deepSplit = 4, and mergeCutHeight = 0.2. These settings helped to delineate distinct gene modules from the co-expression network. To identify key modules, correlation analysis was conducted between the ssGSEA scores (as traits) and gene modules. Key modules defined by strong correlations (|cor| > 0.3, p < 0.05) were selected. Genes within these key modules were designated as key module genes that were potentially implicated in the biological processes under investigation.
Identification and Enrichment Analysis of Candidate Genes
Candidate genes were identified by intersecting DEGs with key module genes. To explore their biological functions and related signaling pathways, GO and KEGG enrichment analyses were performed using the clusterProfiler package (version 4. 7. 1. 003)22 with the significance set at p < 0. 05. GO terms encompassed biological processes (BP), cellular components (CC), and molecular functions (MF). Further investigation into functionally related candidate genes and their associated functions was performed using GeneMANIA (http://www.genemania.org/).
Screening of Key Genes
Candidate signature genes were initially identified and screened using machine learning algorithms, specifically LASSO and Boruta, which were performed using glmnet (version 4. 1–4)23 and Boruta package (version 8. 0. 0).24 Feature genes identified by both algorithms were then intersected to derive candidate key genes. Following this analytical phase, we performed a comparative analysis of the transcriptional profiles of the candidate key genes in the asthmatic and non-asthmatic groups in the training and validation sets (p < 0. 05). Genes showing significant differences between the asthma and control groups, with consistent trends across both sets, were designated as the key genes.
Functional Analysis of Key Genes
After identifying the key genes, an artificial neural network (ANN) was developed to assess their diagnostic utility using the neuralnet package (version 1. 44. 2),25 receiver operating characteristic (ROC) curves were employed to quantify the discriminative capacity in the training and validation sets. Intergene relationships were assessed using Spearman correlation coefficient and the corrplot package (version 0. 92)26 was employed to visualize significant correlations (|cor| > 0. 3, p < 0. 05) in a heatmap. Protein-level classification of the key genes was performed using the PANTHER classification system (http://www.pantherdb.org). Gene Set Enrichment Analysis (GSEA) was conducted to explore the potential functional pathways associated with key genes using the clusterProfiler package (p < 0.05). First, the Spearman correlation coefficients of the key genes and all genes were calculated using the psych package (version 2.2.9)27 in the training set. All genes were ranked by correlation coefficients from large to small, and the corresponding lists of key genes were obtained. The “c2.cp.kegg.v7.4. symbols. gmt” was used as the reference genome repository from MSigDB. Upstream pathways influencing key genes were inferred using the SPEED2 database (https://speed2.sys-bio.net/), and chi-square analysis was used to detect grade changes in enriched pathways ranked accordingly based on these changes.
Immune Infiltration Analysis
Immunocyte infiltration is a critical determinant of disease defense mechanisms. Thus, the CIBERSORT algorithm was employed to analyze the infiltration of immunocytes across all samples in the training set (p < 0. 05), revealing distinct immunocyte compositional disparities between asthmatic and non-asthmatic groups. (p <0.05). Spearman correlation analysis was then applied to delineate the interactions between key genes and phenotype-specific immune cells (|cor| > 0.3, p < 0.05).
RNA Modification Analysis of Key Genes
m6A methylation is a chemical modification that occurs on an RNA molecule, serving as a key regulatory mechanism that governs mRNA processing, and has been demonstrated to exert significant functional impacts across multiple physiological pathways. Nucleotide sequence data of the key genes were acquired from the National Center for Biotechnology Information (NCBI, https://www.ncbi.nlm.nih.gov/), and the m6A site of each key gene was predicted using SRAMP (http://www.cuilab.cn/sramp/).
Regulatory Network Analysis
To explore the molecular regulatory mechanisms of key genes, microRNAs (miRNAs) targeting key genes were predicted using ENCORI (https://starbase.sysu.edu.cn/) and miRWalk (http://mirwalk.umm.uni-heidelberg.de/) databases. Key miRNAs were identified through an intersection analysis of the two databases. After that, upstream transcription factors (TFs) were predicted using JASPAR database (https://jaspar.elixir.no/). Finally, Cytoscape software (version 3.9.1)28 was used to visualize the TF-miRNA-key gene regulatory network.
Disease Association Analysis and Compound Prediction
We used a comparative toxicogenomics database (CTD, http://ctdbase.org/) to explore the involvement of key genes in other respiratory tract diseases. This database was used to investigate the relationships between respiratory tract diseases and key genes and to quantify their interaction scores. Bar diagrams were generated to highlight diseases that were significantly associated with each key gene. Additionally, the CTD was used to predict potential compounds or molecular compounds linked to these key genes. The resulting interactions were visualized using the Cytoscape software, illustrating an interaction network between genes and their associated compounds.
Expression Analysis of Key Genes
To preliminarily explore and verify the expression of key genes in clinical samples, we collected 10 blood samples (5 from clinically confirmed asthma cases and 5 from demographically matched healthy donors) for reverse transcription quantitative polymerase chain reaction (RT-qPCR) experiments after reviewing similar studies.29,30 Asthma diagnostic criteria reference the 2025 GINA Global Strategy for Asthma Management and Prevention: The diagnosis is established by the presence of typical variable respiratory symptoms (such as wheeze, shortness of breath, chest tightness, and cough) together with the objective confirmation of variable expiratory airflow limitation. Key evidence includes a positive bronchodilator test (an increase in FEV1 of ≥12% and ≥200 mL), an average daily diurnal peak expiratory flow (PEF) variability of >13%, or a significant improvement in lung function after 4 weeks of anti-inflammatory treatment. Furthermore, a FeNO level greater than 35 ppb or an elevated blood eosinophil count provides definitive supportive evidence for a Type 2 asthma phenotype.31 As shown in Table 1, the demographic information for all donors is summarized. This research protocol has been approved by the Ethics Committee of Baoshan People’s Hospital, No. 2024LL12-024-001.
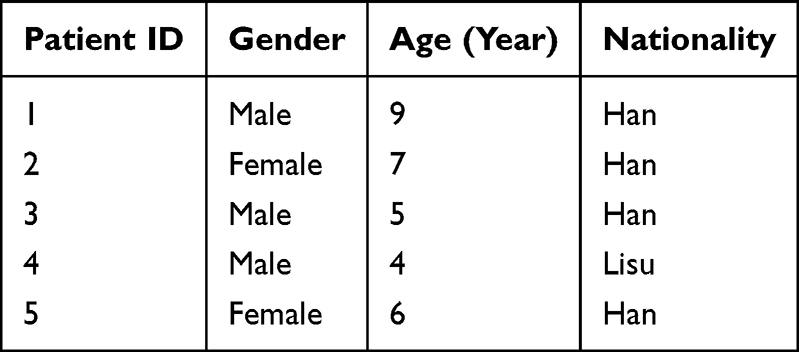 |
Table 1 Baseline Demographics of All Donors |
RT-qPCR was performed using an S1000™ Thermal Cycler ordinary PCR instrument (Bio-Rad) and a CFX Connect real-time quantitative fluorescence PCR instrument (Bio-Rad). Total RNA was isolated from whole blood specimens using TRIzol reagent (Ambion) RNA was subjected to reverse transcription using a SweScript First Strand cDNA synthesis kit. cDNA was generated by reverse transcription using the SweScript First Strand cDNA synthesis kit. Each RT-qPCR reaction system contained 3µL cDNA, 5µL 2x Universal Blue SYBR Green qPCR Master Mix, 1µL forward primer and 1µL reverse primer. The primers used are listed in Table 2. Differences in gene expression between the asthma and control groups were analyzed using t-tests. P < 0. 05 was considered statistically significant. There were two groups (asthma and normal control), and each group had five biological replicates.
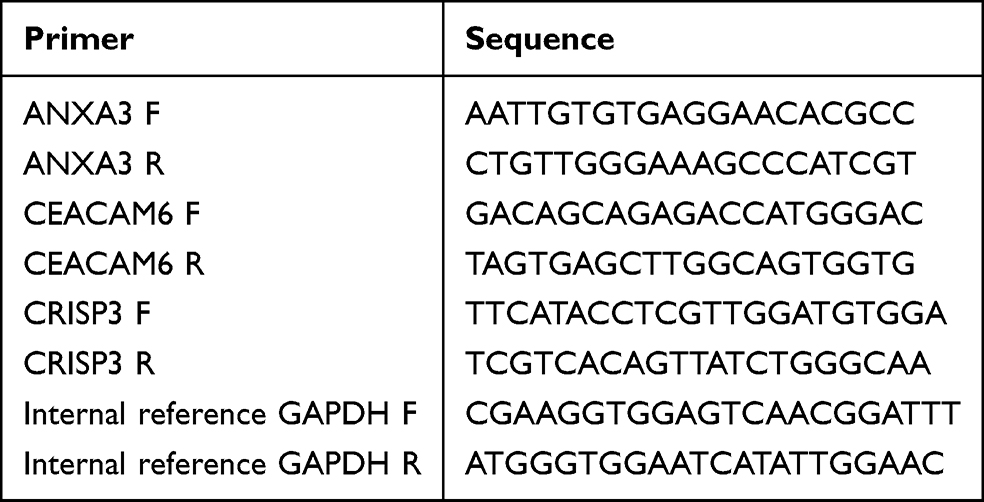 |
Table 2 Primers of Key Genes (ANXA3, CEACAM6, CRISP3, Internal Reference GAPDH) |
Statistical Analysis
Analyses were performed using R programming language (version 4.2.2). The Wilcoxon rank-sum test was used to compare differences between the two groups. Statistical significance was set at P < 0.05. All the analytical processes of this study are shown in Figure 1.
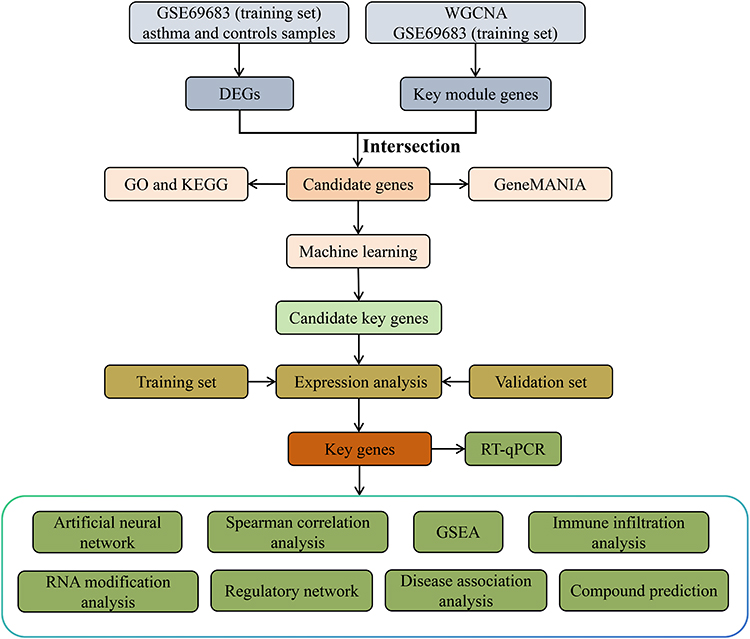 |
Figure 1 The analysis flowchart of this study. |
Results
Identification of DEGs and Key Module Genes in Asthma
From the training set, 50 genes showed differential expression, identifying DEGs, with 38 upregulated and 12 downregulated genes in asthma (Figure 2a and b). Among the 29 PRGs, 25 genes were expressed in the training set and their PRGs ssGSEA scores were significantly lower in the asthma group (Figure 2c). No outliers were found in the training set; therefore, all the samples were retained for further analysis (Figure S1). The optimal soft thresholding (β) (R2 = 0. 85, mean connectivity approaching 0) chosen for constructing a scale-free network was 7, resulting in 12 co-expression modules (Figure 2d and e). Among these modules, the tan (cor = 0. 55, p < 0. 05), and magenta (cor = −0. 54, p < 0. 05) modules displayed the highest positive and negative correlations with ssGSEA score, identifying them as key modules (Figure 2f). A total of 1065 genes within these modules were designated as key module genes.
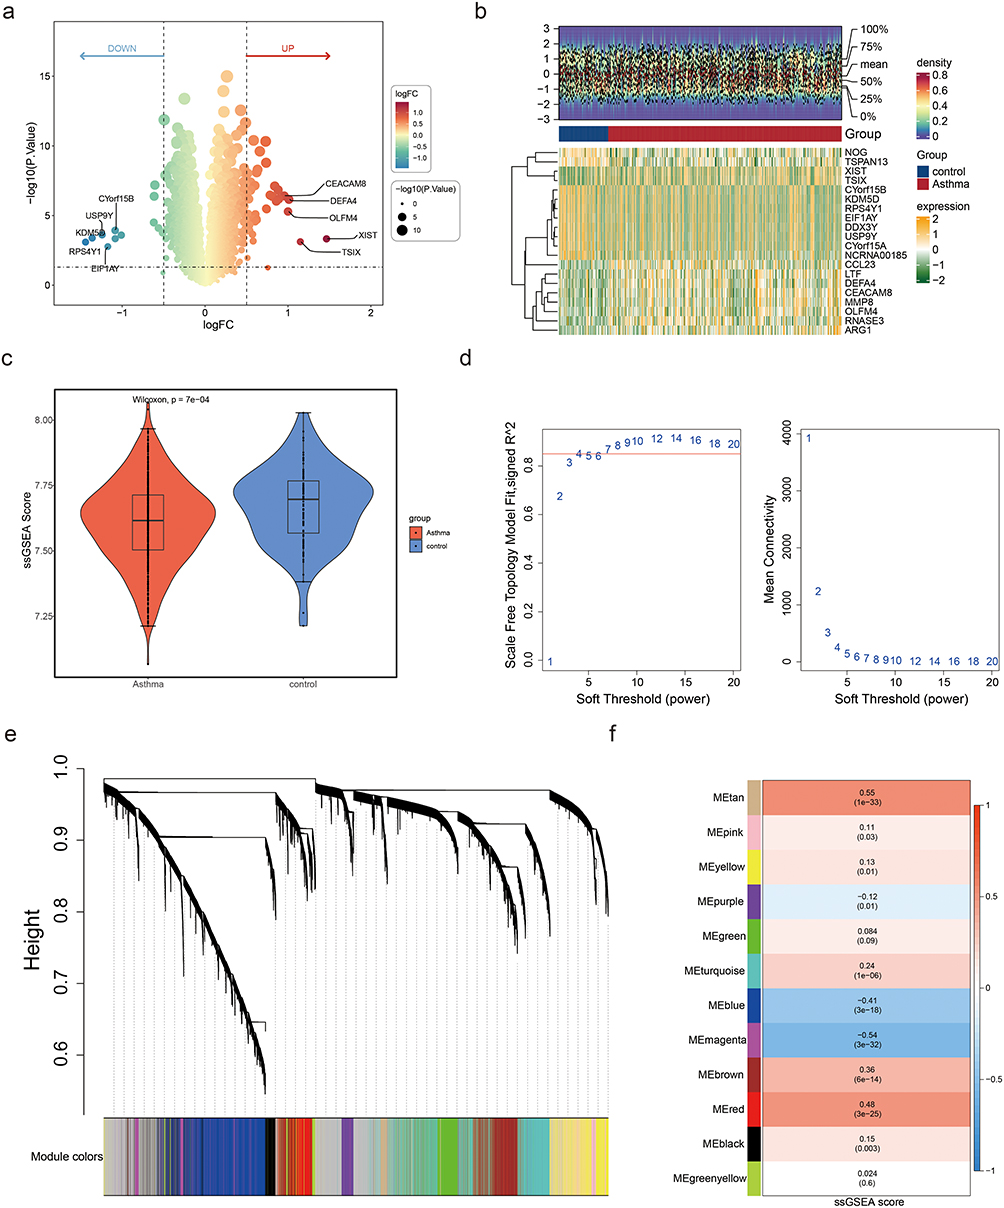 |
Figure 2 Identification of differentially expressed genes (DEGs) and key modules. (a) Volcano plot displaying DEGs between asthma and control groups. Thresholds: |log2FC| > 0.5, p < 0.05. (b) Heat maps of the top 10 upregulated genes and the top 10 downregulated genes ranked by the difference multiple log2FC. (c) Box plot comparing ssGSEA scores of parthanatos-related genes (PRGs) between asthma and control groups. Wilcoxon test confirmed significant reduction in asthma (p = 7×10⁻⁴). (d) Soft threshold selection for WGCNA. Left: Scale-free topology fit (signed R2) vs soft threshold power. Right: Mean connectivity vs power. A power of 7 (red line) was chosen to achieve scale-free topology (R2 = 0.85). (e) Hierarchical clustering dendrogram of co-expressed genes. Modules are color-coded (eg, tan, magenta). The height axis represents dissimilarity between gene clusters. (f) Module–trait correlations between gene co-expression modules and ssGSEA scores. MEtan (cor = 0.55, p = 1×10⁻³³) and MEmagenta (cor = −0.54, p = 3×10⁻³²) showed the strongest associations. Values indicate Pearson correlation coefficients (top) and significance (bottom). |
Corresponding Pathways Associated with Candidate Genes
The intersection of 50 DEGs and 1065 key module genes yielded 6 candidate genes (Figure 3a). Through enrichment analyses, 191 GO terms and 6 KEGG pathways of the 6 candidate genes were enriched. These GO terms included neutrophil-mediated immunity, specific granules, and phospholipase inhibitor activity (Figure 3b).
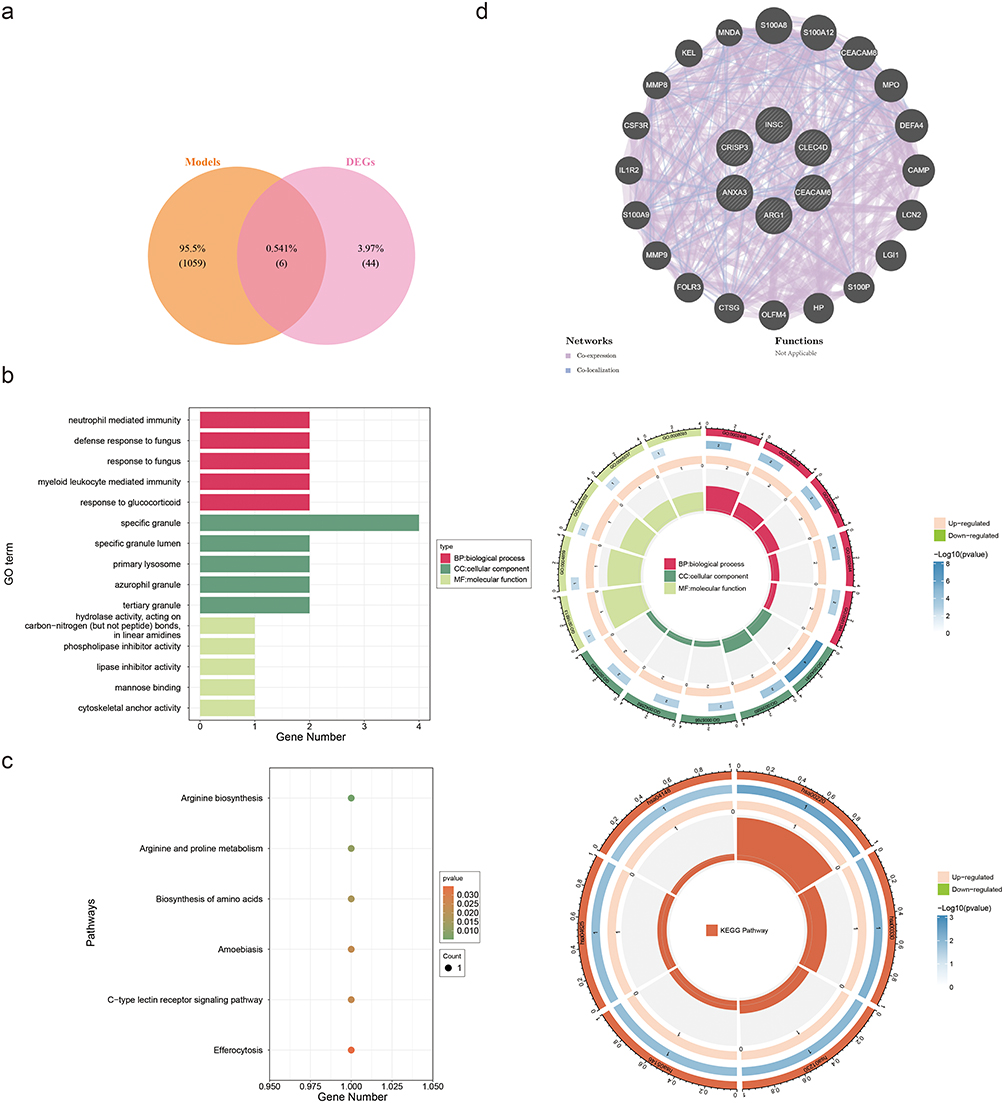 |
Figure 3 Functional enrichment and interaction networks of candidate genes. (a) Venn diagram illustrating the intersection of differentially expressed genes (DEGs, n= 50) and key module genes (n= 1065), yielding six candidate genes. (b) Gene Ontology (GO) enrichment analysis of candidate genes. Top terms include neutrophil-mediated immunity (biological process), specific granule (cellular component), and phospholipase inhibitor activity (molecular function). (c) Kyoto Encyclopedia of Genes and Genomes (KEGG) pathway enrichment. Key pathways: arginine biosynthesis, C-type lectin receptor signaling, and efferocytosis. (d) GeneMANIA network depicting functional associations of candidate genes (eg, S100A8, CEACAM8). Edges represent interaction types (co-expression, co-localization). |
KEGG pathway enrichment analysis revealed associations between arginine biosynthesis and its interconversion with proline, essential amino acid anabolic pathways, amoebiasis-related signaling cascades, the C-type lectin receptor signaling pathway, and efferocytosis (Figure 3c).
These signaling networks exert pivotal regulatory functions in the immune response, cell signal transduction, and metabolism in patients with asthma. Genes functionally related to candidate genes were identified from the GeneMANIA database, such as S100A8, S100A12, and CEACAM8, which are associated with functions such as secretory granule lumen, specific granules, and tertiary granules (Figure 3d).
ANXA3, CEACAM6 and CRISP3 Were Identified as Key Genes
We utilized machine-learning algorithms to select feature genes. The LASSO method identified four feature genes1 (ANXA3, CRISP3, CEACAM6, and INSC) that were not penalized to zero when lambda-min = 0.008089253 and log (lambda) = −4.817219 (Figure 4a). Subsequently, ANXA3, CLEC4D, ARG1, CRISP3, CEACAM6, and INSC were selected as feature genes2 using Boruta (Figure 4b). Feature genes1 and feature genes2 were intersected and yielded four candidate key genes: ANXA3, CRISP3, CEACAM6, and INSC (Figure 4c). Among these candidate key genes, ANXA3, CEACAM6, and CRISP3 exhibited notably higher expression in the asthma group in both datasets, thus identifying them as key genes associated with asthma (Figure 4d and e).
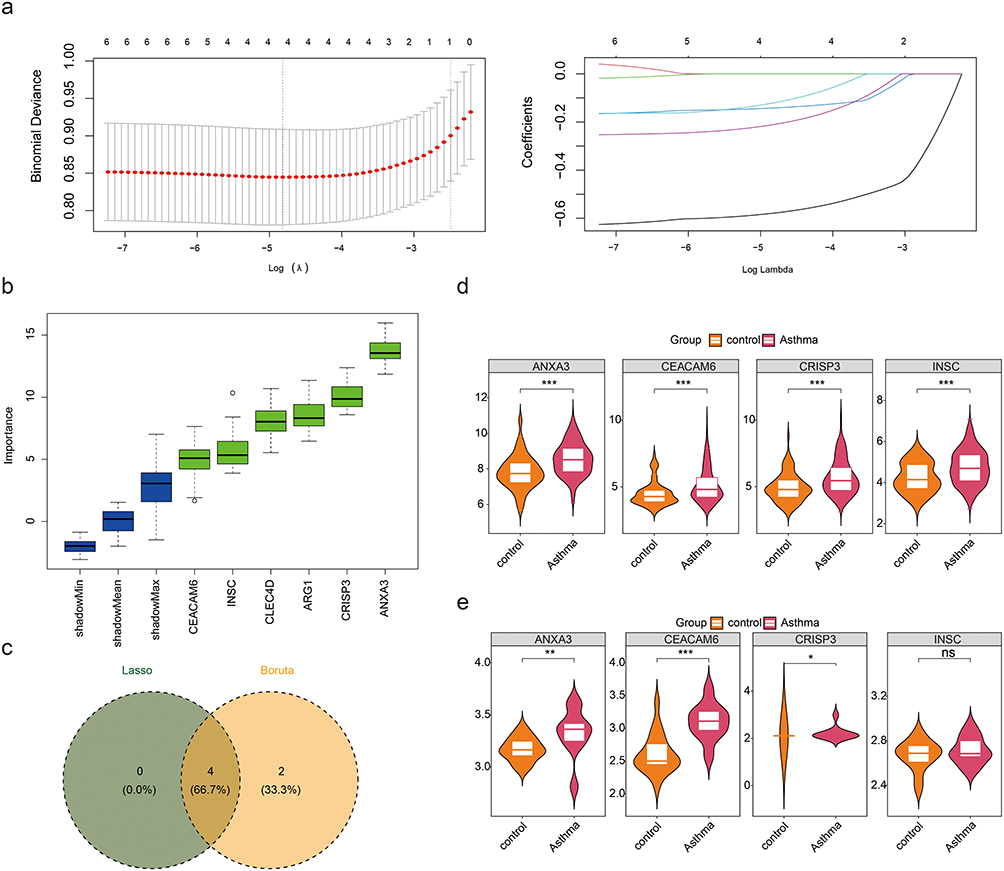 |
Figure 4 Machine learning-based screening and validation of key genes in asthma. (a) Cross-validation curve and coefficient trajectories for LASSO regression. The optimal penalty parameter (λ) was determined at the minimum binomial deviance (dashed vertical line). (b) Importance scores of parthanatos-related genes identified through Boruta. Genes are ranked based on their contribution to asthma diagnosis. (c) The genes screened out by the Lasso and Boruta algorithms were crossed, and a total of 4 candidate key genes were obtained. (d and e) Validation of candidate key gene expression in training and independent cohorts. Differential expression of ANXA, CEACAM6 and CRISP3 in blood samples from asthmatic vs control groups (GSE69683: training; GSE134544: validation). ns represents p > 0.05, * represents p < 0.05, ** represents p < 0.01, and *** represents p < 0.001. |
Key Genes Had Excellent Diagnostic Performance
An ANN model was constructed based on the identified key genes to assess the diagnostic performance (Figure 5a). The confusion matrix diagram demonstrated a predictive accuracy of 100% for both the datasets (Figure 5b). Furthermore, area under curve (AUC) value exceeded 0.7 in each of the two datasets, indicating excellent diagnostic performance of ANN model (Figure 5c). These results collectively illustrate the robustness of the ANN model constructed using key genes for diagnosing asthma. Subsequently, an analysis of the interconnections between key genes was conducted, demonstrating statistically positive associations (cor > 0.3, p < 0.05) (Figure 5d). At the protein level, ANXA3 is classified as a calcium-binding protein, CEACAM6 as an immunoglobulin superfamily cell adhesion molecule, and CRISP3 as a defense/immune protein (Table 3).
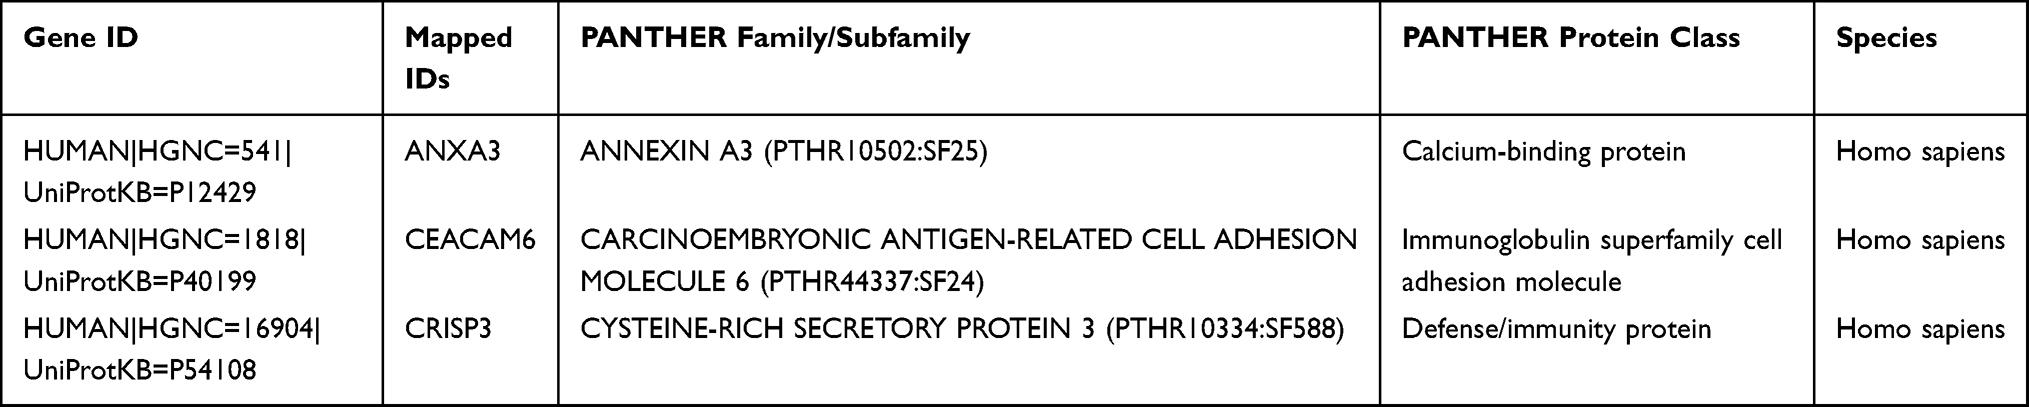 |
Table 3 Protein Classification of Key Genes (ANXA3, CEACAM6, CRISP3) Identified in Asthma |
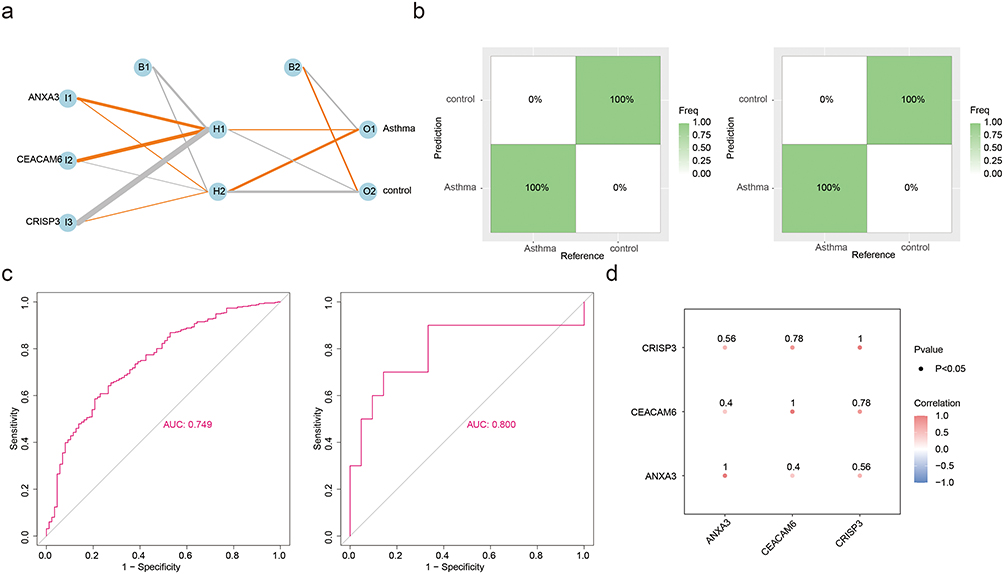 |
Figure 5 Diagnostic performance and intergene correlations of key genes. (a) Schematic representation of the artificial neural network (ANN) model for asthma diagnosis. Input nodes include key genes (ANXA3, CEACAM6, CRISP3), with hidden layers (H1, H2) and output nodes (Asthma/control). (b) Confusion matrices for training (left) and validation (right) sets. Both achieved 100% accuracy in distinguishing asthma from controls. (c) Receiver operating characteristic (ROC) curves for the ANN model. Training set AUC = 0.749 (left); validation set AUC = 0.800 (right), indicating robust diagnostic capability. (d) Spearman correlation matrix among key genes. All pairwise correlations were statistically significant (CRISP3-CEACAM6: r = 0.78; ANXA3-CEACAM6: r = 0.56; ANXA3-CRISP3: r = 0.58; p < 0.05). |
Corresponding Pathways of Key Genes Were Screened
GSEA was performed to identify potential biological pathways associated with key genes in asthma, which revealed significant findings. Specifically, ANXA3, CEACAM6, and CRISP3 were enriched in 54, 55, and 42 pathways, respectively. Notably, these pathways encompassed crucial biological processes, such as complement and coagulation cascades, spliceosome, Toll-like receptor(TLR) signal transduction cascade, and citrate cycle TCA cycle (Figure 6a–c). Moreover, upstream analysis highlighted that the Hippo and MAPK+PI 3 K signaling pathways had the highest activity (Figure 6d). These pathways are pivotal in asthma and influence the inflammatory responses, metabolic regulation, and signal transduction mechanisms.
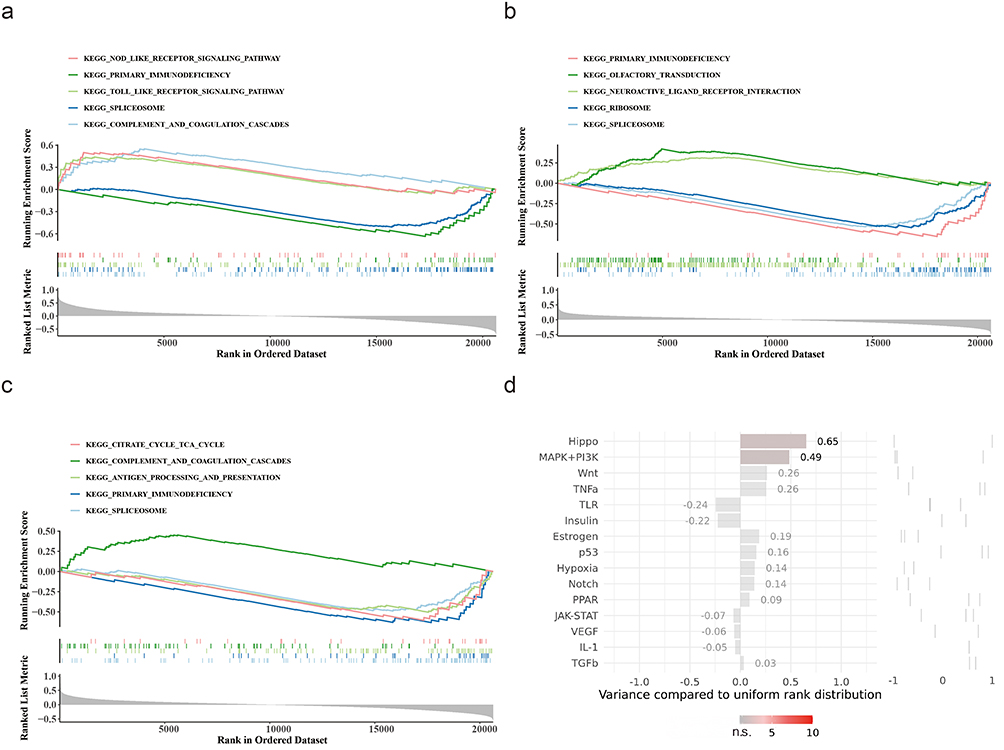 |
Figure 6 Functional pathway enrichment and upstream regulatory analysis of key genes. (a) Gene Set Enrichment Analysis (GSEA) of ANXA3-associated Kyoto Encyclopedia of Genes and Genomes (KEGG) pathways. Top enriched pathways: NOD-like receptor signaling, Toll-like receptor signaling, and complement/coagulation cascades. (b) GSEA for CEACAM6 highlights enrichment in primary immunodeficiency, spliceosome, and olfactory transduction pathways. (c) CRISP3-linked pathways include citrate cycle (TCA cycle), antigen processing/presentation, and complement/coagulation cascades. (d) Upstream pathway activity scores from SPEED2 analysis. Hippo (score = 0.65) and MAPK+PI3K (score = 0.49) pathways exhibited the highest regulatory activity for key genes. Bars represent pathway variance compared to uniform rank distribution (p< 0.05). |
Diverse Immune Infiltration Between Asthma and Control Groups
The quantitative distribution of the 22 immunocyte subsets in the training set is depicted in Figure 7a, highlighting the significant differences in immunocyte subsets (naive B cells, eosinophils, neutrophils, resting mast cells, and CD8 T cells) between the asthma and control groups (p < 0.05) (Figure 7b). Correlation analysis further indicated a statistically positive association between ANXA3 expression and neutrophils (OR = 0.31, p < 0.05) (Figure 7c).
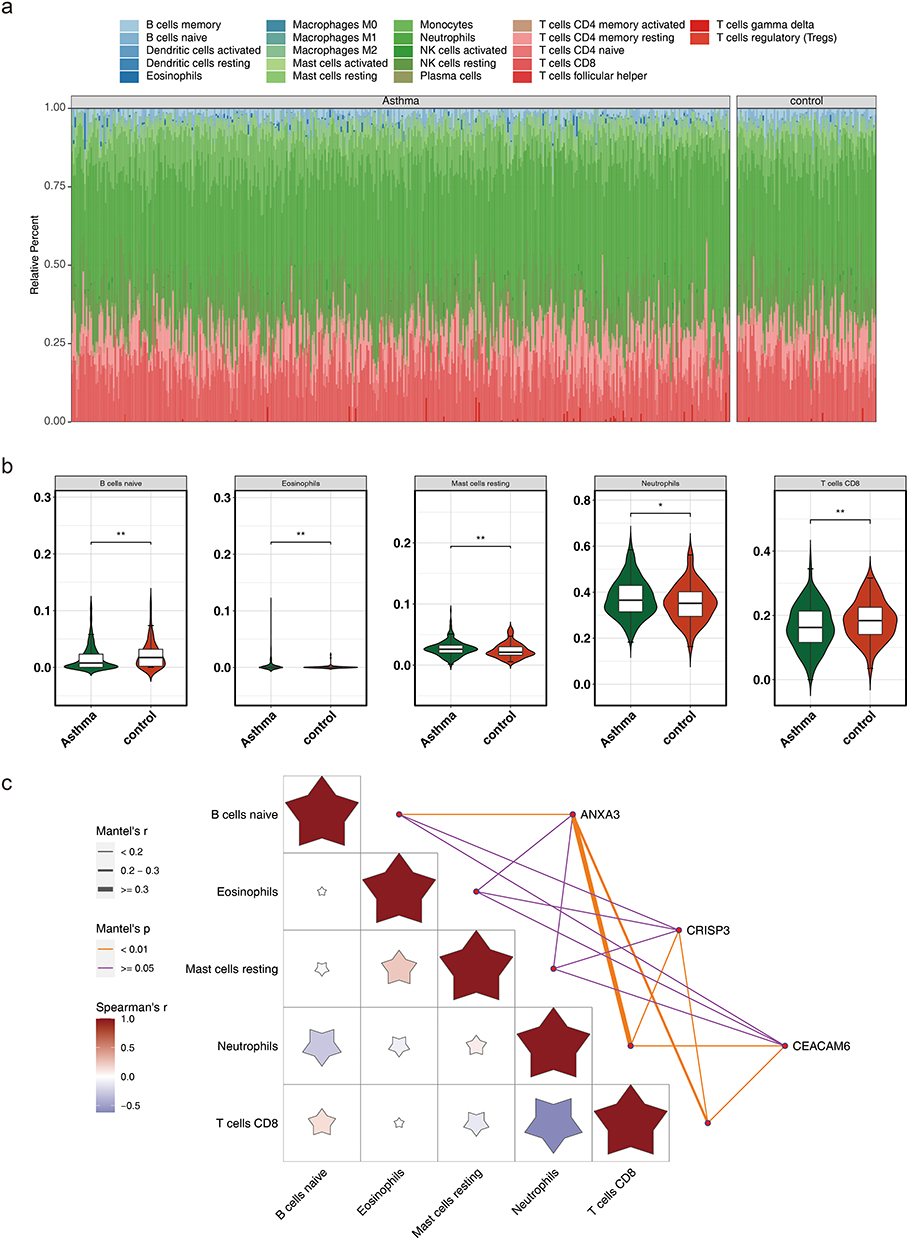 |
Figure 7 Immune cell infiltration analysis. (a) Relative abundance of 22 immune cell subsets in asthma and control groups. Stacked bar plots depict proportional differences in cell types. (b) Box plots comparing immune cell proportions between asthma (red) and control (blue) groups. Significant differences (Wilcoxon test, p < 0.05) are marked: ** (p < 0.01), * (p < 0.05). Highlighted subsets include naive B cells, eosinophils, resting mast cells, neutrophils, and CD8⁺ T cells. (c) Heatmap of Spearman correlations between key genes (ANXA3, CEACAM6, CRISP3) and significantly different immune cells. ANXA3 positively correlated with neutrophils (r = 0.31, p < 0.05). Color intensity and asterisks denote correlation strength and significance (p < 0.05). |
Potential Regulatory Mechanism Was Found of Key Genes in Asthma
ANXA3 exhibited a higher propensity for m6A methylation around the 800 bp region, CEACAM6 showed increased m6A methylation at positions between 1000 and 1500 bp, and CRISP3 displayed a tendency for m6A methylation around the 2000 bp position. These methylation patterns can significantly influence gene expression and potentially affect asthma pathogenesis. (Figure 8a–c). In addition, 45 and 4238 miRNAs were predicted using the ENCORI and miRWalk databases, respectively. By intersecting miRNA-key gene interaction pairs derived from the two databases, 17 miRNAs were identified. Additionally, ANXA3, CEACAM6, and CRISP3 were predicted to be regulated by 5, 6, and 8 TFs, respectively. Notably, SRF and NFYA were identified as common regulators of both CEACAM6 and CRISP3; FOXL1 regulated CEACAM6 and ANXA3, whereas YY1 regulated ANXA3 and CRISP3, underscoring potential synchronized regulatory mechanisms involving these genes in the context of asthma (Figure 8d).
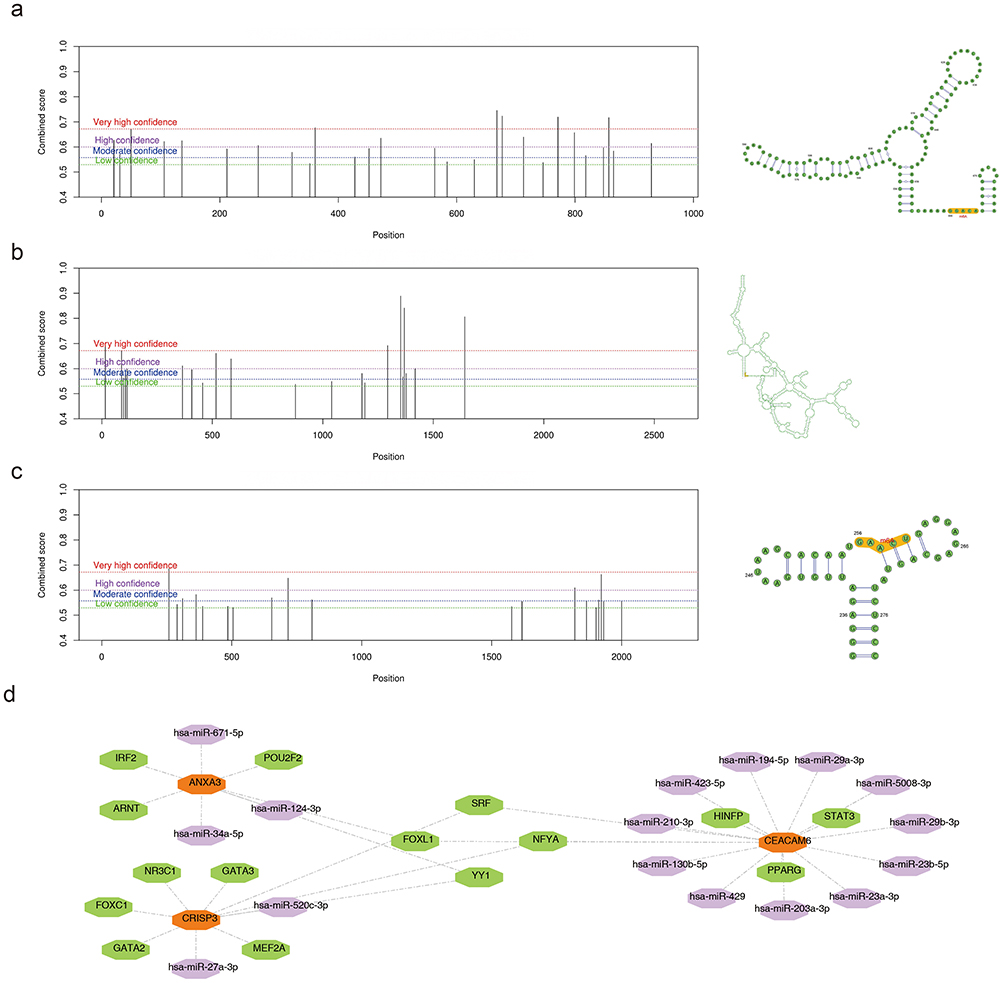 |
Figure 8 m6A methylation patterns and regulatory networks of key genes in asthma. (a) Predicted m6A methylation sites in ANXA3. Peaks indicate methylation propensity, with the highest density near 800 bp (SRAMP prediction). (b) m6A methylation profile of CEACAM6, showing enriched sites between 1000–1500 bp. Color gradients reflect methylation probability (red: high; blue: low). (c) Methylation distribution in CRISP3, with predominant clustering around 2000 bp. Dashed lines mark significant methylation regions (FDR < 0.05). (d) Regulatory network integrating transcription factors (TFs, green hexagons), miRNAs (purple hexagons), and key genes (Orange hexagon). Notable regulators include SRF (shared by CEACAM6 and CRISP3) and YY1 (linked to ANXA3 and CRISP3). |
Exploring Interaction of Key Genes with Compounds and Respiratory Tract Diseases
The analysis of key genes related to respiratory tract diseases revealed significant associations with lung disease, lung injury, and lung neoplasms (Figure 9a–c). These findings underscore the pivotal role of these genes in respiratory conditions and suggest their potential utility as diagnostic markers for asthma. Predictive analysis identified 196, 63, and 22 compounds that interacted with ANXA3, CEACAM6, and CRISP3, respectively. Notably, substances such as benzo(a)pyrene, bisphenol A, estradiol, and tetrachlorodibenzodioxin were predicted to interact with all three key genes among the top 20 compounds with the strongest correlation. Further investigation of these compounds could reveal their critical roles in asthma (Figure 9d).
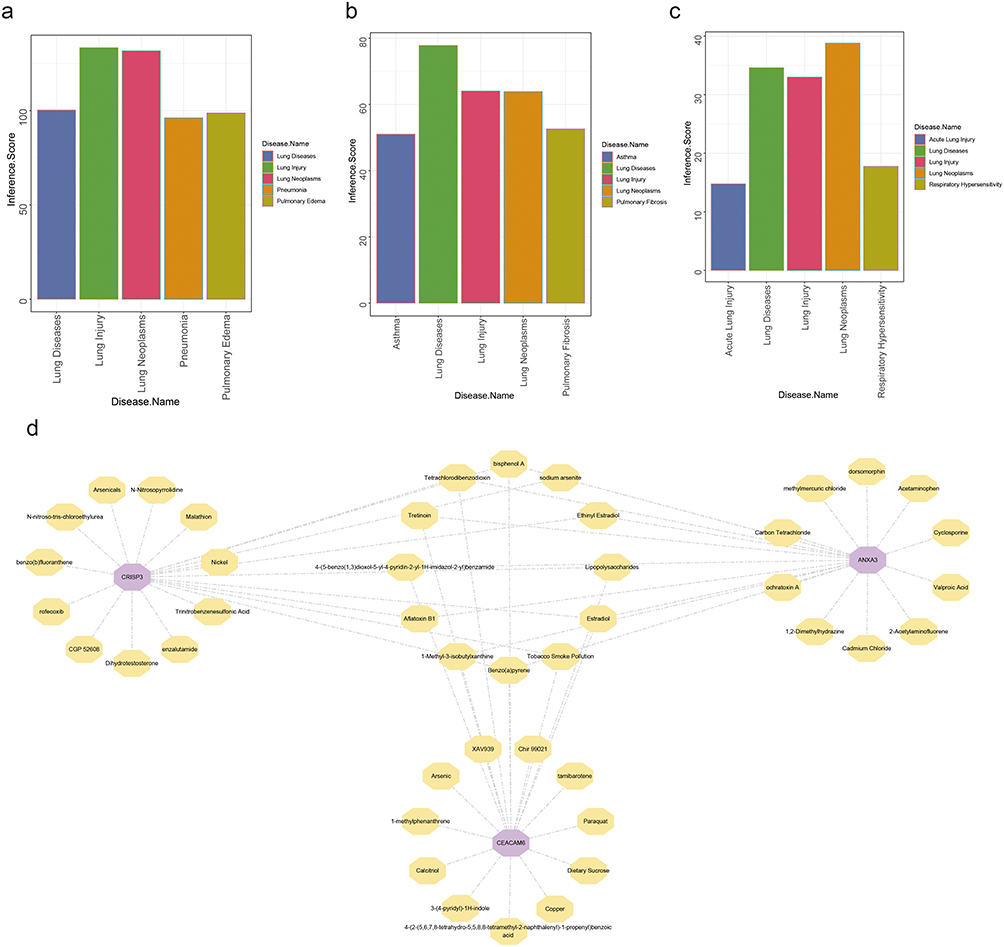 |
Figure 9 Association of Key Genes with Respiratory Tract Diseases and Interacting Compounds (a) ANXA3 exhibits associations with lung injury, lung neoplasms, pneumonia, and pulmonary edema, as quantified by interaction scores from the Comparative Toxicogenomics Database (CTD). (b) CEACAM6 demonstrates links to lung diseases, lung injury, lung neoplasms, pulmonary fibrosis, and asthma. (c) CRISP3 interacts with acute lung injury, respiratory hypersensitivity, and lung neoplasms, as reflected by its interactive scores in CTD analysis. (d) Interaction network of key genes and top 20 correlated compounds. |
Expression of Key Genes
To preliminarily explore and verify the expression of key genes in clinical samples, we performed RT-qPCR experiments on 10 clinical samples. RT-qPCR showed that the expression of CEACAM6 and CRISP3 in asthmatic patients was significantly upregulated compared with that in healthy control blood samples (p < 0. 05) (Figure 10a and b), which is consistent with our findings in the training set (GSE69683). However, no statistical differences were observed for ANXA3 expression (Figure 10c).
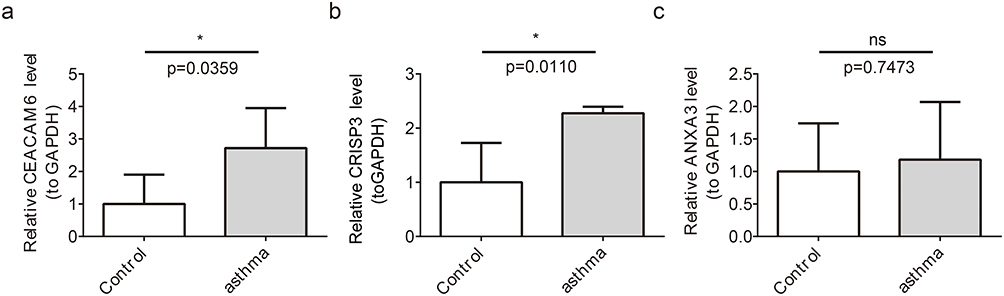 |
Figure 10 Expression of Key Genes in Asthma Patients and Healthy Controls (a) CEACAM6 expression is upregulated in asthma patients (p < 0.05). (b) CRISP3 expression is increased in asthma patients (p < 0.05). (c) ANXA3 shows no significant expression difference between groups. ns represents p > 0.05, and * represents p < 0.05. |
Discussion
Asthma manifests as a persistent immunopathological disorder of the airway, characterized by an orchestrated interplay between heterogeneous immune effector cells and stromal molecular mediators. In recent years, its prevalence has progressively escalated and current therapeutic methods have shown inadequate control, leading to a significant economic burden on affected families and society.1,3,4
This underscores the critical importance of identifying new key genes and exploring underlying etiological pathways to implement effective interventions for disease management. Parthanatos, a recently identified PARP-1-mediated cell death pathway, is biochemically distinct from apoptosis.7 Emerging evidence implicates parthanatos as a contributing factor to the development of diverse diseases; however, research on its biological role in asthma remains limited. This study integrates bioinformatics and machine learning techniques to elucidate the role of parthanatos in asthma. We identified three key genes: ANXA3, CEACAM6, and CRISP3. Notably, the upregulation of CRISP3 constitutes a novel finding, whereas ANXA3 and CEACAM6 were further validated as being associated with asthma and were investigated within the context of parthanatos for the first time.
The involvement of ANXA3 (Annexin A3) in inflammation and cell death has been documented,32 yet its relationship with asthma, particularly concerning parthanatos, remains ambiguous. Research conducted by Zen et al indicated an upregulation of ANXA3 in asthma,33 aligning with our bioinformatics analysis. Mechanistically, ANXA3 has been demonstrated to influence macrophage polarization and intensify inflammation via signaling pathways such as AKT/GSK3β/β-catenin.34,35 Notably, evidence indicates that ANXA3 may directly modulate cellular oxidative stress responses and apoptosis,35 processes that share upstream activation signals with parthanatos. Consequently, we propose that ANXA3 could function as a mediator between inflammatory signals and parthanatos, potentially enhancing PARP-1 activation by amplifying oxidative stress signals. However, it is important to note that our validation using clinical samples did not reveal a statistically significant upregulation of ANXA3. This inconsistency may be attributed to several factors. First, the small sample size may have limited the statistical power to detect subtle expression differences. Second, and more biologically significant, is the possibility that ANXA3 expression may vary depending on sample type or asthma phenotype. Our study found a positive correlation between ANXA3 and neutrophil infiltration, strongly suggesting that it may play a more critical role in neutrophilic asthma or non-Th2 inflammatory phenotypes. Future research should further validate the expression and function of ANXA3 in larger, finely phenotyped asthma cohorts (eg, distinguishing eosinophilic from neutrophilic phenotypes, or steroid-sensitive from steroid-resistant types) and in more disease-specific samples (such as induced sputum, bronchoalveolar lavage fluid, or airway biopsy tissues). Elucidating the role of ANXA3 in specific asthma subtypes will contribute to more precise asthma phenotyping and treatment.
CEACAM6, a cell adhesion molecule known for its high expression in severe asthma,36 was not only reaffirmed in our study but also provided new mechanistic insights. Its established functions include promoting neutrophil recruitment and disrupting the epithelial barrier.36 Studies have indicated that chronic inflammation and oxidative stress can activate PARP-1,12,13 and CEACAM6 itself can serve as a response molecule to cellular stress. Therefore, we hypothesize that in the persistent inflammatory milieu of asthma, factors such as oxidative stress may trigger parthanatos. The increased expression of CEACAM6 could potentially exacerbate the tissue damage induced by this process, fostering a detrimental cycle of “inflammation-oxidative stress-parthanatos-barrier damage”. This cycle compromises epithelial barrier integrity, thereby heightening the airways’ susceptibility to external stimuli. A core finding of this study is the upregulation of CRISP3 in asthma, marking the first established association of this kind. CRISP3 is a member of the cysteine-rich secretory protein family, with known functions that include binding to Alpha-1-B-glycoprotein (A1BG) and involvement in prostate cancer and inflammatory responses.37,38 Recent research suggests that CRISP3 can promote leukocyte migration and neutrophil degranulation.39 Substances released during neutrophil degranulation, such as elastase, can directly induce DNA damage, a critical upstream event that activates PARP-1 and leads to parthanatos.8,12 Consequently, we propose a hypothetical mechanism: in asthma, particularly neutrophilic asthma, the upregulation of CRISP3 may enhance the inflammatory activity of neutrophils, resulting in significant tissue and DNA damage. This damage, in turn, excessively activates PARP-1, inducing parthanatos in airway epithelial cells. This mode of cell death further exacerbates inflammation through the release of Damage-Associated Molecular Patterns (DAMPs),8 thereby establishing a positive feedback loop.
GSEA was performed to identify potential biological pathways associated with key genes in asthma, which revealed significant findings. ANXA3, CEACAM6, and CRISP3 collectively enriched the complement and coagulation cascades, TLR signaling pathway, citrate cycle, etc., up to a total of 27 pathways. They play critical roles in the inflammatory responses and metabolic regulation in asthma. Studies have demonstrated that differentially expressed proteins identified during acute asthma exacerbations participate in the pathophysiological regulation of complement and coagulation cascades.40 Recent research has revealed substantial activation of multiple TLR-associated mechanisms in asthmatic conditions, including coordinated activation of TLR2/3/4 signaling axes, concurrent engagement of both MyD88-adaptor mediated and alternative signaling branches, enhanced regulatory activity within the TLR4 cascade, and distinct molecular interaction profiles at TLR ligand-binding domains.41 TLR4 is a key factor in the aggravation of asthma induced by aluminum oxide nanoparticles through regulation of nuclear transcription factor-kappa B phosphorylation.42 Investigations have shown that neutrophilic adhesive interactions and transendothelial migration dynamics observed in asthmatic individuals are mediated by interactions between LFA-1 and ICAM-1.43 Primary immunodeficiency, as a coexisting state in adult-onset asthma populations, significantly elevates the relative risk coefficient for acute exacerbation events, potentially predisposing patients to accelerated disease progression toward refractory asthma phenotypes.44 Emerging evidence indicates that compromised immunological homeostasis serves as a predisposing factor for repetitive respiratory infections, establishing a causal pathway for asthma pathogenesis.45 These genes primarily influence asthma by modulating immune pathways.
This study conducted an immune infiltration analysis between the asthma and non-asthmatic groups, and the results revealed statistically significant differences in five types of immunocyte subsets (naive B cells, eosinophils, resting mast cells, neutrophils, and CD8 T cells) between the two groups. Studies have shown that children with allergic asthma have reduced naive B cells compared with healthy children.46 Another study indicated that naive B cells were significantly increased in patients.47
These studies suggest that comprehensive immunophenotyping of B lymphocyte subsets provides critical insights into the pathophysiological heterogeneity and prognostic stratification of asthma endotypes. Following their initial immunological characterization, eosinophils have been implicated in asthma pathogenesis, with contemporary clinical stratification identifying a Th2-high asthma variant defined by sustained eosinophil infiltration. Studies have shown that terminally differentiated eosinophils exhibit functional plasticity and phenotypic heterogeneity, with distinct subpopulations emerging through further development, immunophenotype, sensitivity to growth factors, localization, role, and fate in tissues, contributing to the pathogenesis of various diseases, including asthma. Local adaptations of eosinophil function through interactions with lung tissue niches. Therefore, a better understanding of eosinophils would lead to a more precise diagnosis and classification of asthma subtypes, which could further improve the treatment outcomes.48,49 However, emerging studies have demonstrated the critical involvement of neutrophils in asthma pathogenesis. Neutrophils demonstrate airway-predominant infiltration via chemotaxis amplification and apoptosis suppression preceding eosinophil recruitment, thereby instigating neutrophil-dominated airway inflammation. Neutrophils release elastase, myeloperoxidase, extracellular traps, and inflammatory mediators, which drive asthma pathogenesis.50 Non-Th2/type 2 asthma endotypes demonstrate corticosteroid refractoriness.
Currently, “NETosis”, a neutrophil death modality, is a pathogenic driver of asthma that exacerbates inflammatory cascades while impeding epithelial restitution, linking this process to corticosteroid-refractory asthma phenotypes.39 Individuals with asthma are susceptible to recurrent viral pathogens and exhibit compromised viral clearance. Studies have shown that pulmonary tissue-resident memory CD8+ T lymphocytes mediate accelerated antiviral defence during secondary pathogen challenges. Allergen-primed pulmonary niches affect the establishment of antiviral resident memory CD8 + T cells and viral clearance.51 Human Rhinovirus (HRV) is the primary etiological driver of acute episodes of chronic respiratory pathologiesincluding asthma. Recent studies have suggested that HRV-targeted CD8 T cell epitopes induce broad-spectrum immunoreactivity (87% population coverage), positioning these epitopes as prime candidates for HRV vaccine design to mitigate HRV-induced asthma exacerbations.52
This study has several limitations. First, the sample size employed for the initial validation of key gene expression through RT-qPCR was relatively small, potentially limiting statistical power. Second, the public datasets utilized lacked comprehensive clinical phenotypes, such as asthma control levels and exacerbation history, which hinders further exploration of the relationship between key genes and specific disease endotypes. Additionally, functional experiments have not yet been performed; therefore, critical questions regarding the influence of these key genes on parthanatos and asthma, as well as alterations in their protein levels and subcellular localization, remain to be investigated in future studies.
Given these limitations, our future research will concentrate on several key areas. First, we will increase the clinical sample size and systematically document detailed phenotypes, including asthma control status and exacerbation frequency. This approach aims to validate the expression profiles of key genes in relation to specific clinical endotypes and assess their potential as stratified biomarkers. Second, we intend to conduct functional validation in vitro by either overexpressing or knocking down the key genes in cell models. This will be complemented by parthanatos-specific assays, such as PAR polymer detection and AIF nuclear translocation analysis, to directly confirm their regulatory roles in this cell death pathway. Additionally, we will utilize techniques such as Western blotting and immunohistochemistry/immunofluorescence to further explore the dynamics of protein expression and changes in the subcellular localization of these genes in asthma. This comprehensive approach will enhance our functional and mechanistic understanding of their roles in the disease.
Conclusion
This study employed transcriptomics and machine learning to identify ANXA3, CEACAM6, and CRISP3 as key genes closely linked to the parthanatos process in asthma. The notable upregulation of CEACAM6 and CRISP3 in clinical samples, along with their robust associations with specific immune cell infiltration and inflammatory pathways, underscores their potential as diagnostic biomarkers for asthma. While bioinformatic analyses indicated a possible role for ANXA3, its expression did not achieve statistical significance in an independent clinical cohort. Consequently, the role of ANXA3 in asthma necessitates further validation in future studies that utilize diverse sample types or concentrate on specific asthma phenotypes.
In summary, our study delineates the molecular landscape of parthanatos in asthma, emphasizing the significant roles of CEACAM6 and CRISP3. These findings establish a robust foundation for elucidating asthma-related signaling networks and aim to facilitate the development of innovative treatments and personalized therapies for asthma. However, it is crucial to underscore that validating these genes as authentic therapeutic targets will necessitate comprehensive functional experiments to clarify their causal roles in asthma pathology. Future research will expand upon these discoveries to investigate the specific molecular mechanisms through which these genes regulate parthanatos and assess their potential for clinical application.
Abbreviations
PRGs, parthanatos-related genes; WGCNA, weighted gene co-expression network analysis; RT-qPCR, reverse transcription quantitative polymerase chain reaction; ICS, corticosteroid; AIF, apoptosis-inducing factor; DAMP, damage-associated molecular pattern; DEGs, differentially expressed genes; FC, Fold Change; ssGSEA, single-sample gene set enrichment analysis; LASSO, Least absolute shrinkage and selection operator; BP, biological process; CC, cellular component; MF, molecular function; ANN, artificial neural network; ROC, receiver operating characteristic; GSEA, Gene Set Enrichment Analysis; NCBI, National Center for Biotechnology Information; miRNA, microRNA; TFs, transcription factor; CTD, comparative toxicogenomics database; m6A, N6-methyladenosine; GO, Gene Ontology; KEGG, Kyoto Encyclopedia of Genes and Genomes; AUC, area under the curve.
Ethical Approval
We certify that the research study has been approved by Ethics Committee of Baoshan People’s Hospital. The approval number and date of approval are as follows: 2024LL12-024-001 and December 20th, 2024. This study was performed in line with the principles of the Declaration of Helsinki.
Patient Informed Consent
Participants in this study were provided with a clear and understandable explanation of the research objectives, procedures, potential risks, and benefits. They were informed that their participation is voluntary and that they have the right to withdraw from the study at any time. Participants were given the opportunity to ask questions and provided written informed consent prior to their involvement in the study.
Acknowledgments
We would like to express our sincere gratitude to all individuals and organizations who supported and assisted us throughout this research. Special thanks go to the Joint Special Project of Baoshan Medical Research and the Science and Technology Planning Project of the Baoshan People’s Hospital. In conclusion, we extend our thanks to everyone who supported and assisted us in this manner. Without your support, this study would not have been feasible.
Funding
The research reported in this project was generously supported by Baoshan Science and Technology Bureau and Baoshan People’s Hospital under grant agreement number [2024bskjylqn004] and [Bsy2021-ky002]. The funders had no role in study design, data collection and analysis, decision to publish, or preparation of the manuscript.
Disclosure
The authors declare that they have no competing interests in this work.
References
1. Yan Q, Zhang X, Xie Y, et al. Bronchial epithelial transcriptomics and experimental validation reveal asthma severity-related neutrophilc signatures and potential treatments. Commun Biol. 2024;7(1):181. doi:10.1038/s42003-024-05837-y
2. Li D, Abhadiomhen SE, Zhou D, et al. Asthma prediction via affinity graph enhanced classifier: a machine learning approach based on routine blood biomarkers. J Transl Med. 2024;22(1):100. doi:10.1186/s12967-024-04866-9
3. Bourdin A, Brusselle G, Couillard S, et al. Phenotyping of severe asthma in the era of broad-acting anti-asthma biologics. J Allergy Clin Immunol Pract. 2024;12(4):809–20. doi:10.1016/j.jaip.2024.01.023
4. Kyriakopoulos C, Gogali A, Markozannes G, et al. Biologic agents licensed for severe asthma: a systematic review and meta-analysis of randomised controlled trials. Eur Respir Rev. 2024;33(172):230238. doi:10.1183/16000617.0238-2023
5. Stern J, Pier J, Litonjua AA, et al. Asthma epidemiology and risk factors. Semin Immunopathol. 2020;42(1):5–15. doi:10.1007/s00281-020-00785-1
6. Pavord ID, Barnes PJ, Lemière C, et al. Diagnosis and assessment of the asthmas. J Allergy Clin Immunol Pract. 2023;11(1):1–8. doi:10.1016/j.jaip.2022.09.034
7. Zhang J, Hu X, Geng Y, et al. Exploring the role of parthanatos in CNS injury: molecular insights and therapeutic approaches. J Adv Res. 2025;70:271–286. doi:10.1016/j.jare.2024.04.031
8. Zhu L, Xie Z, Yang G, Zhou G, Li L, Zhang S. Stanniocalcin‐1 promotes PARP1‐dependent cell death via JNK activation in colitis. Adv Sci. 2023;11(5):2304123.
9. Zhang J, Hu X, Geng Y, et al. Exploring the role of parthanatos in CNS injury: molecular insights and therapeutic approaches. J Adv Res. 2024.
10. Hamano S, Noguchi T, Asai Y, et al. Aggregability of the SQSTM1/p62-based aggresome-like induced structures determines the sensitivity to parthanatos. Cell Death Discov. 2024;10(1). doi:10.1038/s41420-024-01838-2
11. Wan H, Chen H, Liu J, et al. PARP1 inhibition prevents oxidative stress in age-related hearing loss via PAR-Ca2+-AIF axis in cochlear strial marginal cells. Free Radic Biol Med. 2024;220:222–235. doi:10.1016/j.freeradbiomed.2024.05.020
12. Künzi L, Holt GE. Cigarette smoke activates the parthanatos pathway of cell death in human bronchial epithelial cells. Cell Death Discov. 2019;5(1):127. doi:10.1038/s41420-019-0205-3
13. Yang L, Du M, Liu K, et al. Pimpinellin ameliorates macrophage inflammation by promoting RNF146 -mediated PARP1 ubiquitination. Phytother Res. 2024;38(4):1783–1798. doi:10.1002/ptr.8135
14. Xu L, Ma S, Qu M, et al. Parthanatos initiated by ROS-induced DNA damage is involved in intestinal epithelial injury during necrotizing enterocolitis. Cell Death Discov. 2024;10(1):345. doi:10.1038/s41420-024-02114-z
15. Li J, Song Z, Chen Z, et al. Association between diverse cell death patterns related gene signature and prognosis, drug sensitivity, and immune microenvironment in glioblastoma. J Mol Neurosci. 2024;74(1). doi:10.1007/s12031-023-02181-4
16. Li F, Feng Q, Tao R. Machine learning-based cell death signature for predicting the prognosis and immunotherapy benefit in stomach adenocarcinoma. Medicine. 2024;103(10):e37314.
17. Ritchie ME, Phipson B, Wu D, et al. limma powers differential expression analyses for RNA-sequencing and microarray studies. Nucleic Acids Res. 2015;43(7):e47–e47. doi:10.1093/nar/gkv007
18. Cao T, Li Q, Huang Y, et al. plotnineSeqSuite: a Python package for visualizing sequence data using ggplot2 style. BMC Genomics. 2023;24(1). doi:10.1186/s12864-023-09677-8
19. Zhang X, Chao P, Zhang L, et al. Single-cell RNA and transcriptome sequencing profiles identify immune-associated key genes in the development of diabetic kidney disease. Front Immunol. 2023;14:1030198.
20. Hänzelmann S, Castelo R, Guinney J, et al. GSVA: gene set variation analysis for microarray and RNA-Seq data. BMC Bioinf. 2013;14(1):7. doi:10.1186/1471-2105-14-7
21. Langfelder P, Horvath S. WGCNA: an R package for weighted correlation network analysis. BMC Bioinf. 2008;9(1). doi:10.1186/1471-2105-9-559
22. Yu G, Wang L-G, Han Y, et al. clusterProfiler: an R package for comparing biological themes among gene clusters. OMICS. 2012;16(5):284–287. doi:10.1089/omi.2011.0118
23. Liu Y, Jiang Z, Zhou X, et al. A multi-omics analysis of NASH-related prognostic biomarkers associated with drug sensitivity and immune infiltration in hepatocellular carcinoma. J Clin Med. 2023;12(4):1286.
24. Twait EL, Andaur Navarro CL, Gudnason V, et al. Dementia prediction in the general population using clinically accessible variables: a proof-of-concept study using machine learning. The AGES-Reykjavik study. BMC Med Inf Decis Making. 2023;23(1). doi:10.1186/s12911-023-02244-x
25. You H, Dong M. Identification of immuno-inflammation-related biomarkers for acute myocardial infarction based on bioinformatics. J Inflamm Res. 2023;16:3283–3302. doi:10.2147/JIR.S421196
26. Liu Z, Wang L, Xing Q, et al. Identification of GLS as a cuproptosis-related diagnosis gene in acute myocardial infarction. Front Cardiovasc Med. 2022;9. doi:10.3389/fcvm.2022.1016081
27. Robles-Jimenez LE, Aranda-Aguirre E, Castelan-Ortega OA, et al. Worldwide traceability of antibiotic residues from livestock in wastewater and soil: a systematic review. Animals. 2021;12(1):60. doi:10.3390/ani12010060
28. Shannon P, Markiel A, Ozier O, et al. Cytoscape: a software environment for integrated models of biomolecular interaction networks. Genome Res. 2003;13(11):2498–2504. doi:10.1101/gr.1239303
29. Wang X, Wang X, Liu Z, Liu L, Zhang J, Jiang D, Huang G. Identification of inflammation-related biomarkers in keloids. Front Immunol. 2024;15:1351513.
30. Wang W, Chen H, Zhou Q, et al. Identification and RT-qPCR validation of biomarkers based on butyrate metabolism-related genes to predict recurrent miscarriage. J Inflamm Res. 2024;17:6917–6934. doi:10.2147/JIR.S470087
31. Global Initiative for Asthma. Global strategy for asthma management and prevention. 2025. Available from: www.ginasthma.org.
32. Su J, Wang L, Guan X, et al. Knocking-down annexin A3 suppresses inflammation, oxidative stress, apoptosis, and endoplasmic reticulum stress to attenuate sepsis-induced acute kidney injury in HK2 cells. Cytojournal. 2024;21:75. doi:10.25259/Cytojournal_64_2024
33. Zen L-J, Tian J-C, Hu X, et al. Shared diagnostic genes and potential mechanisms between asthma and lung cancer revealed by integrated transcriptomic analysis and machine learning. Eur J Trans Myol. 2025;35(3). doi:10.4081/ejtm.2025.13952
34. Xu L, Li W, Liu D, et al. ANXA3-rich exosomes derived from tumor-associated macrophages regulate ferroptosis and lymphatic metastasis of laryngeal squamous cell carcinoma. Cancer Immunol Res. 2024;12(5):614–630. doi:10.1158/2326-6066.CIR-23-0595
35. Liang J, Zhang J, Fan J, et al. ANXA3 interference inactivates ERK/ELK1 pathway to mitigate inflammation and apoptosis in sepsis-associated acute lung injury. Mol Immunol. 2024;167:25–33. doi:10.1016/j.molimm.2024.01.006
36. Shikotra A, Choy DF, Siddiqui S, et al. A CEACAM6-high airway neutrophil phenotype and CEACAM6-high epithelial cells are features of severe asthma. J Immunol. 2017;198(8):3307–3317. doi:10.4049/jimmunol.1600606
37. Volpert M, Mangum JE, Jamsai D, et al. Eukaryotic expression, purification and structure/function analysis of native, recombinant CRISP3 from human and mouse. Sci Rep. 2014;4(1):4217. doi:10.1038/srep04217
38. Chen L, Zhang E, Guan J, et al. A combined CRISP3 and SPINK1 prognostic grade in EPS-urine and establishment of models to predict prognosis of patients with prostate cancer. Front Med. 2022;9:832415.
39. Takeshi N. Steroid-resistant asthma and neutrophils. Biol Pharm Bull. 2020;43(1):31–35. doi:10.1248/bpb.b19-00095
40. Nishioka T, Uchida K, Meno K, et al. Alpha‐1‐antitrypsin and complement component C7 are involved in asthma exacerbation. PROTEOMICS. 2008;2(1):46–54. doi:10.1002/prca.200780065
41. Wu X, Wang P, Zhang Y, et al. Toll-like receptor characterization correlates with asthma and is predictive of diagnosis. DNA Cell Biol. 2020;39(7):1313–1321. doi:10.1089/dna.2020.5543
42. Lim JO, Kim W-I, Pak S-W, et al. Toll-like receptor 4 is a key regulator of asthma exacerbation caused by aluminum oxide nanoparticles via regulation of NF-kappaB phosphorylation. J Hazard Mater. 2023;448:130884. doi:10.1016/j.jhazmat.2023.130884
43. Jia M, Fu H, Jiang X, et al. DEL −1, as an anti-neutrophil transepithelial migration molecule, inhibits airway neutrophilic inflammation in asthma. Allergy. 2024;79(5):1180–1194. doi:10.1111/all.15882
44. Lee SH, Ban G-Y, Kim S-C, et al. Association between primary immunodeficiency and asthma exacerbation in adult asthmatics. Korean J Intern Med. 2020;35(2):449–456. doi:10.3904/kjim.2018.413
45. Stevenson RD. Studies on the production and action of polymorph migration stimulator. Clin Exp Immunol. 1976;24(3):527–533.
46. Zhu Y, Jiang Q, Lei C, et al. The response of CD27+CD38+ plasmablasts, CD24hiCD38hi transitional B cells, CXCR5−ICOS+PD-1+ Tph, Tph2 and Tfh2 subtypes to allergens in children with allergic asthma. BMC Pediatric. 2024;24(1). doi:10.1186/s12887-024-04622-4
47. Bagheri Y, Moeini Shad T, Namazi S, et al. B cells and T cells abnormalities in patients with selective IgA deficiency. Allergy Asthma Clin Immunol. 2023;19(1). doi:10.1186/s13223-023-00775-6
48. Novosad J, Krčmová I, Souček O, et al. Subsets of eosinophils in asthma, a challenge for precise treatment. Int J Mol Sci. 2023;24(6):5716. doi:10.3390/ijms24065716
49. Van Hulst G, Bureau F, Desmet CJ, et al. Eosinophils as drivers of severe eosinophilic asthma: endotypes or plasticity? Int J Mol Sci. 2021;22(18):10150. doi:10.3390/ijms221810150
50. Chen F, Yu M, Zhong Y, et al. The role of neutrophils in asthma. J Zhejiang Univers. 2021;50(1):123–130. doi:10.3724/zdxbyxb-2021-0030
51. Agrawal K, Ong LC, Monkley S, et al. Allergic sensitization impairs lung resident memory CD8 T-cell response and virus clearance. J Allergy Clin Immunol. 2022;150(6):1415–1426.e9. doi:10.1016/j.jaci.2022.07.004
52. Gomez‐Perosanz M, Sanchez-Trincado JL, Fernandez-Arquero M, et al. Human rhinovirus‐specific CD8 T cell responses target conserved and unusual epitopes. THE FASEB Journal. 2020;35(1). doi:10.1096/fj.202002165R
 © 2026 The Author(s). This work is published and licensed by Dove Medical Press Limited. The
full terms of this license are available at https://www.dovepress.com/terms
and incorporate the Creative Commons Attribution
- Non Commercial (unported, 4.0) License.
By accessing the work you hereby accept the Terms. Non-commercial uses of the work are permitted
without any further permission from Dove Medical Press Limited, provided the work is properly
attributed. For permission for commercial use of this work, please see paragraphs 4.2 and 5 of our Terms.
© 2026 The Author(s). This work is published and licensed by Dove Medical Press Limited. The
full terms of this license are available at https://www.dovepress.com/terms
and incorporate the Creative Commons Attribution
- Non Commercial (unported, 4.0) License.
By accessing the work you hereby accept the Terms. Non-commercial uses of the work are permitted
without any further permission from Dove Medical Press Limited, provided the work is properly
attributed. For permission for commercial use of this work, please see paragraphs 4.2 and 5 of our Terms.