Back to Journals » Patient Related Outcome Measures » Volume 9
Satisfied patients and pediatricians: a cross-sectional analysis
Authors Patel I, Chapman T ![]() , Camacho F, Shrestha S, Chang J, Balkrishnan R, Feldman SR
, Camacho F, Shrestha S, Chang J, Balkrishnan R, Feldman SR ![]()
Received 5 January 2018
Accepted for publication 16 May 2018
Published 28 August 2018 Volume 2018:9 Pages 299—307
DOI https://doi.org/10.2147/PROM.S161621
Checked for plagiarism Yes
Review by Single anonymous peer review
Peer reviewer comments 2
Editor who approved publication: Dr Robert Howland
Isha Patel,1,* Travis Chapman,2,* Fabian Camacho,3 Shameen Shrestha,4 Jongwha Chang,5 Rajesh Balkrishnan,3 Steven R Feldman6
1Department of Pharmacy Practice, Administration and Research, Marshall University School of Pharmacy (MUSOP), Marshall University, Huntington, WV, USA; 2Walgreens DBA Rite Aid, Winchester, VA, USA; 3Department of Department of Public Health Sciences, School of Medicine, University of Virginia, Charlottesville, VA, USA; 4Bernard J Dunn School of Pharmacy, Shenandoah University, Winchester, VA, USA; 5Department of Pharmacy Practice and Clinical Sciences, School of Pharmacy, University of Texas at El Paso, El Paso, TX, USA; 6Department of Dermatology, Pathology and Public Health Sciences, Wake Forest University School of Medicine, Winston-Salem, NC, USA
*These authors contributed equally to this work
Background: There is a lack of research in the USA comparing patient satisfaction with pediatricians and other primary care physicians (PCPs). We examined and compared patient satisfaction toward their pediatricians and PCPs and characterized factors associated with higher patient satisfaction in these two groups.
Methods: A random coefficient model with random slope and intercept was fit to the data, with patient satisfaction as a function of pediatrician/PCP, covariates, and physician random effects. Effect heterogeneity was assessed by allowing slope to vary as a function of covariates. Mediation analysis using the random coefficient model was conducted to calculate average total effect, average natural direct effect, and average indirect effect of pediatrician/PCP on satisfaction mediated by waiting/visit times.
Results: Pediatricians had higher predicted satisfaction ratings than PCPs (total effect = 4.8, 95% CI 3.7–5.9), with population-averaged mean of 82.2 (0.54) vs 77.4 (0.13). The direct effect was 3.9 (2.8–5.0) and the indirect effect was 0.9 (0.9–0.9), suggesting that part but not all of the total effect can be explained by pediatricians having decreased waiting/visit times leading to increased satisfaction. Predictions by subgroup suggested that pediatricians had lower ratings than PCPs for first visit, but higher ratings for all other covariate strata considered. Having longer waiting times and decreased visit times coincided with closer mean ratings between pediatricians and PCPs, other significant effect modifiers included patient sex, provider sex, and region of practice.
Conclusion: Pediatricians scored higher patient satisfaction ratings than the combined group of other PCPs. Pediatricians had shorter wait times to see their patients compared to PCPs. Shorter wait times and longer visit times were associated with higher patient satisfaction ratings.
Keywords: patient satisfaction, waiting time, office visits, surveys, questionnaires, humans
Introduction
Patient satisfaction is a significant aspect of the health care field and has been linked to better health outcomes and improved quality of life. It is dependent upon multiple factors, but is primarily based on the expectations of care and the physicians’ verbal and nonverbal attitudes. The potential benefits of improving patient satisfaction are staggering. Patient satisfaction is a useful measure of patient care and can be used to improve a practice’s performance and profitability.1 For example, in 2008, a health system consisting of inpatient care, primary care, and pediatrics adopted patient satisfaction surveys. These surveys led to an improvement in the quality and cost of care, as well as lower malpractice litigation and improved employee satisfaction. The results of these surveys were used to increase a Centers for Medicare and Medicaid Services metric that focused on medical practice and hospital rating.1
Waiting time, visit times, and previous experience with the physician impact patient satisfaction.2–5 Howard et al conducted a survey of selected patients from two inter-professional family practices in Canada.3 The study revealed that 75% of the participants rated wait time of less than 10 minutes for appointments as excellent or very good, while only 20% of the participants gave this rating for wait times of more than 20 minutes. Furthermore, the survey analysis indicated that longer wait times negatively impacted patients’ evaluation of care as well.4 Anderson et al found that in a patient satisfaction survey with primary care providers, patients who came for a first visit and had longer waiting times experienced decreased patient satisfaction.6 Another study conducted by Xiao and Barber compared primary care physicians (PCPs) with specialists in order to determine predictors of patient satisfaction in those two populations.7 The study found that physician characteristics for higher patient satisfaction scores were associated with practicing in the South, listening to the patients, and being a specialist. Patient characteristics for higher satisfaction scores were older age, better education, and health insurance.7
The American Academy of Pediatrics (AAP) notes that in an inpatient setting, patient satisfaction is affected by patient-centered care and clear communication between the physician and the patient or their family. Furthermore, the AAP notes that these practices lead to better care at home.8 While there are other studies that have evaluated predictors for patient satisfaction in non-pediatric primary care providers and specialists, a few studies have been conducted on outpatient pediatricians. Physician sex has an effect on pediatric satisfaction with children preferring a pediatrician of the same sex and parents preferring a female pediatrician.9 There is currently a lack of literature evaluating other significant patient satisfaction predictors in pediatricians. Hence, this study was conducted to determine the predictors of patient satisfaction associated with pediatricians in comparison with other primary care providers.
Methods
Survey and measures
Patient satisfaction data for pediatricians and primary care providers were obtained from an anonymous online validated convenience sample (www.DrScore.com, Medical Quality Enhancement Corporation, Winston-Salem, NC, USA).10 Survey participation was encouraged by advertising on the People’s Pharmacy, a public radio show, as well as via patient advocacy groups. This survey allowed respondents the opportunity to rate their physician based on their most recent last visit. The survey did not collect identifying information about participants as well as information about insurance carrier, health plan, or type of physician practice. A measure of physician care satisfaction was used as the primary outcome in this study.10 The measure ranges from 0 to 100 with 0 indicating the lowest satisfaction possible and 100 indicating the highest satisfaction possible. The scale comprises 9 items: friendliness, thoroughness of the examination, time spent with the patient, communication skills, care instructions, engaging the patient in decision-making, turnaround time for test results, how well the physician follows up with the patient, and treatment success. Each item can be scored ranging from 0 (“not at all satisfied”) to 10 (“extremely satisfied”), along with a “non applicable” option. The 9 items have good face validity and have previously demonstrated excellent psychometric properties in a sample of specialist physicians, with strong evidence for unidimensionality conducted by a confirmatory factor analysis and a Cronbach’s alpha of 0.99. In this sample, the Cronbach’s alpha was very high at 0.98.10 A key difference between the DrScore survey and other surveys is the DrScore survey’s interactive nature, with drill downs in areas of concern in order to collect detailed actionable data while minimizing survey burden.
Statistical analyses
In order to examine the difference in physician satisfaction reported by patients accessing care between pediatricians and PCP, we fit a random effects model with random intercept and random slope, where satisfaction score was treated as a function of physician type.11 The random intercept was allowed to vary as a linear function of covariates available in the data, which conceivably may have affected choice of visiting a pediatrician (at the patient level) or propensity for being a pediatrician (at provider level). These covariates included year of rating, patient sex, age category, whether the rating was for first visit, whether the visit was for a routine reason, the geographical location of the practice office, and sex of the provider. In addition, waiting time and visit time were included in the model, which were viewed as potential mediators along the pathway by which physician type affects satisfaction rating. The random slope was allowed to vary as a linear function of the model covariates in order to capture effect heterogeneity or potential effect modification of the covariates. Because the ratings were grouped by physicians, a random effect for each physician was added to both the intercept and slope. The Stata statistical package V13 procedure “xtmixed” (presently called “mixed”) was used to fit the model, allowing a correlation between random effects.12 To present implications from the model, predicted marginal averages for pediatricians and PCPs were calculated by subgroups.13 These averages were calculated by setting, for each rating in the sample, a covariate group level to the same value while holding all other covariates at the observed rating level and then taking the average of these predictions over the entire sample. Because the model is a linear model, we were able to calculate these averages by using the STATA “margins” post-estimation command and setting covariates at their mean values over all the sample.14 Because this approach standardizes subgroup means, the differences of the differences (also known as marginal effects) in satisfaction between pediatricians and PCPs are equal to the slope regression coefficients in the model.
We conducted mediation analysis, viewing waiting time and visit time as potential mediators of the effect between physician type and satisfaction. Three measures of effect were calculated, using the method described in Appendix A. The average natural direct effect was the first measure calculated. It represents the effect of pediatricians on satisfaction in the hypothetical case where the mediators take on values observed under one physician type only (in this case PCPs) and thus not affected by physician type.15 The second measure was the average total effect, which represents the effect of physician type allowing the mediators to be affected by physician type. Finally, the last observed measure was the indirect effect, which represents the hypothesized effect where physician type is held constant (in this case PCPs) and the mediators are allowed to change from values observed under pediatricians to values observed under PCPS. Four assumptions are needed to enable the identification of all three measures, which are satisfied, although not exclusively, if the relationships among the variables follow the path diagram shown in Figure 1.15–17 Prior to data analysis, the authors obtained institutional review board approval from Shenandoah University located in Winchester, VA, USA.
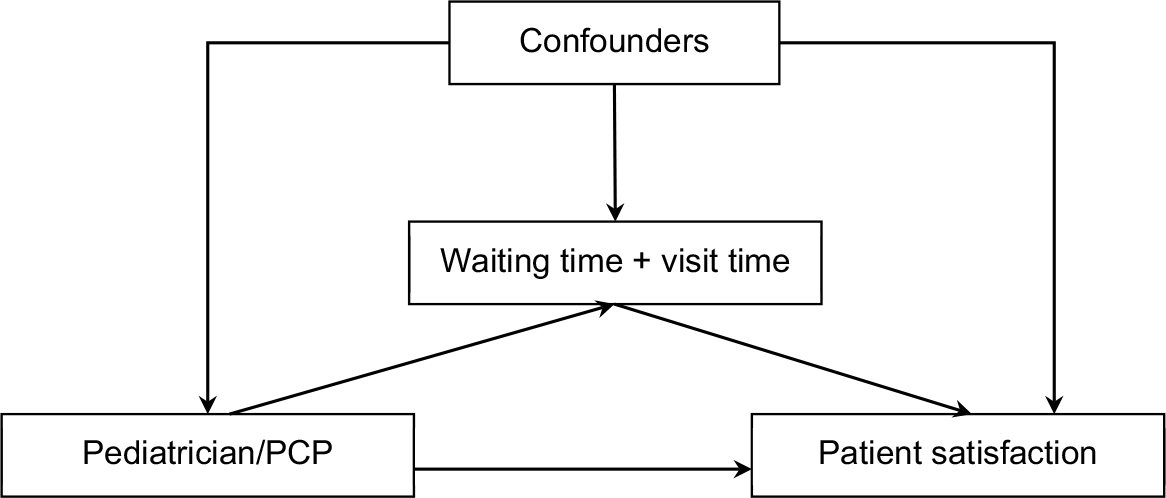 | Figure 1 Graph showing assumed relationships between variables Abbreviation: PCP, primary care physician. |
Results
Due to the large sample sizes, all associations between pediatricians and non-pediatrician PCPs were statistically significant at p<0.001 except for visit time (p = 0.1802, Table 1). There were 39,053 physicians (5,327 pediatricians vs 33,726 other PCPs) and a substantial number were singleton clusters (N = 25,833, 66%) with only one rating. Increased relative frequency of other PCPs was observed during later years (87.9%–97.9% increase); male patient sex (94.1% vs 87.7%); first visit (92.3% vs 89.5%); non-routine visit (90.9% vs 88.3%); longer waiting times (89.3% increased to 91.6%); South, East, and Midwest regions (93.5%, 90.4% vs 86.0% and 87.8%); and male provider sexes (91.3% vs 87.1%). There were more visits to pediatricians (76%) in the 65+ year group compared to the PCP group as grandparents accompanied their grandchildren during their visits to the pediatricians. Otherwise, younger age groups <18–34 years had higher relative frequencies of pediatrician visits than 35–64 years age groups.
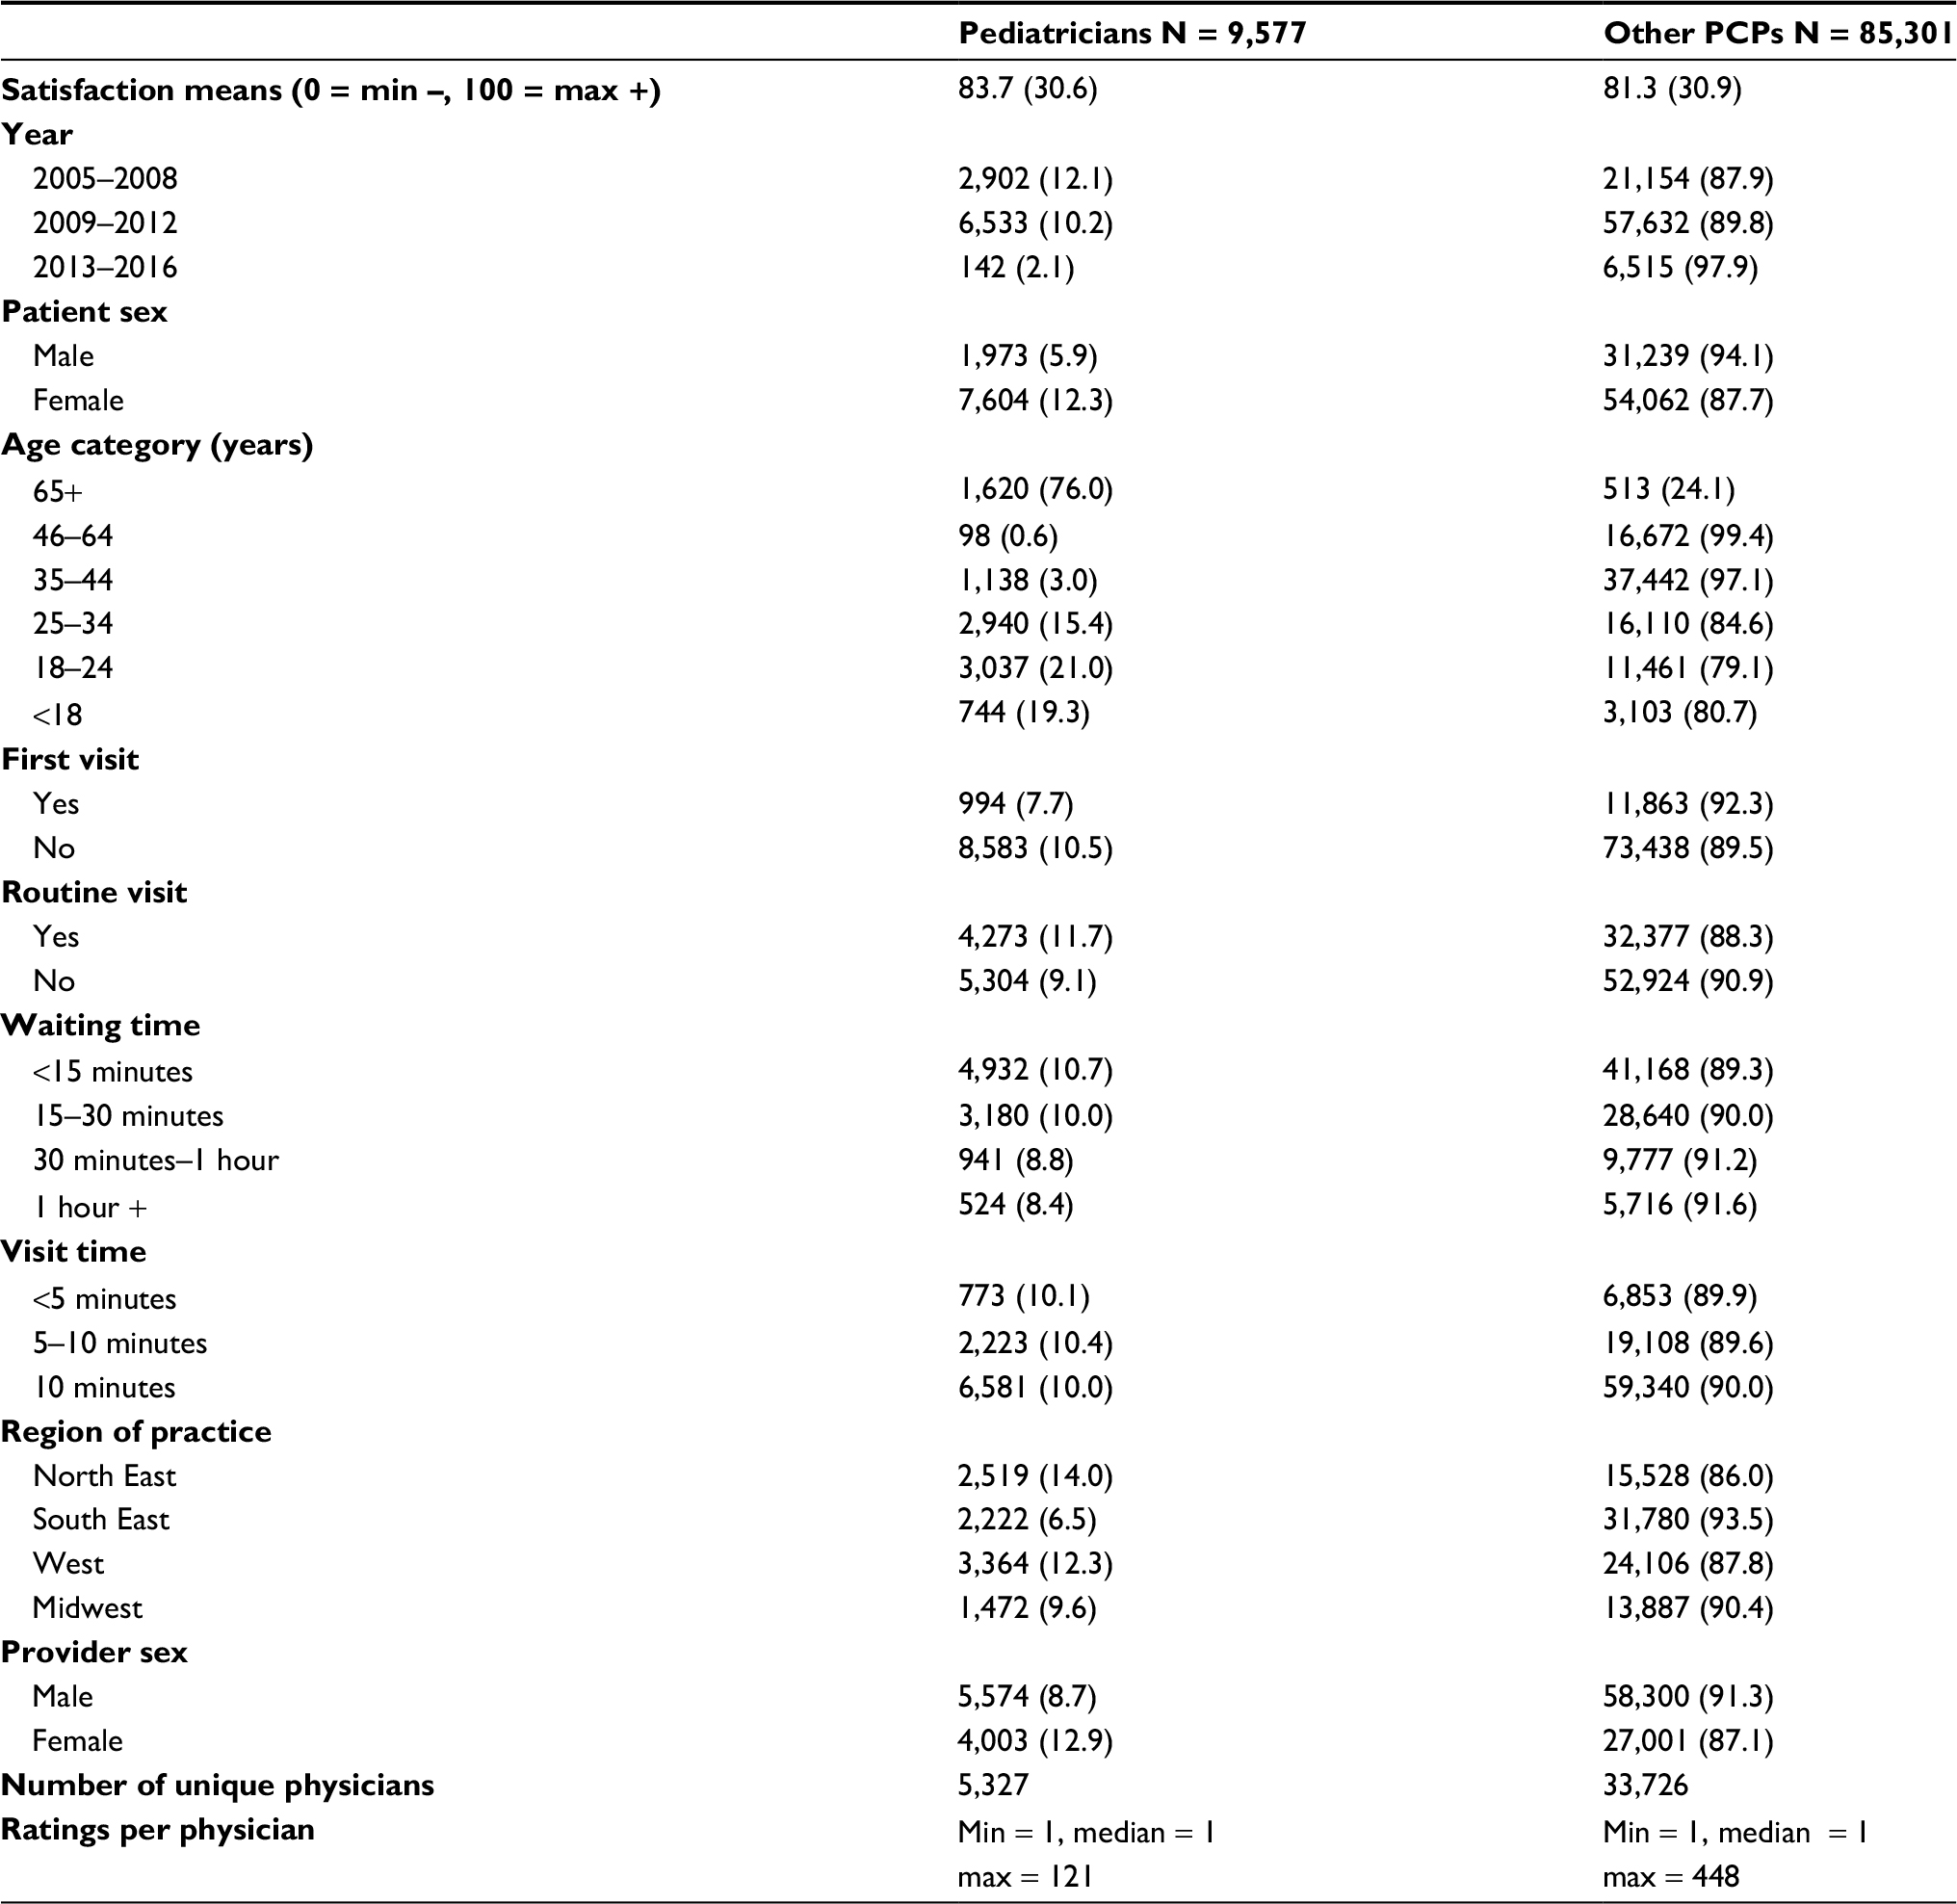 | Table 1 Descriptive characteristics of the study population for assessing patient satisfaction seen with pediatricians and other PCPs during their last visit Notes: All associations with pediatrician were significant with chi-square p <0.001 except visit time, with p = 0.180. Comparison of means using robust standard errors for physician cluster was significant, p <0.001. Abbreviation: PCPs, primary care physicians. |
After model convergence, unobserved variation captured by random effects was detected and incorporated in the model, both for the random intercept and random slope (Table 2). Plots of residuals (not shown) vs fitted values were consistent with good fit. According to the random slope Β1, effects on satisfaction between pediatricians and PCPs differed by sex (p = 0.003), first visit (p <0.001), provider sex (p = 0.028), and visit time categories (p <0.001).
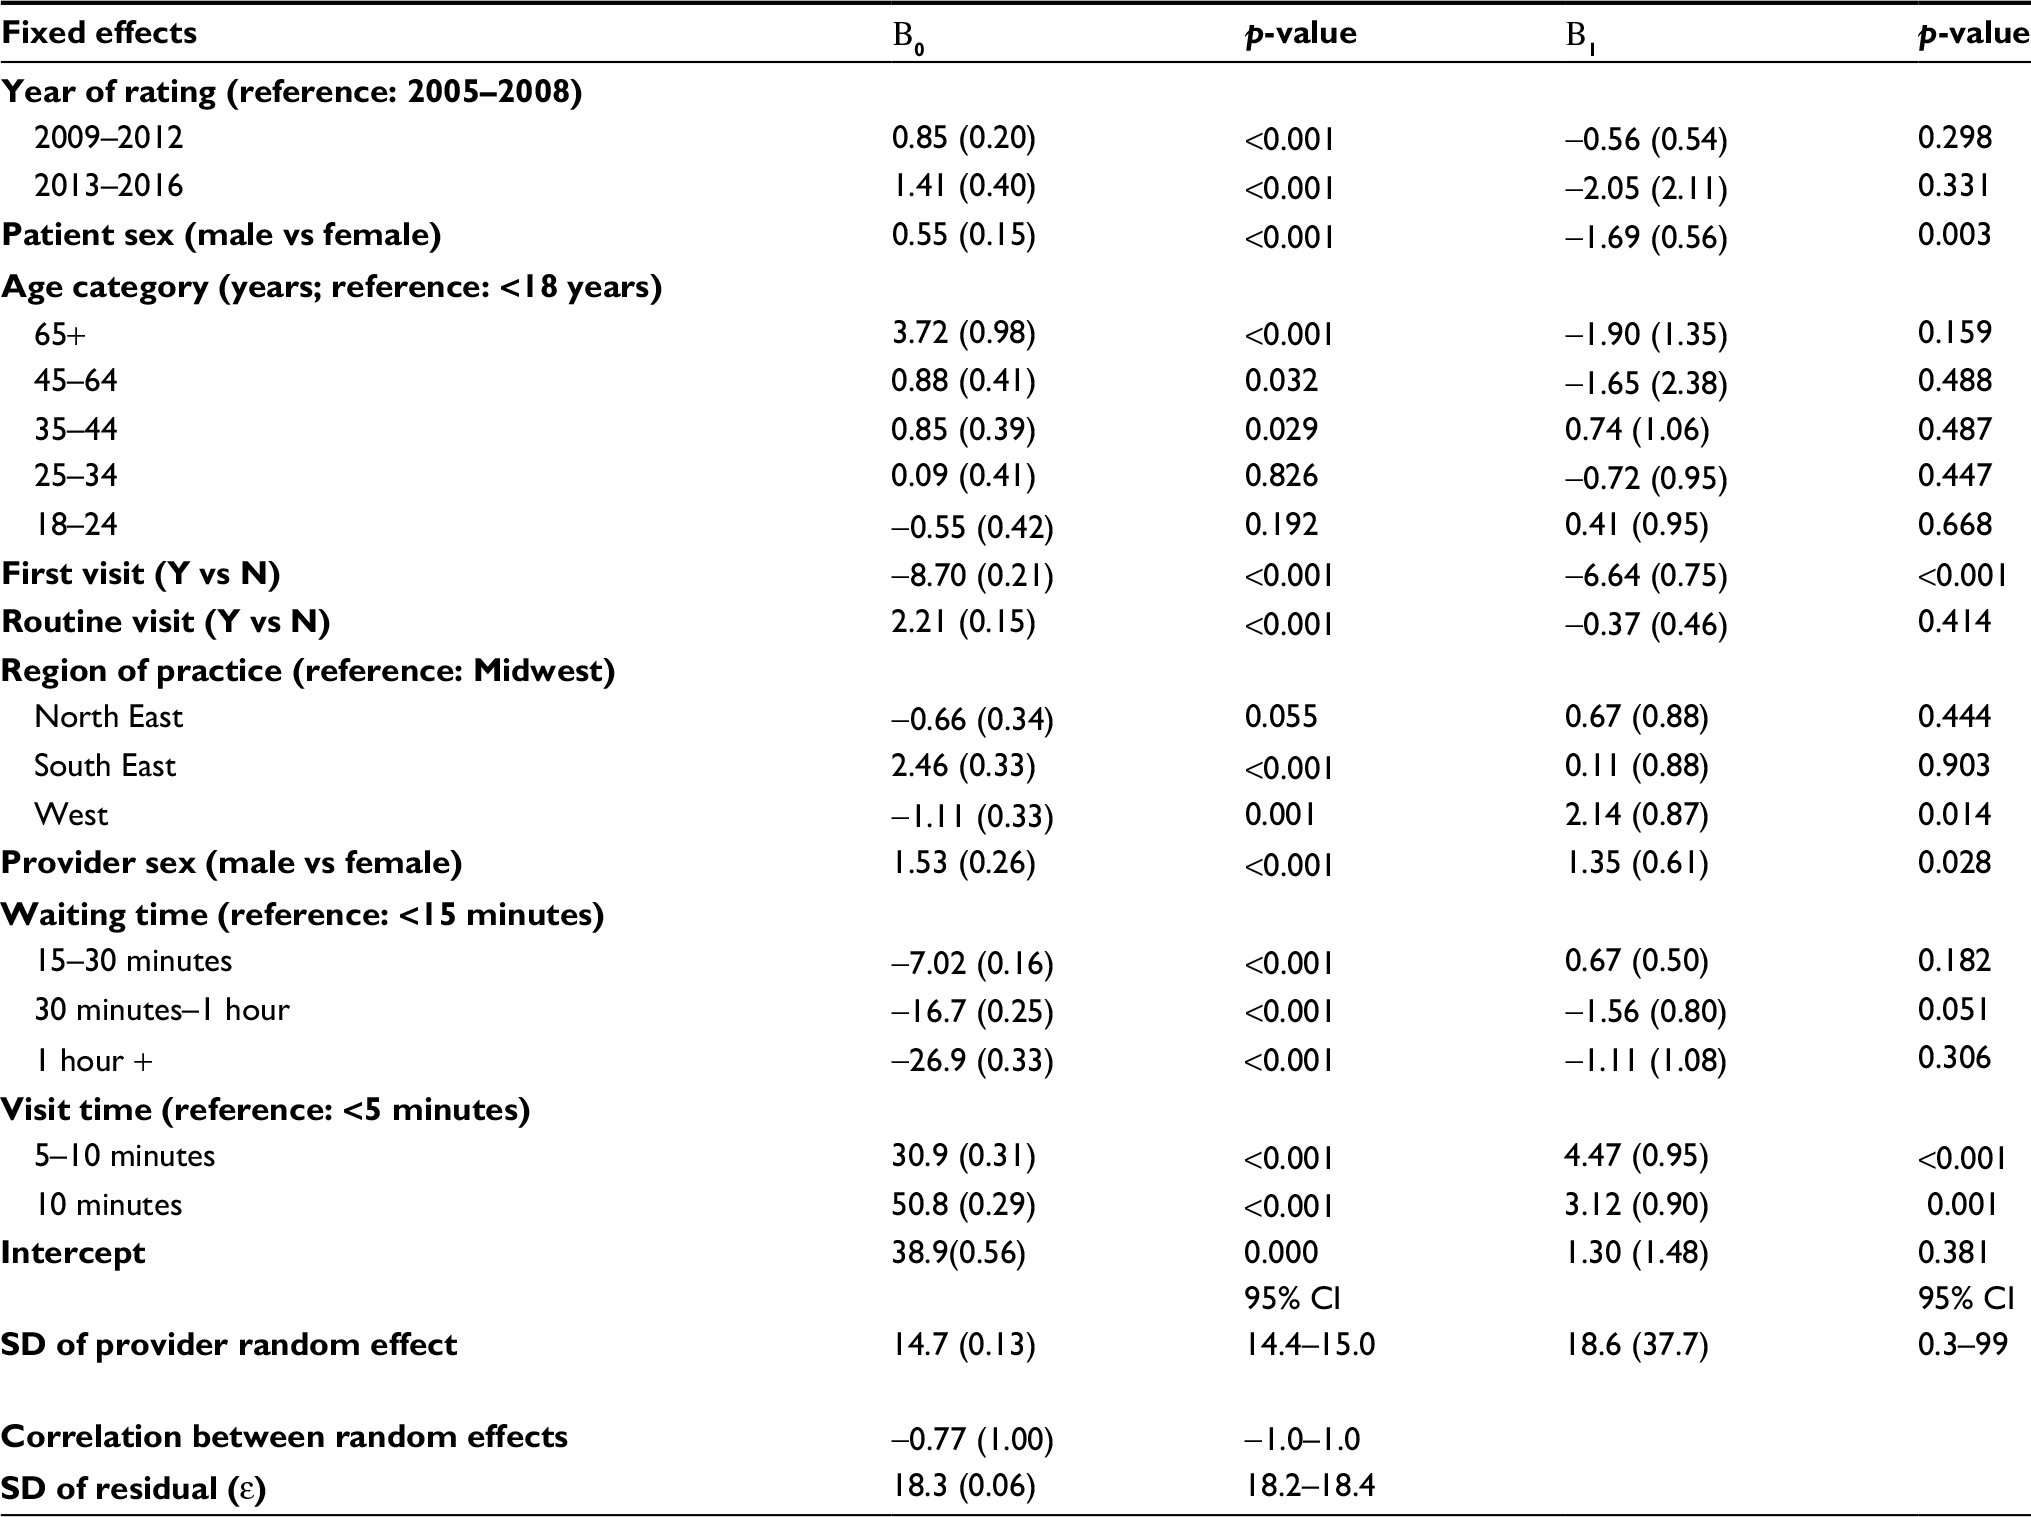 | Table 2 Multilevel model parameter estimates for varying intercept and slope model§ Note: §Model is defined by the equation: satisfaction = Β0 + Β1 pediatrician + ε. |
Pediatricians were consistently rated higher across all subgroups except for the “first visit” subgroup, with positive differences indicating better pediatrician ratings compared to other PCPs (Table 3). Female patients had wider predicted differences compared to male patients (∆4.4 vs ∆2.8); pediatricians rated lower for first visit patients (∆–1.9), but higher for regular patients (∆4.8); male pediatricians had wider differences compared to female pediatricians (∆4.3 vs ∆3.0); pediatricians with lower waiting times had improved ratings over PCPs compared to pediatricians with longer waiting times (<15 minutes: ∆3.9, 15–30 minutes: ∆4.6 vs 0.5–1 hour: ∆2.3 and 1 hour+: ∆2.8); lastly, ratings for short visit times were almost equal between physician types (<5 minutes: 0.7); however, for 5+ minutes, pediatricians showed an increase in satisfaction (5–10 minutes: ∆ 5.2, 10 minutes: ∆ 3.8). Consistent with prior literature, longer waiting times, shorter visit times, and first visits exhibited a marked decrease in satisfaction for both physician types (p ≤0.001).
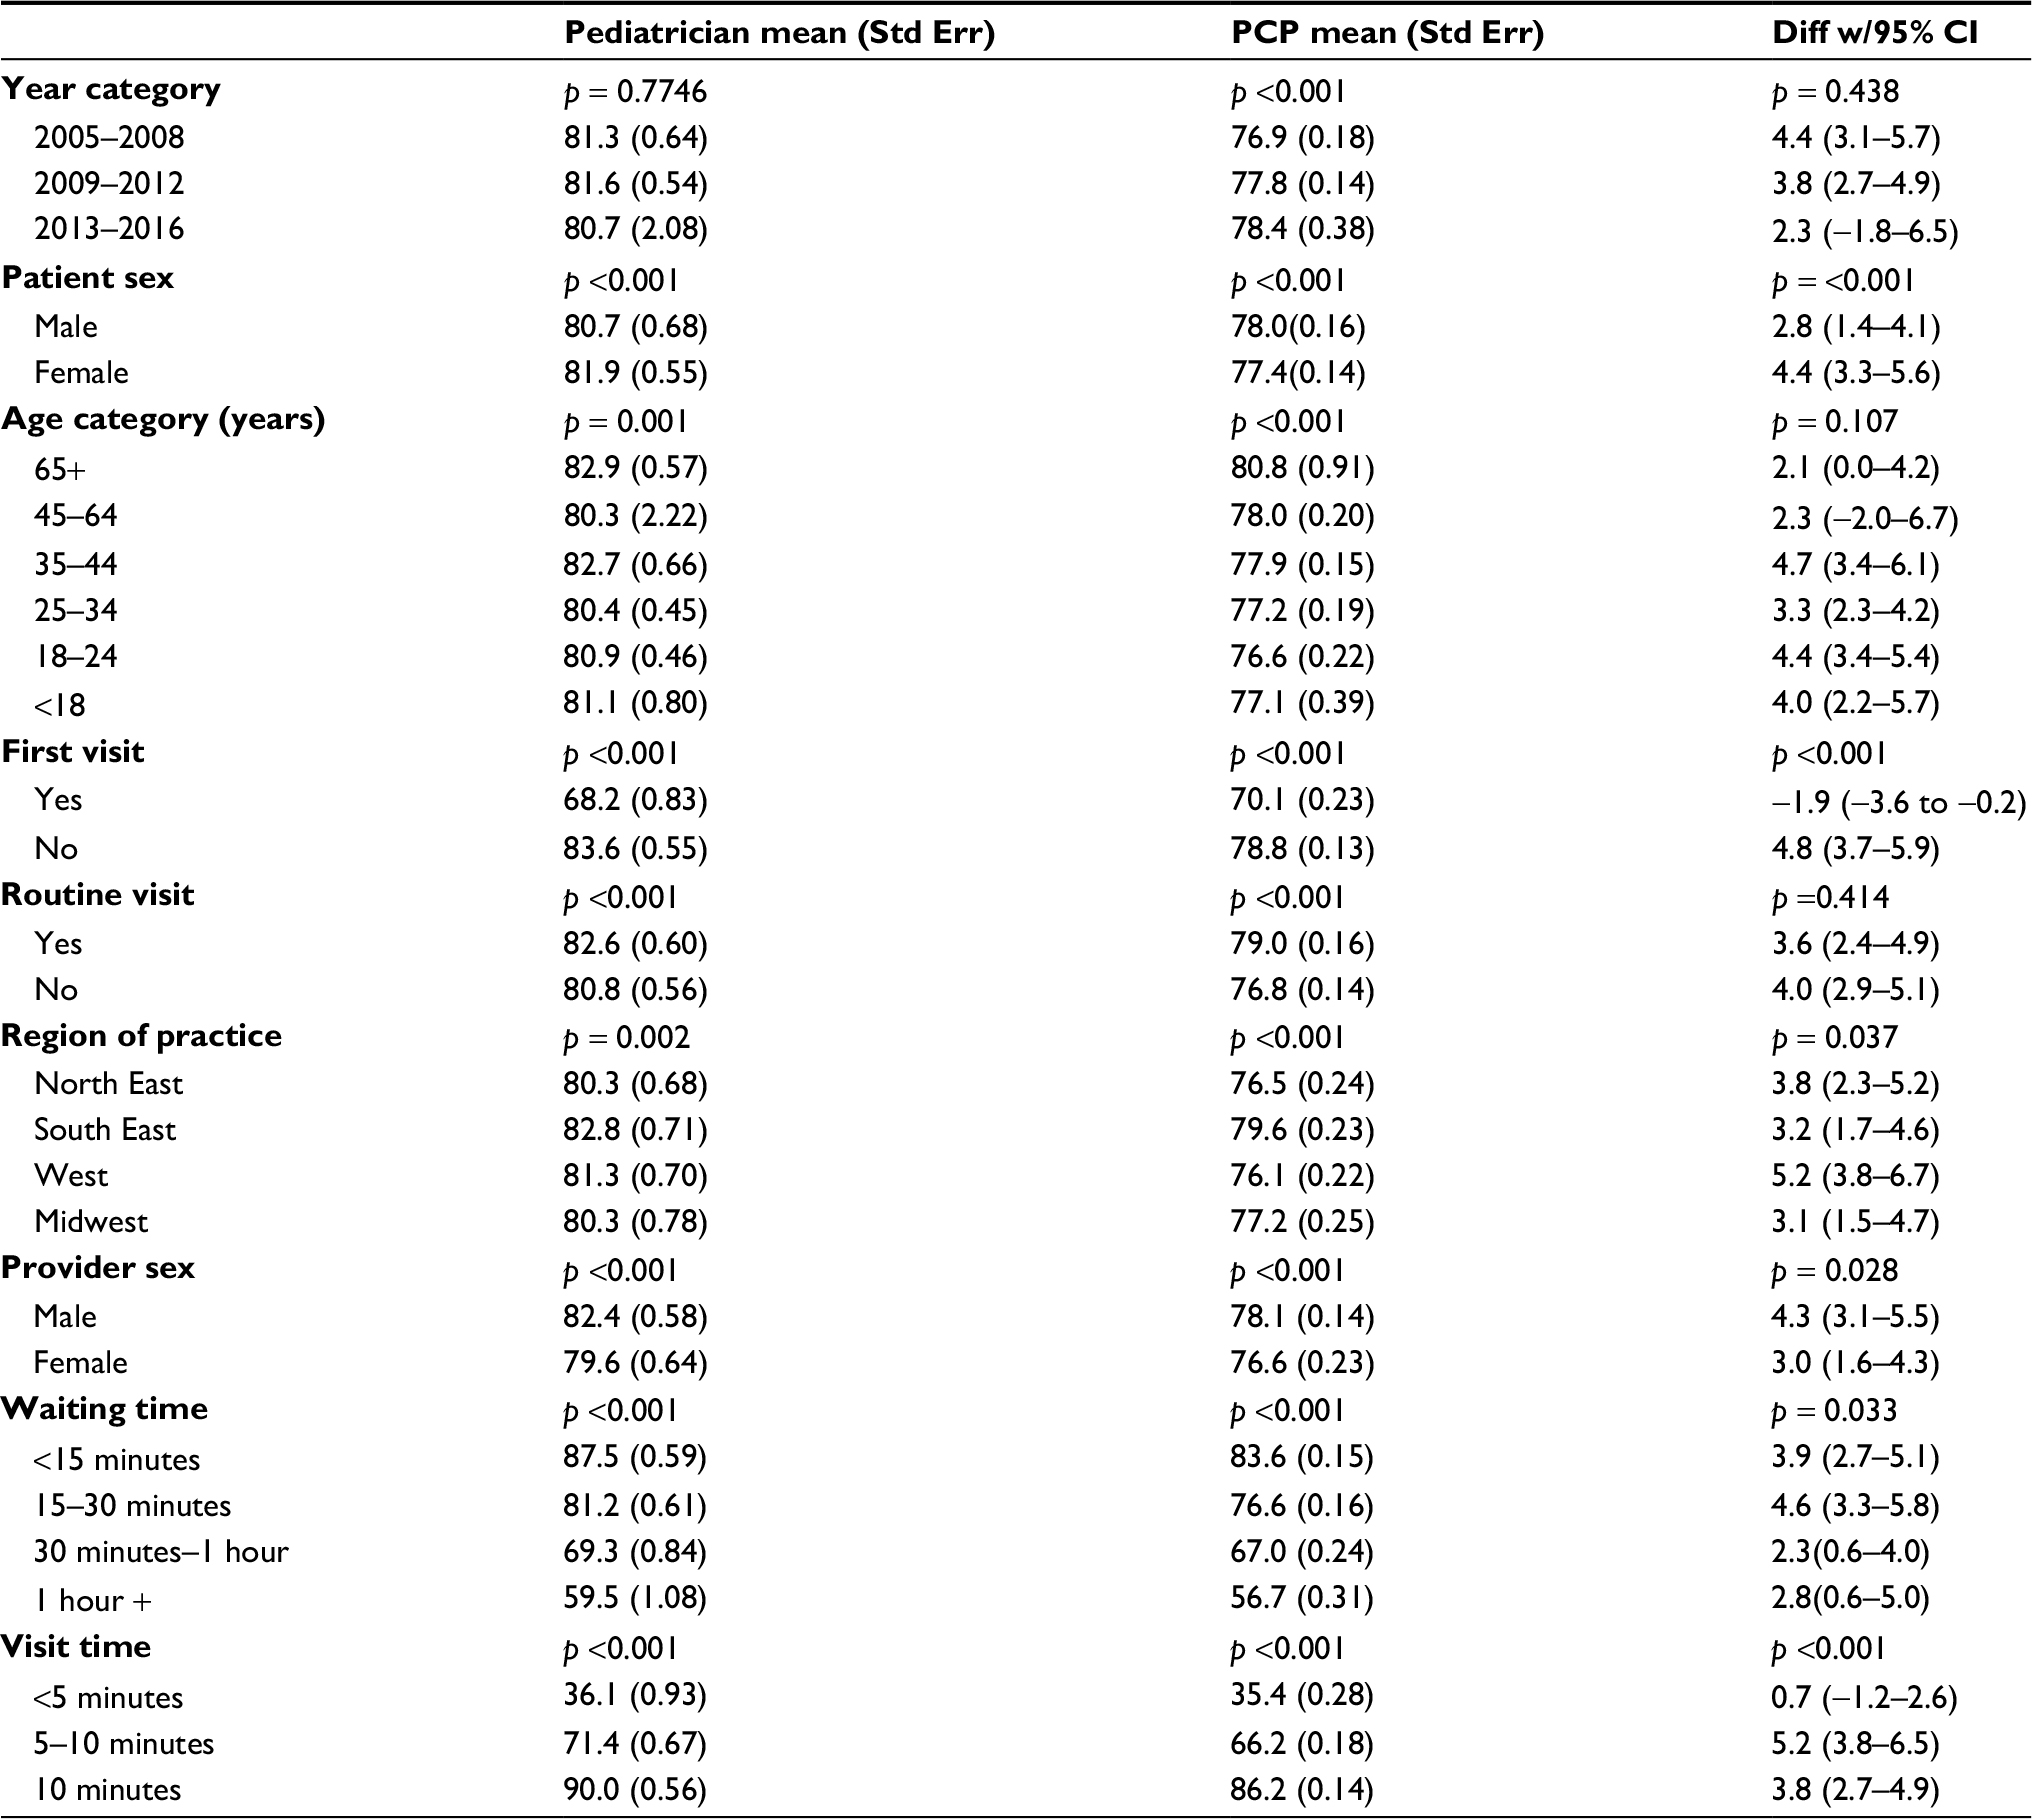 | Table 3 Marginally standardized mean between patient satisfaction with pediatricians and PCPs during their last visit Abbreviation: PCPs, primary care physicians. |
The effect decomposition in Table 4 shows the average total effect to be ∆4.8 (95% CI 3.7–5.9), with predicted mean over the population distribution of 82.2 compared to PCP mean of 77.4. The direct effect was ∆3.9 (95% CI 2.8–5.0) and the indirect effect was ∆0.9 (95% CI 9.0–9.0). This suggests that part of the total effect (19%) was mediated by waiting times/visit times so that increased satisfaction in pediatricians may be occurring as a result of shorter waiting times spent by pediatricians compared to other PCPs.
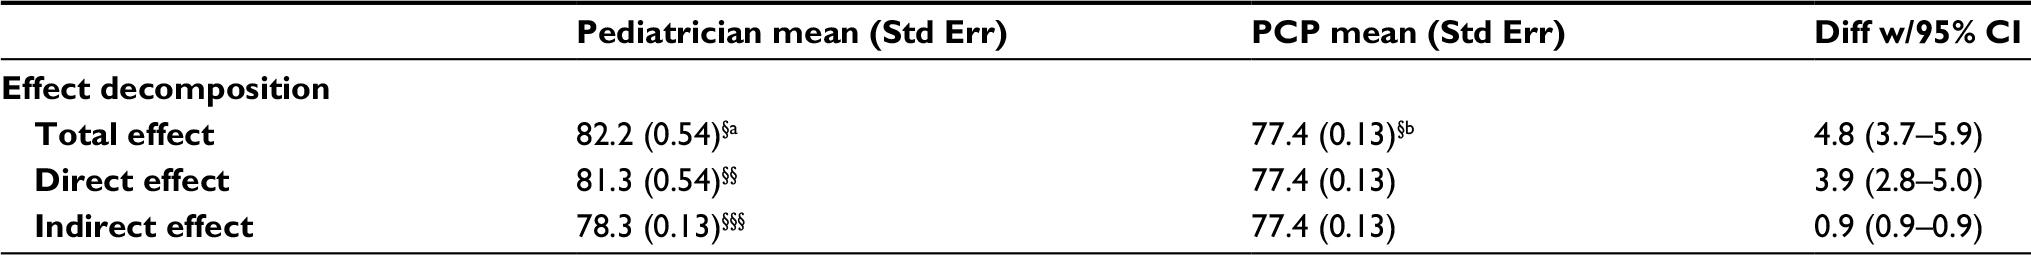 | Table 4 Effect decomposition of pediatricians vs PCPs on patient satisfaction rating during their last visit Notes: §Predicted means under waiting/visit times distributions observed in (a) pediatricians and (b) PCPs. §§Predicted pediatricians means under PCP waiting/visit time distributions. §§§Predicted PCP means under the waiting/visit time distributions observed in pediatricians. Abbreviation: PCPs, primary care physicians. |
Discussion
Pediatricians are known as “baby” doctors, but they are certified to take care of patients ranging from infants through young adults.18 Our study found that pediatricians had a higher overall satisfaction rate than other primary care providers. We hypothesized that pediatricians have learned how to optimize the experience of their patients and their patients’ caregivers. Effective communication and empathetic behaviors are crucial aspects of patient care. Other research has revealed that physicians who are empathetic and include the patients in the decision-making process of their treatment are highly evaluated.1,19
In our study, subjects were also less satisfied with their pediatrician if it was their first visit than they were if it was a recurrent visit. Other authors have found similar results for other physician specialties, such as other primary care providers.5,20 Subjects with routine visits to their pediatrician also had better satisfaction than non-routine visits. In other groups of physicians, patients also gave higher satisfaction scores when they appeared for a routine checkup as opposed to a non-routine follow-up visit.21 Geographically, subjects preferred their pediatricians more in southeastern USA than they did in the Midwest. A study looking at geographical differences in health care satisfaction in non-pediatric physicians reported data that indicate that cities such as Miami, West Palm Beach, Tampa, and North Georgia had higher health care satisfaction rates than cities in the Midwest.22 We also found that self-reported visit times longer than 5 minutes were associated with better satisfaction than visits that lasted less than 5 minutes and that longer waiting times were associated with lower satisfaction. Wait times have an inverse relationship with patient satisfaction scores.2,6,21,23 Adolph et al found that patients score their physician higher if they have a longer visit duration.21
We found that, when rating after their first visit with the provider, patients were more satisfied with other PCPs than they were with pediatricians. However, on recurrent visits, pediatricians received higher satisfaction scores. Adult patients visiting a PCP may rate their initial care higher than pediatric parents because their expectations are not strict, whereas their expectations may be higher when it concerns their child or grandchild. The recurrent visit finding can therefore be explained that if parents are not satisfied with the care their child receives on an initial visit, they may go to other pediatricians until they find one that they are satisfied with. Once they do find a pediatrician that they are satisfied with, they would continue to go to the same pediatrician for their future children as well. Pediatricians in all regions of the USA had more satisfied patients than other PCPs. Similar to our explanation with patient sex, we feel that this may be because the overall aggregate increase in patient satisfaction in pediatricians outweighed any differences caused by the difference in practice in geographic location.
Sex of the patient and the physicians was an important determinant of patient satisfaction. One study examined pediatricians who counseled their patients about preventative health. They discovered that female pediatricians were more likely to counsel patients and conducted longer visits than male pediatricians.4 Bernzweig et al also found that children tended to prefer a pediatrician of their own sex, and satisfaction was the greatest with female patients visiting female pediatricians. However, parents of either sex child tended to prefer female pediatricians.9 In our study, male and female pediatricians received higher patient satisfaction scores than other male and female non-pediatricians, respectively. A child’s parent may utilize a pediatrician that they, or their child, prefer. Children prefer pediatricians of their own sex;9 on the other hand, when allowed to choose physicians, adult patients prefer physicians of the opposite sex.24
Subjects tended to be more satisfied with their pediatricians than patients who waited the same amount of time for other PCPs, although the difference decreased as the wait times increased. This may indicate that pediatric offices have better optimized the pediatric wait experience in the waiting room through time distractions such as cartoon television shows, toys, children’s reading books, and coloring books. Although visit time was found to have an effect on patient satisfaction, patients preferred pediatricians to other PCPs for visit times exceeding 5 minutes. This may be because parents value the care and interactions that their child is receiving throughout the visit. A parent may view a short visit time as being dismissive and may have a higher preference for longer duration of visits than adult primary care patients.
Our mediation analysis suggests one of the reasons why pediatricians may be have been assessed higher than other PCPS in this population, namely, because they had shorter waiting times and longer visit times compared to other PCPs. Although a percentage comparison between the distributions for waiting and visit times does not yield differences of appreciable magnitude (i.e., 51% of pediatrician patients waited <15 minutes compared to 48% PCPs) (Table 1), these difference were sufficient to account for a 1-point difference in mean satisfaction ratings (Table 4) after adjusting for waiting/visit time distributions between groups. These results highlight the impact and sensitivity of waiting/visit times on satisfaction ratings, but do not fully account for the difference in satisfaction between pediatricians and PCPs.
Study limitations
There were some possible limitations identified in this study. The majority of the respondents reported themselves as being over the age of 18 years. A review of optional comments left when patients completed the survey suggests that, in most cases for subjects over the age of 18 years, the subject was a child’s parent or grandparent, who completed the survey based on the pediatrician’s interaction with the child. This is consistent with the directions on the survey, as it asked parents or caregivers to complete the survey on behalf of the patient. It was also found that there were some patients in the 18–24 years age range who visited the physician as children and have yet to transition to a non-pediatrician primary care provider. DrScore dataset does not include a variable asking people if they had an acute or a chronic condition for which they sought care. It is possible that the patients’ condition might affect their satisfaction. Another limitation identified was that this was an online survey and that there is a potential for sample bias. In order to complete the survey, subjects had to have access to an internet-connected electronic device, such as a computer, and familiarity on how to use it. Rating physicians is based on patient perception and awareness. It is possible that patients who are more aware about their health care or who are very satisfied or dissatisfied are more likely to rate their physicians. Lastly, there may be respondent recall bias, as the survey was not taken immediately after the visit, and the survey did not specify that it needed to be completed within a window of time.
Conclusion
Patient satisfaction is an important metric set with a wide variety of predictors and has been shown by previous studies to have positive benefits. This study evaluated predictors that have been evaluated in other physician populations to determine if the predictors are valid in this population. This current study suggests that factors such as waiting time, visit time, and prior visits with the same pediatrician are all valid predictors for patient satisfaction. These predictors can be utilized to identify areas that can be targeted by pediatric practices for improvement.
Disclosure
SRF has equity in the Medical Quality Enhancement Corporation, which developed the DrScore.com website. TC is employed by Walgreens DBA Rite Aid. The other authors report no conflicts of interest in this work.
References
Lee VS, Miller T, Daniels C, Paine M, Gresh B, Betz AL. Creating the exceptional patient experience in one academic health system. Acad Med. 2016;91(3):338–344. | ||
Patel I, Chang J, Srivastava J, Feldman S, Levender M, Balkrishnan R. Patient satisfaction with obstetricians and gynecologists compared with other specialties: analysis of US self-reported survey data. Patient Relat Outcome Meas. 2011;2:21–26. | ||
Howard M, Agarwal G, Hilts L. Patient satisfaction with access in two interprofessional academic family medicine clinics. Fam Pract. 2009;26(5):407–412. | ||
Bleustein C, Rothschild DB, Valen A, Valatis E, Schweitzer L, Jones R. Wait times, patient satisfaction scores, and the perception of care. Am J Manag Care. 2014;20(5):393–400. | ||
Uhas AA, Camacho FT, Feldman SR, Balkrishnan R. The relationship between physician friendliness and caring, and patient satisfaction: findings from an internet-based survey. Patient. 2008;1(2):91–96. | ||
Anderson RT, Camacho FT, Balkrishnan R. Willing to wait?: the influence of patient wait time on satisfaction with primary care. BMC Health Serv Res. 2007;7:31. | ||
Xiao H, Barber JP. The effect of perceived health status on patient satisfaction. Value Health. 2008;11(4):719–725. | ||
American Academy of Pediatrics. Patient- and family-centered care and the pediatrician’s role. Pediatrics. 2012;129(2):394–404. | ||
Bernzweig J, Takayama JI, Phibbs C, Lewis C, Pantell RH. Gender differences in physician-patient communication: evidence from pediatric visits. Arch Pediatr Adolesc Med. 1997;151(6):586–591. | ||
Camacho FT, Feldman SR, Balkrishnan R, Kong MC, Anderson RT. Validation and reliability of 2 specialty care satisfaction scales. Am J Med Qual. 2009;24(1):12–18. | ||
Bryk SW, Raudenbush AS. Hierarchical Linear Models: Applications and Data Analysis Methods. 2nd ed. Thousand Oaks, CA: Sage Publications, Inc; 2002. | ||
StataCorp. Stata Statistical Software: Release 13. 2013. College Station, TX: StataCorp LP. | ||
Witt MB, Spagnola KE. Using predictive marginal to produce standardized estimates. JSM. 2009:4718–4732. | ||
Williams R. Using the margins command to estimate and interpret adjusted predictions and marginal effects. Stata J. 2012;12(2):308–331. | ||
Pearl J. Direct and indirect effects. In: Breese JS, Koller D, editors. Proceedings of the Seventeenth Conference on Uncertainty in Artificial Intelligence. San Francisco, CA: Morgan Kaufmann; 2001:411–420. | ||
Petersen ML, Sinisi SE, van der Laan MJ. Estimation of direct causal effects. Epidemiology. 2006;17(3):276–284. | ||
Valeri L, Vanderweele TJ. Mediation analysis allowing for exposure-mediator interactions and causal interpretation: theoretical assumptions and implementation with SAS and SPSS macros. Psychol Methods. 2013;18(2):137–150. | ||
Batteh-Freiha J. Why some young adults keep their pediatricians. 2011. Available from: http://www.jacksonville.com/news/health-and-fitness/2011-02-16/story/why-some-young-adults-keep-their-pediatricians. Accessed October 10, 2015. | ||
Beck RS, Daughtridge R, Sloane PD. Physician-patient communication in the primary care office: a systematic review. J Am Board Fam Pract. 2002;15(1):25–38. | ||
Iaconi AI, Chang J, Feldman S, Balkrishnan R. Toward continuous primary care in the USA: differences in patient satisfaction between first and return visits to primary care physicians/Analysis of DrScore—The National e-Survey Data. J Prim Care Community Health. 2011;2(2):127–132. | ||
Adolph M, Wu J, Feldman SR, Balkrishnan R. Who will take care of us? Exploring differences in respondents’ satisfaction with primary care vs specialty care physicians. Health Outcomes Res Med. 2012;3(1):e3–e10. | ||
DeVoe J, Fryer GE Jr, Straub A, McCann J, Fairbrother G. Congruent satisfaction: is there geographic correlation between patient and physician satisfaction? Med Care. 2007;45(1):88–94. | ||
Camacho F, Anderson R, Safrit A, Jones AS, Hoffman P. The relationship between patient’s perceived waiting time and office-based practice satisfaction. N C Med J. 2006;67(6):409–413. | ||
Schmittdiel J, Grumbach K, Selby JV, Quesenberry CP Jr. Effect of physician and patient gender concordance on patient satisfaction and preventive care practices. J Gen Intern Med. 2000;15(11):761–769. | ||
Dowd BE. Greene WH, Norton EC. Computation of standard errors. Health Serv Res. 2014;49(2):731–750. |
Appendix A
For patient i rating of physician j, satisfaction was modeled using the following random effects model:
|
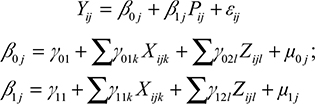
where µ_0j and µ_1j are physician level random effects, e_ij is an error term, X_ijk is covariate k, Z_ijl is the mediator l, and remaining terms are fixed effect parameters.
For the next formulas, Y_(P=p,Z=z) represents the potential outcome for each patient, if the visit had been to primary care physicians (PCP; P = 0) or pediatrician (P = 1) and mediators are set to z. Over the population of physicians j and ratings i:
|
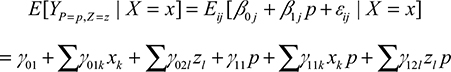
The equalities are valid under the identifying assumptions encoded in the directed graph shown in Figure 1.15–17
The initial formula for average natural direct effect is given in15,16
|
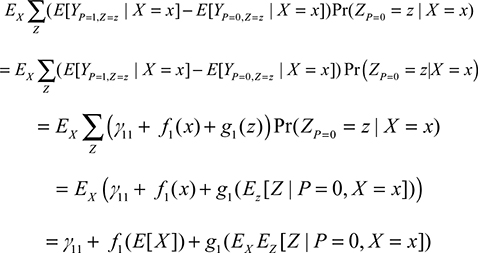
E[X] was fixed at  , the average of the covariate values over the sample.
 was estimated by taking the PCP averages of Z within strata of X, then averaging these averages over the study sample weighting by strata frequencies, resulting in:
|

The average indirect effect formula15 is given by
|

This quantity was estimated by 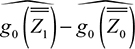 .
.
The average total effect is calculated by the following formula:
|
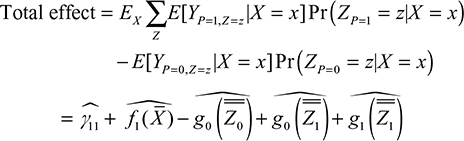
Unlike in linear systems with no interaction terms, the total effect is not the sum of direct plus indirect effect but can be shown to be the difference between direct effect and the indirect effect with subscripts reversed.15
Estimation of standard errors of the estimates, i.e., Var(NDE|X,Z) was conducted by calculating standard error of the predicted values fixing the covariates at the mean values through the delta method, which is available in STATA through the “margins” post-estimation command. This estimate is the standard error given the data and reflects model-based uncertainty; in a frequentist view, it reflects the variation of the estimates through repeated sampling with the same data (X) but allowing for variation with respect to the random variables (Y,µ,ε).25 Additional uncertainty due to sampling variation in the data [i.e., Var(NDE)] was not taken into consideration; this decision is consistent with the typical practice in regression modeling, where estimates are evaluated conditional on the data X.25
 © 2018 The Author(s). This work is published and licensed by Dove Medical Press Limited. The
full terms of this license are available at https://www.dovepress.com/terms
and incorporate the Creative Commons Attribution
- Non Commercial (unported, 3.0) License.
By accessing the work you hereby accept the Terms. Non-commercial uses of the work are permitted
without any further permission from Dove Medical Press Limited, provided the work is properly
attributed. For permission for commercial use of this work, please see paragraphs 4.2 and 5 of our Terms.
© 2018 The Author(s). This work is published and licensed by Dove Medical Press Limited. The
full terms of this license are available at https://www.dovepress.com/terms
and incorporate the Creative Commons Attribution
- Non Commercial (unported, 3.0) License.
By accessing the work you hereby accept the Terms. Non-commercial uses of the work are permitted
without any further permission from Dove Medical Press Limited, provided the work is properly
attributed. For permission for commercial use of this work, please see paragraphs 4.2 and 5 of our Terms.