Back to Journals » Infection and Drug Resistance » Volume 17
SARS-CoV-2 Infection-Dependent Modulation in Vital Components of the Serum Profile of Severely SARS-CoV-2 Infected Patients
Authors Izhari MA
Received 7 March 2024
Accepted for publication 22 April 2024
Published 29 April 2024 Volume 2024:17 Pages 1653—1667
DOI https://doi.org/10.2147/IDR.S463238
Checked for plagiarism Yes
Review by Single anonymous peer review
Peer reviewer comments 2
Editor who approved publication: Dr Sandip Patil
Mohammad Asrar Izhari
Department of Laboratory Medicine, Faculty of Applied Medical Sciences, Al-Baha University, Al-Baha, Saudi Arabia
Correspondence: Mohammad Asrar Izhari, Department of Laboratory Medicine, Faculty of Applied Medical Sciences, Al-Baha University, Al-Baha, KSA, 65522, Saudi Arabia, Tel +966 547090882, Email [email protected]
Background: COVID-19 modulates many serological biomarkers during the progress of disease severity. The study aimed to determine COVID-19 severity-associated perturbance in the serum profile.
Methods: A retrospective study including COVID-19-positive individuals (n = 405) was accomplished. The serum profile of COVID-19 participants was mined from laboratory records. Severity-associated alteration in the serum profile was evaluated using Pearson correlation, regression, VCramer, Bayesian posterior VCramer, and bias factor using R-base-RStudio-version-3.3.0 with a significant cut-off of p < 0.05.
Results: Significantly different mean ± standard deviation (SD) (highly versus moderately severe) of C-reactive protein (CRP), ferritin, neutrophil-lymphocyte ratio (NLR), D-dimer, platelets, prothrombin time (PT), partial prothrombin time (PTT), troponin 1, lactate dehydrogenase (LDH), aspartate-aminotransferase (AST), alanine aminotransferase (ALT), and AST/ALT ratio was observed (p < 0.001). Highly severe COVID-19 associated with CRP, ferritin, NLR, in D-dimer, PT, PTT, troponin 1, AST/ALT ratio, AST and ALT (adjusted odds ratio (AOR): 1.346, 1.05, 1.46, 1.33, 1.42, 1.23, 4.07, 3.9, 1.24, 1.45, p < 0.001). CRP with ferritin (r = 0.743), NLR (r = 0.77), white blood cells (WBC) (r = 0.8), troponin1 with LDH (r = 0.757), and D-dimer with platelets (r = − 0.81) were highly correlated. X2pearson (p < 0.001), VCramer (0.71), Bayesian-VCramer (0.7), and bias-factor (− 125) for troponin 1 indicate the strong association of troponin 1 level and with COVID-19 severity. X2pearson (p < 0.001), VCramer (1), Bayesian-VCramer (0.98), and bias-factor (− 266.3) for NLR exhibited a very strong association of pathologic conditions with the high severity of the disease.
Conclusion: These biomarkers of inflammation (CRP, Ferritin, NLR), coagulation disorders (D-dimer, PT, and PTT) cardiac abnormality (troponin 1), and liver injury (AST/ALT) could be crucial in low-medical resource settings as potential prognosticator/predictors of the COVID-19 severity and clinical outcomes. Moreover, the outcome of this study could be leveraged for the early prediction of disease severity during SARS-CoV or Middle East Respiratory Coronavirus (MERS-CoV) infection.
Keywords: AST/ALT, NLR, PLR, regression, association, severity, COVID-19, biomarkers, D-dimer, CRP, ferritin, troponin 1, LDH, PT, PTT
Graphical Abstract:

Introduction
The resurgence of COVID-19 caused by variants and/or sub-variants of SARS-CoV-2, a pathogenic virus,1 remains a noteworthy health concern across the globe despite the comprehensive vaccine drive.2,3 COVID-19 dynamics and continuing burden are largely dependent on waning immune status and emerging SARS-CoV-2 variants/sub-variants.3–5 Reports indicate that COVID-19 could eventuate in the endemic state instead of eliminated.3,6 Furthermore, the trend of decrease in daily reported cases and the origin of a high number of the viral variants/sub-variants7,8 even after four years of the pandemic suggest that COVID-19 could take longer to be endemic and SARS-CoV-2 regional circulation will continue.3,6 Variation in COVID-19 outbreak in different regions has been reported9 probably due to the dependence of the incidence of the disease on climatic conditions.10 Additionally, COVID-19 causes substantial pulmonary pathology but also extrapulmonary clinical manifestations: arrhythmia, hepatocellular damage, coagulopathy, and coronary syndrome.11 Moreover, in the last decades, apart from the SARS-CoV-2 outbreak in China in 2019, two other major outbreaks of the respiratory syndrome caused by SARS-CoV from China in 200212 and MERS-CoV from Saudi Arabia in 201213 were reported, however, reports suggest that the SARS-CoV-2 is less pathogenic and highly transmissible compared to SARS-CoV and MERS.14 Because of the high transmissibility, it posed an unprecedented life threat to the global population.15 Since coronaviruses exhibit similar clinical manifestations such as severe acute respiratory distress,16 therefore, it could be anticipated that the perturbation in serum proteome brought about by SARS-CoV-2 infection could also help understand the pathophysiology of SARS-CoV and MERS-CoV infections. It is noteworthy that for the implementation of precise diagnostic, prognostic, and therapeutic strategies to curb and contain the regional outbreak, assessment of the association of disease severity with COVID-19-dependent alterations in components of serum profile (vital disease predictors): hematological profile,17 inflammatory profile,18 coagulopathy parameter,18 cardiac profile, and liver function test (LFT) is paramount.19 Along with the indispensable clinical evaluation, insight into the level of laboratory biomarkers as predictors of disease severity offers objective information that potentially impacts various components of the patient’s care and control of the outbreaks of the SARS-CoV-2 and other major related human coronaviruses such as SARS-CoV, and MERS-CoV, especially in suburban regions with low medical resources. The objective evaluation of biomarkers serves as the indicator of pathological, physiological, and pharmacological responses to treatment strategies.20 SARS-CoV-2 infection triggers an inflammatory cascade and produces acute-phase reactants.21 A hyperactive immune system leads to dysregulated and uncontrolled release of cytokines (cytokine storm)22 with raised inflammatory and other biomarkers such as coagulopathy markers that worsen the COVID-19 disease outcome.23–25 Furthermore, information about C-reactive proteins (CRP) and ferritin (inflammatory biomarkers), coagulopathy marker (D-dimer), cardiac biomarkers (troponin and lactate dehydrogenase (LDH)), and hepatocellular markers: alanine aminotransferase (ALT) enzyme, aspartate aminotransferase (AST) enzyme and AST/ALT ratio unravel comprehensive insight into tissue injury, inflammation and immunological modulation caused during COVID-19 disease progression, therefore, evaluation of such circulating serological markers could be potentially beneficial to understand the disease severity.19,26 Raised levels of the above-mentioned potential biomarkers have been delineated to exhibit an association with the worst disease prognosis and highly severe status of the disease that leads to the necessity of lengthy hospitalization and intensive care unit (ICU).27,28 A few studies delineated the COVID-19-severity-associated perturbance in these crucial markers, such as raised troponin,29 raised procalcitonin (PCT),30 lactate dehydrogenase (LDH),31 enhanced serum ferritin,32 higher erythrocyte sedimentation rate (ESR),33 complete blood count (CBC)34 increased C-reactive protein (CRP),35 liver enzyme36 and raised interleukin-6 (IL-6).37 More interestingly, getting initial insight into these biomarkers is critical for understanding the pathophysiology of the COVID-19 and thus helps assess severity, framing hospitalization criteria, the need for ICU admission, deciding timely and precise therapeutic intervention, and predicting disease outcomes.38 Potential clinical outcomes of COVID-19 disease are the consequence of the highly complex pathophysiological interactions of the virulence factors of the SARS-CoV-2 virus with the various host-immune factors. Since the host factors are highly variable among the individuals of the population.39 Moreover, reports suggest that different strains/sub-strains of SARS-CoV-2 were involved in different geographical regions, which implies the significance of the study in population to gain insight into regional context. Though some studies on a few markers have been accomplished, however, to my knowledge, information on COVID-19-associated alterations in most of the components of serum profile and their association with severity in this population is lacking. Due to the diagnostic, prognostic, and therapeutic suitability of these serological markers, the present study aimed to determine COVID-19 severity-dependent modulation in the level of these serological biomarkers in this region.
Materials and Methods
Research Design, Population, and Study Area
A retrospective hospital-based research design was implemented to achieve the aim of this study. The analytical procedures were applied to the data retrieved after an inquisitive review and examination of hospital records at Al-Qunfudah Hospital, Saudi Arabia for various laboratory parameters: WBC, platelets, neutrophil, lymphocyte, PT, PTT, D-dimer, troponin, LDH, AST, CRP, ALT, and ferritin, and severity status (Moderately severe and highly severe), and demographic characteristics (age and gender) of the COVID-19 patients from the period of Jan 2020 to Dec 2020. Relevant data of the COVID-19-positive individuals who satisfied the laid down eligibility criteria for this study were acquired from the hospital record. The analytical approaches for execution of the study is illustrated in Figure 1.
 |
Figure 1 Illustrative explanation of the methodological approach for analysis, interpretation, and visualization of the findings. |
Key Parameters of Serum Profile and Their Operational Definition
NLRs of 1–2, >3-5 or <0.7, >5, and 2–3 were considered normal, pathologic, marked pathologic, and gray zone, respectively.40 The reference value of PLR (36.63–149.13 in males and 43.36–172.68 in females) was considered.41 Troponin 1 less than 0.04 ng/mL, between 0.04 to 0.3 ng/mL and greater than 0.3nng/mL were defined as normal, low risk, and risk level, respectively.42 Ferritin (24–336 µg/L in males) and (24–307 µg/L in females) were defined to be normal values while the participants with ferritin levels higher than the latter were hyperferritinemic. D-dimer >500 ng/mL was defined as a high D-dimer level. LDH (135–225 U/L in males) and LDH (>135–214 U/L in females) were reference ranges. LDH < 135 U/L was low LDH and above 225 in males, and 214 in females were characterized as high LDH. AST< 39 U/L and ALT < 52 U/L) were identified as set as reference range.43 AST/ALT lesser than 1 and AST/ALT greater than 1 were defined as normal and high-risk groups, respectively. The severity status (exposure status) was deduced from the information in the hospital record: highly severe based on the need for a ventilator, ICU admission, CT score, and moderately severe patients based on their admission to the COVID-19 ward with normal oxygen saturation but symptomatic.
Ethical Approval Declaration for the Study
Ethical approval for data collection and study was obtained from the Ethics board in Al-Qunfudah Hospital, Qunfudah, Saudi Arabia, with approval number (Ref: 605–44-0057116) on 06/10/2022. Written informed consent was not required for the collection of the data because the secondary data generated through routine laboratory tests were collected for this retrospective study by explaining the purpose of the collection of data ethical committee through a written study proposal. The data confidentiality and protection policies were well implemented during collection and the execution of this study.
Computation of Sample Size
An equation: sample-size (n) equals N/(1 + Ne2); N expresses population size, and “e” represents the error margin used to compute the sample size. A 95% confidence level (95% CI) and e = 0.05 were taken into consideration.44 Approximately a sample size of n = 397 was evaluated to be suitable for the study. Nonetheless, a sample size of n = 405 participants was suitable for inclusion in this research based on eligible criteria.
Eligibility Criteria (Inclusion and Exclusion Criteria)
SARS-CoV-2-infected male and female individuals of all ages were encompassed in this research. Individuals infected with microbes other than SARS-CoV-2 were excluded from the study. Pregnant, and participants with hematological disorders, chronic kidney disease, metabolic diseases, inflammatory diseases, hepatocellular injuries (HCI), chronic kidney disease (CKD), hemodialysis (HD), cardiovascular disease (CVD), and diabetes were excluded from this study. Participants with surgery were also excluded to minimize the confounding effects.
Nature of the Data and Methods to Generate at the Primary Level
For evaluating the exposure and infectiousness of participants, sterile nasopharyngeal (NP) swabs were collected aseptically from the COVID-19 suspected individuals for further diagnostic processing at a specifically allocated collection section with special precautionary arrangements at Al-Qunfudah Hospital. SARS-CoV-2 exposure assessment was confirmed by processing the clinical sample by reverse-transcription (RT)-real-time polymerase-chain-reaction (RT-real-time PCR) using ORF 1b (open-reading frame)/N gene PCR diagnostic kit (KOGENEBIOTECH) following manufacturer’s instructions.45 Fasting blood specimens were collected to measure patients’ laboratory parameters. CBC was assessed by Beckman Coulter DxH 900 (USA), ALT, AST, troponin, and CRP by Vitros System Integrated XT 7600, ferritin by DxI 800 analyzer (Beckman Coulter, USA), and D-dimer by Stago automated analyzer. Data on age, gender (males and females), and COVID-19 severity status (Highly severe and moderately severe) were retrieved by conducting multiple reviews and analyzing the hospital records of the participants.
Data Quality-Assurance
The data collected was plugged into MS Office/excel sheet and several reviews were executed to eliminate errors and discrepancies while collecting data before the commencement of further processing of the data for statistical analysis. Participants with incomplete information were not included in this study to ensure the completeness and quality of the data.
Analytical Techniques, Resources, Analysis, and Interpretation
Descriptive followed by inferential statistical techniques were applied for analyzing the continuous and categorical variables using various packages of R-base/R-Studio-4.3.1. The shape of the continuous variables was delineated by descriptive statistics (mean, median, interquartile range, and standard deviation) to understand the shape of the data. Following descriptive statistics, inferential statistics (t-test) was used to compare the mean of the two groups using a statistical significance level of p < 0.05, while categorical variables were explained by frequencies as well as proportions. Proportional effect size was determined by VCramer, bias factor, VCramer Bayesian posterior, and Chi-square. VCramer and Bayesian-VCramer test for effect size estimation was interpreted as <0.4 (week/no association), 0.2–0.4 (moderate association), 0.4–0.6 (relatively strong association), 0.6–0.8 (strong association), and 0.8–1.0 (very strong association). The cut-off for interpreting the bias factor was used as - 3.4 to −2.3 (strong evidence for an alternative hypothesis) and < - 4.61 is decisive evidence for a strong association between variables or alternative hypothesis).
COVID-19 severity-associated alteration in the components of the serum profile was ascertained by Pearson correlation (negative/positive value of correlation coefficient gives negative/positive correlation between variables, while the magnitude of the coefficient ranges from 0.0 to 1.0 indicates the strength of the association), and regression (logistic) analyses. P-value below 0.05 was the significant cut-off level. Data illustration and depiction were accomplished by using R-package ggplot2, GGally, and corrgram.
Results
Characteristics of the Serum Profile Components in COVID-19 Patients
The participants’ serum profile characteristics in terms of statistical parameters (mean ± SD and p-value) are tabulated in Table 1. The mean ± SD of inflammatory biomarkers (CRP, ferritin, and NLR) by gender (males vs female/p-value) was 51.5 ± 41.4 vs 73.0 ± 43.1/p < 0.001, 700.4 ± 155.6 vs 775.0 ± 180.0/p-value <0.001, and 6.0 ± 5.1 versus 7.5 ± 3.9/p-value = 0.001 while that by severity status (highly severe vs moderately severe/p-value) was 101.7 ± 23 vs 21.7 ± 7.1/p < 0.00, 876.9 ± 123.9 vs 594.6 ± 67.4/p < 0.001, 10.5 ± 3.2 vs 2.8 ± 0.5/p < 0.001 respectively as summarized in Table 1.
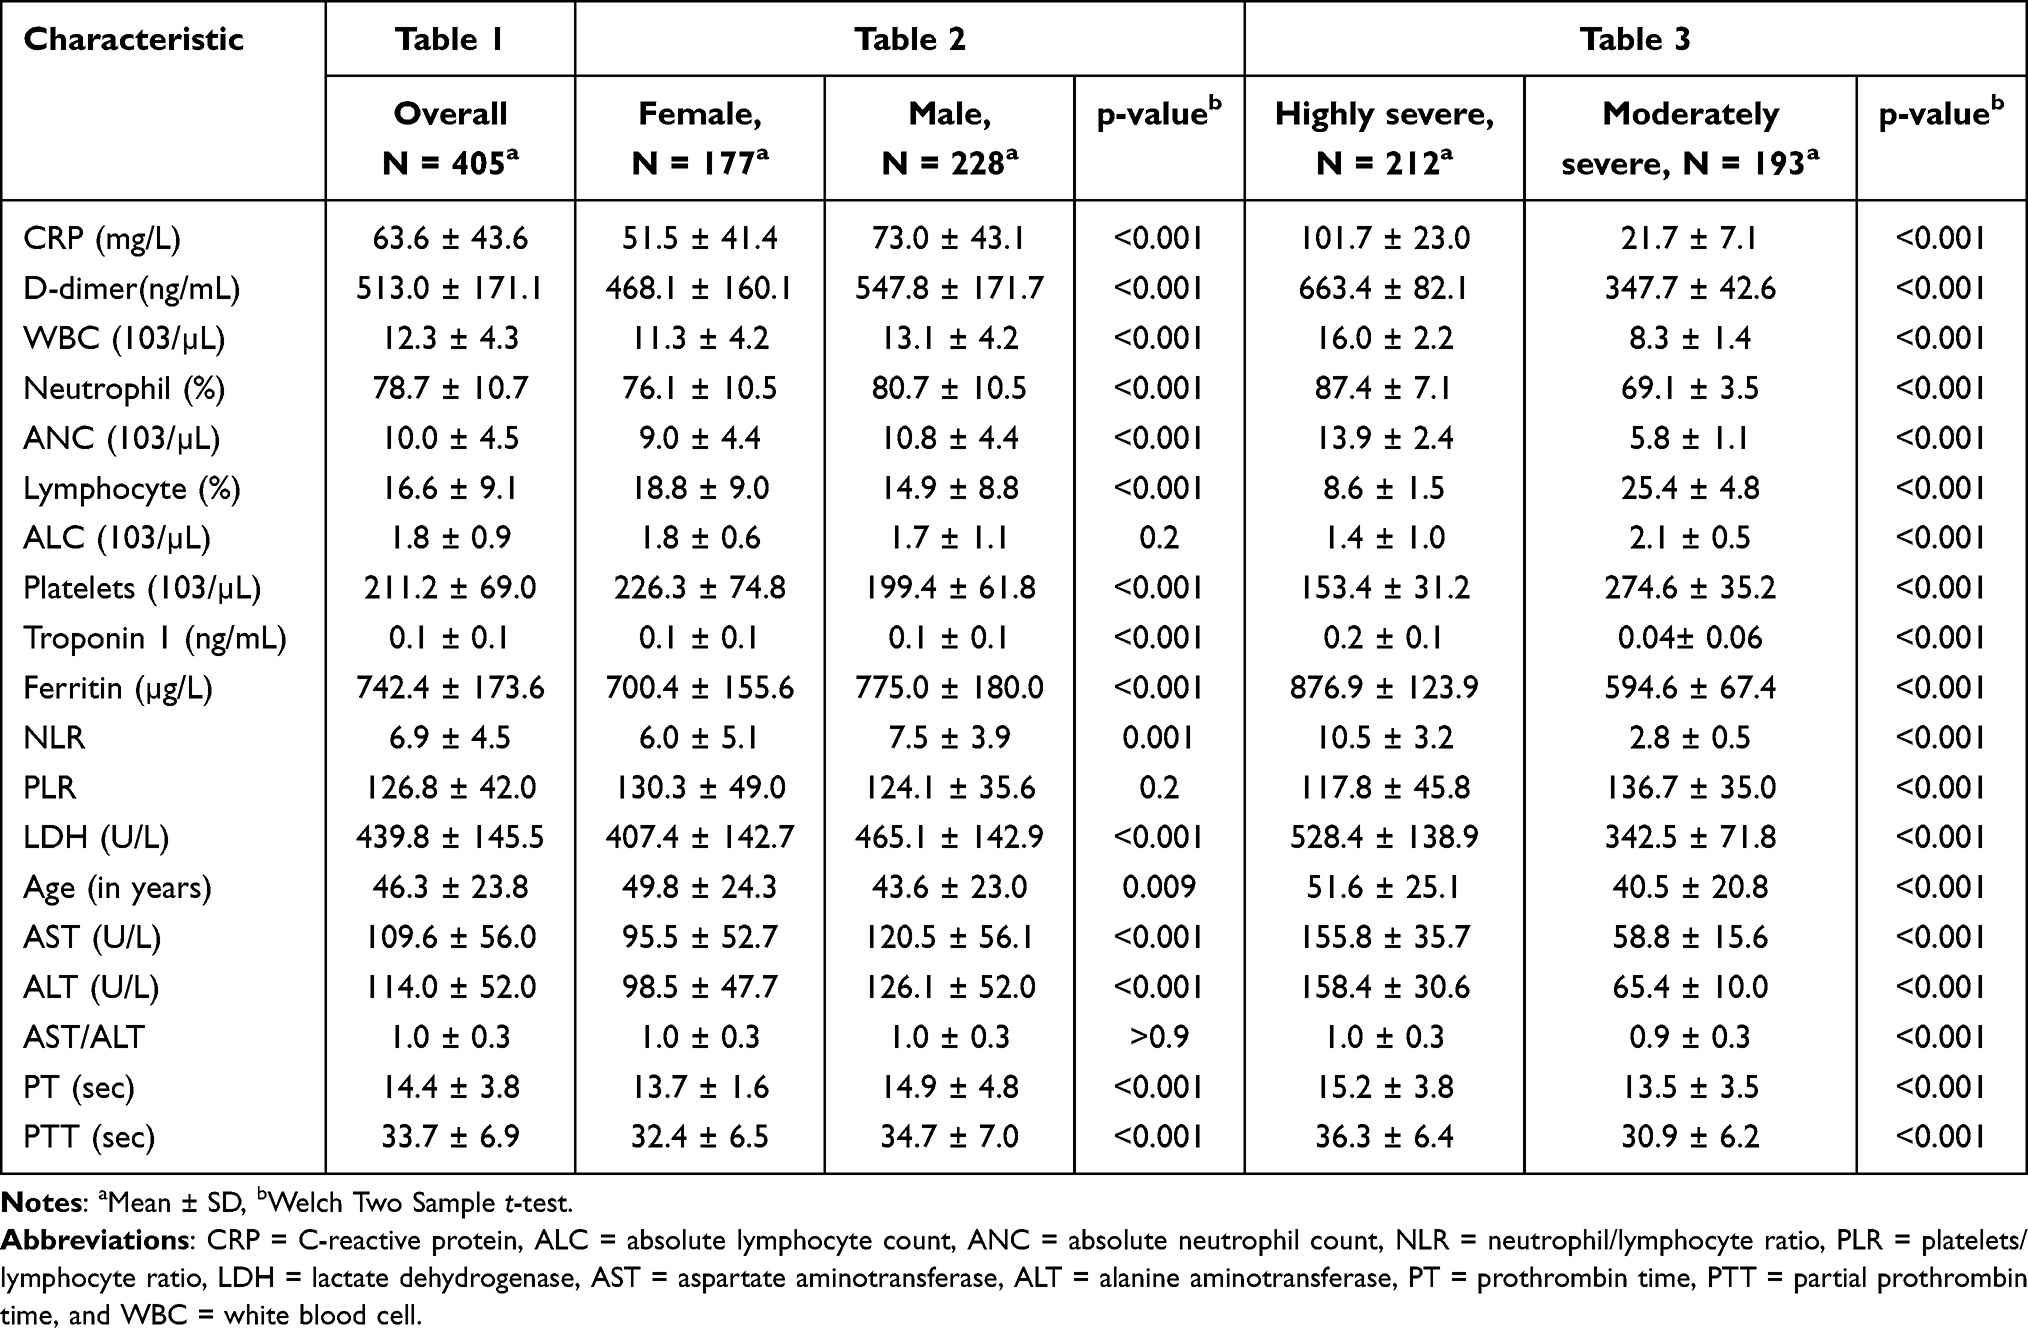 |
Table 1 Characteristics of the Patients by Gender and COVID-19 Severity Status (n = 405) |
The mean ± SD for coagulation disorder biomarkers (platelets, PT, PTT, and D-dimer) by gender (males vs female/p-value) was 468.1 ± 160.1 vs 547.8 ± 171.7/p < 0.001, 226.3 ± 74.8 vs 199.4 ± 61.8/p < 0.001, 13.7 ± 1.6 vs 14.9 ± 4.8/p < 0.001, and 32.4 ± 6.5 vs 34.7 ± 7.0/p < 0.001. At the same time, that by the severity status (highly severe vs moderately severe/p-value) was 663.4 ± 82.1 vs 347.7 ± 42.6/p < 0.001, 153.4 ± 31.2 vs 274.6 ± 35.2/p < 0.001, 15.2 ± 3.8 vs 13.5 ± 3.5/p < 0.001, 36.3 ± 6.4 vs 30.9 ± 6.2/p < 0.001, respectively (Table 1).
The mean ± SD of cardiac (troponin 1 and LDH) and biomarkers hepatic function (AST enzyme, ALT enzyme, and AST/ALT ratio) by gender (males vs female/p-value) and by severity status (highly severe vs moderately severe/p-value) was computed to be (0.1 ± 0.1 vs 0.1 ± 0.1/p < 0.001 and 407.4 ± 142.7 vs 465.1 ± 142.9/p < 0.001) and (95.5 ± 52.7 vs 120.5 ± 56.1/p < 0.001, 98.5 ± 47.7 vs 126.1 ± 52.0/p-value <0.001 and 1.0 ± 0.3 versus 1.0 ± 0.3/p-value >0.9), and (0.2 ± 0.1 versus 0.04 ± 0.06/p-value <0.001 and 528.4 ± 138.9 vs 342.5 ± 71.8/p-value <0.001) and (155.8 ± 35.7 versus 58.8 ± 15.6/p < 0.001, 158.4 ± 30.6 versus 65.4 ± 10.0/p-value <0.001, and 1.0 ± 0.3 versus 0.9 ± 0.3/p-value <0.001), respectively, as described in Table 1. For the overall (n = 405) participants, by gender, and by severity status, the mean ± SD of various components of the serum profile are summarized in Table 1.
The Magnitude of Effect Sizes and Proportionality Analysis
Based on troponin 1 concentration, a difference (significant) in the proportion of low-risk troponin level and high-risk troponin level participants was observed in the highly severe group (N/%; 180/85% and N/%; 32/15%; p-value <0.001), a difference (statistically significant) in proportion was also noticed between normal troponin level and low-risk troponin level patients in moderately severe participants (N/%; 124/64% and N/%; 69/36%; p < 0.001). The overall effect sizes calculated by X2pearson, Bayesian VCramer, and BF tests were statistically significant. (X2pearson = 205; p < 0.001, VCramer = 0.71: 95% CI; 0.62, 1.00, Bayesian VCramer = 0.7; HDI: 0.64, 0.75, BF(01) = −125) as illustrated in Figure 2a.
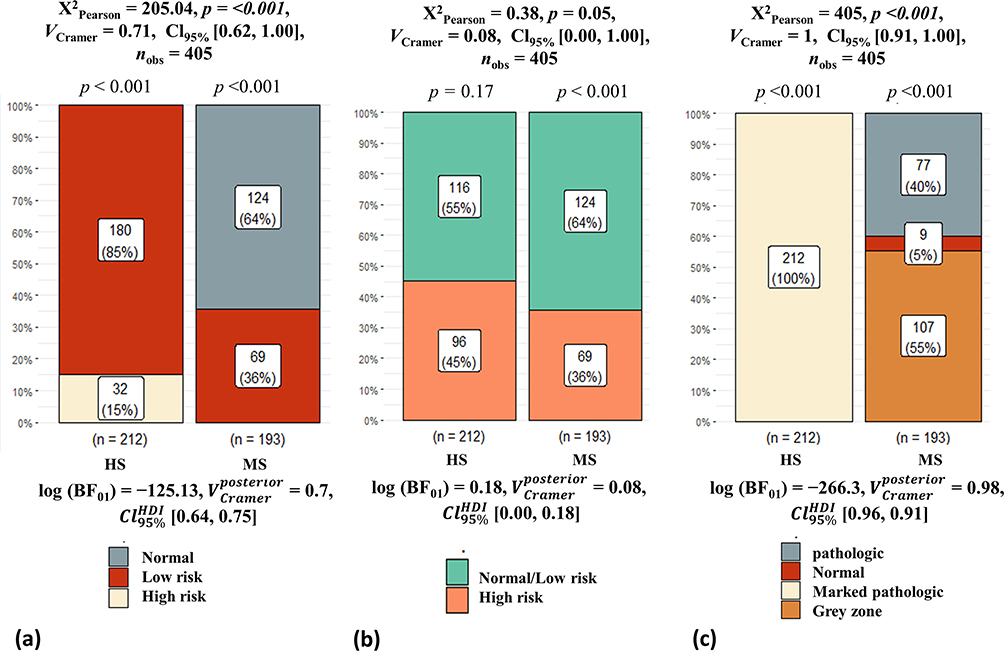 |
Figure 2 Depictive description of proportionality distribution by severity status. (a) represents the troponin 1 by severity status, (b) represents the AST/ALT ratio by severity status, and (c) depicts the neutrophil/lymphocyte ratio (NLR) status by severity scenario. Abbreviations: HS, highly severe; MS, moderately severe; HDI, highest-density interval; BF, bias factor; CI, confidence interval. |
Moreover, a difference (statistically significant) in the proportion of normal/low-risk and high-risk patients based on the AST/ALT ratio was observed in the moderately severe group (N/%; 124/64% and N/%; 69/36%; p < 0.001), on the contrary, the difference in proportions of normal/low-risk and high-risk was not a significant highly severe group (N/%; 116/55% and N/%; 96/45%; p = 0.17). However, the overall effect sizes calculated by X2pearson, Bayesian VCramer, and BF tests were not significant. (X2pearson = 0.38; p = 0.5, VCramer = 0.08: 95% CI; 0.00, 1.00, Bayesian VCramer = 0.08; HDI: 0.00, 0.18, BF(01) = 0.18) as illustrated in Figure 2b.
Furthermore, NLR proportionality analysis indicates the marked-pathological conditions for all the highly severe patients conversely, a difference (significant) in the proportions of normal, pathologic, and grey zone participants in moderately severe participants was observed (N/%; 0/5%, N/%; 77/40%, N/%; 107/55%; p < 0.001). The overall effect sizes determined by X2pearson, Bayesian VCramer, and BF tests were statistically significant. (X2pearson = 405; p < 0.001, VCramer = 1: 95% CI; 0.91, 1.00, Bayesian VCramer = 0.98; HDI: 0.96, 0.91, BF(01) = −266) as illustrated in Figure 2c.
The Magnitude of Correlations Between Serum Profile Components by Severity Status
The overall correlation between troponin 1 with LDH (r/coef = 0.757), AST (r/coef = 0.6), ALT (r/coef = 0.743), AST/ALT ratio (r/coef = 0.138) was statistically significant (p-value under 0.01) that is depicted in Figure 3a. The overall correlation between CRP with ferritin (r/coef = 0.743), NLR (r/coef = 0.77), PLR (r/coef = −0.195), and WBC (r/coef = 0.8) was found to be significant (p-value under 0.01) that is depicted in Figure 3b. The overall correlation between D-dimer with platelets (r/coef = −0.81), PT (r/coef = 0.37), and PTT (r/coef = 0.23) was statistically significant (p-value below 0.01) which is depicted in Figure 4. Moreover, group-specific correlations between parameters of cardiac, liver function, inflammatory markers, and coagulation-disorder biomarkers with the level of significance are also illustrated in Figures 3a and b and 4 respectively.
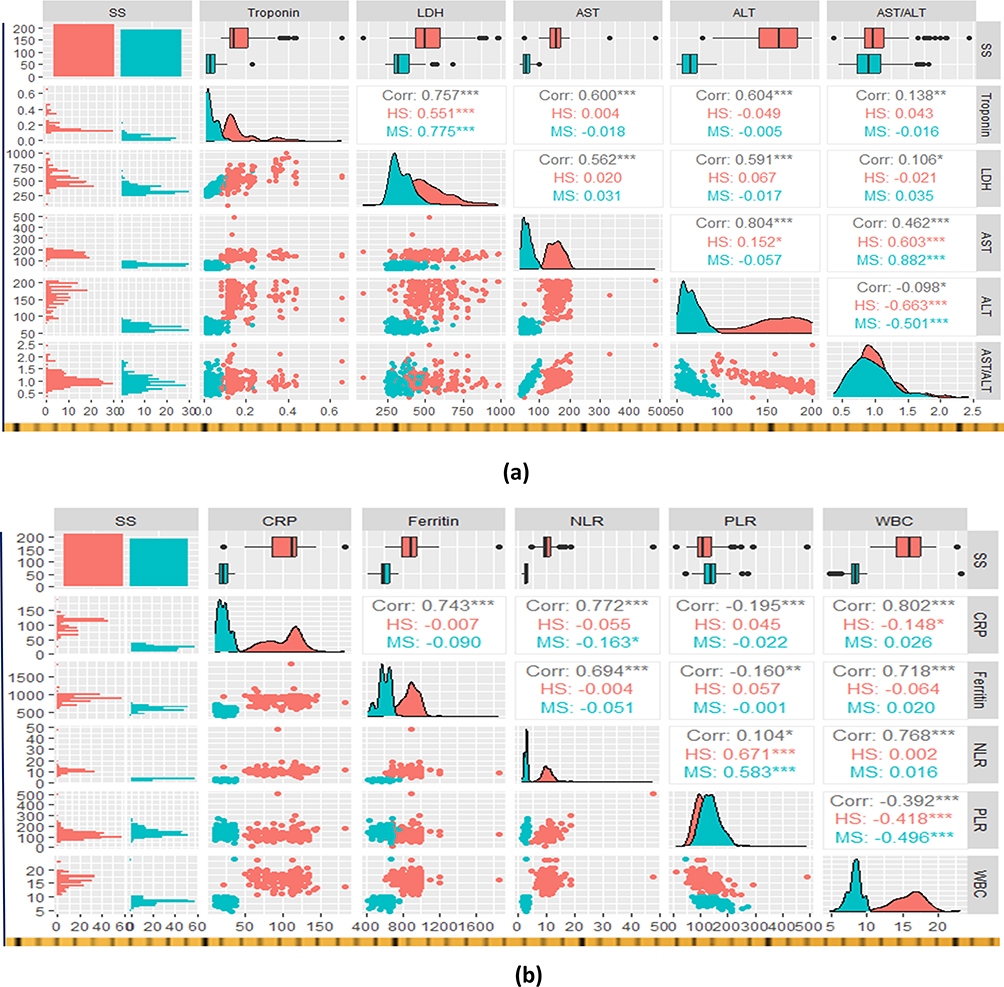 |
Figure 3 An illustrative description of correlations between components of serum profile by COVID-19 severity status. (a) depicts the correlation between cardiac and liver function biomarkers by COVID-19 severity status, and (b) represents the correlation between inflammatory biomarkers by severity status. asterisk number represents the level of statistical significance (* = weak correlation, ** = moderate correlation, and *** = strong correlation), MS = moderately sever, SS = severity status. The top and right view of the correlogram illustrate the continuous and categorical variables by severity status in the form of boxplots and bar diagrams respectively. |
 |
Figure 4 Depiction of correlation between components of serum profile (inflammatory and coagulation disorder biomarkers) by COVID-19 severity. asterisk number represents the level of statistical significance (* = weak correlation, ** = moderate correlation, and *** = strong correlation), MS = moderately severe, SS = severity status. The top and right view of the correlogram illustrate the continuous and categorical variables by severity status in the form of boxplots and bar diagrams respectively. |
The Magnitude of Association Between Serum Profile Components by Severity Status
In addition to that, the magnitude of COVID-19 severity-associated modulation in the major components of the serum profile is summarized in Table 2. COVID-19 severity-associated modulation in the inflammatory biomarkers (CRP, ferritin, and NLR) was measured, and the findings are summarized in Table 2. An increase in CRP, ferritin, and NLR by one unit explains 1.346 (adjusted odds ratio (adOR)/1.346: CI/1.15, 1.57: p-value below 0.001), 1.05 (adOR/1.05: CI; 1.032, 1.067: p < 0.001), and 1.46 (adOR/1.46: CI; 1.15, 1.67: p higher than 0.05) times higher odds of suffering from infection with high severity compared to the moderate severity of the COVID-19 infection. Moreover, the odds of showing marked pathological and pathological conditions as compared to normal were 1.18 and 1.12 times higher in the highly-severe group compared to the moderately-severe group (adOR/1.18: CI/1.04, 2.18: p-value lesser than 0.001) and (adOR/1.12: CI: 1.01, 1.20/p-value <0.05).
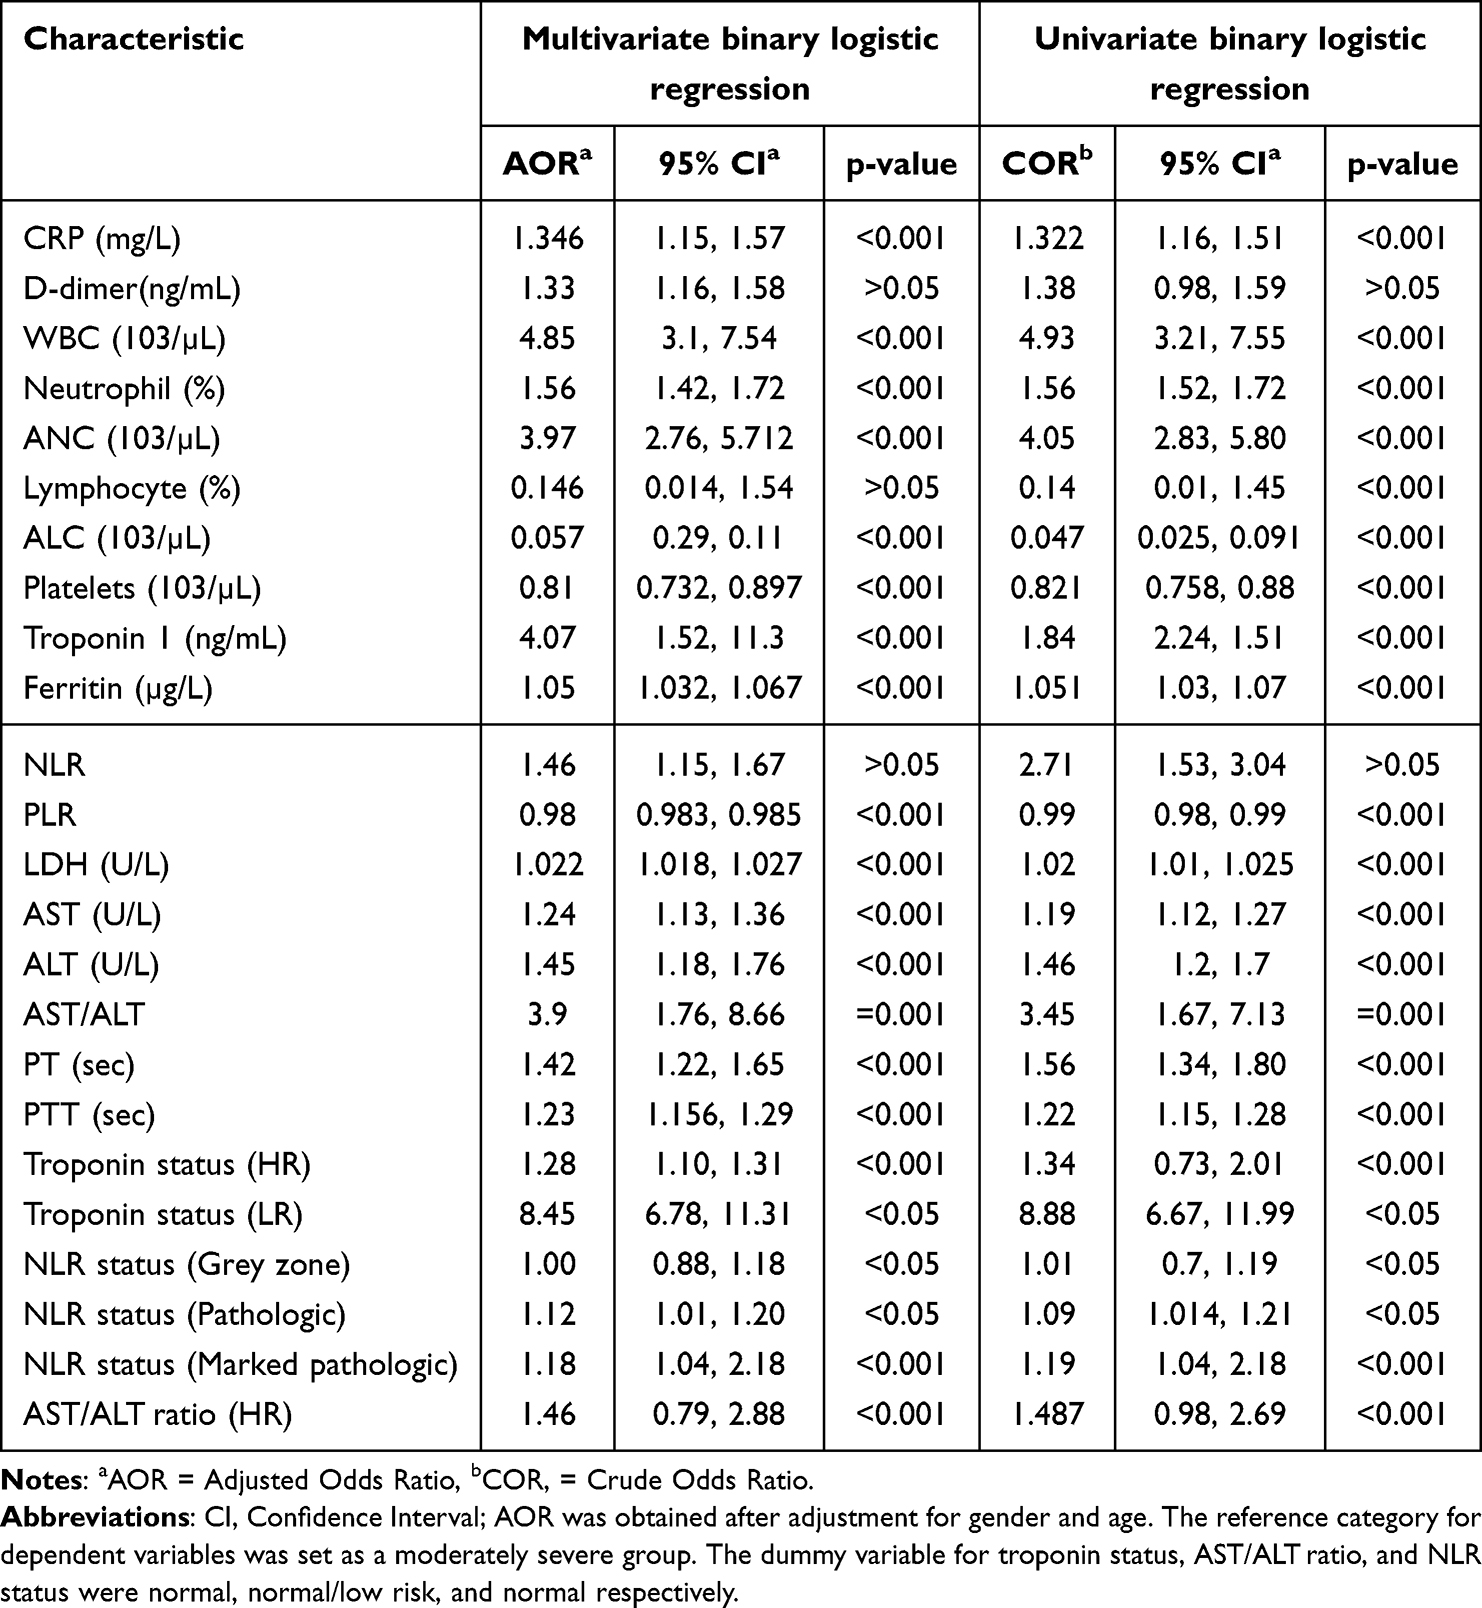 |
Table 2 Tabulation of the Magnitude of Association (Regression Analyses) of COVID-19 Infection with Modulations in Components of Serum Profile (n = 405) |
Furthermore, the odds of being highly severe against moderately severe were 1.33, 1.42, and 1.23 times higher with a unit increase in D-dimer (adOR/1.33: CI/1.16, 1.58. p > 0.05), PT (adOR/1.42: CI/1.22, 1.65: p-value <0.001), and PTT (adOR/1.23: CI; 1.156, 1.29: p < 0.001) level. The odds of being highly severe were 0.81 times lower than moderately severe (adOR/0.81: CI/0.732, 0.897: p-value below 0.001) as mentioned in Table 2. The odds of highly severe compared to moderately severe were 4.07 (adOR/4.07: CI:1.52, 11.3: p-value under 0.001) times greater a unit increase in troponin 1 concentration (Table 2). Additionally, the odds of high-risk (HR) troponin 1 status compared to normal troponin status were 1.28 (adjusted odds ratio (adOR/1.28: CI: 1.10, 1.31: p value <0.001) times higher in the highly severe patients compared to moderately-sever participants; however, the higher odds (8.45) of low risk (LR) troponin status compared to normal troponin 1 level was measured in highly-severe patients compared to moderately-severe individuals (adOR/8.45: CI: 6.78, 11.31: p-value below 0.05) as tabulated in Table 2.
Furthermore, higher odds (1.46) of High-risk (HR) AST/ALT ratio compared to normal/low-risk AST/ALT were measured in highly severe patients compared to moderately severe individuals (adOR/1.46: CI; 0.79, 2.88: p-value below 0.001). With an increase in the AST/ALT ratio by unit 1, the odds of being highly severe compared to a moderately severe increase by 3.9 (adOR/3.9: CI; 1.76, 8.66: p-value = 0.001). With a unit increase in AST and ALT enzyme levels, the odds of being highly severe as compared to moderately severe increases by 1.24 (adOR/1.24: CI: 1.13, 1.36: p value below 0.001) and 1.45 (adOR/1.45: CI: 1.18, 1.76: p value below 0.001), respectively (Table 2).
Discussion
Pulmonary and extra-pulmonary (coagulation disorder, hepatological dysfunction, cardiac function related-risk) impact of COVID-19 is paramount.11 Biomarkers are objectively measurable characteristics that are assessed as indicators of normal and abnormal physiological processes and the pharmacological responses to therapy.46 The role of various classes of potential biomarkers (antecedent, screening, diagnostic, staging, and prognostic biomarkers)46 is crucial for the development of medical therapeutic interventions.47 The current study explains COVID-19 severity-associated alteration in the major components (biomarkers) of the serum profile. A set of biomarkers of the serum profile evaluated in this study explains the specific normal or abnormal pathophysiological process such as evaluation of AST, ALT, AST/ALT ratio gives insight into the hepatological implications of SARS-CoV-2 infection.48 Level of the n = 18 laboratory parameters by disease-severity status, magnitude of overall and severity group-specific correlations between different parameters, and strength of COVID-19-associated alterations in these parameters have been determined. Significantly high concentrations of CRP and ferritin and high NLR were observed in highly severe patients (p < 0.001) Table 1. In addition, the NLR suggests that all highly severe patients were in marked-pathologic (NLR >5) condition, nevertheless, in the moderately severe group, patients were in pathologic (NLR >3-5 or <0.7) and grey zone (NLR = 2–3) state compared to a normal state (p-value < 0.001) that is represented in Figure 2c which corroborates reports that is indicative of the COVID-19 severity-associated neutrophilia, high-NLR, high WBC counts.49,50 The present study result showed the association of CRP, ferritin, and NLR with highly severe conditions (adOR /1.346: CI; 1.15, 1.57: p-value below 0.001), (adOR /1.05: CI; 1.032, 1.067: p-value below 0.001), and (adOR) /1.46:CI/1.15, 1.67: p-value greater than 0.05) as compared to moderately severe state of the COVID-19 infection. Turgunova et al also reported the prognostic value of NLR along with other potential biomarkers termed soluble Trigger receptor-expressed on myeloid cells-1 (sTREM-1) in predicting the COVID-19-associated-mortality.51 Significant elevation in CRP and ferritin concentration was associated significantly with COVID-19 severity.50 Enhanced CRP levels and marked CRP concentration were reported in highly severe participants as compared to mild/non-severe individuals.35,52–56 A higher proportion of increased CRP concentration in highly severe compared to non-sever patients has been reported too.57 Neutrophilia and high NLR in highly severe patients suggest the stress on neutrophil reserves contained in the bone marrow during a severe state of COVID-19 infection, and the evaluation of the biomarkers provides information on the severity and prognosis of the disease.58 Serum ferritin (high) in highly severe, autopsy patients and ICU patients compared to moderately/non-severe individuals has been reported in other studies suggesting the usefulness of ferritin biomarker for COVID-19 severity.27,59,60 Enhance mortality rate associated with the high ferritin concentration ( ferritin greater than 1000 units).61 Moreover, the present study also showed a strong positive overall correlation of CRP with ferritin (r/coef = 0.743; p-value below 0.01), NLR (r/coef = 0.77; p-value below 0.01), and WBC (r/coef = 0.8; p-value below 0.01) which shows that these inflammatory markers could be useful in early-stage prediction the disease severity. The current study’s observations and those of other studies describe the correlation (positive) of disease severity with CRP levels.62,63 CRP and ferritin could be considered potential prognosticators/predictors for COVID-19 severity. Fukui et al also observed the CRP as a potent prognosticator of COVID −19 corroborating with our finding while evaluating other biomarkers such as sialylated carbohydrate antigen KL-6 (KL-6), procalcitonin (PCT), and presepsin (PSP).64 Furthermore, a difference (p-value under 0.001) in coagulation disorder markers (platelets, PT, D-dimer, and PTT) both by severity status was observed.49 In this study, higher D-dimer, PT, PTT, and thrombocytopenia were found to be associated with COVID-19 severity (adOR/1.33: CI; 1.16, 1.58. p-value greater than 0.05), (adOR/1.42: CI/1.22, 1.65: p-value under 0.001), (adOR/1.23: CI; 1.156, 1.29: p-value under 0.001) level, and (adOR/0.81: CI; 0.732, 0.897: p-value <0.001) as mentioned in Table 2. Increased D-dimer, thrombocytopenia, prolonged PT, and PTT were found in highly severe compared to moderately severe participants, which is consistent with various other studies.50,58,65–68 D-dimer, thrombocyte count, PT, and PTT could provide worthwhile information on COVID-19 severity-related coagulation disorders (pulmonary and venous embolisms) at the initial phase of COVID-19. Moreover, two other prognostic indicators of COVID-19 chitinase-3-like protein 1 (CHI3L1) and insulin-like growth factor-binding protein acid labile subunit (IGFALS) have been reported to be more reliable than the biomarkers (CRP and D-dimer) evaluated in this study based on the receiver operating characteristic (ROC) and area under ROC curve (AUC) analysis.69 Which is suggestive of the application of CHI3L1, IGFALS in conjunction with CRP, and D-dimer biomarkers could be used as potential predictors COVID-19 severity.
The observations of this study also unraveled the raised troponin 1, LDH, AST, ALT, and AST/ALT ratios measured in highly severe compared to moderately severe participants and the level of these parameters by severity status (highly vs moderately severe) were significant (p-value below 0.001) which is in line with observations of other studies.64,70–73 Moreover, the higher odds of highly severe compared to moderately severe were observed (adOR/4.07: CI: 1.52, 11.3: p-value under 0.001), the higher odds of high-risk (HR) troponin 1 level status compared to normal troponin status (adOR/1.28: CI; 1.10, 1.31: p-value <0.001), and the higher odds (8.45) of low risk (LR) troponin status compared to normal troponin 1 level was measured in highly-severe patients compared to moderately-severe individuals (adOR/8.45: CI; 6.78, 11.31: p-value <0.05) were also observed in this study. Additionally, a difference (significant, p below 0.001) in the proportion of troponin 1 between highly severe and moderately severe groups along with strongly positive correlations of the troponin 1 with LDH (r/coef = 0.757; p-value under 0.001) suggests the extra-pulmonary cardiac impact of the severity of the disease, which may lead to the heart muscle damage in a severe state of the disease along with inflammatory cytokine storm-mediated myocardial necrosis.74 Troponin 1 could be characterized as a potential biomarker for early prediction of cardiac implications of the COVID-19 severe disease.
Current study observations included the significant difference in the values of hepatic function test parameters (AST enzyme, ALT enzyme, AST/ALT) of highly severe and moderately severe groups (p-value under 0.001). The elevated level of these markers was found to be allied with the high COVID-19 severity, which was consistent with the reports of another study.72 Also, a difference (significant, p-value below 0.05) in the proportions of individuals with normal/low-risk levels and high-risk enzyme levels based on the AST/ALT was observed. Elevated AST/ALT ratio, a potential marker for hepatocellular injury and mortality risk, has been reported.73 Additionally, another observation was that with an increase in the AST/ALT by unit 1, the odds of having a highly severe condition compared to a moderately severe condition increased by 3.9, and with one unit enhancement in AST enzyme and ALT enzyme levels the odds of being highly severe as compared to moderately severe increased by 1.24 and 1.45 times. Higher level of liver enzymes are associated with hepatic injury in hospitalized SARS-CoV-2-infected patients.71 The association of Liver injury and increased liver enzymes with highly severe COVID-19 cases was reported.75 The observations of this research suggest that attention should be given to liver function tests during the clinical management of COVID-19 especially when it is in a severe state. In addition to the predictors/prognosticators evaluated in this research, other biomarkers such as neurofilament light chain (sNfL) and glial fibrillar acidic protein (sGFAp) explaining the neurological implication were reported to be the potential predictor of COVID-19 in-hospital mortality.76 Papadopoulou et al highlighted the significance of evaluating molecular biomarkers or transcriptomic signature (differentially expressed genes) in conjunction with the serological biomarkers, such as proinflammatory markers (IL-6), NLR and WBC counts and reported the enriched pathways of inflammatory response, and monocyte and neutrophil chemotaxis.77
Furthermore, the emergence of new variants/subvariants of SARS-CoV-2 with high transmissibility may cause future COVID-19 resurgence nationally or regionally, in that scenario the result of this study could used for effective clinical management of the regional outbreak especially with poor healthcare facilities. Furthermore, SARS-CoV-2 shares genomic sequence similarity with SARS-CoV and MERS-CoV by up to 80%.78 Given the similar clinical manifestation,79 and pathophysiology of the disease caused by these human coronaviruses (HCo-Vs),80 the diagnostic/prognostic values of evaluated biomarkers could be potentially applied to clinically manage the future outbreak of MERS-CoV and SARS-CoV beyond the SARS-CoV-2 resurgence in the region. Additionally, the findings of the study may also contribute to the prognostic and therapeutic requirements for other related less virulent HCo-Vs such as HCoV 229E and HCoV-OC4380,81 in a scenario when they turn highly virulent and transmissible to cause a future outbreak or resurge in the region.
Conclusion
Evaluating biomarkers (serological markers and transcriptomic signatures) is critical for understanding disease progression, diagnostic measures, prognostic indicators, and response to therapeutic interventions. In conclusion, the increased levels of CRP, NLR, D-dimer, troponin 1, LDH, AST, ALT, and AST/ALT ratio, leukocytosis, and neutrophilia were assessed to be associated with COVID-19 severity-associated. Moreover, low PLR, absolute lymphocyte count (ALC), thrombocytopenia, prolonged PT, and PTT were associated with COVID-19 severity. The finding of the research suggests that the CRP, ferritin, NLR, PLR, D-dimer, platelets, PT, PTT, AST, ALT, AST/ALT ratio, and troponin 1 biomarkers could be used as potential and promising prognosticators/predictors of COVID-19-disease severity. Clinicians’ attention to the implications of SARS-CoV-2 infection and frequent monitoring and assessment of these biomarkers in conjunction with other reported biomarkers (sNfL, sGFAp, CHI3L1, IGFALS, sTREM-1 and transcriptomic signatures such as differentially expressed genes for pathways of inflammation neutrophil and monocyte chemotaxis) are recommended to be focused on laying down the policies and decision-making for managing the infected patients clinically, in a holistic and evidence-based manner.
Data Sharing Statement
Data related to this research can be requested from the corresponding author with appropriate reasons.
Acknowledgment
The author acknowledges the contribution of Al-Baha University for facilitating the dry laboratory and the Qunfudah Hospital, Al-Qunfudah, KSA for providing the secondary data of various laboratory parameters.
Funding
The research did not receive funds.
Disclosure
The author reports no conflicts of interest in this work.
References
1. Rahimi F, Abadi ATB. Emergence of the Omicron SARS-CoV-2 subvariants during the COVID-19 pandemic–correspondence. Int j Surg. 2022;1:106994.
2. Islam S, Islam T, Islam MR. New coronavirus variants are creating more challenges to global healthcare system: a brief report on the current knowledge. Clini Pathol. 2022;15:2632010X2210755. doi:10.1177/2632010X221075584
3. Are EB, Song Y, Stockdale JE, Tupper P, Colijn C. COVID-19 endgame: from pandemic to endemic? Vaccination, reopening and evolution in low- and high-vaccinated populations. J Theor Biol. 2023;559:111368. doi:10.1016/j.jtbi.2022.111368
4. Lavine JS, Bjornstad ON, Antia R. Immunological characteristics govern the transition of COVID-19 to endemicity. Science. 2021;371(6530):741–745. doi:10.1126/science.abe6522
5. Saad-Roy CM, Morris SE, Baker RE, et al. Medium-term scenarios of COVID-19 as a function of immune uncertainties and chronic disease. J Royal Soc Inter. 2023;20(205):20230247. doi:10.1098/rsif.2023.0247
6. Nesteruk I. Endemic characteristics of SARS-CoV-2 infection. Sci Rep. 2023;13(1):14841. doi:10.1038/s41598-023-41841-8
7. Nesteruk I. Epidemic waves caused by SARS‐CoV‐2 omicron (B. 1.1. 529) and pessimistic forecasts of the COVID‐19 pandemic duration. MedComm. 2022;3(1). doi:10.1002/mco2.122
8. Gupta P, Gupta V, Singh CM, Singhal L. Emergence of COVID-19 variants: An update. Cureus. 2023;15(7).
9. Gupta D, Biswas D, Kabiraj P. COVID-19 outbreak and Urban dynamics: regional variations in India. GeoJournal. 2022;87(4):2719–2737. doi:10.1007/s10708-021-10394-6
10. Méndez-Arriaga F. The temperature and regional climate effects on communitarian COVID-19 contagion in Mexico throughout Phase 1. Sci Total Environ. 2020;735:139560. doi:10.1016/j.scitotenv.2020.139560
11. Gupta A, Madhavan MV, Sehgal K, et al. Extrapulmonary manifestations of COVID-19. Nature Med. 2020;26(7):1017–1032. doi:10.1038/s41591-020-0968-3
12. Cherry JD, Krogstad P. SARS: the first pandemic of the 21st century. Pediatr Res. 2004;56(1):1–5. doi:10.1203/01.Pdr.0000129184.87042.Fc
13. Zaki AM, Van Boheemen S, Bestebroer TM, Osterhaus AD, Fouchier RA. Isolation of a novel coronavirus from a man with pneumonia in Saudi Arabia. N Engl J Med. 2012;367(19):1814–1820. doi:10.1056/NEJMoa1211721
14. Devaux CA, Rolain J-M, Raoult D. ACE2 receptor polymorphism: susceptibility to SARS-CoV-2, hypertension, multi-organ failure, and COVID-19 disease outcome. J Micro Immun Infect. 2020;53(3):425–435. doi:10.1016/j.jmii.2020.04.015
15. Li J, Lai S, Gao GF, Shi W. The emergence, genomic diversity and global spread of SARS-CoV-2. Nature. 2021;600(7889):408–418. doi:10.1038/s41586-021-04188-6
16. Alaiya A, Alshukairi A, Shinwari Z, et al. Alterations in the plasma proteome induced by SARS-CoV-2 and MERS-CoV reveal biomarkers for disease outcomes for COVID-19 patients. J Inflamm Res. 2021;14:4313–4328. doi:10.2147/jir.S322430
17. Tekle E, Gelaw Y, Asrie F. hematological profile changes among oral contraceptive users: a narrative review. J Blood Med. 2022;13:525–536. doi:10.2147/jbm.S379841
18. Abdullateef Abdullah Z, Fouad Ali L. Role of serum ferritin, d-dimer, and c-reactive protein parameters in COVID 19 severity. Arch Razi Inst Apr. 2023;78(2):737–742. doi:10.22092/ari.2022.359731.2466
19. Alvarez M, Trent E, Goncalves BDS, et al. Cognitive dysfunction associated with COVID-19: Prognostic role of circulating biomarkers and microRNAs. Front Aging Neurosci. 2022;14:1020092. doi:10.3389/fnagi.2022.1020092
20. Group BDW, Atkinson AJ Jr, Colburn WA, et al. Biomarkers and surrogate endpoints: preferred definitions and conceptual framework. Clin Pharmacol Ther. 2001;69(3):89–95.
21. Hulkoti VS, Acharya S, Kumar S, et al. Association of serum ferritin with COVID-19 in a cross-sectional study of 200 intensive care unit patients in a rural hospital: is ferritin the forgotten biomarker of mortality in severe COVID-19? J Fam Med Primary Care. 2022;11(5):2045. doi:10.4103/jfmpc.jfmpc_1921_21
22. Ye Q, Wang B, Mao J. Cytokine storm in COVID-19 and treatment. J Infect. 2020;80(6):607–613. doi:10.1016/j.jinf.2020.03.037
23. Pedersen SF, Ho Y-C. SARS-CoV-2: a storm is raging. J Clin Invest. 2020;130(5):2202–2205. doi:10.1172/JCI137647
24. Lillicrap D. Disseminated intravascular coagulation in patients with 2019‐nCoV pneumonia. J Thromb Haemost. 2020;18(4):786–787. doi:10.1111/jth.14781
25. Sakthivadivel V, Bohra GK, Maithilikarpagaselvi N, et al. Association of inflammatory markers with COVID-19 outcome among hospitalized patients: Experience from a tertiary healthcare center in western India. Maedica. 2021;16(4):620–627. doi:10.26574/maedica.2021.16.4.620
26. Dai W, Rao R, Sher A, Tania N, Musante CJ, Allen R. A prototype QSP model of the immune response to SARS‐CoV‐2 for community development. CPT: Pharmacometrics & Systems Pharmacology. 2021;10(1):18–29.
27. Kaushal K, Kaur H, Sarma P, et al. Serum ferritin as a predictive biomarker in COVID-19. A systematic review, meta-analysis and meta-regression analysis. J Crit Care. 2022;67:172–181. doi:10.1016/j.jcrc.2021.09.023
28. Lindsley AW, Schwartz JT, Rothenberg ME. Eosinophil responses during COVID-19 infections and coronavirus vaccination. J Allergy Clin Immunol. 2020;146(1):1–7. doi:10.1016/j.jaci.2020.04.021
29. de Guadiana-Romualdo L G, Morell-García D, Rodríguez-Fraga O, et al. Cardiac troponin and COVID-19 severity: results from BIOCOVID study. Eur J Clin Invest. 2021;51(6):e13532. doi:10.1111/eci.13532
30. Hu R, Han C, Pei S, Yin M, Chen X. Procalcitonin levels in COVID-19 patients. Int J Antimicrob Agent. 2020;56(2):106051. doi:10.1016/j.ijantimicag.2020.106051
31. Fialek B, Pruc M, Smereka J, et al. Diagnostic value of lactate dehydrogenase in COVID-19: a systematic review and meta-analysis. Cardiol J. 2022;29(5):751–758. doi:10.5603/CJ.a2022.0056
32. Lin Z, Long F, Yang Y, Chen X, Xu L, Yang M. Serum ferritin as an independent risk factor for severity in COVID-19 patients. J Infect. 2020;81(4):647–679. doi:10.1016/j.jinf.2020.06.053
33. Zhang H, Wang X, Fu Z, et al. Potential factors for prediction of disease severity of COVID-19 patients. MedRxiv. 2020;
34. El-Lateef AE A, Ismail MM, Thabet G, Cabrido NA. Complete blood cells count abnormalities in COVID-19 patients and their prognostic significance: Single center study in Makkah, Saudi Arabia. Saudi Med J. 2022;43(6):572–578. doi:10.15537/smj.2022.43.6.20210893
35. Chen T, Wu D, Chen H, et al. Clinical characteristics of 113 deceased patients with coronavirus disease 2019: retrospective study. BMJ. 2020;368.
36. Moon AM, ASt B. Elevated liver enzymes in patients with COVID-19: Look, but not too hard. Dig Dis Sci. 2021;66(6):1767–1769. doi:10.1007/s10620-020-06585-9
37. Motoc NS, Man MA, Urda AEC, Ruta VM, Todea DA, Pop CM. Neutrophil-to-Lymphocyte ratio and platelets-to-lymphocytes ratio in severe COPD exacerbation: the importance of obstructive sleep apnea. Eur Respir Soc. 2019.
38. Samprathi M, Jayashree M. Biomarkers in COVID-19: an up-to-date review. Frontiers in Pediatrics. 2021;8:607647. doi:10.3389/fped.2020.607647
39. Samadizadeh S, Masoudi M, Rastegar M, Salimi V, Shahbaz MB, Tahamtan A. COVID-19: why does disease severity vary among individuals? Respir Med. 2021;180:106356. doi:10.1016/j.rmed.2021.106356
40. Zahorec R. Neutrophil-to-lymphocyte ratio, past, present and future perspectives. Bratisl Lek Listy. 2021;122(7):474–488. doi:10.4149/bll_2021_078
41. Wu L, Zou S, Wang C, Tan X, Yu M. Neutrophil-to-lymphocyte and platelet-to-lymphocyte ratio in Chinese Han population from Chaoshan region in South China. BMC Cardiovar Disorder. 2019;19:1–5. doi:10.1186/s12872-019-1110-7
42. Tanislav C, Guenduez D, Liebetrau C, et al. Cardiac Troponin I: A valuable biomarker indicating the cardiac involvement in Fabry disease. PLoS One. 2016;11(6):e0157640. doi:10.1371/journal.pone.0157640
43. Lai P-H, Ding D-C. Acute liver injury in a COVID-19 infected woman with mild symptoms: a case report. World J Clini Case. 2023;11(2):472–478. doi:10.12998/wjcc.v11.i2.472
44. Yamane T. Statistics an Industry Analysis 2ndEd. New York: Harper & Row; 1967.
45. Wang D, Hu B, Hu C, et al. Clinical characteristics of 138 hospitalized patients with 2019 novel coronavirus–infected pneumonia in Wuhan, China. JAMA. 2020;323(11):1061–1069. doi:10.1001/jama.2020.1585
46. Chen XH, Huang S, Kerr D. Biomarkers in clinical medicine. IARC Sci Publ. 2011;(163):303–322.
47. Califf RM. Biomarker definitions and their applications. Exp Biol Med. 2018;243(3):213–221. doi:10.1177/1535370217750088
48. Abdelrahman MM, Abdel-Baset AA, Younis MA, Mahmoud MG, Shafik NS. Liver function test abnormalities in COVID-19 patients and factors affecting them - a retrospective study. Clin Exp Hepatol. 2021;7(3):297–304. doi:10.5114/ceh.2021.109225
49. Palladino M. Complete blood count alterations in COVID-19 patients: a narrative review. Biochem Med (Zagreb). 2021;31(3):030501. doi:10.11613/bm.2021.030501
50. Ismail MM, Gamal T, Nur-Anna C, Cabrido N-A. Complete blood cells count abnormalities in COVID-19 patients and their prognostic significance. Saudi Med J. 2022;43(6):572–578. doi:10.15537/smj.2022.43.6.20210893
51. Turgunova L, Mekhantseva I, Akhmaltdinova L, Kostinov M, Zhumadilova Z, Turmukhambetova A. Association of sTREM‐1 and neutrophil-to-Lymphocyte ratio as prognostic markers in COVID-19 short-and long-term mortality. J Inflamm Res. 2023;Volume 16:5807–5817. doi:10.2147/JIR.S435305
52. Ali N. Elevated level of C-reactive protein may be an early marker to predict risk for severity of COVID-19. J Med Virol. 2020;92(11):2409–2411. doi:10.1002/jmv.26097
53. Chen N, Zhou M, Dong X, et al. Epidemiological and clinical characteristics of 99 cases of 2019 novel coronavirus pneumonia in Wuhan, China: a descriptive study. Lancet. 2020;395(10223):507–513. doi:10.1016/S0140-6736(20)30211-7
54. Gao Y, Li T, Han M, et al. Diagnostic utility of clinical laboratory data determinations for patients with the severe COVID‐19. J med virol. 2020;92(7):791–796. doi:10.1002/jmv.25770
55. Mo P, Xing Y, Xiao Y, et al. Clinical characteristics of refractory COVID-19 pneumonia in Wuhan, China. Clin Infect Dis. 2020;16:10.
56. W-j G, Z-y N, Hu Y, et al. Clinical characteristics of coronavirus disease 2019 in China. N Engl J Med. 2020;382(18):1708–1720. doi:10.1056/NEJMoa2002032
57. Sadeghi-Haddad-Zavareh M, Bayani M, Shokri M, et al. C-Reactive protein as a prognostic indicator in COVID-19 patients. Interdiscip Perspect Infect Dis. 2021;2021:5557582. doi:10.1155/2021/5557582
58. Dhinata KS. Common change of complete blood count parameters in COVID-19: a literature review. J Med Health. 2021;3(2). doi:10.28932/jmh.v3i2.3097
59. Vargas-Vargas M, Cortés-Rojo C. Ferritin levels and COVID-19. Rev Panam Salud Pública. 2020;44:e72.
60. Kurian SJ, Mathews SP, Paul A, et al. Association of serum ferritin with severity and clinical outcome in COVID-19 patients: an observational study in a tertiary healthcare facility. Clin Epidem Glob Health. 2023;21:101295. doi:10.1016/j.cegh.2023.101295
61. Alroomi M, Rajan R, Omar AA, et al. Ferritin level: a predictor of severity and mortality in hospitalized COVID‐19 patients. Immu Inflam Dis. 2021;9(4):1648–1655. doi:10.1002/iid3.517
62. Saputro TA, Purwaningsih NV, Ainutajriani A, Watoyani T. Correlation between Corona viruses disease (Covid-19) and C-Reactive protein (CRP) in patients at Haji Hospital Surabaya. Medicra. 2022;5(1):11–16. doi:10.21070/medicra.v5i1.1631
63. Moneer M, Fouad SH, Allam MF, et al. Do CRP levels predict severity in COVID-19 hospitalized Egyptian patients? Micro Infect Dis. 2022;3(3):534–543.
64. Fukui S, Ikeda K, Kobayashi M, et al. Predictive prognostic biomarkers in patients with COVID‑19 infection. Mol Med Rep. 2023;27(1):1–8.
65. Nemec HM, Ferenczy A, Christie BD 3rd, Ashley DW, Montgomery A. Correlation of D-dimer and outcomes in COVID-19 patients. Am Surg. 2022;88(9):2115–2118. doi:10.1177/00031348221091940
66. Yu B, Li X, Chen J, et al. Evaluation of variation in D-dimer levels among COVID-19 and bacterial pneumonia: a retrospective analysis. Journal of Thrombosis and Thrombolysis. 2020;50:548–557. doi:10.1007/s11239-020-02171-y
67. Li Y, Zhao K, Wei H, et al. Dynamic relationship between D‐dimer and COVID‐19 severity. Br J Haematol. 2020;190(1):e24. doi:10.1111/bjh.16797
68. Lehmann A, Prosch H, Zehetmayer S, et al. Impact of persistent D-dimer elevation following recovery from COVID-19. PLoS One. 2021;16(10):e0258351. doi:10.1371/journal.pone.0258351
69. Kimura Y, Nakai Y, Shin J, et al. Identification of serum prognostic biomarkers of severe COVID-19 using a quantitative proteomic approach. Sci Rep. 2021;11(1):20638. doi:10.1038/s41598-021-98253-9
70. Fazal M. C-reactive protein a promising biomarker of COVID-19 severity. Korea J Clini Lab Sci. 2021;53(3):201–207. doi:10.15324/kjcls.2021.53.3.201
71. de Lima IC, de Menezes DC, Uesugi JHE, et al. Liver Function in patients with long-term coronavirus disease 2019 of up to 20 months: a cross-sectional study. Int J Environ Res Public Health. 2023;20(7):5281. doi:10.3390/ijerph20075281
72. Fix OK, Hameed B, Fontana RJ, et al. Clinical best practice advice for hepatology and liver transplant providers during the COVID-19 pandemic: AASLD expert panel consensus statement. Hepatology. 2020;72(1):287–304. doi:10.1002/hep.31281
73. Medetalibeyoglu A, Catma Y, Senkal N, et al. The effect of liver test abnormalities on the prognosis of COVID-19. Ann. Hepatol. 2020;19(6):614–621. doi:10.1016/j.aohep.2020.08.068
74. Rasmi Y, Mosa OF, Alipour S, et al. Significance of cardiac troponins as an identification tool in COVID-19 patients using biosensors: An update. Front Mol Biosci. 2022;9:821155. doi:10.3389/fmolb.2022.821155
75. Saini RK, Saini N, Ram S, et al. COVID-19 associated variations in liver function parameters: a retrospective study. Postgrad Med J. 2022;98(1156):91–97. doi:10.1136/postgradmedj-2020-138930
76. Plantone D, Locci S, Bergantini L, et al. Brain neuronal and glial damage during acute COVID-19 infection in absence of clinical neurological manifestations. J Neurol Neurosurg Psychiatry. 2022;93(12):1343–1348. doi:10.1136/jnnp-2022-329933
77. Papadopoulou G, Manoloudi E, Repousi N, Skoura L, Hurst T, Karamitros T. Molecular and Clinical Prognostic Biomarkers of COVID-19 severity and persistence. Pathogens. 2022;11(3):311. doi:10.3390/pathogens11030311
78. Luglio M, Tannuri U, de Carvalho WB, et al. COVID-19 and Liver Damage: Narrative Review and Proposed Clinical Protocol for Critically ill Pediatric Patients. Clinics. 2020;75:e2250. doi:10.6061/clinics/2020/e2250
79. Gerges Harb J, Noureldine HA, Chedid G, et al. SARS, MERS and COVID-19: clinical manifestations and organ-system complications: a mini review. Pathog Dis. 2020;78(4). doi:10.1093/femspd/ftaa033
80. Zhou H, Yang J, Zhou C, et al. A review of SARS-CoV2: compared with SARS-CoV and MERS-CoV. Front Med Lausanne. 2021;8:628370. doi:10.3389/fmed.2021.628370
81. Masters PS; Masters PS. The molecular biology of coronaviruses. Adv Virus Res. 2006;66:193–292. doi:10.1016/S0065-3527(06)66005-3
 © 2024 The Author(s). This work is published and licensed by Dove Medical Press Limited. The
full terms of this license are available at https://www.dovepress.com/terms
and incorporate the Creative Commons Attribution
- Non Commercial (unported, 3.0) License.
By accessing the work you hereby accept the Terms. Non-commercial uses of the work are permitted
without any further permission from Dove Medical Press Limited, provided the work is properly
attributed. For permission for commercial use of this work, please see paragraphs 4.2 and 5 of our Terms.
© 2024 The Author(s). This work is published and licensed by Dove Medical Press Limited. The
full terms of this license are available at https://www.dovepress.com/terms
and incorporate the Creative Commons Attribution
- Non Commercial (unported, 3.0) License.
By accessing the work you hereby accept the Terms. Non-commercial uses of the work are permitted
without any further permission from Dove Medical Press Limited, provided the work is properly
attributed. For permission for commercial use of this work, please see paragraphs 4.2 and 5 of our Terms.