Back to Journals » Diabetes, Metabolic Syndrome and Obesity » Volume 15
Sarcopenic Obesity with Normal Body Size May Have Higher Insulin Resistance in Elderly Patients with Type 2 Diabetes Mellitus
Authors Han T, Yuan T, Liang X, Chen N, Song J, Zhao X, Weng Y, Hu Y
Received 3 February 2022
Accepted for publication 8 April 2022
Published 19 April 2022 Volume 2022:15 Pages 1197—1206
DOI https://doi.org/10.2147/DMSO.S360942
Checked for plagiarism Yes
Review by Single anonymous peer review
Peer reviewer comments 3
Editor who approved publication: Dr Konstantinos Tziomalos
Tingting Han, Ting Yuan, Xinyue Liang, Ningxin Chen, Jia Song, Xin Zhao, Yurong Weng, Yaomin Hu
Department of Geriatrics, Ren Ji Hospital, Shanghai Jiao Tong University School of Medicine, Shanghai, 200127, People’s Republic of China
Correspondence: Yaomin Hu, Department of Geriatrics, Ren Ji Hospital, Shanghai Jiao Tong University School of Medicine, No. 160 Pujian Road, Shanghai, 200127, People’s Republic of China, Tel +86 02168383815, Email [email protected]
Objective: Data are limited regarding how body composition is linked to insulin resistance in elderly patients with type 2 diabetes mellitus (T2DM). We examined the association between body composition and insulin resistance in elderly T2DM patients.
Methods: The cross-sectional study included 488 Chinese elderly patients wth T2DM. Subjects were classified into four groups based on body composition: normal body composition (NBC), low muscle mass alone (LMM), high body fat alone (HBF), both low muscle mass and high body fat (LMMHBF).
Results: The percentage of subjects with LMMHBF was 14.5% (11.9% in men and 17.7% in women). Homeostasis model assessment of insulin resistance (HOMA2-IR) was higher in the LMMHBF group than in the HBF group (p = 0.045), and was also significantly higher in the LMMHBF or HBF group than in the NBC or LMM group. The HBF group showed the highest body mass index (BMI) of the four groups of different body compositions, and the LMMHBF group showed lower BMI than the HBF group; however, there was no significant difference in BMI or waist to hip ratio (WHR) between the LMMHBF group and the NBC group. The LMMHBF and HBF groups were significantly associated with increased risk of insulin resistance compared to the NBC group, with odds ratios (ORs) of 4.47 [95% confidence interval (CI) 2.06– 9.68, p < 0.001] and 1.76 (95% CI 1.02– 3.02, p = 0.041) respectively, even after the adjustment for covariates.
Conclusion: In China, though elderly T2DM patients with the body composition of sarcopenic obesity (as defined by coexistence of low muscle mass and high body fat) seemed to have normal body size, they exhibited the most severe degree and the highest risk of insulin resistance.
Keywords: sarcopenic obesity, type 2 diabetes mellitus, elderly, insulin resistance, body composition
Introduction
The two greatest global health concerns are the aging of the population and widespread obesity, each of which has important effects on body composition. Age-related changes in different aspects of body composition may have different clinical consequences. Multiple factors are responsible for changes to body composition with aging. Muscle mass and strength decline after peaking at 30–35 years old,1 however body fat increases until 70 years old and thereafter decreases.2,3 Such that weight is mostly gained as fat rather than lean mass after 35 years old.
Coexistence of sarcopenia and obesity, the state called sarcopenic obesity (SO), is characterized as a confluence of two epidemics — an aging population and rising obesity rates.4 Sarcopenia and obesity, two of which form a vicious cycle, may act synergistically to aggravate their health threatening effects.5 Muscle mass loss with aging is associated with decreased resting metabolic rates and declined total energy consumption, which perpetuate the development of obesity.6,7 Simultaneously aging and obesity stimulate the infiltration of fat into skeletal muscle ectopically, then promote lipotoxicity and inflammation, finally exacerbating the development of sarcopenia.8–11 Visceral and ectopic fat, both of which promote a low-level inflammation, lead to insulin resistance.12 Because skeletal muscle is the primary organ of insulin-mediated glucose metabolism,13,14 sarcopenia might synergistically aggravate the development of insulin resistance induced by obesity.
Insulin resistance is an important characteristic of T2DM. In the natural course of T2DM, islet β cell function declines over time, but there is little change in the degree of insulin resistance.15 However, there has been no research on the association between body composition and insulin resistance in elderly T2DM patients. In this cross-sectional study, we classified diagnosed elderly T2DM patients into four groups based on body composition: (1) subjects with normal body composition, (2) subjects with low muscle mass alone, (3) subjects with high body fat alone, and (4) subjects with both low muscle mass and high body fat. Then we compared clinical parameters among the four groups to investigate the association of body composition with insulin resistance in elderly T2DM patients.
Methods
Sample Population
We retrospectively analyzed the medical records of 1061 diagnosed elderly T2DM patients aged 60 years or older from Renji Hospital between January 2019 and June 2021. The exclusion criteria were as follows: type 1 diabetes mellitus; specific types of diabetes due to other causes, eg, monogenic diabetes syndromes, diseases of the exocrine pancreas, diabetes caused by other endocrine diseases, and drug- or chemical-induced diabetes;16 subjects with insulin therapy; serious systemic diseases such as heavy infection, cancer, rheumatic diseases, thyroid dysfunction, severe liver and renal insufficiency, heart failure, and severe chronic obstructive pulmonary disease; the activities of daily living (ADL) score <60; inability to eat or drink normally; subjects with edema; subjects with a history of taking glucocorticoids, testosterone or estrogen; subjects with incomplete data; subjects with values of fasting plasma glucose or fasting serum C-peptide over HOMA2 calculator ranges (glucose value <3.0 mmol/L or >25.0 mmol/L, C-peptide value <0.2 nmol/L or >3.5 nmol/L). Finally a total of 488 subjects, which consisted of 268 men and 220 women, were included in this study. The study protocol was approved by the Ethical Committee of Ren Ji Hospital, Shanghai Jiao Tong University School of Medicine (Approval No. KY2021-071-B). This study was performed in accordance with the Declaration of Helsinki. All subjects were assigned numerical codes to protect their identity and the anonymized records were stored in a secure database. Informed consent was not required due to the study being a retrospective analysis of anonymized data.
Anthropometric Measurements
Anthropometric measurements including body height, weight, waist circumference (WC) and hip circumference (HC) were measured according to guidelines by the World Health Organization (WHO).17 Body height and weight measurements were taken in light clothing without shoes. Body mass index (BMI) was calculated as body weight divided by the square of height (kg/m2). WC was measured at the midpoint between the inferior margin of the last rib and the crest of the ilium in the horizontal plane. HC was measured at the level of the greatest protrusion of the buttocks. Waist to hip ratio (WHR) was calculated as WC divided by HC. Both WC and HC were taken twice and the mean value was recorded, when the subjects were standing erectly with their feet together. Blood pressure was measured twice in each subject on the right arm after five minutes resting in a sitting position by using a mercury sphygmomanometer, and the mean of two measurements was recorded.
Laboratory Analysis
After a more than 8-hour overnight fast, blood samples were collected in the morning. Plasma glucose level was measured using the glucose oxidase method. Serum C-peptide level was obtained using a bio-antibody technique (Linco, St Louis, MO, USA). Serum lipid profiles were tested with an automated biochemical instrument by radioimmunoassay (RIA) based on the double-antibody technique (DPC, Los Angeles, CA, USA). Glycated hemoglobin A1c (HbA1c) was measured by the high-performance liquid chromatography (HPLC) method with a BIO-RAD analyzer (Bio-Rad Variant II; Bio-Rad Laboratories, Hercules, CA, USA). Urinary albumin and creatinine levels were used to calculate the urine albumin to creatinine ratio (UACR), the preferred indicator for albuminuria. Insulin resistance was estimated based on the homeostasis model assessment of insulin resistance (HOMA2-IR). Because C-peptide was used to avoid the potential effect of fatty liver on insulin clearance which might distort HOMA2-IR calculation based on insulin, we entered the data of fasting serum C-peptide (nmol/L) and fasting plasma glucose (mmol/L) into the HOMA2 calculator at www.dtu.ox.ac.uk in order to calculate HOMA2-IR.18
Body Composition Analysis
Body composition was analyzed using a bioelectrical impedance analysis device (InBody770, InBody, Seoul, Korea). Skeletal Muscle Index (SMI) was calculated by dividing the total appendicular skeletal muscle mass (ASM) by the square of height (kg/m2).19 The 2019 Consensus Update of the Asian Working Group for Sarcopenia (AWGS) retains the cutoff points of SMI for low muscle mass: <7.0 kg/m2 in men and <5.7 kg/m2 in women by bioelectrical impedance.20 The American Association of Clinical Endocrinology (AACE) and American College of Endocrinology (ACE) recommend the use of the WHO body fat thresholds for the diagnosis of obesity—(men ≥25% body fat and women ≥35% body fat).21 Using these criteria, subjects in this study were classified into four groups: subjects with normal body composition (NBC), with low muscle mass alone (LMM), with high body fat alone (HBF), and with both low muscle mass and high body fat (LMMHBF).
Statistical Analysis
The normality of distributions of variables was analyzed with the Kolmogorov–Smirnov normality test. Descriptive statistics for continuous variables were presented as mean ± standard deviation if variables were normally distributed, or as median and interquartile range (25–75%) for skewed variables. Group based differences of quantitative variables were compared by analysis of variance (ANOVA) following Turkey’s test for normally distributed data and Kruskal–Wallis H-test for skewed data. Categorical variables were expressed as percentages and compared by using Pearson’s chi-squared test. Correlation analysis was performed using a Spearman’s rank correlation coefficient. Multiple logistic regression analysis was conducted to determine the correlations between different body compositions and the risk of insulin resistance after controlling for potential confounding factors. All statistical analyses were conducted utilizing SPSS, version 26.0 (SPSS Inc., Chicago, IL, USA). P values < 0.05 were considered statistically significant.
Results
Baseline Characteristics
A total of 488 elderly T2DM subjects, which consisted of 268 men and 220 women, were classified into four groups: 145 (29.7%) with NBC, 64 (13.1%) with LMM, 208 (42.6%) with HBF, and 71 (14.5%) with LMMHBF. The percentages of patients in the above four groups were 26.5%, 13.8%, 47.8%, and 11.9% in men, and 33.6%, 12.3%, 36.4%, and 17.7% in women, respectively (Figure 1). The baseline characteristics of the subjects in the four groups are presented in Table 1. The subjects with LMMHBF had higher systolic blood pressure (SBP) and diastolic blood pressure (DBP) than those with LMM. The levels of serum alanine aminotransferase (ALT), aspartate aminotransferase (AST), triglyceride (TG), fasting C-peptide (FCP) and the incidence of non-alcoholic fatty liver disease (NAFLD) were significantly higher in the subjects with HBF or LMMHBF than those with NBC or LMM. Subjects with HBF or LMMHBF also had lower serum high density lipoprotein cholesterol (HDL-C) than those with NBC. HBF group had the highest level of serum uric acid (UA) among the four groups. LMMHBF and HBF group used more insulin-sensitizing agents (biguanides, thiazolidinediones) and lipid-lowering drugs (statin, fibrate) when compared to LMM group. LMMHBF group had the highest incidence of cerebrovascular disease among the four groups. However there were no significant differences in age, diabetic duration, HbA1c, serum total cholesterol (TC), low density lipoprotein cholesterol (LDL-C), creatinine, UACR, the ADL score, the incidences of hypertension and cardiovascular disease, and the use of alcohol or smoking among the four groups of different body compositions.
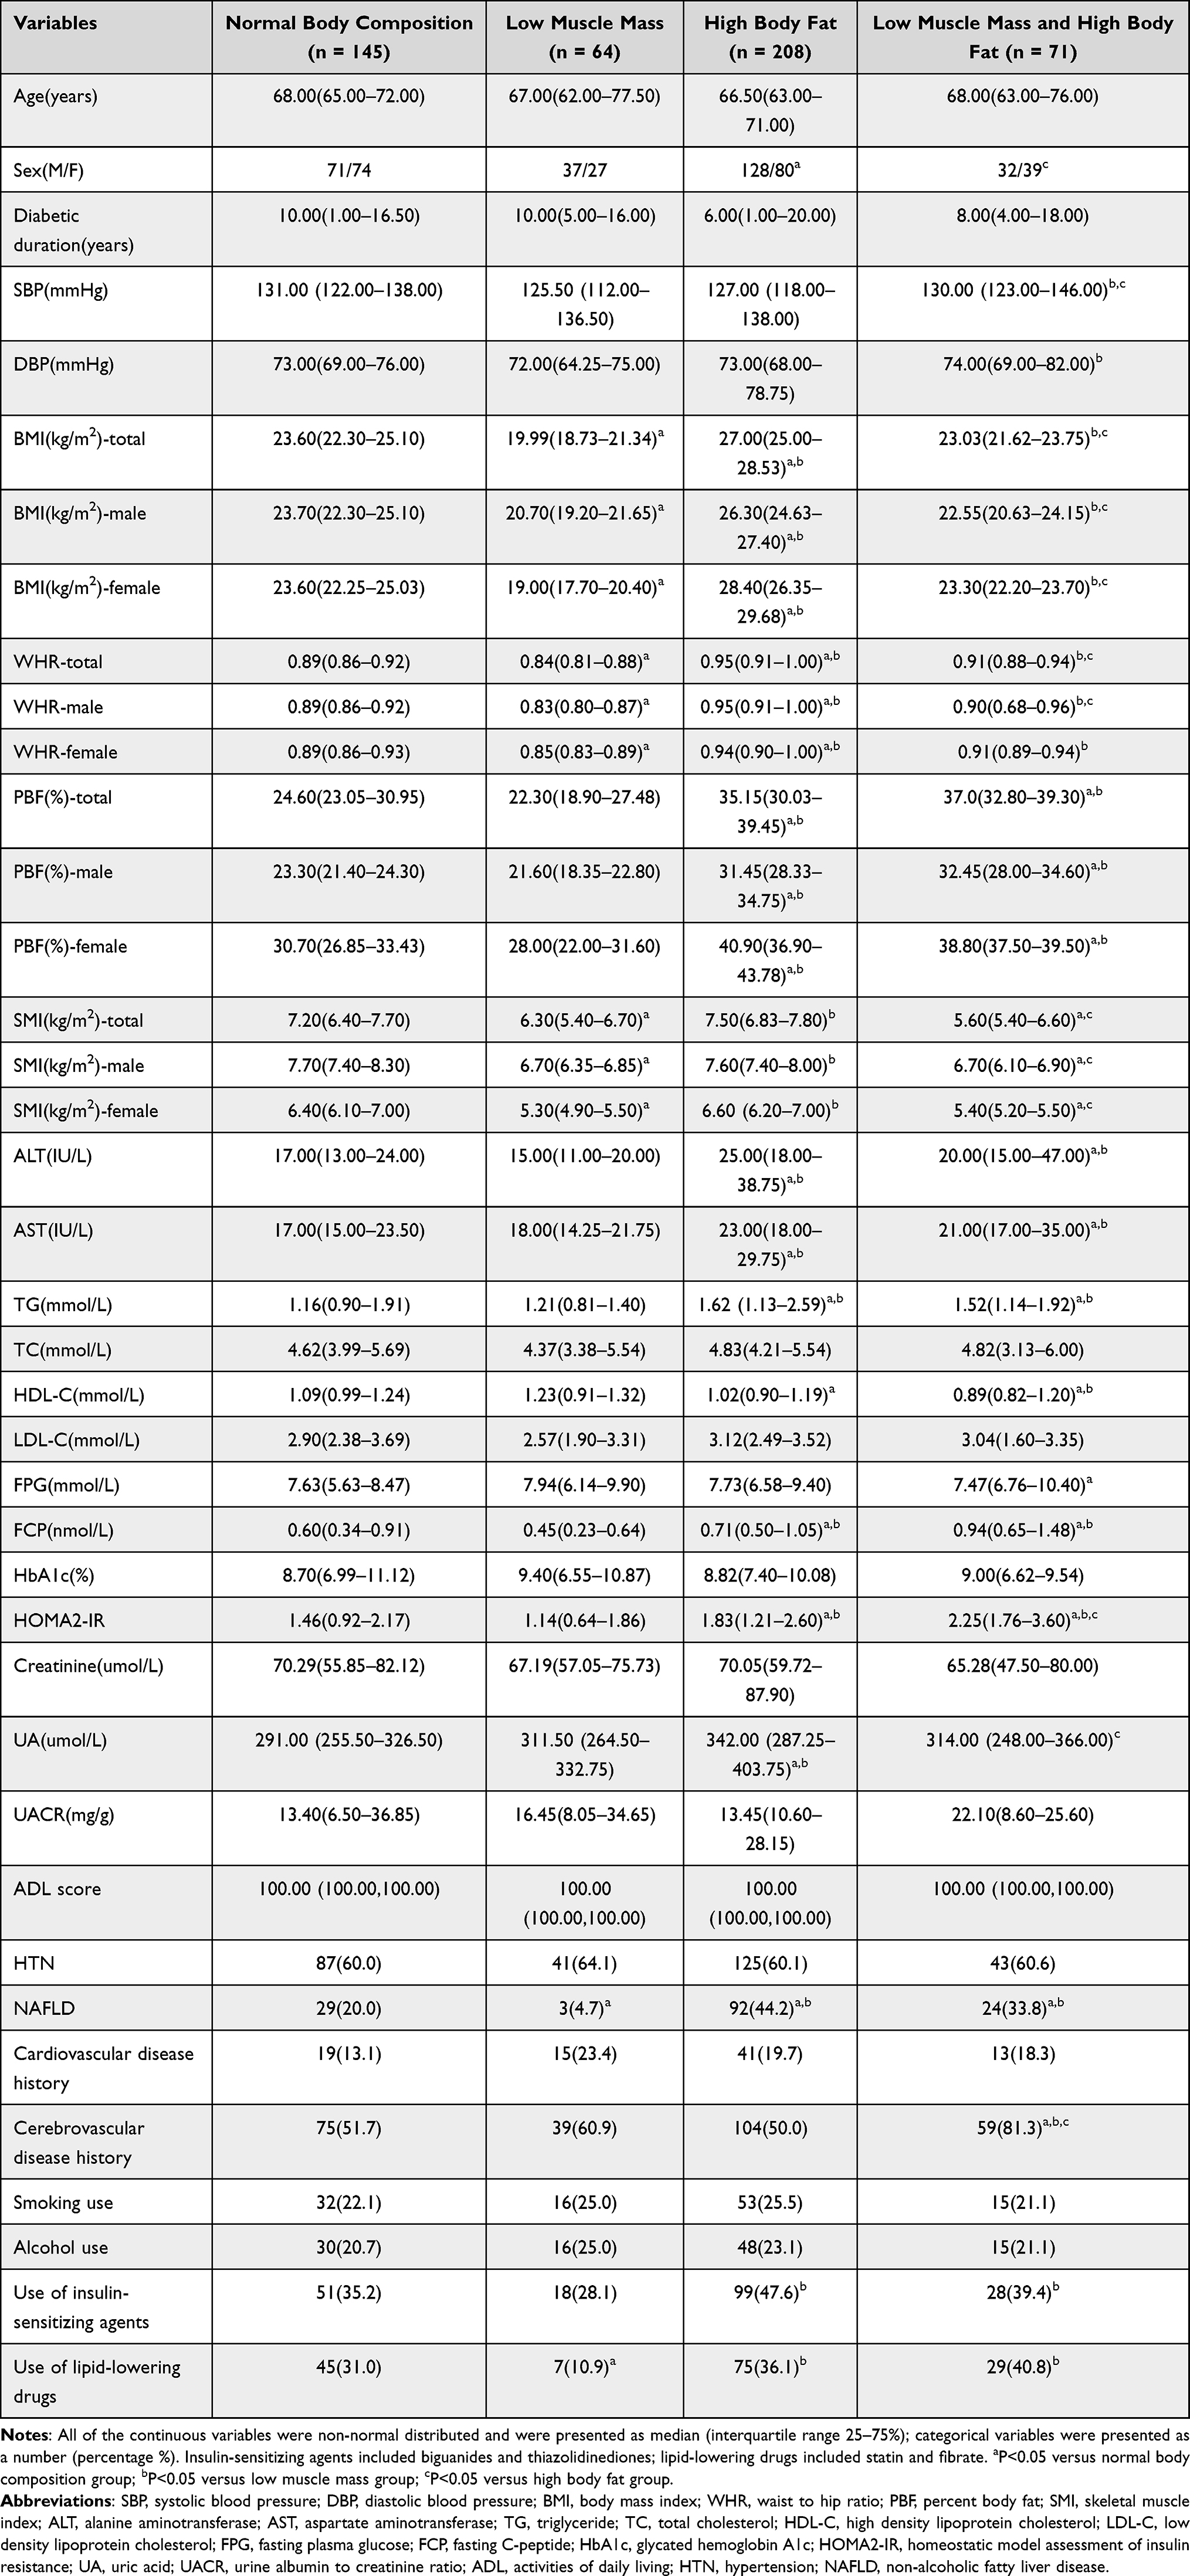 |
Table 1 Clinical Characteristics at Baseline in the Four Categories of Body Compositions Classified Using SMI and PBF |
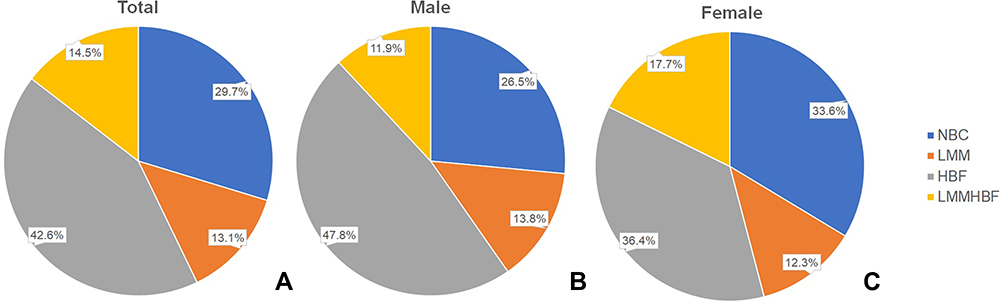 |
Figure 1 Percentages of Chinese elderly subjects with T2DM in the four categories of body compositions. Abbreviations: NBC, normal body composition; LMM, low muscle mass; HBF, high body fat; LMMHBF, low muscle mass and high body fat. Note: (A) All subjects; (B) male; (C) female. |
Body Size and Insulin Resistance in Different Categories of Body Compositions
In elderly men, women, and the whole population respectively, the HBF group showed the highest BMI in the four groups of different body compositions, and the LMMHBF group showed lower BMI than the HBF group, however there was no significant difference in BMI or WHR between the LMMHBF group and the NBC group. Insulin resistance measured by HOMA2-IR was higher in the LMMHBF group than in the HBF group (p = 0.045), and was also significantly higher in the LMMHBF or HBF groups than in the NBC or LMM groups (Table 1).
Correlation Analysis Between HOMA2-IR and Parameters of Body Size and Body Composition
Percent body fat (PBF) was positively correlated with HOMA2-IR in elderly men, women, and the whole population respectively (Spearman’s rank correlation coefficient: 0.329, 0.281, 0.336, P < 0.01). Positive correlation was found between BMI and HOMA2-IR in elderly men and the whole population respectively (Spearman’s rank correlation coefficient: 0.221, 0.172, P < 0.01), however there was no correlation between BMI and HOMA2-IR in elderly women. No correlation was found between WHR and HOMA2-IR in elderly men, women, or the whole population. SMI was positively correlated with HOMA2-IR in elderly men (Spearman’s rank correlation coefficient: 0.220, P < 0.01), however there was no correlation between SMI and HOMA2-IR in elderly women or the whole population (Table 2).
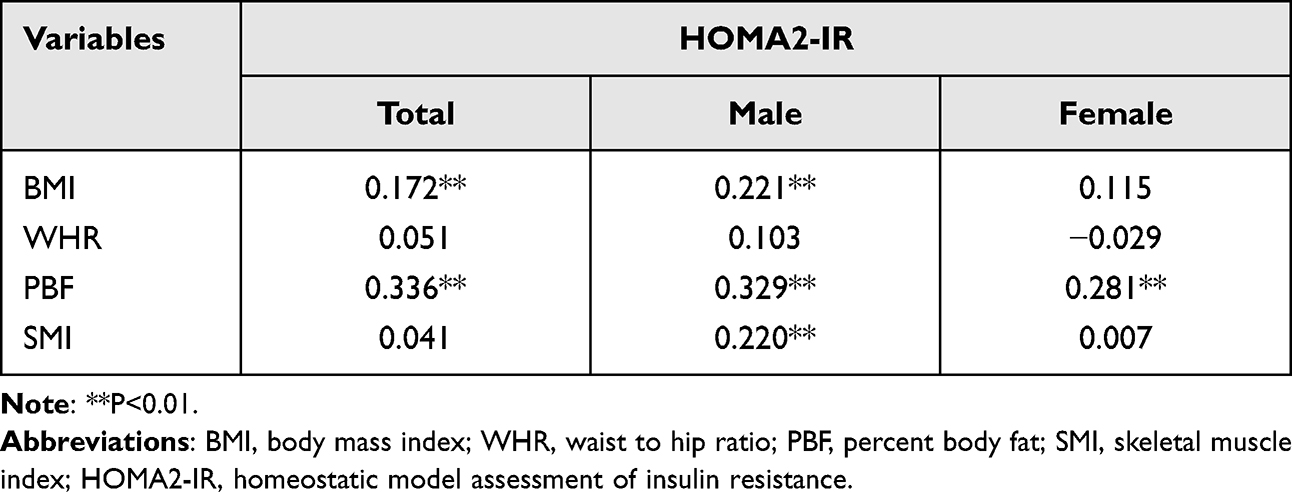 |
Table 2 Spearman Correlations Between HOMA2-IR and Parameters of Body Size and Body Composition |
Multiple Logistic Regression Analysis for Insulin Resistance
We used HOMA2-IR > 1.8 as the cut-off value of insulin resistance.22 In the multiple logistic regression model subjects with LMMHBF and HBF were significantly associated with increased risk of insulin resistance compared to those with NBC, with odds ratios (ORs) of 4.47 [95% confidence interval (CI) 2.06–9.68, p < 0.001] and 1.76 (95% CI 1.02–3.02, p = 0.041) respectively, even after the adjustment for covariates including age, sex, diabetic duration, SBP, DBP, ALT, AST, TG, HDL-C, UA, NAFLD, cerebrovascular disease history and medications use of insulin-sensitizing agents and lipid-lowering drugs (Table 3). Therefore elderly T2DM subjects with LMMHBF had the highest risk for insulin resistance.
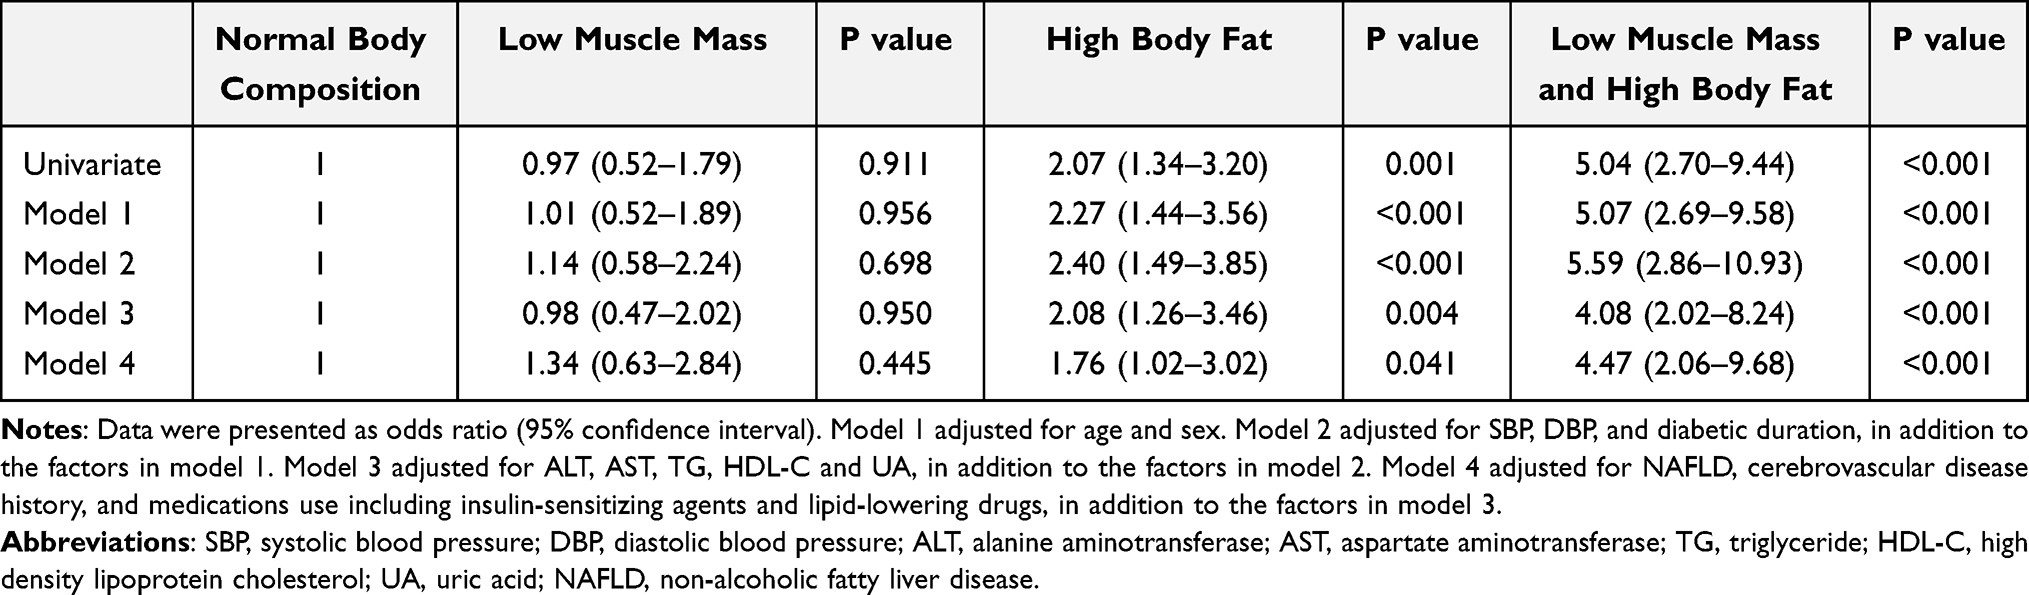 |
Table 3 Multivariable-Adjusted Odds Ratios for Insulin Resistance in the Four Categories of Body Compositions |
Discussion
In the present study, we first examined the relationship between body composition and insulin resistance in elderly T2DM patients. This study showed that Chinese elderly T2DM patients with sarcopenic obesity (as defined by the coexistence of low muscle mass and high body fat) had a more severe degree and higher risk of insulin resistance than those with obesity alone (as defined by high body fat), however the body size of the patients with sarcopenic obesity was similar to those with normal body composition. Therefore analyzing the body composition in elderly T2DM patients, even though in the patients with normal body size measured by BMI or WHR, might be important and necessary and would have a certain guiding significance for the rational antidiabetic treatment.
The Asian population tends to develop T2DM with less degree of obesity.23 Kim et al reported that T2DM patients in Asia had a three times higher risk of sarcopenia (odds ratio 3.06, 95% CI 1.42–6.62) than subjects without diabetes after adjusting for potential risk factors.24 A cross-sectional study with 1090 community-dwelling Chinese elderly citizens showed that patients with T2DM were associated with higher risks of sarcopenia, pre-sarcopenia and low muscle mass than non-diabetic individuals by using the AWGS criteria 2014.25 However Western elderly T2DM patients exhibited increases in both muscle mass and body fat because they were more obese and had higher BMI compared to non-diabetic individuals.26 Aging Asian T2DM patients were more prone to have decreased skeletal muscle mass and increased body fat mass compared with their Western counterparts.24,27 The difference of body composition between Asian and Western patients with T2DM might originate from ethnic differences in characteristics of T2DM. As is shown in the present study, the prevalence of Chinese elderly T2DM patients with sarcopenic obesity reached 14.5% (11.9% in men and 17.7% in women). Another Asian study showed the prevalence of sarcopenic obesity was 8.2% (men 7.4% vs women 9.0%) among newly diagnosed and drug-naïve T2DM patients irrespective of age in Korea.28 Because sarcopenic obesity is a high-risk geriatric syndrome predominantly observed in elderly adults,11 it could be explained that the prevalence of sarcopenic obesity was higher in our study compared to the above Korean study. In both studies the prevalence of sarcopenic obesity in women was higher than those in men. In women, menopause increases fat mass, shifts fat deposition to the center of the body, but decreases skeletal muscle mass;29,30 then oral hormonal replacement therapy (HRT), the combination of estradiol valerate with cyproterone acetate, can attenuate these changes of body composition.31 Hypogonadism regardless of etiology in men, decreases muscle mass, which is reversed by testosterone replacement; it also increases body fat including abdominal fat and appendicular fat, but the effect of replacement therapy on fat mass may be less potent than that on skeletal muscle mass in males.32 The gender-specific changes of muscle and fat composition are partly due to the changes of sex hormones.11
Some pathophysiological mechanisms may explain the development of sarcopenic obesity (SO) in elderly T2DM patients. With aging the excessive lipid production and the diminished capacity of storing lipids in the adipose tissue (AT) lead to free fatty acids (FFAs) ectopic accumulation in the skeletal muscle. The main effect of such progress is the marked impairment of muscle mitochondria, reduced lipid β-oxidation, enhanced reactive oxygen species (ROS) production, and a disturbed inflammatory signaling pathway (mainly, mTOR blockage).12,33,34 Moreover AT-skeletal muscle pro-inflammatory interconnection also exerts an important role in SO triggering and development. Obesity associated adipocyte activation leads to excessive accumulation in AT of various immune cells such as macrophages, mast cells and T lymphocytes, which secrete pro-inflammatory cytokines and adipokines and promote a low-level inflammation.11,35–37 In addition, ectopic lipid accumulation in the skeletal muscle is supposed to attract immune cells capable of producing pro-inflammatory cytokines and myokines,38 which promote local inflammation; these cytokines and myokines also support a systemic chronic low-grade inflammation by their leakage to the circulation.12 The lipotoxic effect, which targets the insulin signaling way, results in an insulin resistance state.39 All these above events finally lead to muscle catabolism and a loss of muscle.12 Besides lipotoxicity, hyperglycemia of T2DM patients increases the production of advanced glycation end products (AGEs) which accumulate in the muscle, and leads to decline in muscle function.40
Obesity is a fundamental risk factor for the development of insulin resistance.21 With the ongoing aging epidemic, more attention should be paid to sarcopenia which synergistically worsens the adverse effects of obesity. Theoretically, because skeletal muscle is an important organ of insulin-mediated glucose metabolism,13,14 sarcopenia might exacerbate obesity-associated insulin resistance. Our study suggested that elderly T2DM patients with SO, who seemed to have normal BMI, presented a more severe degree and higher risk of insulin resistance than those with obesity alone in China. Another study of Korea included 233 newly diagnosed and drug-naïve T2DM patients irrespective of age. It defined SO as coexistence of abdominal obesity (WC ≥90 cm in men and ≥85 cm in women) and low muscle mass (SMI <7.0 kg/m2 for men and <5.4 kg/m2 for women). The results showed that both of the subjects with SO and with abdominal obesity had increased HOMA-IR and BMI compared to those with normal body composition, and the subjects with SO had a higher risk of insulin resistance but similar BMI compared to those with abdominal obesity alone.28 There were also several studies conducted in the non-diabetic population. A cross-sectional analysis of the United States National Health and Nutrition Examination Survey (NHANES) III data utilizing 20 years or older subjects (N = 14,528) after exclusion of individuals with diabetes showed that SO (as defined by SMI more than 2 SD below the sex-specific young adult mean value and BMI >30 kg/m2) was strongly associated with insulin resistance than sarcopenia or obesity alone.41 A study included 493 healthy adults (180 men and 313 women) enrolled in the Korean Sarcopenic Obesity Study (KSOS), which defined sarcopenia as SMI of 1 SD below the sex-specific mean value for a young reference group and obesity as visceral fat area (VFA) ≥100 cm2. The study showed that SO appeared to be significantly and independently associated with insulin resistance in both men and women.42 Another study from the Korean NHANES conducted an evaluation of sarcopenia (as defined by ASM/weight of 1 SD below the sex-specific mean value for young adults) with obesity (as defined by BMI ≥25 kg/m2). The authors reported that among 2943 subjects (1250 men and 1693 women) aged 60 years or older, the SO group was more closely associated with insulin resistance defined by HOMA-IR than any other group.43 A cross-sectional study which included 288 Saudi adult male individuals also showed that obesity (as defined by >25% body fat percentage) associated with sarcopenia (as defined by appendicular lean mass/hight2 of 1 SD below the average value for specific young population) exhibited significantly greater insulin resistance than sarcopenia or obesity per se.44
The AACE/ACE Obesity Clinical Practice Guidelines (CPG) recommended that BMI should be used to confirm an excessive degree of adiposity and to classify individuals as being overweight or obese.21 BMI cutoff point values of ≥24 kg/m2 and ≥28 kg/m2 should be used in the confirmation of overweight and obesity respectively in China.45 Because BMI has limited interindividual consistency for estimating body fat percentage and distribution, particularly in the subjects with a low BMI but high clinical adiposity and those with high BMI but low clinical adiposity, the AACE/ACE Obesity CPG also proposed WHO body fat percentage cut points for obesity. Moreover body fat has better predictive validity on the development of the metabolic syndrome and cardiovascular disease risk than BMI.46,47 With aging T2DM patients are prone to have decreased skeletal muscle mass and increased body fat mass. Our study showed that in Chinese elderly T2DM patients, the body size (measured by BMI or WHR) of the subjects with SO was similar to those with normal body composition. Therefore BMI may not be a proper diagnostic tool to confirm overweight or obesity for elderly T2DM patients. To better determine the risk of insulin resistance and guide the rational antidiabetic treatment for elderly T2DM patients, the clinician should consider skeletal muscle besides adipose, and a simple and non-invasive body composition analysis should be taken following the use of BMI for screening obesity or overweight.
There were some limitations in the present study. Firstly, we utilized only the muscle mass for the definition of sarcopenia without muscle strength or physical performance, thus in this study we used the term “low muscle mass” instead of “sarcopenia” for the accurate definition. Secondly, we did not have access to a gold standard approach of insulin sensitivity measurement such as the glucose clamp technique. Thirdly, most of the patients were from Shanghai city, which could not symbolize the general population in China. Fourthly, this study lacked specific analysis for diet and exercise of the patients. Finally, due to the inherent limitations of a cross-sectional study, it was impossible to draw causal inferences from the relationship between body composition and insulin resistance in Chinese elderly patients with T2DM, and a prospective study such as a randomized clinical trial should be conducted in the future.
In conclusion, though Chinese elderly T2DM patients with the body composition of sarcopenic obesity seemed to have normal BMI, they presented the most severe degree and the highest risk of insulin resistance.
Ethics Approval and Consent to Participate
The study protocol was approved by the Ethical Committee of Ren Ji Hospital, Shanghai Jiao Tong University School of Medicine (Approval No. KY2021-071-B). This study was performed in accordance with the Declaration of Helsinki. All subjects were assigned numerical codes to protect their identity and the anonymized records were stored in a secure database. Informed consent was not required due to the study being a retrospective analysis of anonymized data.
Acknowledgments
We are particularly grateful to all the people who have given us help on our article.
Funding
This work was supported by the National Natural Science Foundation of China (No. 81870554) and the Foundation from Renji Hospital, Shanghai Jiao Tong University School of Medicine (2019G2RPYQN02, 2019NYLYCP0102).
Disclosure
The authors declare that they have no competing interests in this work.
References
1. Cruz-Jentoft AJ, Bahat G, Bauer J, et al. Sarcopenia: revised European consensus on definition and diagnosis. Age Ageing. 2019;48(1):16–31. doi:10.1093/ageing/afy169
2. Flegal KM, Shepherd JA, Looker AC, et al. Comparisons of percentage body fat, body mass index, waist circumference, and waist-stature ratio in adults. Am J Clin Nutr. 2009;89(2):500–508. doi:10.3945/ajcn.2008.26847
3. Heo M, Faith MS, Pietrobelli A, Heymsfield SB. Percentage of body fat cutoffs by sex, age, and race-ethnicity in the US adult population from NHANES 1999–2004. Am J Clin Nutr. 2012;95(3):594–602. doi:10.3945/ajcn.111.025171
4. Roubenoff R. Sarcopenic obesity: the confluence of two epidemics. Obes Res. 2004;12(6):887–888. doi:10.1038/oby.2004.107
5. Baumgartner RN. Body composition in healthy aging. Ann N Y Acad Sci. 2000;904:437–448. doi:10.1111/j.1749-6632.2000.tb06498.x
6. Tremblay A, Royer MM, Chaput JP, Doucet E. Adaptive thermogenesis can make a difference in the ability of obese individuals to lose body weight. Int J Obes. 2013;37(6):759–764. doi:10.1038/ijo.2012.124
7. Rosenbaum M, Hirsch J, Gallagher DA, Leibel RL. Long-term persistence of adaptive thermogenesis in subjects who have maintained a reduced body weight. Am J Clin Nutr. 2008;88(4):906–912. doi:10.1093/ajcn/88.4.906
8. Gallagher D, Heymsfield SB, Heo M, Jebb SA, Murgatroyd PR, Sakamoto Y. Healthy percentage body fat ranges: an approach for developing guidelines based on body mass index. Am J Clin Nutr. 2000;72(3):694–701. doi:10.1093/ajcn/72.3.694
9. Goodpaster BH, Park SW, Harris TB, et al. The loss of skeletal muscle strength, mass, and quality in older adults: the health, aging and body composition study. J Gerontol a Biol Sci Med Sci. 2006;61(10):1059–1064. doi:10.1093/gerona/61.10.1059
10. Visser M, Goodpaster BH, Kritchevsky SB, et al. Muscle mass, muscle strength, and muscle fat infiltration as predictors of incident mobility limitations in well-functioning older persons. J Gerontol a Biol Sci Med Sci. 2005;60(3):324–333. doi:10.1093/gerona/60.3.324
11. Batsis JA, Villareal DT. Sarcopenic obesity in older adults: aetiology, epidemiology and treatment strategies. Nat Rev Endocrinol. 2018;14(9):513–537. doi:10.1038/s41574-018-0062-9
12. Kalinkovich A, Livshits G. Sarcopenic obesity or obese sarcopenia: a cross talk between age-associated adipose tissue and skeletal muscle inflammation as a main mechanism of the pathogenesis. Ageing Res Rev. 2017;35:200–221. doi:10.1016/j.arr.2016.09.008
13. DeFronzo RA, Jacot E, Jequier E, Maeder E, Wahren J, Felber JP. The effect of insulin on the disposal of intravenous glucose. Results from indirect calorimetry and hepatic and femoral venous catheterization. Diabetes. 1981;30(12):1000–1007. doi:10.2337/diab.30.12.1000
14. DeFronzo RA, Gunnarsson R, Björkman O, Olsson M, Wahren J. Effects of insulin on peripheral and splanchnic glucose metabolism in noninsulin-dependent (type II) diabetes mellitus. J Clin Invest. 1985;76(1):149–155. doi:10.1172/JCI111938
15. DeFronzo RA, Bonadonna RC, Ferrannini E. Pathogenesis of NIDDM. A balanced overview. Diabetes Care. 1992;15(3):318–368. doi:10.2337/diacare.15.3.318
16. Draznin B, Aroda VR, Bakris G, et al. 2. Classification and diagnosis of diabetes: standards of medical care in diabetes-2022. Diabetes Care. 2022;45(Suppl 1):S17–s38.
17. World Health Organization. Physical status: the use and interpretation of anthropometry. Report of a WHO expert committee. World Health Organ Tech Rep Ser. 1995;854:1–452.
18. Levy JC, Matthews DR, Hermans MP. Correct homeostasis model assessment (HOMA) evaluation uses the computer program. Diabetes Care. 1998;21(12):2191–2192. doi:10.2337/diacare.21.12.2191
19. Baumgartner RN, Koehler KM, Gallagher D, et al. Epidemiology of sarcopenia among the elderly in New Mexico. Am J Epidemiol. 1998;147(8):755–763. doi:10.1093/oxfordjournals.aje.a009520
20. Chen LK, Woo J, Assantachai P, et al. Asian working group for Sarcopenia: 2019 consensus update on sarcopenia diagnosis and treatment. J Am Med Dir Assoc. 2020;21(3):300–307.e302. doi:10.1016/j.jamda.2019.12.012
21. Garvey WT, Mechanick JI, Brett EM, et al. American Association of Clinical Endocrinologists and American College of Endocrinology comprehensive clinical practice guidelines for medical care of patients with obesity. Endocr Pract. 2016;22(Suppl 3):1–203. doi:10.4158/EP161365.GL
22. Geloneze B, Vasques AC, Stabe CF, et al. HOMA1-IR and HOMA2-IR indexes in identifying insulin resistance and metabolic syndrome: Brazilian Metabolic Syndrome Study (BRAMS). Arq Bras Endocrinol Metabol. 2009;53(2):281–287. doi:10.1590/S0004-27302009000200020
23. Yoon KH, Lee JH, Kim JW, et al. Epidemic obesity and type 2 diabetes in Asia. Lancet. 2006;368(9548):1681–1688. doi:10.1016/S0140-6736(06)69703-1
24. Kim TN, Park MS, Yang SJ, et al. Prevalence and determinant factors of sarcopenia in patients with type 2 diabetes: the Korean Sarcopenic Obesity Study (KSOS). Diabetes Care. 2010;33(7):1497–1499. doi:10.2337/dc09-2310
25. Wang T, Feng X, Zhou J, et al. Type 2 diabetes mellitus is associated with increased risks of sarcopenia and pre-sarcopenia in Chinese elderly. Sci Rep. 2016;6:38937. doi:10.1038/srep38937
26. Park SW, Goodpaster BH, Strotmeyer ES, et al. Decreased muscle strength and quality in older adults with type 2 diabetes: the health, aging, and body composition study. Diabetes. 2006;55(6):1813–1818. doi:10.2337/db05-1183
27. Chan JC, Malik V, Jia W, et al. Diabetes in Asia: epidemiology, risk factors, and pathophysiology. JAMA. 2009;301(20):2129–2140. doi:10.1001/jama.2009.726
28. Kim JA, Hwang SY, Chung HS, et al. Proportion and characteristics of the subjects with low muscle mass and abdominal obesity among the newly diagnosed and drug-naïve type 2 diabetes mellitus patients. Diabetes Metab J. 2019;43(1):105–113. doi:10.4093/dmj.2018.0036
29. Trémollieres FA, Pouilles JM, Ribot CA. Relative influence of age and menopause on total and regional body composition changes in postmenopausal women. Am J Obstet Gynecol. 1996;175(6):1594–1600. doi:10.1016/S0002-9378(96)70111-4
30. Sowers M, Zheng H, Tomey K, et al. Changes in body composition in women over six years at midlife: ovarian and chronological aging. J Clin Endocrinol Metab. 2007;92(3):895–901. doi:10.1210/jc.2006-1393
31. Gambacciani M, Ciaponi M, Cappagli B, De Simone L, Orlandi R, Genazzani AR. Prospective evaluation of body weight and body fat distribution in early postmenopausal women with and without hormonal replacement therapy. Maturitas. 2001;39(2):125–132. doi:10.1016/S0378-5122(01)00194-3
32. Miller KK. Androgen deficiency: effects on body composition. Pituitary. 2009;12(2):116–124. doi:10.1007/s11102-008-0121-7
33. Sakuma K, Aoi W, Yamaguchi A. Current understanding of sarcopenia: possible candidates modulating muscle mass. Pflugers Archiv. 2015;467(2):213–229. doi:10.1007/s00424-014-1527-x
34. Kob R, Bollheimer LC, Bertsch T, et al. Sarcopenic obesity: molecular clues to a better understanding of its pathogenesis? Biogerontology. 2015;16(1):15–29. doi:10.1007/s10522-014-9539-7
35. Apostolopoulos V, de Courten MP, Stojanovska L, Blatch GL, Tangalakis K, de Courten B. The complex immunological and inflammatory network of adipose tissue in obesity. Mol Nutr Food Res. 2016;60(1):43–57. doi:10.1002/mnfr.201500272
36. Exley MA, Hand L, O’Shea D, Lynch L. Interplay between the immune system and adipose tissue in obesity. J Endocrinol. 2014;223(2):R41–48. doi:10.1530/JOE-13-0516
37. Tateya S, Kim F, Tamori Y. Recent advances in obesity-induced inflammation and insulin resistance. Front Endocrinol. 2013;4:93. doi:10.3389/fendo.2013.00093
38. Rivas DA, McDonald DJ, Rice NP, Haran PH, Dolnikowski GG, Fielding RA. Diminished anabolic signaling response to insulin induced by intramuscular lipid accumulation is associated with inflammation in aging but not obesity. Am J Physiol Regul Integr Comp Physiol. 2016;310(7):R561–569. doi:10.1152/ajpregu.00198.2015
39. Muoio DM. Revisiting the connection between intramyocellular lipids and insulin resistance: a long and winding road. Diabetologia. 2012;55(10):2551–2554. doi:10.1007/s00125-012-2597-y
40. Semba RD, Bandinelli S, Sun K, Guralnik JM, Ferrucci L. Relationship of an advanced glycation end product, plasma carboxymethyl-lysine, with slow walking speed in older adults: the InCHIANTI study. Eur J Appl Physiol. 2010;108(1):191–195. doi:10.1007/s00421-009-1192-5
41. Srikanthan P, Hevener AL, Karlamangla AS. Sarcopenia exacerbates obesity-associated insulin resistance and dysglycemia: findings from the National Health and Nutrition Examination Survey III. PLoS One. 2010;5(5):e10805. doi:10.1371/journal.pone.0010805
42. Kim TN, Park MS, Lim KI, et al. Relationships between sarcopenic obesity and insulin resistance, inflammation, and vitamin D status: the Korean Sarcopenic Obesity Study. Clin Endocrinol (Oxf). 2013;78(4):525–532. doi:10.1111/j.1365-2265.2012.04433.x
43. Chung JY, Kang HT, Lee DC, Lee HR, Lee YJ. Body composition and its association with cardiometabolic risk factors in the elderly: a focus on sarcopenic obesity. Arch Gerontol Geriatr. 2013;56(1):270–278. doi:10.1016/j.archger.2012.09.007
44. Habib SS, Alkahtani S, Alhussain M, Aljuhani O. Sarcopenia coexisting with high adiposity exacerbates insulin resistance and dyslipidemia in Saudi adult men. Diabetes Metabol Syndr Obes. 2020;13:3089–3097. doi:10.2147/DMSO.S260382
45. National Health and Family Planning Commission of People’s Republic of China. Criteria of Weight for Adults. Vol. 2. Beijing, China: Standards Press of China; 2013.
46. Jain SH, Massaro JM, Hoffmann U, et al. Cross-sectional associations between abdominal and thoracic adipose tissue compartments and adiponectin and resistin in the Framingham Heart Study. Diabetes Care. 2009;32(5):903–908. doi:10.2337/dc08-1733
47. Després JP. Body fat distribution and risk of cardiovascular disease: an update. Circulation. 2012;126(10):1301–1313. doi:10.1161/CIRCULATIONAHA.111.067264
 © 2022 The Author(s). This work is published and licensed by Dove Medical Press Limited. The
full terms of this license are available at https://www.dovepress.com/terms
and incorporate the Creative Commons Attribution
- Non Commercial (unported, 3.0) License.
By accessing the work you hereby accept the Terms. Non-commercial uses of the work are permitted
without any further permission from Dove Medical Press Limited, provided the work is properly
attributed. For permission for commercial use of this work, please see paragraphs 4.2 and 5 of our Terms.
© 2022 The Author(s). This work is published and licensed by Dove Medical Press Limited. The
full terms of this license are available at https://www.dovepress.com/terms
and incorporate the Creative Commons Attribution
- Non Commercial (unported, 3.0) License.
By accessing the work you hereby accept the Terms. Non-commercial uses of the work are permitted
without any further permission from Dove Medical Press Limited, provided the work is properly
attributed. For permission for commercial use of this work, please see paragraphs 4.2 and 5 of our Terms.