Back to Journals » Clinical Interventions in Aging » Volume 17
Sarcopenia Index Based on Serum Creatinine and Cystatin C is Associated with Mortality, Nutritional Risk/Malnutrition and Sarcopenia in Older Patients
Authors Ren C, Su H, Tao J, Xie Y, Zhang X ![]() , Guo Q
, Guo Q ![]()
Received 29 November 2021
Accepted for publication 21 February 2022
Published 1 March 2022 Volume 2022:17 Pages 211—221
DOI https://doi.org/10.2147/CIA.S351068
Checked for plagiarism Yes
Review by Single anonymous peer review
Peer reviewer comments 2
Editor who approved publication: Dr Zhi-Ying Wu
Chenxi Ren,1,2,* Hang Su,1,* Jun Tao,1 Ying Xie,2 Xiaoyan Zhang,1 Qihao Guo1
1Department of gerontology, Shanghai Jiaotong University Affiliated Sixth People’s Hospital, Shanghai, 200233, People’s Republic of China; 2Department of Endocrinology, the Second Affiliated Hospital of Soochow University, Suzhou, 215004, People’s Republic of China
*These authors contributed equally to this work
Correspondence: Qihao Guo, Department of Gerontology, Shanghai Jiaotong University Affiliated Sixth People’s Hospital, No. 600, Yi Shan Road, Shanghai, 200233, People’s Republic of China, Email [email protected]
Purpose: To investigate the association of sarcopenia index (SI) [(serum creatinine/serum cystatin C) × 100] with mortality, nutritional risk/malnutrition and sarcopenia among hospitalized older adults.
Subjects and Methods: A prospective analysis was performed in 758 hospitalized older adults. Anthropometric measures and biochemical parameters were carried out for each patient. Sarcopenia was defined according to the Asian Working Group for Sarcopenia (AWGS) 2019 algorithm. Nutritional risk/malnutrition was defined according to the European Society of Clinical Nutrition and Metabolism (ESPEN) criteria. The logistic regression analysis was employed for the analysis of correlation between the SI and other variables. Cox regression analysis was employed to analyze correlation between the SI and mortality.
Results: A total of 758 participants agreed to participate in this study (589 men and 169 women; mean age: 85.6± 6.1 years). The median of the follow-up period was 212 days. A total of 112 patients died. A high SI (per 1-SD was 22.1) was independently associated with all-cause mortality (HR per 1-SD = 0.61, 95% CI: 0.47– 0.79), nutritional risk/malnutrition (OR per 1-SD = 0.38, 95% CI: 0.29– 0.49) and sarcopenia (OR per 1-SD = 0.58, 95% CI: 0.45– 0.74). High SI was positively correlated with albumin (r = 0.32, P < 0.001), hemoglobin (r = 0.24, P < 0.001), body mass index (BMI) (r = 0.12, P = 0.001), waist circumference (WC) (r = 0.08, P = 0.046), calf circumference (CC) (r = 0.45, P < 0.001), hand grip strength (HGS) (r = 0.52, P < 0.001) and negatively correlated with triglyceride glucose (TyG) (r = − 0.11, P = 0.007).
Conclusion: The SI based on serum cystatin C and creatinine is associated with long-term mortality, nutritional risk/malnutrition and sarcopenia in hospitalized older Chinese patients.
Keywords: cystatin C, creatinine, nutritional risk, malnutrition, sarcopenia, mortality
Introduction
The aging of the population poses considerable social challenges, as declining health conditions and diseases can lead to disability, dependence and mortality1. Although these conditions are partly reversible such as malnutrition and sarcopenia,2 they are associated with a worsening of the underlying disease and increased the risk of mortality.3,4 A study reported that malnutrition was associated with 4.4-fold higher mortality risk at 12-year follow-up.3 A systematic review and meta-analysis showed a consistent association between sarcopenia and mortality, with a pooled odds ratio of 3.59 and a larger effect in men and women aged 79 years and older.5 Therefore, it is important that nutritional risk/malnutrition and sarcopenia are detected early in the elderly.
Due to a series of biological and environmental factors, such as multiple incidence rate, changes in sensation and body composition, loss of appetite, oral health decline, malabsorption, multiple drugs, financial difficulties and social isolation, the risk of malnutrition and micronutrient deficiency increases among older adults.6 Malnutrition in elderly inpatients is associated with decreased muscle quality, impaired function, decreased quality of life, increased use of medical resources, prolonged hospital stay and increased mortality.2,7,8 Nutrition assessment has been included in the comprehensive geriatric assessment (CGA), which is the core and important part of the comprehensive management of the elderly.9 The nutritional risk screening 2002 (NRS 2002) scale is a popular nutritional risk screening tool among hospitalized patients. It was first introduced by Kondrup et al and validated by the European Society for Clinical Nutrition and Metabolism.10 However, subjects have no choice but to spend a lot of time answering questionnaires.
Sarcopenia is characterized by progressive and systemic loss of skeletal muscle mass (SMM) and strength, which may lead to physical disability, poor quality of life and other adverse consequences.11 Sarcopenia is now recognized as a muscle disease by World Health Organization. The 10th Revision of the international classification of diseases (ICD-10-CM) diagnostic code is M62.84.12 Up-to-date, most international consensus holds that the diagnosis of Sarcopenia should include low muscle mass and decreased muscle function. Low muscle mass is usually measured by magnetic resonance imaging (MRI), computed tomography (CT), dual energy X-ray absorptiometry (DXA) or bioelectrical impedance analysis (BIA).13 However, these methods are time-consuming, inconvenient, reliable, and some of them are expensive and may cause radiation exposure. Muscle dysfunction is usually estimated by grip strength and gait speed, which also requires specific equipment or experienced trainers.
Nutritional risk and sarcopenia cause serious adverse consequences including death. It is necessary to detect and intervene early. Low serum creatinine has been not only used as a substitute for low muscle mass but also associated with adverse outcomes.14,15 Cystatin C is a small protein derived from all nucleated cells. Its production is relatively stable and less affected by SMM.16 Therefore, Kashani et al, recently developed a new sarcopenia index (SI, serum creatinine [mg/dl]/cystatin C [mg/l]) × 100) was used to estimate SMM.17 A research showed that SI was a fair measure of muscle mass and can moderately predict in-hospital mortality in intensive care unit (ICU) patients with a stable renal function (excluding evolving or recovering acute kidney injury and need for renal replacement therapy).18 Unlike other complex tools, SI was only based on serum creatinine and cystatin C, which are objective and routine tests in the elderly. If SI could accurately estimate sarcopenia in the elderly, it would be of great value to simplify the diagnosis procedure of sarcopenia.19 Because of the convenience of detection, SI is a hot spot in various research fields. In the cardiovascular field, SI, surrogate for the degree of SMM, could be used as a predictor of adverse outcomes in patients undergoing transcatheter aortic valve replacement.20 SI also could predict chemotherapy-induced undesirable effects and mortality in older People with stage III or IV non-small cell lung cancer.21
In our study, we analyzed the data of a prospective study to investigate the association of SI with mortality, nutritional risk/malnutrition and sarcopenia among hospitalized older Chinese adults.
Methods
Study Population
We analyzed the data of a prospective study that a total of 1234 hospitalized patients admitted to the Department of Geriatrics at Shanghai Jiaotong University Affiliated Sixth People’s Hospital between July 2017 and April 2018. We excluded patients with cachexia (referent to the clinical history), hemodialysis, peritoneal dialysis, acute renal insufficiency or severe diseases (including acute myocardial infarction, acute heart failure, acute stroke, severe infection) that made them fail to communicate with the interviewers. We also exclude patients with no record of serum creatinine and cystatin C measured upon admission. Finally, 758 hospitalized participants were included in the analysis (Supplemental Figure 1). The study was approved by the Ethics Committee of the Shanghai Jiaotong University Affiliated Sixth People’s Hospital [approval number, 2016–141-(1)]. Written informed consent was obtained from all participants and in accordance with the principle of the Helsinki Declaration. Written informed consent was obtained from each participant.
Data Collection
Detailed information about medical history and lifestyle, including smoking and drinking status, was obtained using questionnaires and confirmed through examination of medical records by trained physicians. Current smoking status was defined as yes if the subject smoked at least one cigarette per day or seven cigarettes per week in the past 6 months. Current drinking status was defined as yes if the subject consumed alcohol at least once a week in the past 6 months. Blood pressure (BP) was measured at the non-dominant arm in a seated position after a 5-min rest using an automated electronic device (OMRON Model HEM-752 FUZZY’ Omron Co., Dalian, China). Three measurements were taken one minute apart, and the average of the three measurements was used in the analysis. The diagnostic criteria of overweight and central obesity, type 2 diabetes (T2D) and hypertension were defined according to the Adult Treatment Panel III guidelines.20 Overweight was defined as body mass index (BMI)≥25kg/m2. Coronary heart disease was identified if patients had a myocardial ischaemic history or electrocardiographic typical ischaemia pattern. Cerebral infarction was confirmed as a history of ischaemia attack confirmed by cerebral CT or MRI scan. Estimated glomerular filtration (eGFR) was calculated using MDRD equation: 186 × (Creatinine/88.4)−1.154 × (Age)−0.203 × (0.742 if female).22 Where unit of eGFR = mL/min/ 1.73 m2, serum creatinine = μmol/L and age = years. Renal dysfunction (RD) and non-RD were defined as eGFR <90 mL/min/1.73 m2 and eGFR ≥90 mL/min/ 1.73 m2, respectively.
Anthropometric Measurement
Body height, weight, and waist circumference (WC) were measured by experienced physicians. Height and weight were recorded to the nearest 0.1 cm and 0.1 kg, respectively, while participants were wearing light indoor clothing without shoes. BMI (kg/m2) was calculated as weight in kilograms divided by height in square metres. WC was measured to the nearest 0.1 cm with participants in the standing position. The greatest circumference of the lower right leg was measured in the standing position as calf circumference (CC).
Handgrip Strength (HGS)
The patient took the seat, bends the knee and bends the hip 90°, and the 2 ft are naturally placed on the ground; the shoulders remain adducted, the upper arm is flat with the chest, the forearm is neutral, and the elbow is bent to 90°. The handle of the dynamometer was adjusted if required - the base should rest on the first metacarpal (heel of palm), while the handle should rest on the middle of the four fingers. The maximum grip strength of the dominant hand (WCS-100 electronic vibrometer, China) was measured three times, and each time after the measurement, the rest was taken for 1 min. The result was taken as the maximum value of three times.
Nutritional Risk Assessment
NRS 2002 was used to determine nutritional risk. The total NRS 2002 score indicates whether the patient is nutritional risk/malnutrition (score ≥ 3) or normal (score < 3).23 A multidisciplinary nutrition support team evaluated the nutritional status of each patient. All patients underwent nutritional status assessment in the first 24 h of hospital stay.
Sarcopenia Assessment
The Asian Working Group for Sarcopenia (AWGS) 2019 algorithm24 revised the consensus definition of sarcopenia recently: Criterion 1: Low muscle strength; Criterion 2: Low muscle quantity or quality; Criterion 3: Low physical performance. Probable sarcopenia is identified by Criterion 1. The diagnosis is confirmed by additional documentation of Criterion 2. If Criteria 1, 2, and 3 are all met, sarcopenia is considered severe. In this study, the participants did not accept physical performance tests. We only used low muscle strength and low muscle quantity as confirmed sarcopenia. According to AWGS 2019 algorithm recommended cutoffs, HGS < 28 kg in men or < 18 kg in women were considered as low muscle strength. CC lower than 34 cm in men or 33 cm in women were considered as low muscle quantity.
Laboratory Measurements
All patients fasted overnight before blood samples were collected. The measurements of creatinine, cystatin C, fasting plasma glucose (FPG), triglycerides (TG), total cholesterol (TC), low-density lipoprotein cholesterol (LDL-c), and high-density lipoprotein cholesterol (HDL-c) were serum albumin were assessed using turbidimetric immunoassay (Hitachi, Tokyo, Japan). Creatinine were measured by an enzymatic method with an automatic biochemical analyzer (7600–020, Hitachi, Tokyo, Japan). The normal reference value is Haemoglobin levels were measured using a standard cyanmethemoglobin method. Haemoglobin A1c (HbA1c) was measured by high-performance liquid chromatography using Bio-Rad D-10 (Bio-Rad, Inc. USA). TyG index was calculated as ln (fasting TGs [mg/dL] × fasting glucose [mg/dL]/2). SI was calculated as serum creatinine/serum cystatin C × 100.
Follow-Up for Mortality
All the participants accepted follow-up in the geriatric clinic of Shanghai Jiaotong University Affiliated Sixth People’s Hospital. The deadline for the follow-up was July 30, 2018. The median of the follow-up period was 212 days. All deaths occurring between study entry and deadline were included. Due to the participants accepting healthcare at Shanghai Jiaotong University Affiliated Sixth People’s Hospital, there were no missing follow-ups.
Statistical Analysis
SAS version 9.1 (SAS Institute, Cary, NC) was used for database management and statistical analysis. Data are presented as the means ± standard deviation (SD) for continuous variables or numbers (percentages) for categorical variables. For continuous variables, a one-way ANOVA was used to detect differences across groups, and Fisher’s Least Significant Difference (LSD) post hoc analysis was used to determine the difference between every two groups. For categorical variables, the chi-squared test was used to detect the difference across groups. When a significant difference was identified across groups, column proportions tests (z-tests) with Bonferroni correction were performed to determine the difference between every two groups. The association between SI and other variables was evaluated with Pearson or Spearman correlation analysis. The differences between the four groups were evaluated with the ANOVA test. Categorical variables were presented as frequency percentage, and intergroup comparisons were analyzed using the chi-square test. Univariate and multivariate Cox proportional-hazard models were applied to calculate the unadjusted and adjusted hazard ratio (HR) and 95% confidence interval (CI) of the SI for mortality. The univariate and multiple stepwise Logistic regression analysis were adopted to identify the influencing factors nutritional risk/malnutrition and sarcopenia. The SI was treated as either a continuous variable (per 1-SD= 22.1) or a categorical variable (using the quartile cut-off points: Q1<56.6, Q2 56.6–72.3, Q3 72.3–85.8, Q4>85.8). Age, sex, and other confounders which were significantly different between the quartile groups of SI were adjusted for in the Cox proportional-hazard models and multiple stepwise Logistic models.
Results
Characteristics of the Study Population
A total of 758 participants agreed to participate in this study (589 men and 169 women; mean age: 85.6±6.1 years). The median of the follow-up period was 212 days and 112 patients died. The baseline characteristics of participants according to the quartiles of SI were shown in Table 1. The proportion of male was higher in the Q4 group than in the other three groups. The mean age of the participants in the Q4 group was significantly lower than the other three groups. The eGFR and prevalence of T2D, CHD and COPD were significantly higher in the Q1 group than in the other three groups, whereas the albumin, haemoglobin, BMI, WC, CC, HGS and the prevalence of RD were the lowest in the Q1 group. SBP was higher in the Q3 group than in the other three groups.
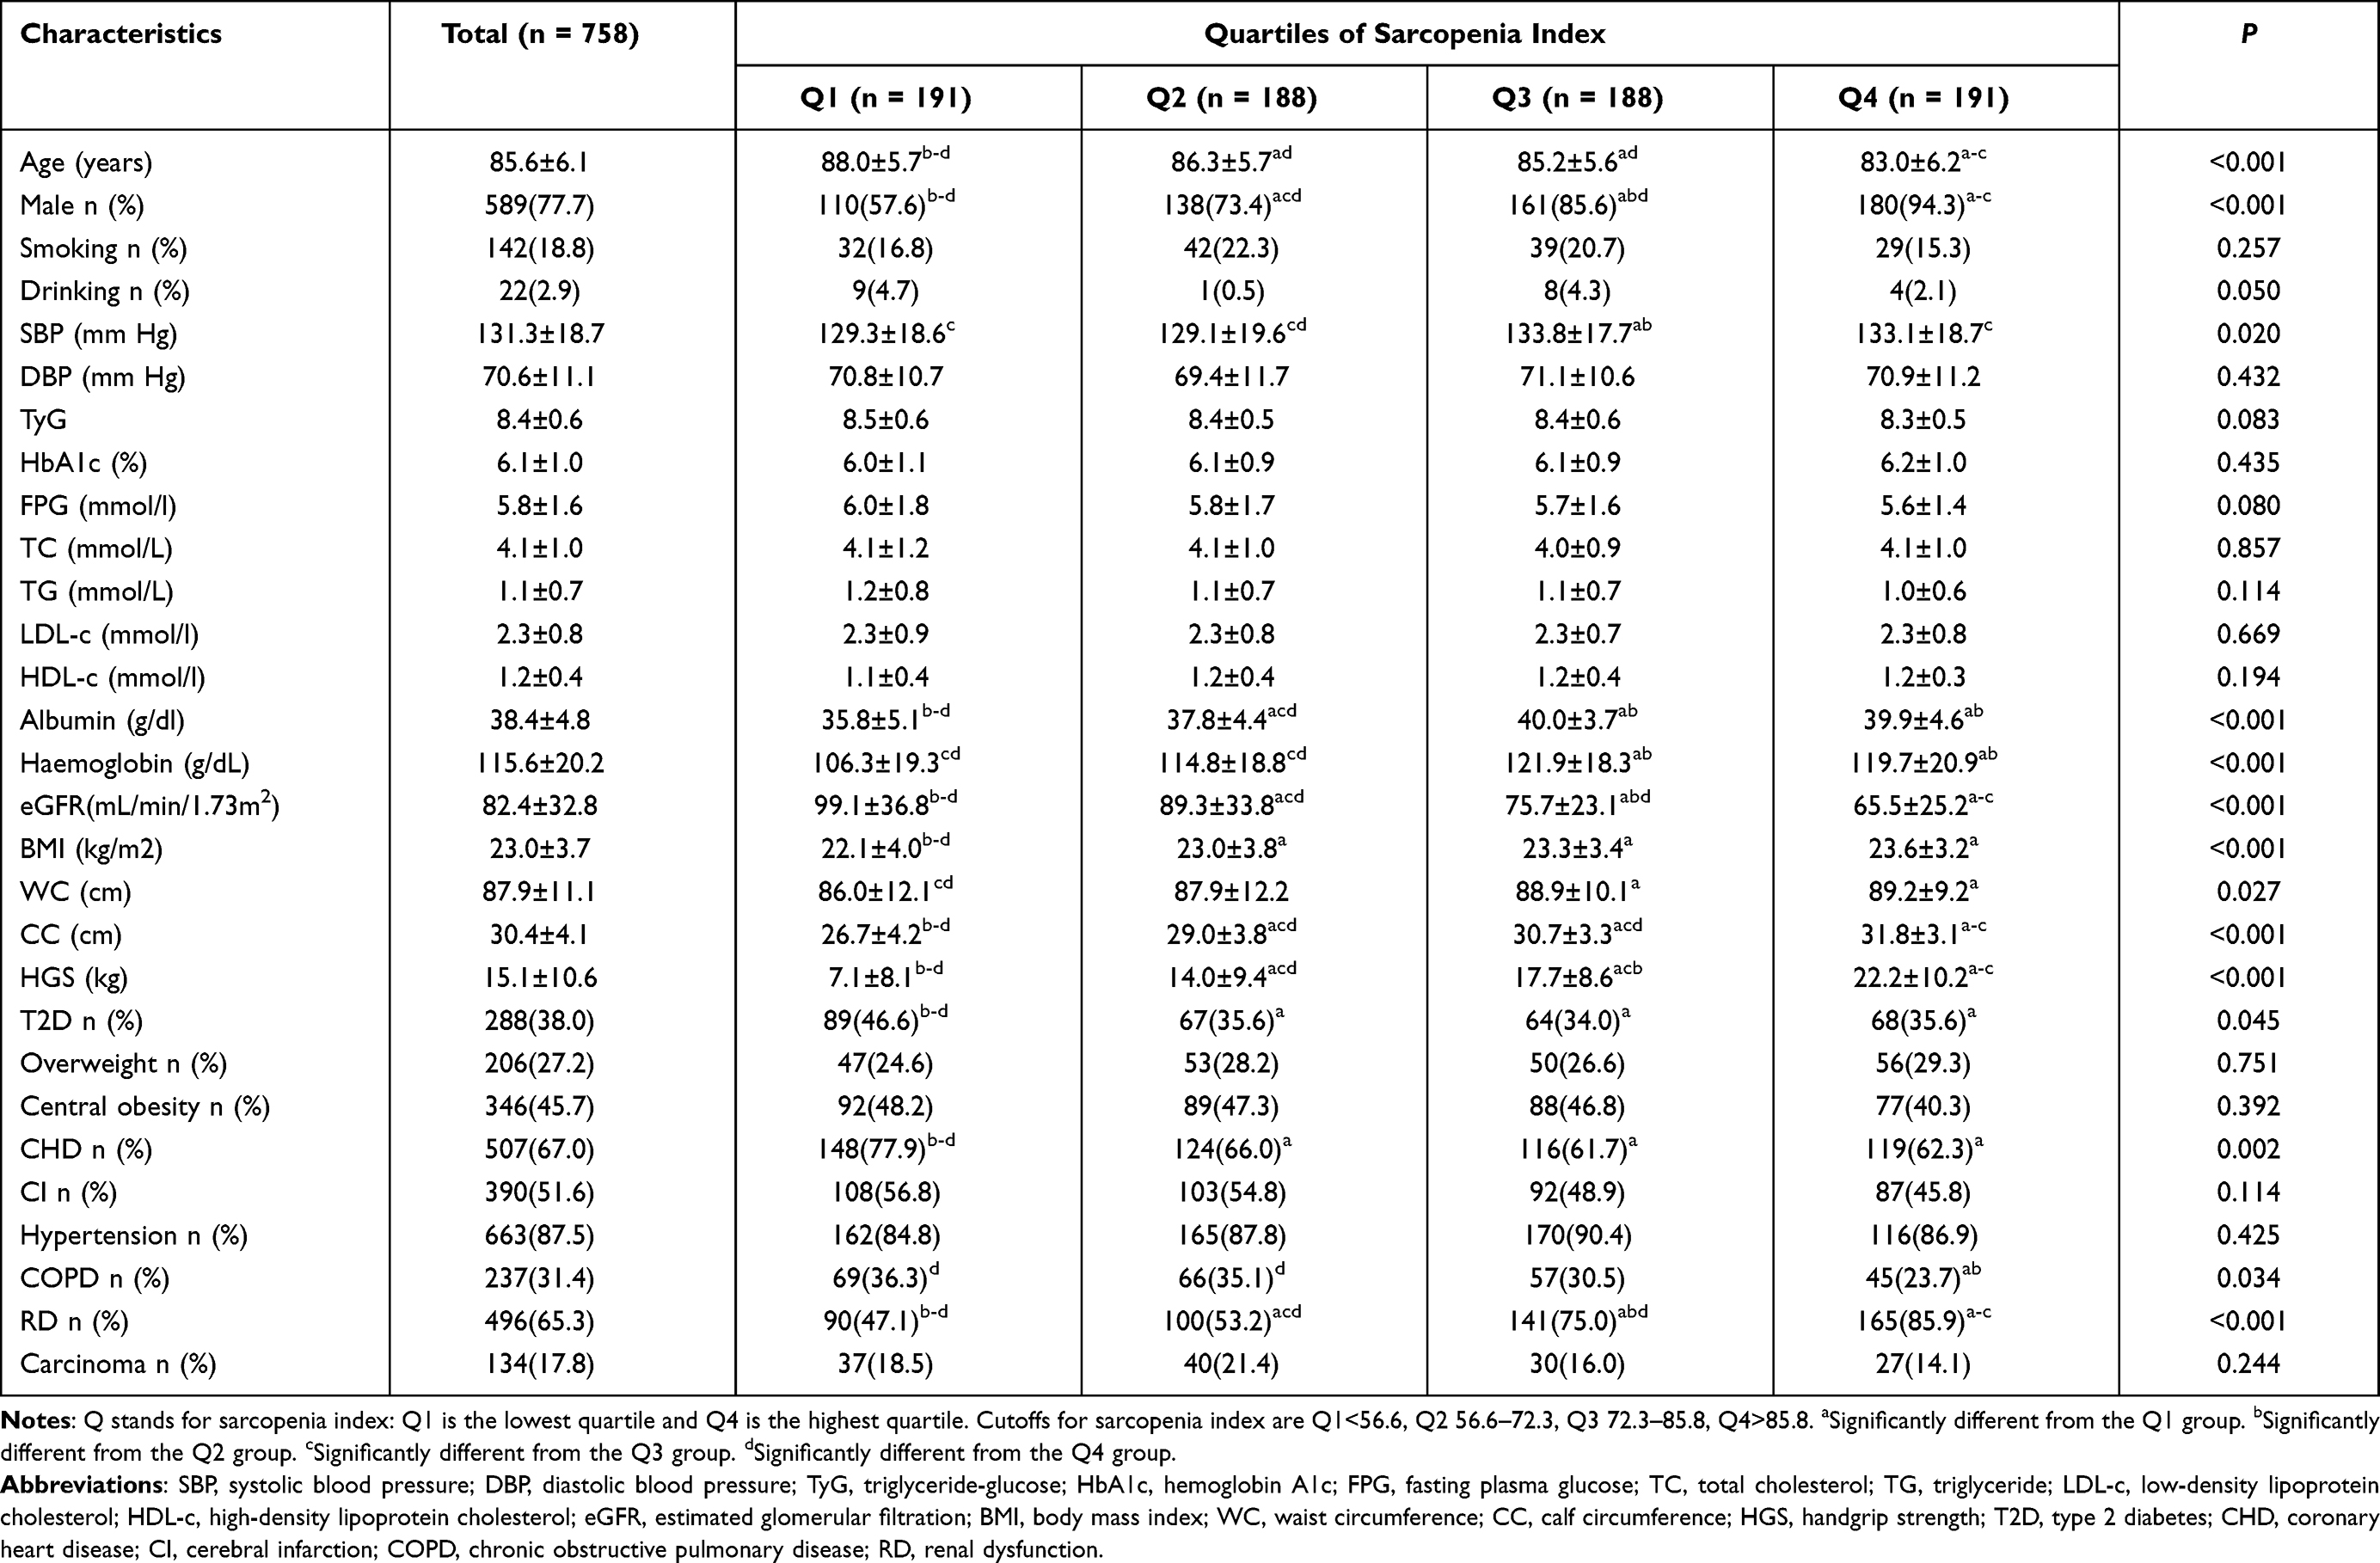 |
Table 1 Baseline Characteristics of Participants According to the Quartiles of Sarcopenia Index |
The Difference Prevalence of Mortality, Nutritional Risk/Malnutrition and Sarcopenia According to the Quartiles of SI
Mortality and the prevalence of nutritional risk/malnutrition and sarcopenia were showed in Figure 1A-C. During 1-year follow-up, a total of 112 participants (14.8%) died. The mortality according to the quartiles of the SI was 32.4%, 11.2%, 9.6% and 5.8% in the Q1, Q2, Q3, and Q4 groups, respectively (P for trend <0.001). The prevalence of nutritional risk/malnutrition and sarcopenia was all highest in the Q1 group (66.5% and 92.7%) and gradually decreased with the increase of SI (all P for trend <0.001).
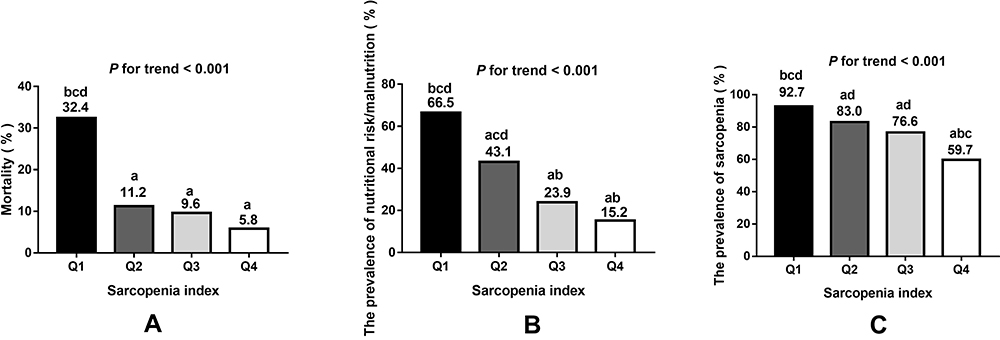 |
Figure 1 (A) The prevalence was 32.4%, 11.2%, 9.6% and 5.8% for mortality from the lowest to the highest sarcopenia index quartile, respectively (P for trend < 0.001). A significant decrease of mortality was observed in Q2, Q3 and Q4 group compared to the Q1 group. (B) The prevalence was 66.5%, 43.1%, 23.9% and 15.2% for nutritional risk/malnutrition from the lowest to the highest sarcopenia index quartile, respectively (P for trend < 0.001). A significant decrease of prevalence of nutritional risk/malnutrition was observed in Q2, Q3 and Q4 group compared to the Q1 group. A significant decrease of prevalence of nutritional risk/malnutrition was also observed in Q3 and Q4 group compared to the Q2 group. (C) The prevalence was 92.7%, 83.0%, 76.6% and 59.7% for sarcopenia from the lowest to the highest sarcopenia index quartile, respectively (P for trend < 0.001). A significant decrease of prevalence of sarcopenia was observed in Q2, Q3 and Q4 group compared to the Q1 group. A significant increase of prevalence of sarcopenia was observed in Q2 and Q3 compared to the Q4 group. Q stands for sarcopenia index: Q1 is the lowest quartile and Q4 is the highest quartile. Cutoffs for sarcopenia index are Q1<56.6, Q2 56.6–72.3, Q3 72.3–85.8, Q4>85.8. aSignificantly different from the Q1 group. bSignificantly different from the Q2 group. cSignificantly different from the Q3 group. dSignificantly different from the Q4 group. |
Correlation Risk Factors with Sarcopenia Index
The high SI was positively correlated with HDL-c (r=0.10, P=0.014), albumin (r=0.32, P<0.001), hemoglobin (r=0.24, P <0.001), BMI (r=0.12, P=0.001), WC (r=0.08, P=0.046), CC (r=0.45, P<0.001) and HGS (r=0.52, P <0.001) (Table 2). The high SI was negatively correlated with age (r=−0.30, P<0.001), male (r=−0.31, P<0.001), FPG (r=−0.11, P=0.005), TG (r=−0.09, P=0.020) and TyG (r=−0.11, P=0.007) (Table 2).
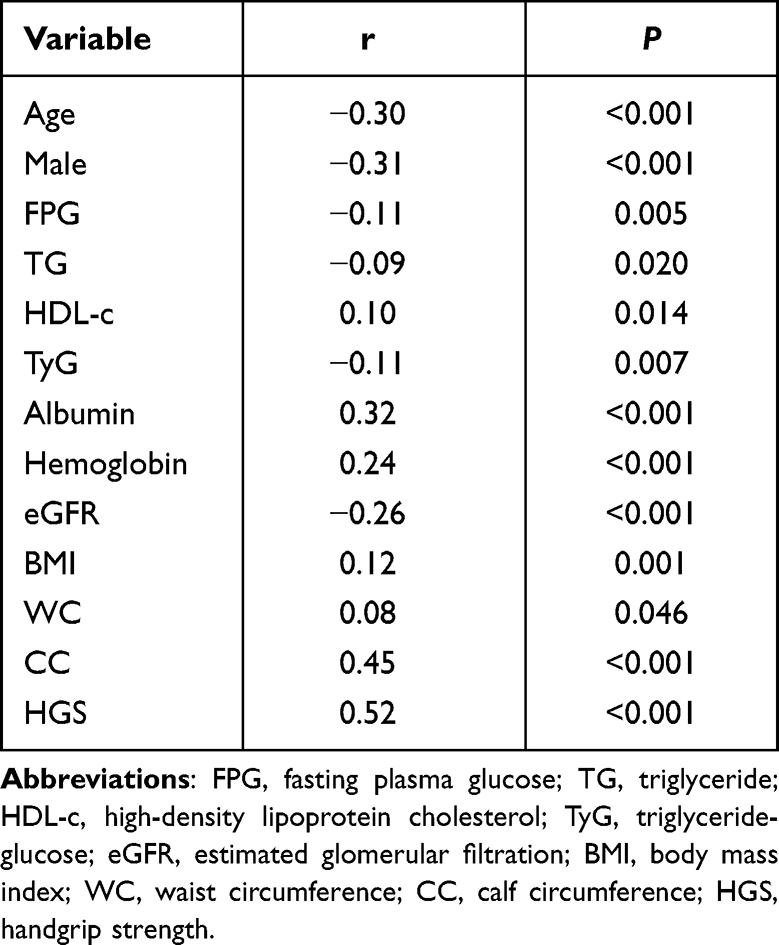 |
Table 2 Correlation Risk Factors with Sarcopenia Index |
Association Between the SI and 1-Year All-Cause Mortality
When the SI was treated as a continuous variable (per 1-SD), a higher SI was independently associated with a lower risk of 1-year all-cause mortality after adjusting for potential confounders (HR per 1-SD= 0.61, 95% CI: 0.47–0.79) (Table 3).
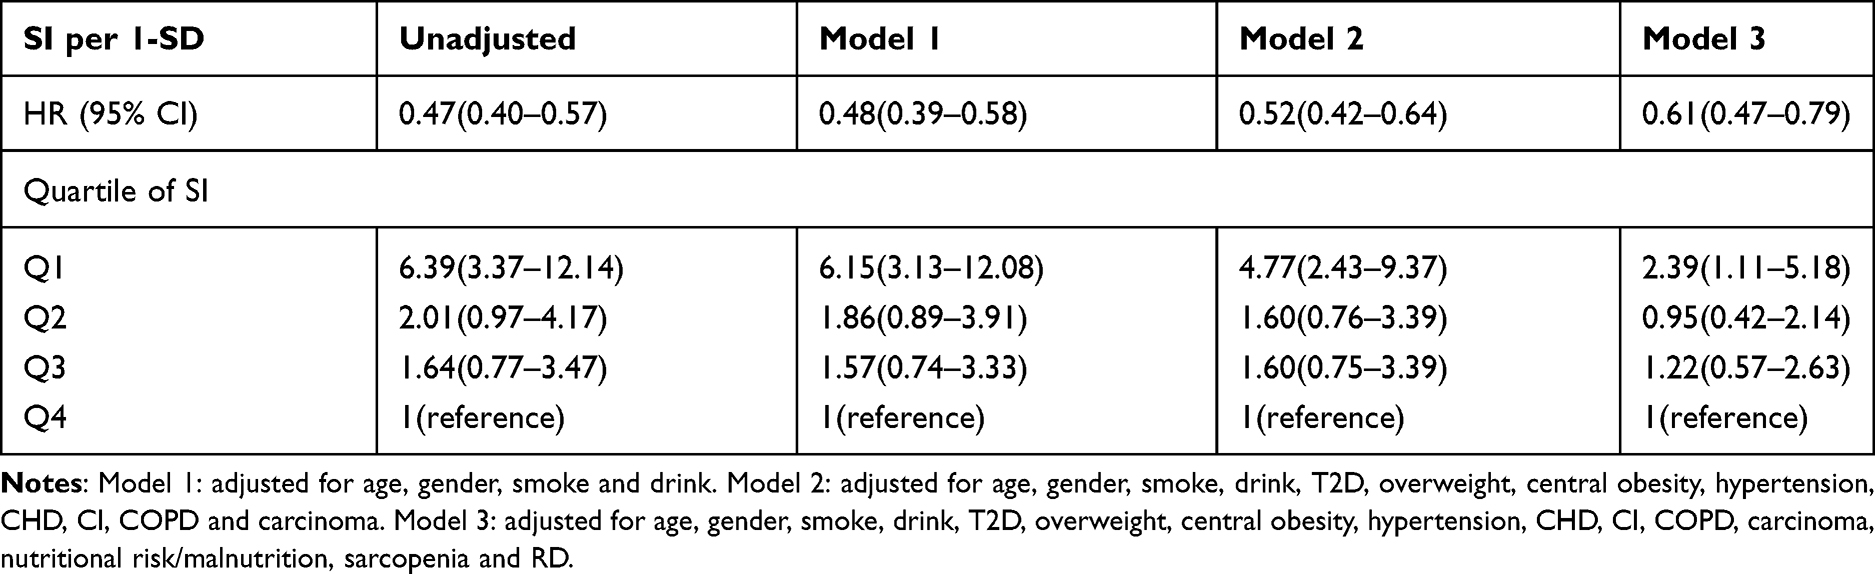 |
Table 3 Association Between Sarcopenia Index and Mortality (1-Year Follow-Up) According to Cox Regression Models Adjusted for Potential Confounders |
We also evaluated the association between different quartiles of SI and 1-year all-cause mortality. After adjusting for potential confounders, the Q1 group was associated with 1-year all-cause mortality (HR=2.39, 95% CI: 1.11–5.18) when using the Q4 group as the reference. The Q2 and Q3 groups were not significantly associated with 1 year all-cause mortality (HR= 0.95, 95% CI: 0.42–2.14 and HR=1.22, 95% CI: 0.57–2.63) (Table 3).
Figure 2 shows the survival curves of the participants in different quartile groups according to the SI. The Log rank test indicated that the survival curves of the participants in different quartile groups were significantly different (P<0.001).
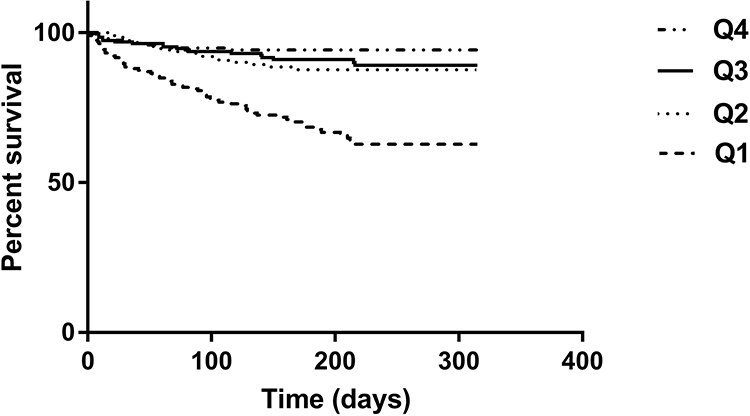 |
Figure 2 Survival curves of the study population according to the quartiles of sarcopenia index. Log rank test χ2 = 68.47, P < 0.001. |
Association Between the SI and Nutritional Risk/Malnutrition
When the SI was treated as a continuous variable (per 1-SD), a higher SI was independently associated with a lower risk of nutritional risk/malnutrition after adjusting for potential confounders (OR per 1-SD= 0.38, 95% CI: 0.29–0.49) (Table 4).
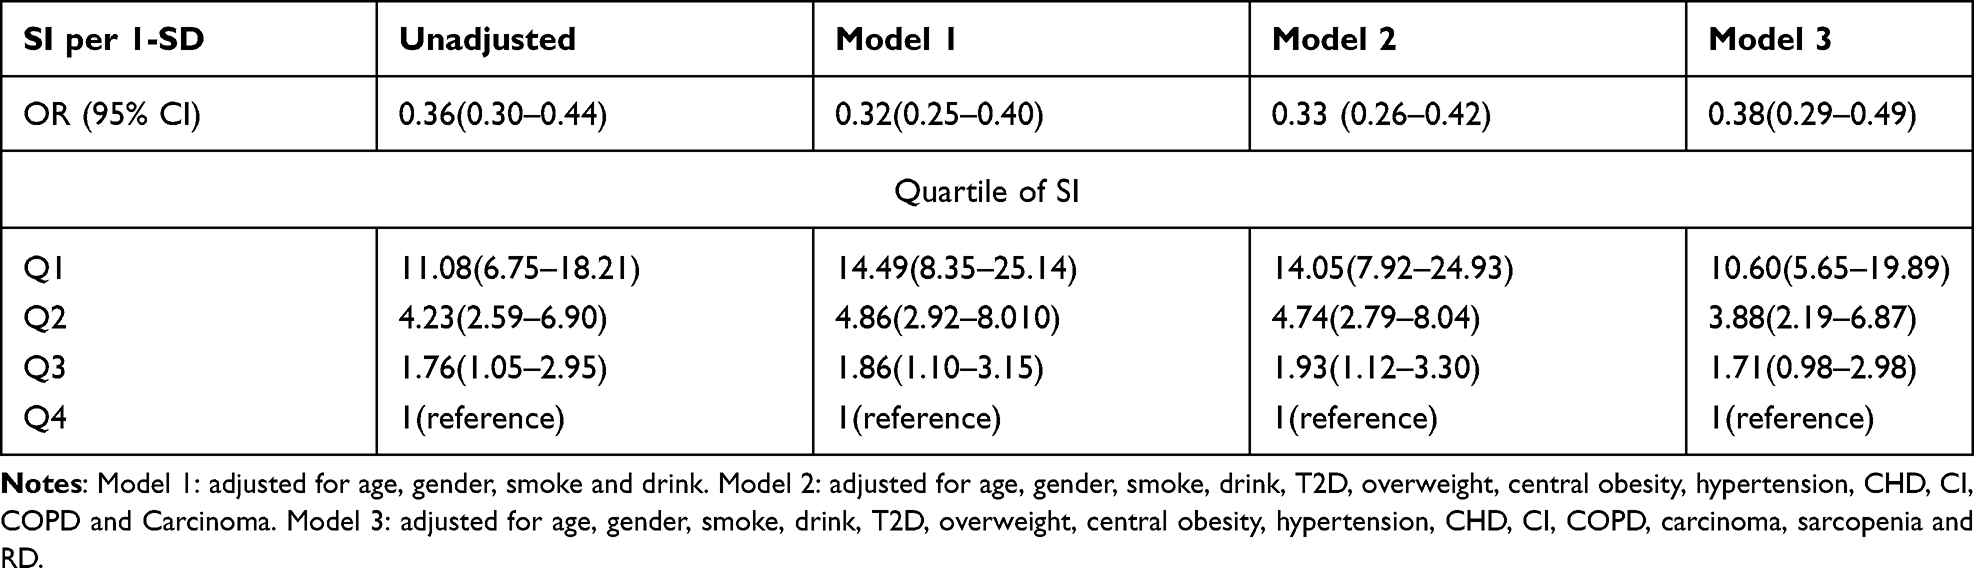 |
Table 4 Association Between Sarcopenia Index and Nutritional Risk/Malnutrition According to Logistic Regression Models Adjusted for Potential Confounders |
We also evaluated the association between different quartiles of SI and nutritional risk/malnutrition. After adjusting for potential confounders, the Q1 and Q2 groups were all associated with nutritional risk/malnutrition (OR=10.60, 95% CI: 5.65–19.89; OR=3.88, 95% CI: 2.19–6.87) when using the Q4 group as the reference. However, Q3 group was not significantly associated with nutritional risk/malnutrition (OR=1.71, 95% CI: 0.98–2.98) (Table 4).
Association Between the SI and Sarcopenia
When the SI was treated as a continuous variable (per 1-SD), a higher SI was independently associated with a lower risk of sarcopenia after adjusting for potential confounders (OR per 1-SD=0.58, 95% CI: 0.45–0.74) (Table 5).
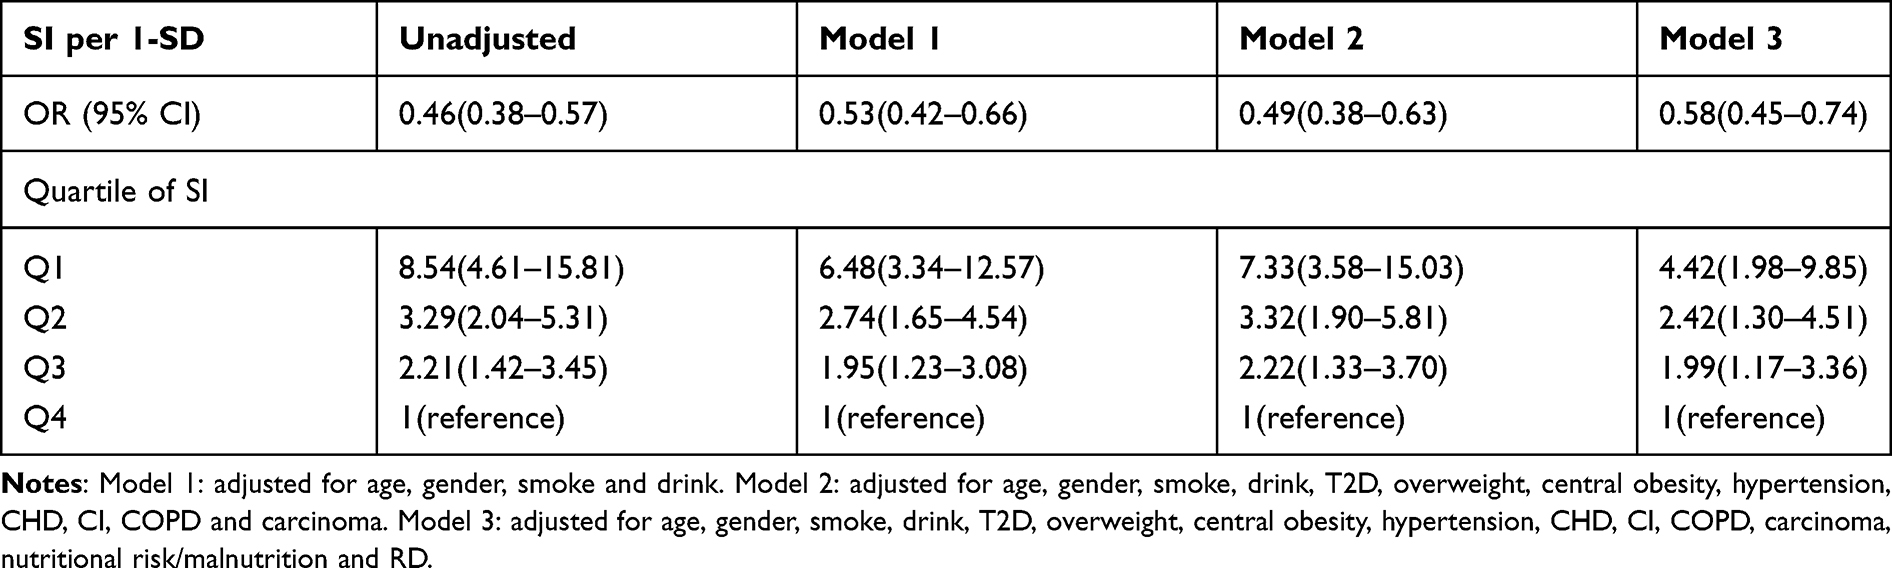 |
Table 5 Association Between Sarcopenia Index and Sarcopenia According to Logistic Regression Models Adjusted for Potential Confounders |
We also evaluated the association between different quartiles of SI and sarcopenia. After adjusting for potential confounders, the Q1, Q2 and Q3 groups were all associated with sarcopenia (OR=4.42, 95% CI: 1.98–9.85; OR=2.42, 95% CI: 1.30–4.51; OR=1.99, 95% CI: 1.17–3.36) when using the Q4 group as the reference (Table 5).
Discussion
Due to the defects of current diagnostic methods for sarcopenia, SI is an attractive method to verify a specific biomarker as an alternative marker for sarcopenia.25 As a new member of this field, SI has low cost, high accessibility and repeatability.26 Therefore, SI was studied in different populations such as cancer21,27 chronic liver diseases,28 severe patients,29 peritoneal dialysis patients,30 older people with normal kidney function31 and so on. However, in this follow-up study of 758 hospitalized participants, we firstly demonstrated the association between the SI and mortality, nutritional risk/malnutrition and sarcopenia in the elderly including the patients with RD.
Only few previous studies addressed the association between the SI and mortality. In two retrospective studies conducted in adult ICU patients, a lower SI was associated with a significantly higher risk of mortality among adult ICU patients.17,18 Another study demonstrated that the SI was associated with long-term mortality among hospitalized older patients in a normal kidney function population19. Therefore, more prospective studies are needed before strong conclusions can be drawn. Our finding was in line with these findings according to multivariate Cox proportional-hazard models after adjusting for potential confounders.
Our study confirmed that the SI was positively correlated with nutritional status indexes such as albumin, hemoglobin, BMI and WC. More importantly, our study confirmed that the SI could predict nutritional risk/malnutrition in older patients after adjusting for potential confounders for the first time.
Sarcopenia and nutritional risk/malnutrition often occur in the elderly. A study showed that the SI might not serve as biomarkers of either low muscle mass or sarcopenia in urban community-dwelling older people with normal kidney function.31 However, we showed that the SI was positively correlated with indexes of muscle mass and muscle strength such as CC and HGS. We also demonstrated that the SI could predict sarcopenia after adjusting for potential confounders including RD in the elderly. Therefore, the association between the SI and sarcopenia is still controversial. More prospective studies are needed to verify the value of SI in different populations.
Serum creatinine is mainly affected by physiological and clinical conditions that affect muscle quality.32 Cystatin C levels can provide a more useful estimate of renal function in patients with reduced muscle mass because it is free to filter glomerular low molecular weight protein with stable productivity.33 Because serum cystatin C values depend on glomerular filtration volume, they are not affected by early renal insufficiency, unlike creatinine. Low serum creatinine/cystatin C ratio was associated with low muscle mass in various conditions.33,34 These studies have proved that muscle markers are reliable. These results suggest that the creatinine/cystatin C ratio eliminates the effect of potential differences in renal function. Malnutrition is accompanied by loss of muscle mass and muscle function and exaggerates the observed loss of fat-free mass in elderly persons, reducing metabolic reserve and insulin sensitivity.35 TyG is a new and reliable surrogate marker of insulin resistant and is calculated using TG and FPG,36 which was related of the SI in our study. In patients with low muscle mass, decreased numbers of muscle cells and decrease endocrine function could contribute to poor clinical results.37,38 Some factors including preexisting chronic comorbidities, sarcopenia, nutritional risk/malnutrition explain why the mortality is highest in Q1 group in our study.
This study had some strengths. First, all patients had well compliance and they were average of 85 years, who are usually excluded from many studies. Second, this study included a large sample which could better reflect the status of elderly patients than previous studies. Finally, we recorded the patient’s diseases in detail.
This study also had some limitations. First, the definition of sarcopenia is weak. Gold standard of sarcopenia is psoas area muscle measurement by CT or MRI. Correlation between Psoas muscle area and SI would be ideal. We did not design physical performance tests in the beginning of the study because of patients’ age and inconvenient movement. Second, when any disease was found, all patients were intervened. We did not include the effects of drugs or other interventions in the study. Therefore, in order to decrease the effects of interventions, we followed up about 1 year. Third, due to the low proportion of female subjects in this study, we were unable to estimate the potential gender impact. Finally, this is a single-centre study of inpatients in geriatric wards. All the participants in the study were Chinese so that the results may not be applicable to other ethnic groups.
Conclusion
The SI based on serum cystatin C and creatinine is associated with long-term mortality, nutritional risk/malnutrition and sarcopenia in a study population of hospitalized older Chinese patients. The SI helps us identify people who are at a high risk of adverse outcomes. Future studies should be conducted to prospectively validate the SI and explore clinical applications for nutrition and sarcopenia therapy.
Ethics Approval and Informed Consent
The study was approved by the Ethics Committee of the Shanghai Jiaotong University Affiliated Sixth People’s Hospital [approval number, 2016-141-(1)]. Written informed consent was obtained from all participants and in accordance with the principle of the Helsinki Declaration. Written informed consent was obtained from each participant.
Acknowledgments
We thank all the teams involved in the development and implementation of the study: Yingying Ke, Jun Xu, Yue Zhang, Zhen Zhang, Yunxia Zhu and Xingliang Zhang.
Funding
This project was not funded by any organization.
Disclosure
The authors declare that they have no conflicts of interest for this work.
References
1. Corish CA, Bardon LA. Malnutrition in older adults: screening and determinants. Proc Nutr Soc. 2019;78(3):372–379. doi:10.1017/S0029665118002628
2. Ligthart-Melis GC, Luiking YC, Kakourou A, et al. Frailty, Sarcopenia, and Malnutrition Frequently (Co-)occur in Hospitalized Older Adults: a Systematic Review and Meta-analysis. J Am Med Dir Assoc. 2020;21(9):1216–1228. doi:10.1016/j.jamda.2020.03.006
3. Sánchez-Rodríguez D, Marco E, Schott AM, et al. Malnutrition according to ESPEN definition predicts long-term mortality in general older population: findings from the EPIDOS study-Toulouse cohort. Clin Nutr. 2019;38(6):2652–2658. doi:10.1016/j.clnu.2018.11.016
4. Lera L, Angel B, Marquez C, Saguez R, Albala C. Besides Sarcopenia, Pre-Sarcopenia Also Predicts All-Cause Mortality in Older Chileans. Clin Interv Aging. 2021;16:611–619. doi:10.2147/CIA.S289769
5. Cruz-Jentoft AJ, Sayer AA. Sarcopenia. Lancet. 2019;393(10191):2636–2646. doi:10.1016/S0140-6736(19)31138-9
6. Granic A, Mendonça N, Hill TR, et al. Nutrition in the Very Old. Nutrients. 2018;10(3):269. doi:10.3390/nu10030269
7. Pierik VD, Meskers CGM, Van Ancum JM, et al. High risk of malnutrition is associated with low muscle mass in older hospitalized patients - a prospective cohort study. BMC Geriatr. 2017;17(1):118. doi:10.1186/s12877-017-0505-5
8. Goisser S, Schrader E, Singler K, et al. Malnutrition According to Mini Nutritional Assessment Is Associated With Severe Functional Impairment in Geriatric Patients Before and up to 6 Months After Hip Fracture. J Am Med Dir Assoc. 2015;16(8):661–667. doi:10.1016/j.jamda.2015.03.002
9. Jiang S, Li P. Current Development in Elderly Comprehensive Assessment and Research Methods. Biomed Res Int. 2016;2016:3528248. doi:10.1155/2016/3528248
10. Kondrup J, Allison SP, Elia M, et al. ESPEN guidelines for nutrition screening 2002. Clin Nutr. 2003;22(4):415–421. doi:10.1016/s0261-5614(03)00098-0
11. de Hoogt PA, Reisinger KW, Tegels JJW, et al. Functional Compromise Cohort Study (FCCS): sarcopenia is a Strong Predictor of Mortality in the Intensive Care Unit. World J Surg. 2018;42(6):1733–1741. doi:10.1007/s00268-017-4386-8
12. Anker SD, Morley JE, von Haehling S. Welcome to the ICD-10 code for sarcopenia. J Cachexia Sarcopenia Muscle. 2016;7(5):512–514. doi:10.1002/jcsm.12147
13. Burton LA, Sumukadas D. Optimal management of sarcopenia. Clin Interv Aging. 2010;5:217–228. doi:10.2147/cia.s11473
14. Song DK, Hong YS, Sung YA, Lee H. Association of serum creatinine levels and risk of type 2 diabetes mellitus in Korea: a case control study. BMC Endocr Disord. 2022;22(1):4. doi:10.1186/s12902-021-00915-2
15. Udy AA, Scheinkestel C, Pilcher D, et al. The Association Between Low Admission Peak Plasma Creatinine Concentration and In-Hospital Mortality in Patients Admitted to Intensive Care in Australia and New Zealand. Crit Care Med. 2016;44(1):73–82. doi:10.1097/CCM.0000000000001348
16. Filler G, Bökenkamp A, Hofmann W, Le Bricon T, Martínez-Brú C, Grubb A. Cystatin C as a marker of GFR–history, indications, and future research. Clin Biochem. 2005;38(1):1–8. doi:10.1016/j.clinbiochem.2004.09.025
17. Kashani KB, Frazee EN, Kukrálová L, et al. Evaluating Muscle Mass by Using Markers of Kidney Function: development of the Sarcopenia Index. Crit Care Med. 2017;45(1):e23–e29. doi:10.1097/CCM.0000000000002013
18. Barreto EF, Kanderi T, DiCecco SR, et al. Sarcopenia Index Is a Simple Objective Screening Tool for Malnutrition in the Critically Ill. JPEN J Parenter Enteral Nutr. 2019;43(6):780–788. doi:10.1002/jpen.1492
19. Tang T, Zhuo Y, Xie L, et al. Sarcopenia index based on serum creatinine and cystatin C is associated with 3-year mortality in hospitalized older patients. Sci Rep. 2020;10(1):1260. doi:10.1038/s41598-020-58304-z
20. Romeo FJ, Chiabrando JG, Seropian IM, et al. Sarcopenia index as a predictor of clinical outcomes in older patients undergoing transcatheter aortic valve replacement. Catheter Cardiovasc Interv. 2021;98(6):E889–E896. doi:10.1002/ccd.29799
21. Chen X, Hou L, Shen Y, et al. The Role of Baseline Sarcopenia Index in Predicting Chemotherapy-Induced Undesirable Effects and Mortality in Older People with Stage III or IV Non-Small Cell Lung Cancer. J Nutr Health Aging. 2021;25(7):878–882. doi:10.1007/s12603-021-1633-3
22. Omotoso AB, Kolo PM, Olanrewaju TO, et al. Relationship between retinopathy and renal abnormalities in black hypertensive patients. Clin Hypertens. 2016;22:19. doi:10.1186/s40885-016-0053-x
23. Cederholm T, Bosaeus I, Barazzoni R, et al. Diagnostic criteria for malnutrition - An ESPEN Consensus Statement. Clin Nutr. 2015;34(3):335–340. doi:10.1016/j.clnu.2015.03.001
24. Chen LK, Woo J, Assantachai P, et al. Asian Working Group for Sarcopenia: 2019 Consensus Update on Sarcopenia Diagnosis and Treatment. J Am Med Dir Assoc. 2020;21(3):300–307.e2. doi:10.1016/j.jamda.2019.12.012
25. Curcio F, Ferro G, Basile C, et al. Biomarkers in sarcopenia: a multifactorial approach. Exp Gerontol. 2016;85:1–8. doi:10.1016/j.exger.2016.09.007
26. Patel SS, Molnar MZ, Tayek JA, et al. Serum creatinine as a marker of muscle mass in chronic kidney disease: results of a cross-sectional study and review of literature. J Cachexia Sarcopenia Muscle. 2013;4(1):19–29. doi:10.1007/s13539-012-0079-1
27. Fu X, Tian Z, Wen S, et al. A new index based on serum creatinine and cystatin C is useful for assessing sarcopenia in patients with advanced cancer. Nutrition. 2021;82:111032. doi:10.1016/j.nut.2020.111032
28. Ichikawa T, Miyaaki H, Miuma S, et al. Calculated body muscle mass as a useful screening marker for low skeletal muscle mass and sarcopenia in chronic liver disease. Hepatol Res. 2020;50(6):704–714. doi:10.1111/hepr.13492
29. Lopez-Ruiz A, Kashani K. Assessment of muscle mass in critically ill patients: role of the sarcopenia index and images studies. Curr Opin Clin Nutr Metab Care. 2020;23(5):302–311. doi:10.1097/MCO.0000000000000673
30. Do JY, Kang SH. Association Between Peritonitis and Low Muscle Mass in Peritoneal Dialysis Patients. J Ren Nutr. 2020;30(4):341–346. doi:10.1053/j.jrn.2019.09.003
31. He Q, Jiang J, Xie L, Zhang L, Yang M. A sarcopenia index based on serum creatinine and cystatin C cannot accurately detect either low muscle mass or sarcopenia in urban community-dwelling older people. Sci Rep. 2018;8(1):11534. doi:10.1038/s41598-018-29808-6
32. Stevens LA, Schmid CH, Greene T, et al. Factors other than glomerular filtration rate affect serum cystatin C levels. Kidney Int. 2009;75(6):652–660. doi:10.1038/ki.2008.638
33. Lee HS, Park KW, Kang J, et al. Sarcopenia Index as a Predictor of Clinical Outcomes in Older Patients with Coronary Artery Disease. J Clin Med. 2020;9(10):3121. doi:10.3390/jcm9103121
34. Kashani K, Sarvottam K, Pereira NL, et al. The sarcopenia index: a novel measure of muscle mass in lung transplant candidates. Clin Transplant. 2018;32(3):e13182. doi:10.1111/ctr.13182
35. Raslan M, Gonzalez MC, Dias MC, et al. Comparison of nutritional risk screening tools for predicting clinical outcomes in hospitalized patients. Nutrition. 2010;26(7–8):721–726. doi:10.1016/j.nut.2009.07.010
36. Park K, Ahn CW, Lee SB, et al. Elevated TyG Index Predicts Progression of Coronary Artery Calcification. Diabetes Care. 2019;42(8):1569–1573. doi:10.2337/dc18-1920
37. Cesari M, Nobili A, Vitale G. Frailty and sarcopenia: from theory to clinical implementation and public health relevance. Eur J Intern Med. 2016;35:1–9. doi:10.1016/j.ejim.2016.07.021
38. Febbraio MA. Muscles, exercise and obesity: skeletal muscle as a secretory organ. Nat Rev Endocrinol. 2012;8(8):457–465. doi:10.1038/nrendo.2012.49
 © 2022 The Author(s). This work is published and licensed by Dove Medical Press Limited. The
full terms of this license are available at https://www.dovepress.com/terms
and incorporate the Creative Commons Attribution
- Non Commercial (unported, 3.0) License.
By accessing the work you hereby accept the Terms. Non-commercial uses of the work are permitted
without any further permission from Dove Medical Press Limited, provided the work is properly
attributed. For permission for commercial use of this work, please see paragraphs 4.2 and 5 of our Terms.
© 2022 The Author(s). This work is published and licensed by Dove Medical Press Limited. The
full terms of this license are available at https://www.dovepress.com/terms
and incorporate the Creative Commons Attribution
- Non Commercial (unported, 3.0) License.
By accessing the work you hereby accept the Terms. Non-commercial uses of the work are permitted
without any further permission from Dove Medical Press Limited, provided the work is properly
attributed. For permission for commercial use of this work, please see paragraphs 4.2 and 5 of our Terms.